


 , Qinglin Li 3, Qibiao Wu 1,*
 , Jing Zhuang 4,*
1 Faculty of Chinese Medicine, Macau University of Science and Technology, 999078 Macau, China
2 Department of Neurosurgery, Zhejiang Cancer Hospital, 310000 Hangzhou, Zhejiang, China
3 Department of Scientific Research, Zhejiang Cancer Hospital, 310000 Hangzhou, Zhejiang, China
4 Department of Oncology, Weifang Traditional Chinese Hospital, 261000 Weifang, Shandong, China
†These authors contributed equally.
Abstract
Glioblastoma (GBM) is an exceptionally aggressive type of brain tumor with a poor prognosis, underscoring the urgent need to identify new molecular targets for therapeutic development. The objective of this research is to clarify the molecular interactions affected by the oncometabolite D-2-hydroxyglutarate (D-2-HG) within the framework of GBM.
Differential expression analysis of multi-omics data identified potential target genes linked to GBM pathogenesis. To enhance our understanding of the binding interactions between D-2-HG and the identified target proteins, we utilized an integrated methodology encompassing various machine learning algorithms, network pharmacology techniques, and molecular docking.
A sum of 135 genes was recognized as possible targets through which D-2-HG exerts its effects in GBM. The ensuing analysis, utilizing machine learning techniques, identified six crucial genes [eukaryotic translation initiation factor 4E binding protein 1 (EIF4EBP1), fatty acid binding protein 3 (FABP3), potassium voltage-gated channel subfamily Q member 2 (KCNQ2), epithelial cell adhesion molecule (EPCAM), sphingosine-1-phosphate receptor 5 (S1PR5), and metabotropic glutamate receptor 3 (GRM3)] as key regulators. Among these, FABP3, KCNQ2, EPCAM, S1PR5, and GRM3 were significantly downregulated, whereas EIF4EBP1 was markedly upregulated (p < 0.05). Molecular docking simulations indicated a strong binding affinity of D-2-HG towards the target proteins.
Our study suggests that D-2-HG plays a significant role in the pathogenesis of GBM by modulating specific genes and signaling pathways. Utilizing machine learning techniques, we identified six essential regulatory genes, and further molecular docking simulations revealed a strong affinity of D-2-HG for these critical targets. Collectively, these results establish a substantial basis for future investigations into the mechanistic role of D-2-HG in GBM oncogenesis.
Keywords
- D-2-hydroxyglutarate (D-2-HG)
- glioblastoma (GBM)
- key genes
- machine learning
- molecular docking
Glioblastoma (GBM) represents the most prevalent and aggressive type of primary
malignant brain tumor found in adults. It is distinguished by its rapid growth,
resistance to standard treatment modalities, and poses a significant risk to both
the survival and quality of life of affected individuals [1]. Presently utilized
therapeutic strategies, such as surgical intervention, radiotherapy,
chemotherapy, and tumor-treating fields, demonstrate restricted effectiveness
owing to significant tumor heterogeneity and the presence of the blood-brain
barrier, which obstructs the delivery of pharmacological agents, while research
on the core molecular mechanisms driving GBM progression faces significant
challenges [2, 3, 4]. In the past few years, there have been notable developments in
the field of molecular pathology, especially regarding the identification of
mutations in isocitrate dehydrogenase (IDH) and the associated
oncometabolite D-2-hydroxyglutarate (D-2-HG), have brought hope for elucidating
the core mechanisms underlying GBM pathogenesis and development [5, 6]. IDH plays
a vital role as an enzyme in the tricarboxylic acid (TCA) cycle, where it is
chiefly tasked with promoting the oxidative decarboxylation of isocitrate,
resulting in the formation of alpha-ketoglutarate (
The importance of the oncometabolite D-2-HG seems to be intricately nuanced and
may exhibit dual characteristics depending on the context [12]. A notable
clinical contradiction exists whereby gliomas harboring IDH mutations,
which are marked by the accumulation of D-2-HG, exhibit a considerably improved
prognosis. Specifically, the median overall survival for patients with these
mutations is reported to be 3.8 years, in contrast to just 1.1 years for those
with the wildtype variant. Furthermore, these IDH-mutant gliomas
demonstrate heightened responsiveness to temozolomide (TMZ) treatment [13]. At
the molecular level, studies suggest that D-2-HG can exert tumor-suppressive
effects in certain contexts, for instance, by downregulating the integrin subunit
beta 4 (ITGB4)/phosphatidylinositol 3-kinase (PI3K)/Akt serine/threonine kinase
(AKT) signaling axis, thereby inhibiting proliferation and promoting apoptosis.
This function contrasts sharply with its known oncogenic activity of inhibiting
Transcriptome datasets sourced from five GBM studies, namely GSE4290, GSE116520, GSE66354, GSE50161, and GSE108474, were obtained from the National Center for Biotechnology Information (NCBI, https://www.ncbi.nlm.nih.gov/) Gene Expression Omnibus (GEO) repository. The datasets GSE4290 and GSE116520 were classified as the discovery cohort, whereas the other three datasets (GSE66354, GSE50161, GSE108474) functioned as independent validation cohorts. To address potential batch effects, a comprehensive normalization pipeline was employed: the initial step involved the application of Surrogate Variable Analysis (SVA) utilizing the svaR package (version 3.46.0 1), aimed at modeling and correcting for latent confounding factors present within the discovery cohort [16]. Following this, ComBat harmonization was utilized within a parametric empirical Bayes framework to address and adjust for any remaining batch effects [17]. The effectiveness of the integrated data was assessed using principal component analysis (PCA), which demonstrated improved clustering of inter-batch samples within a lower-dimensional space, thus affirming the successful harmonization of the data. A detailed representation of the analytical workflow is illustrated in Fig. 1.
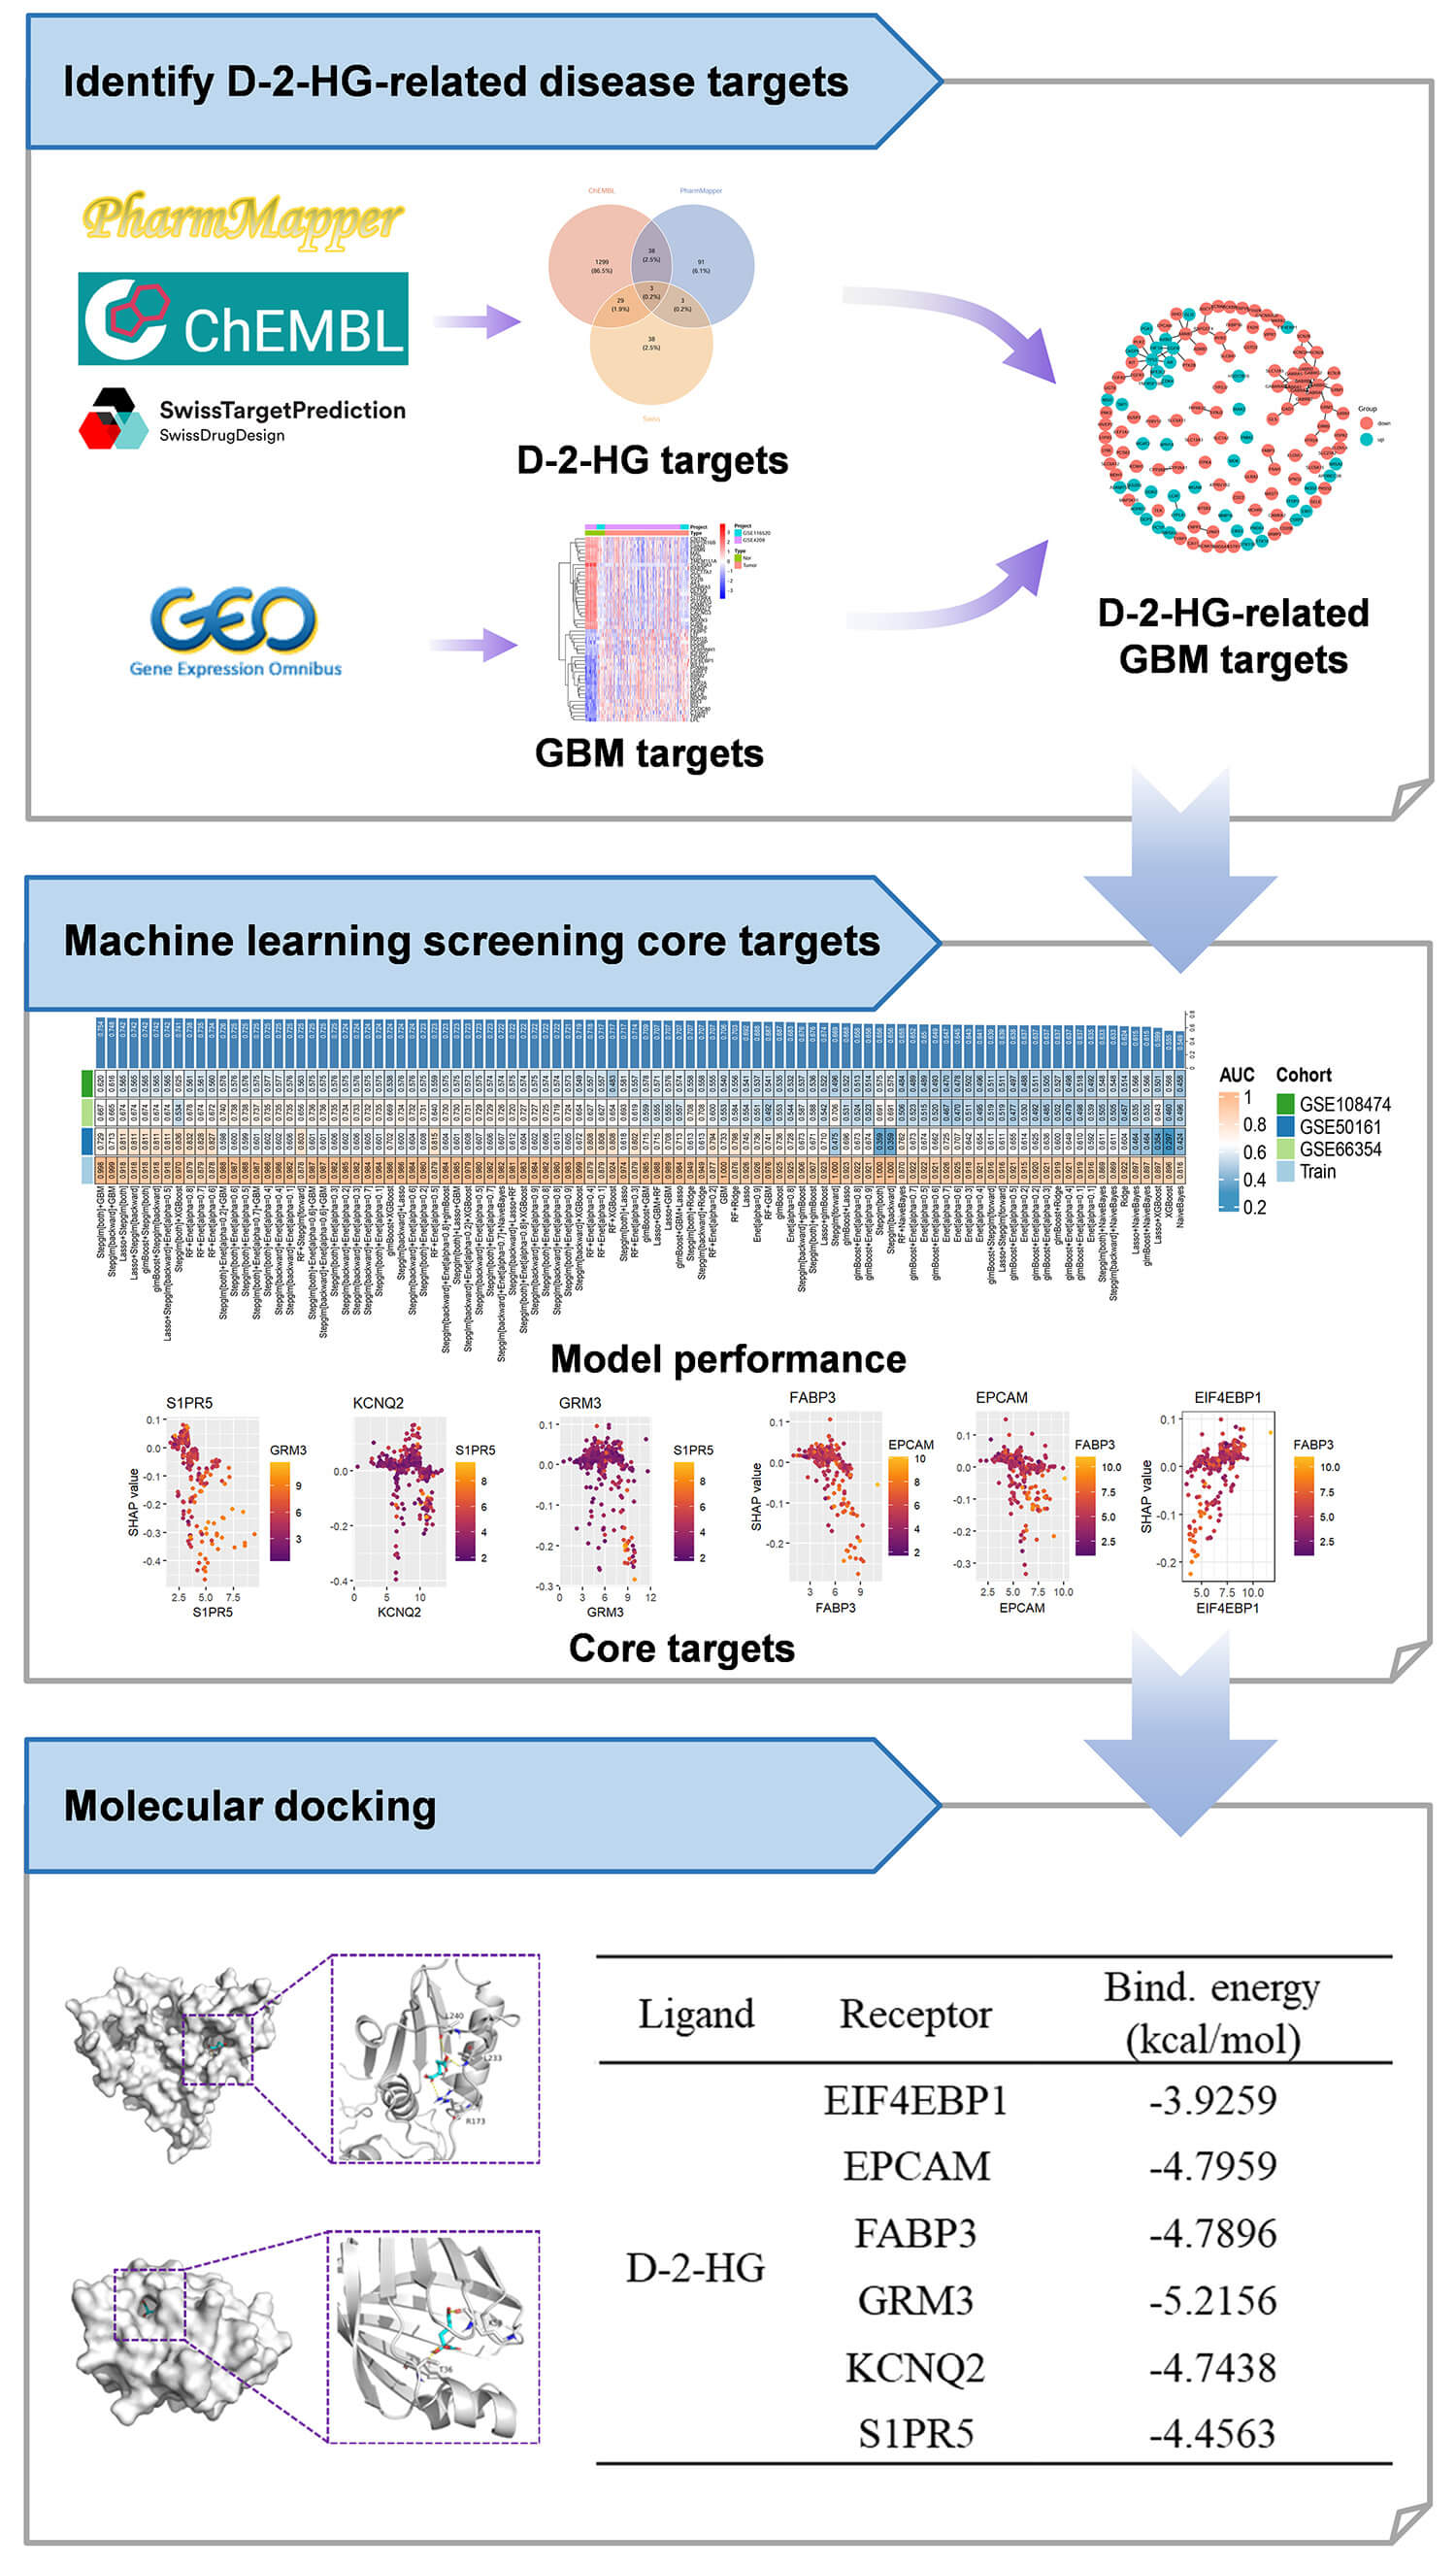 Fig. 1.
The analytical workflow employed for the datasets in the study. D-2-HG, D-2-hydroxyglutarate; GBM, glioblastoma; EIF4EBP1, eukaryotic translation initiation factor 4E binding protein 1; EPCAM, epithelial cell adhesion molecule; FABP3, fatty acid binding protein 3; GRM3, metabotropic glutamate receptor 3; KCNQ2, potassium voltage-gated channel subfamily Q member 2; S1PR5, sphingosine-1-phosphate receptor 5.
The chemical characterization of D-2-HG was achieved through the integration of information from multiple databases. The pertinent physicochemical characteristics and biological metrics were methodically gathered from PubMed, whereas the standard two-dimensional structural molecular formula (SMILES: C(CC(=O)O)C(C(=O)O)O) was sourced from the PubChem database. Target prediction for this molecule was conducted utilizing three specialized databases: the ChEMBL Database, which was used for profiling ligand-receptor interactions; Swiss Target Prediction, applied for chemogenomics-based target identification (http://www.swisstargetprediction.ch); and Reverse Pharmacophore Mapping, executed via three-dimensional pharmacophore matching utilizing the Pharm Mapper platform (https://lilab-ecust.cn/pharmmapper/index.html). All identified targets were limited to the human proteome to maintain biological relevance.
The evaluation was conducted utilizing the limma package (version 3.62.2) within the R programming environment, which incorporates a linear modeling framework along with empirical Bayes moderation to analyze differential expression on a transcriptome-wide level. Genes were categorized as statistically significantly differentially expressed genes (DEGs) when they demonstrated a false discovery rate (FDR)-adjusted p-value of less than 0.05, in addition to an absolute log2 fold change greater than 0.585, which equates to a 1.5-fold change. The outcomes of the analysis, which included the distribution of DEGs, were illustrated through the ggplot2 visualization system, facilitating the creation of high-quality figures appropriate for publication, such as volcano plots.
The analysis pipeline included: sample quality control via hierarchical
clustering to remove outliers; establishing an ideal soft-thresholding power
guided by the principles of scale-free topology (R2
This involved taking the intersection of genes highlighted as significant through DEGs and WGCNA with the set of genes predicted to be targets of D-2-HG. The outcome of this targeted filtering was graphically summarized with a Venn diagram to delineate the overlapping gene set.
To investigate the involvement of D-2-HG in the development of GBM, Gene
Ontology (GO) analyses encompassing Biological Process (BP), Cellular Component
(CC), and Molecular Function (MF), along with Kyoto Encyclopedia of Genes and
Genomes (KEGG, https://www.kegg.jp/) pathway analyses, were conducted utilizing
the clusterProfiler package (version 4.16.0), with a significance threshold set
at p
We utilize machine learning-based analyses of topological and functional enrichment to identify key hub molecules within the network. This is subsequently complemented by molecular docking simulations to assess target binding affinity and the thermodynamics of interactions. Through this approach, we aim to clarify the complex regulatory network governed by D-2-HG [18], to develop a total of 98 predictive models. Hyperparameter optimization was conducted utilizing cross-validation techniques, and stratified sampling was employed to divide seven distinct datasets into training and internal validation subsets. The efficacy of the models was thoroughly evaluated using a range of metrics, among which was the area under the receiver operating characteristic (ROC) curve (AUC), overall accuracy, and the F1-score. Following this, a Stacking ensemble learning approach was implemented to amalgamate the predictions derived from the most effective individual models. Models demonstrating high confidence, defined as having an AUC greater than 0.7, were selected, and their associated feature genes were ranked based on their frequency to pinpoint potential core genes. Ultimately, the gene expression patterns were visualized utilizing the pheatmap package (version 1.0.13).
Given the inherently opaque nature of machine learning algorithms, we utilized the SHAP (SHapley Additive exPlanations) approach to assess the impact of specific features on the predicted results. This method determines a SHAP value for each feature, facilitating a clear understanding of its role in the predictions made by the model.
Computational validation of the binding interactions between the oncometabolite D-2-HG and the prioritized core genes was carried out through molecular docking simulations. The initial 3D coordinates of the D-2-HG ligand were acquired in Structure Data File (SDF) format from PubChem [19]. The three-dimensional structures of the corresponding target proteins were downloaded from the UniProt database. Critical pre-docking preparations included preprocessing the protein structures to remove crystallographic water molecules and define the protonation state by adding hydrogen atoms. The ligand structure was similarly subjected to geometry optimization using the Merck Molecular Force Field (MMFF) to ensure an energetically favorable conformation. For each target, the docking grid box was strategically centered on the predicted active site, with its size parameters meticulously adjusted to accommodate the ligand’s dimensions and allow for comprehensive exploration of potential binding poses [20]. All docking calculations were executed using the Molecular Operating Environment (MOE) software (MOE 2019.0102) suite (Montreal, Quebec, Canada). The output docking poses were subsequently imported into PyMOL for detailed structural analysis, visualization, and generation of publication-quality figures.
The molecular configuration of D-2-HG was obtained from the PubChem database, as illustrated in Fig. 2A. A comprehensive analysis to predict potential biological targets for D-2-HG was performed utilizing three complementary databases: ChEMBL, which catalogs annotated bioactive molecules, reverse pharmacophore mapping, additionally, Swiss Target Prediction is utilized, emphasizing ligand-centric target forecasting. Following the integration of the data and the removal of redundant entries, a unified collection comprising 1501 potential targets was created (Fig. 2B).
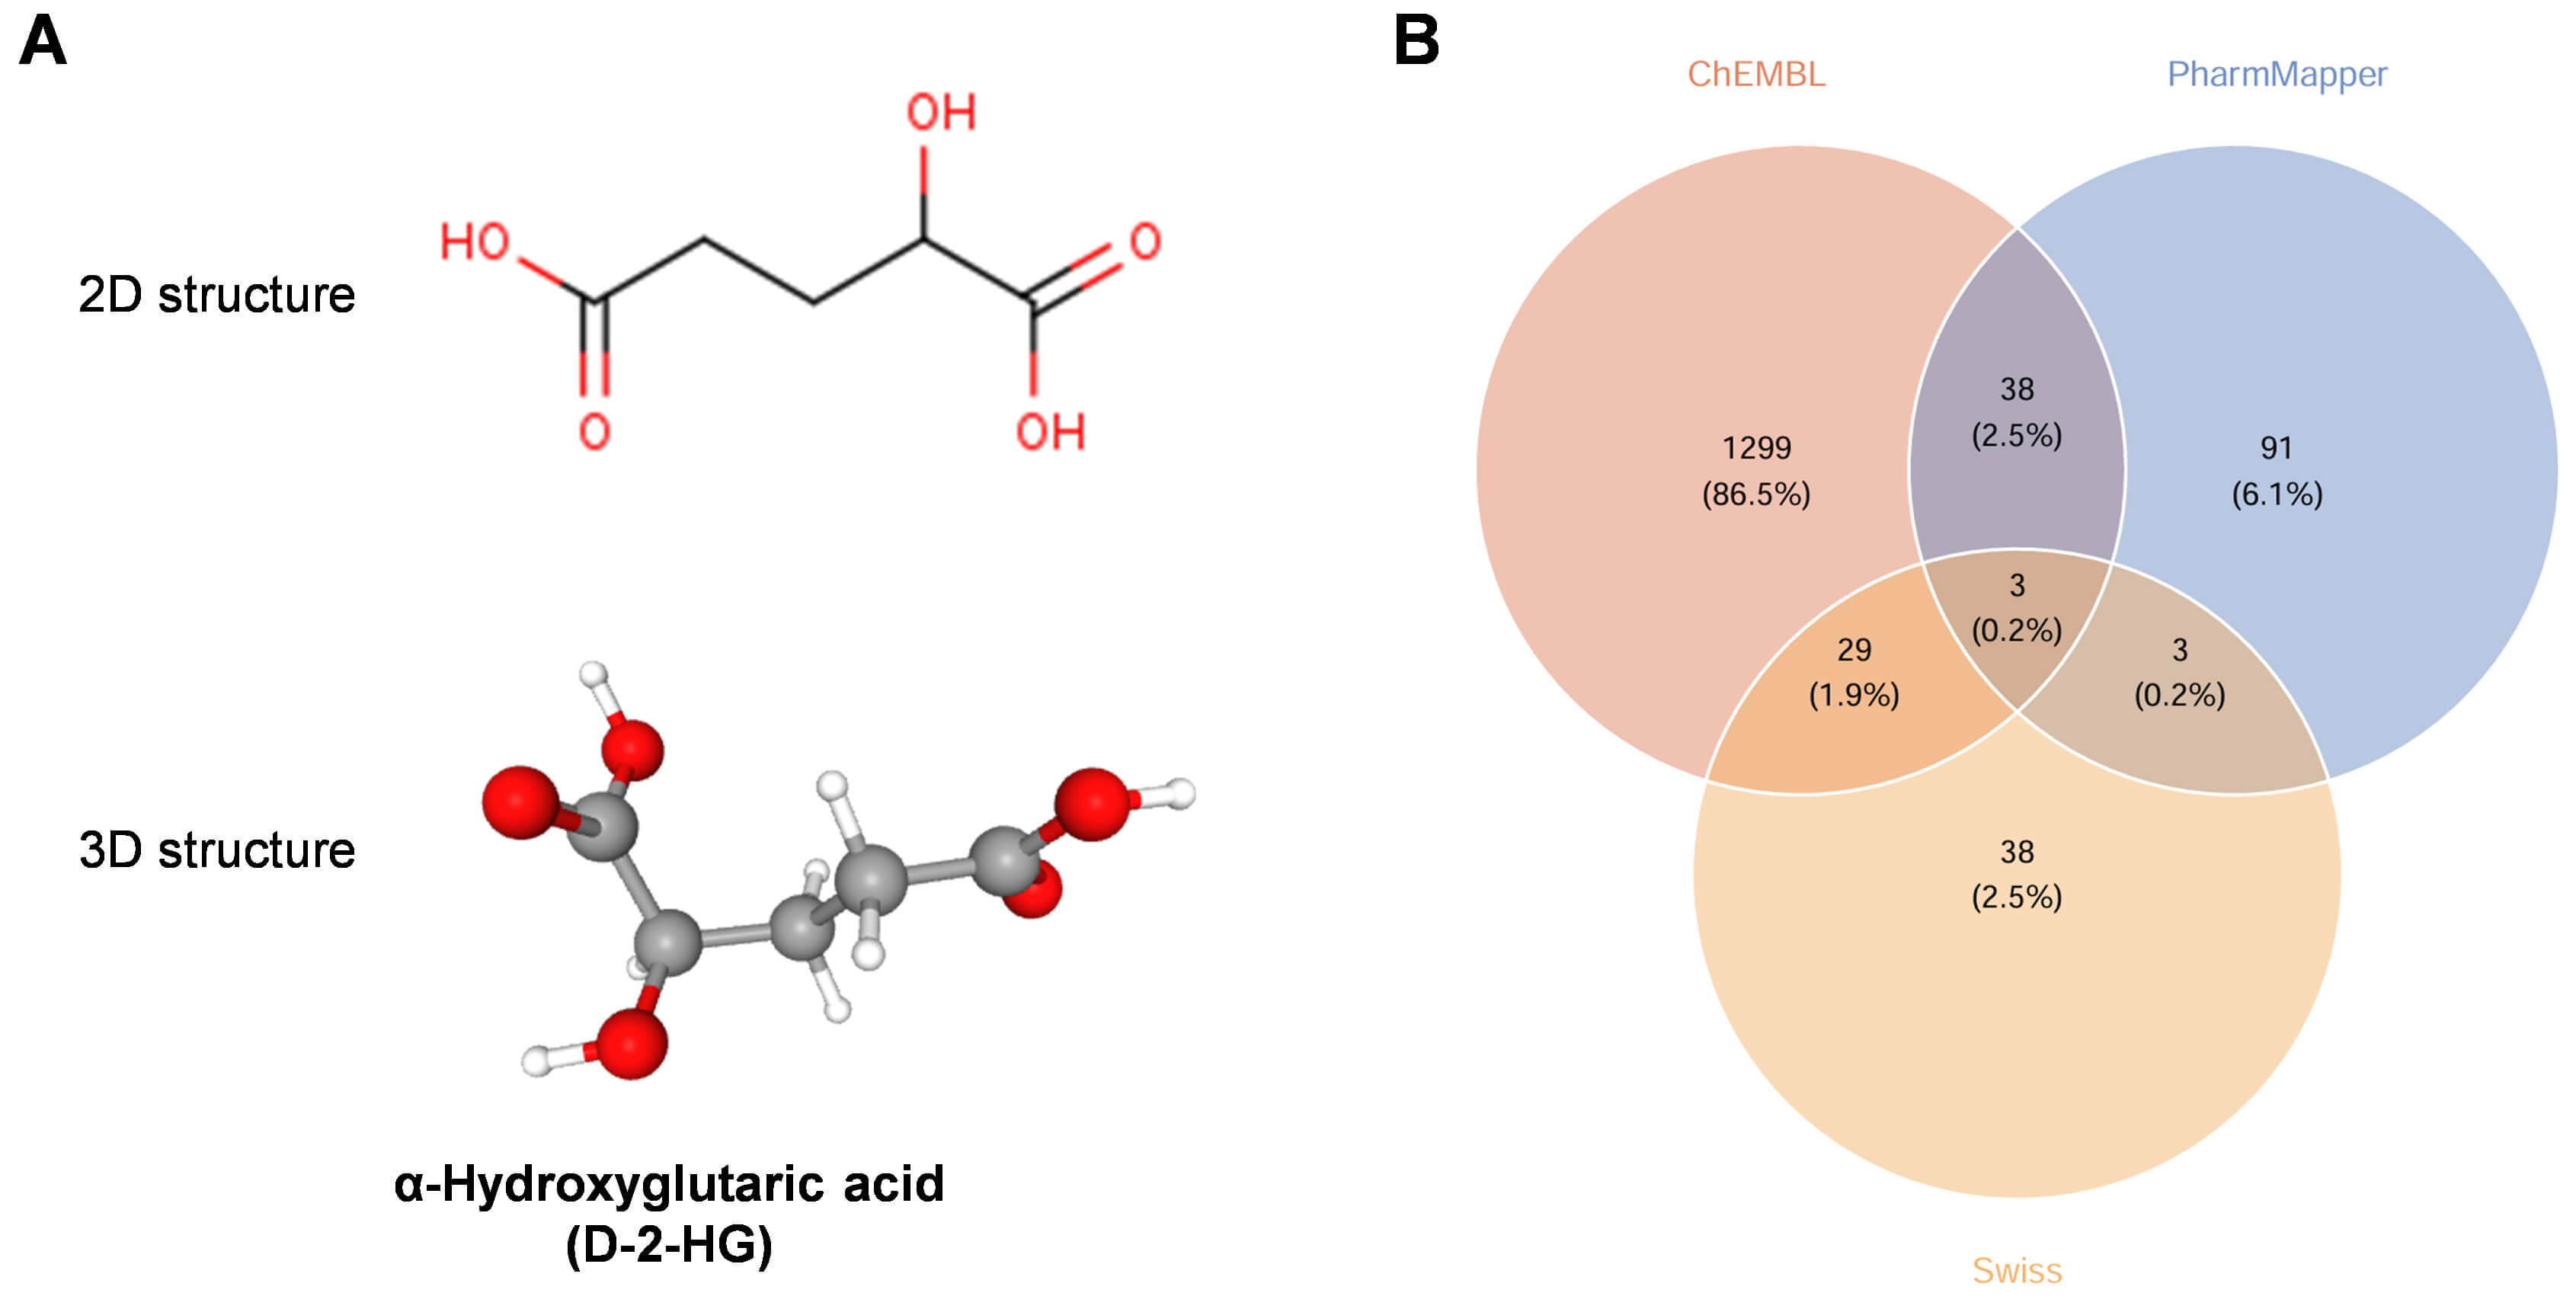 Fig. 2.
Identification of target proteins for D-2-HG. (A) The chemical structure (2D & 3D) of D-2-HG. (B) The prediction of potential targets was conducted utilizing ChEMBL, PharmMapper, and SwissTargetPrediction methodologies.
In order to address batch effects, datasets GSE4290 and GSE116520 were combined
and underwent thorough normalization of the gene expression matrix. The
implementation of PCA demonstrated an improved data distribution subsequent to
normalization, with the normalized dataset exhibiting more distinct clustering
patterns (Fig. 3A,B). The differential expression analysis identified 2017 genes
that displayed significant alterations in GBM. These changes in expression were
depicted using both a heatmap and a volcano plot (Fig. 3C,D). In the context of
WGCNA, the ideal soft-thresholding power (
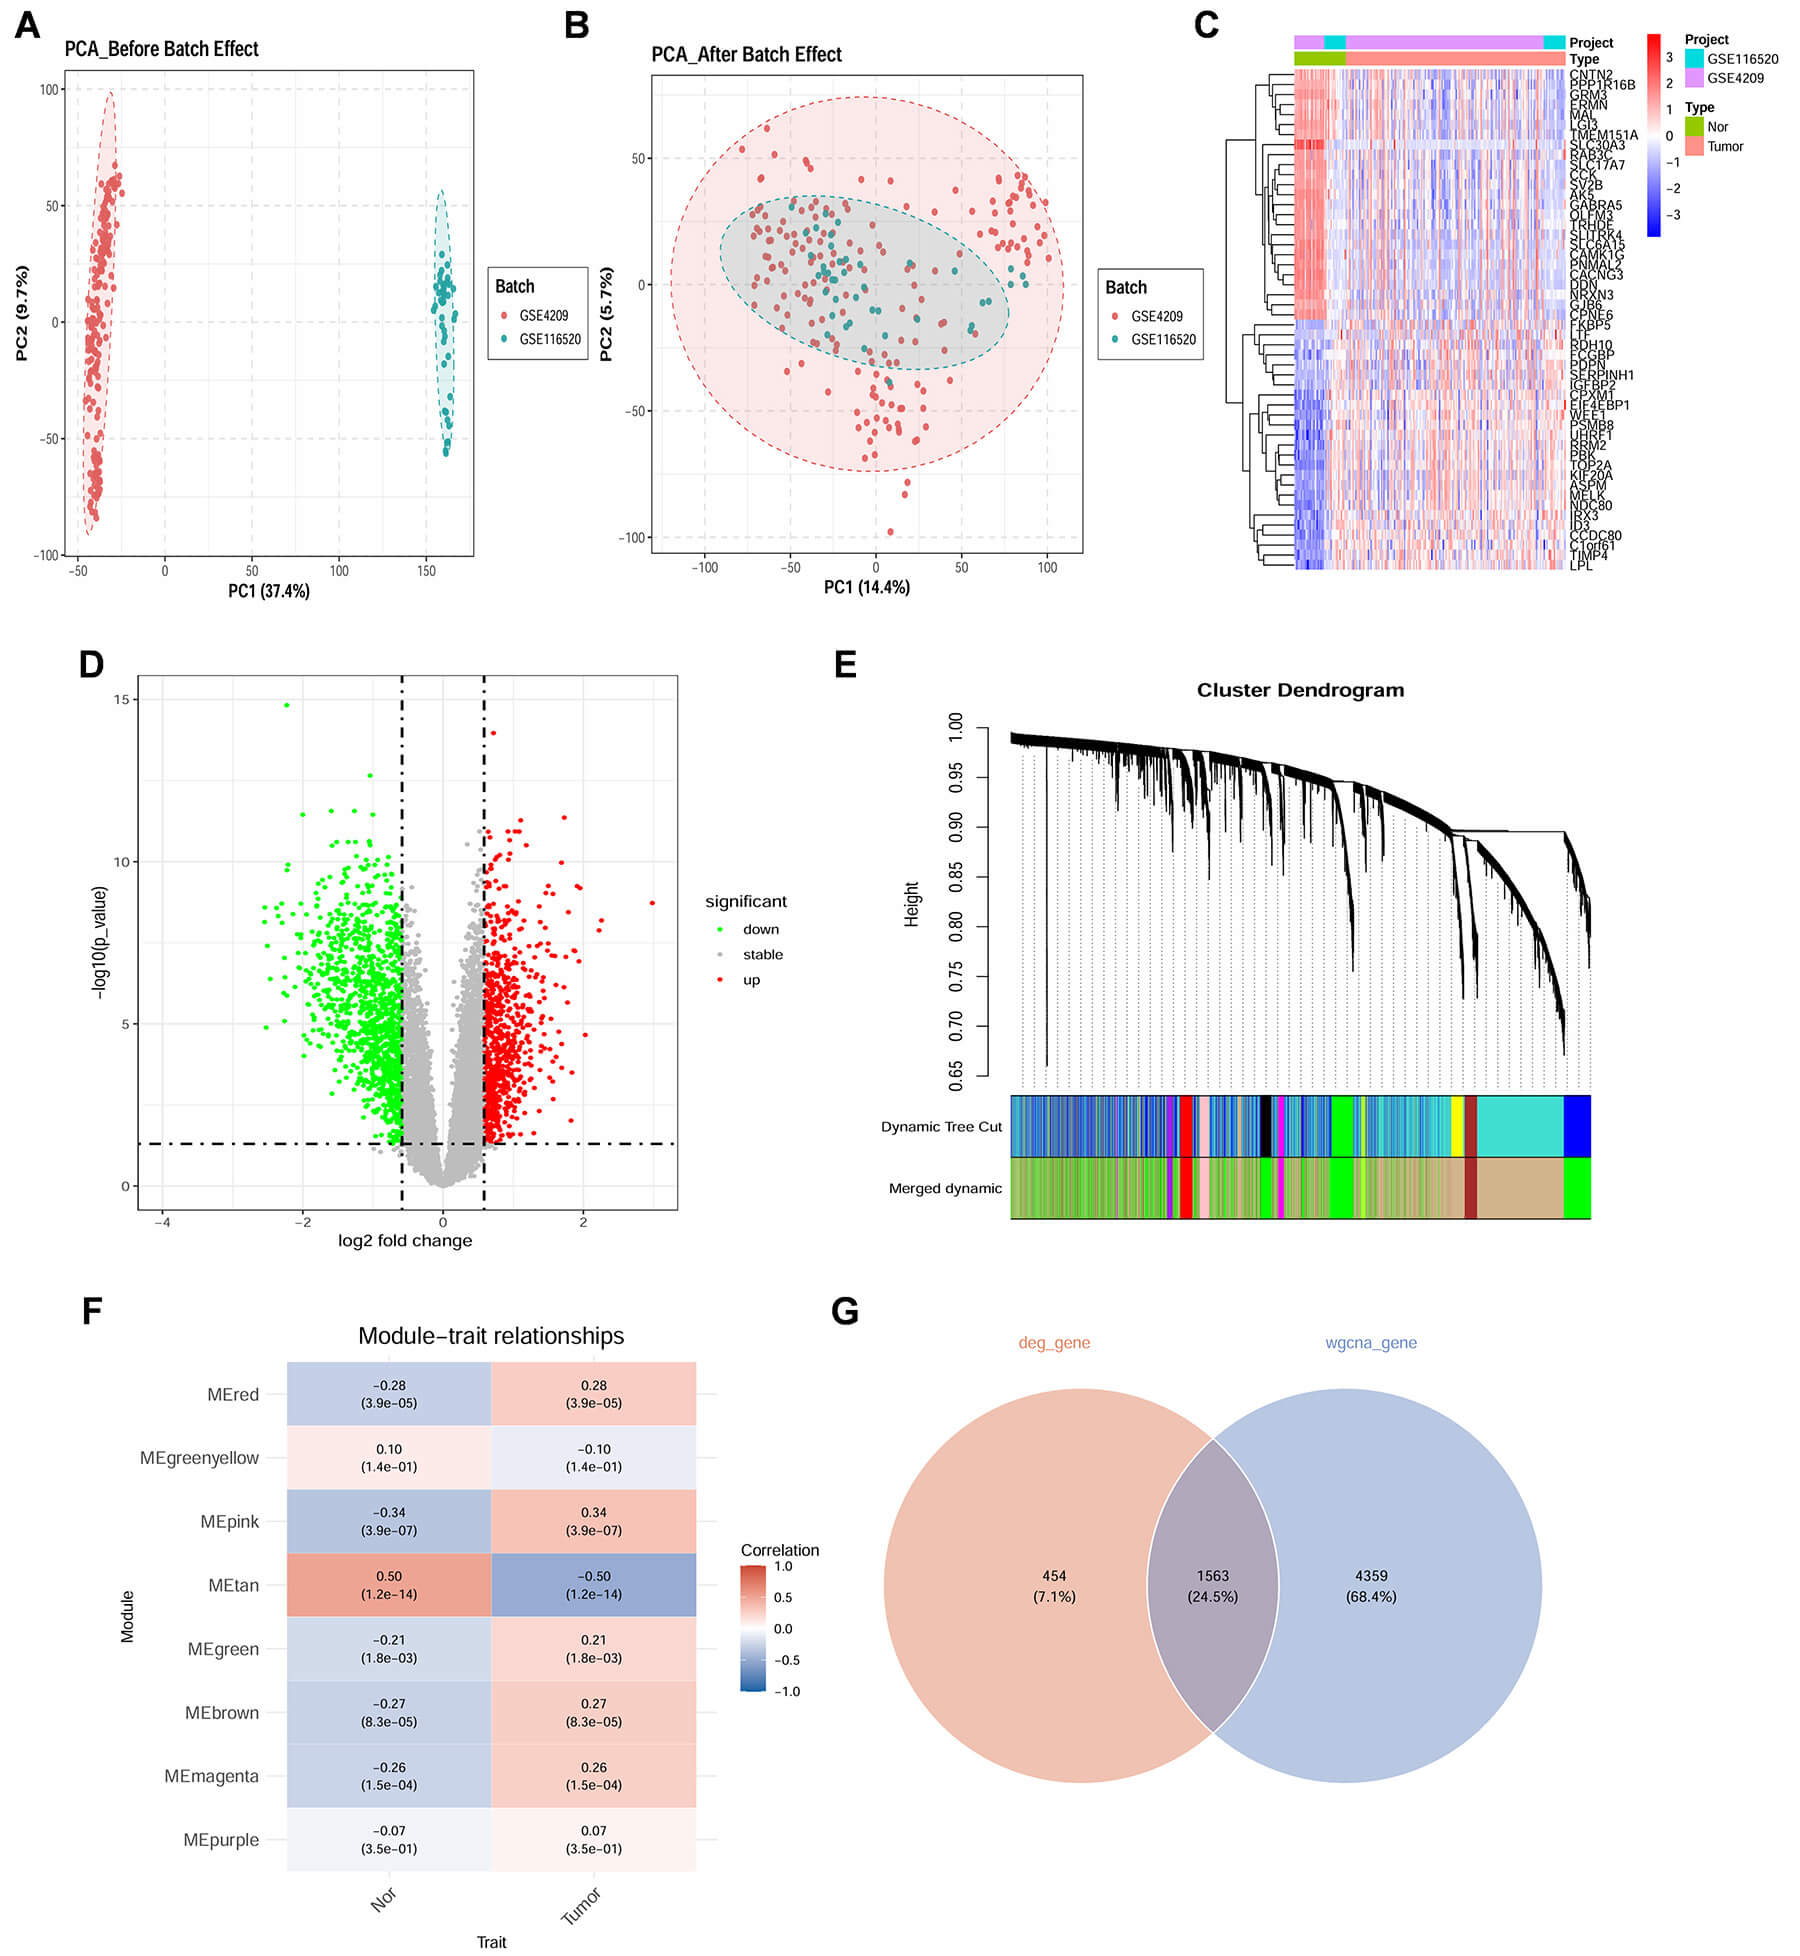 Fig. 3.
Identification of Target genes associated with GBM. (A) The principal component analysis (PCA) scatter plot illustrates a clear distinction between the GSE4290 and GSE116520 datasets prior to the implementation of batch correction, signifying the presence of batch effects. (B) Following batch correction, the PCA scatter plot demonstrates the successful integration of the GSE4290 and GSE116520 datasets, reflecting a significant reduction in batch effects. (C) The heatmap presents the expression patterns of differentially expressed genes (DEGs) across the samples, where red denotes upregulation and blue signifies downregulation. (D) The volcano plot visualizes the DEGs in relation to log2 fold change (log2FC) and statistical significance, with red dots representing upregulated genes, green dots indicating downregulated genes, and grey dots denoting genes that are not statistically significant. (E) Gene dendrogram from weighted gene co-expression network analysis (WGCNA) shows hierarchical clustering based on co-expression. Module colors in the lower panel represent different gene modules. (F) Module-trait relationships heatmap shows correlations between WGCNA-identified modules and sample traits (Control vs. Treatment). Values in boxes indicate correlation coefficients and p-values. (G) Venn diagram shows DEGs (red) and WGCNA modules (blue), with purple indicating common genes from both methods.
The intersection analysis between D-2-HG-associated genes and GBM-related genes identified 135 overlapping genes involved in the potential molecular mechanism (Fig. 4A). The interaction network of these common targets was visualized, distinguishing between upregulated and downregulated genes (Fig. 4B). Functional characterization through GO and KEGG enrichment analyses (Fig. 4C,D) revealed comprehensive molecular insights. GO analysis demonstrated significant enrichment in gamma-aminobutyric acid (GABA) signaling pathways and regulation of membrane potential (BPs), ion channel complexes and synaptic membranes (CCs), as well as GABA receptor activity and gated channel activity (MFs). KEGG pathway analysis highlighted crucial involvement in growth factor signaling (GF-RTK-RAS-ERK), signaling cascades [PI3K, protein 53 (P53)], and cell cycle regulation (G1/S transition). These findings collectively indicate significant modulation of neurotransmitter signaling, activation of oncogenic pathways, and cell cycle dysregulation in the context of D-2-HG and GBM interaction.
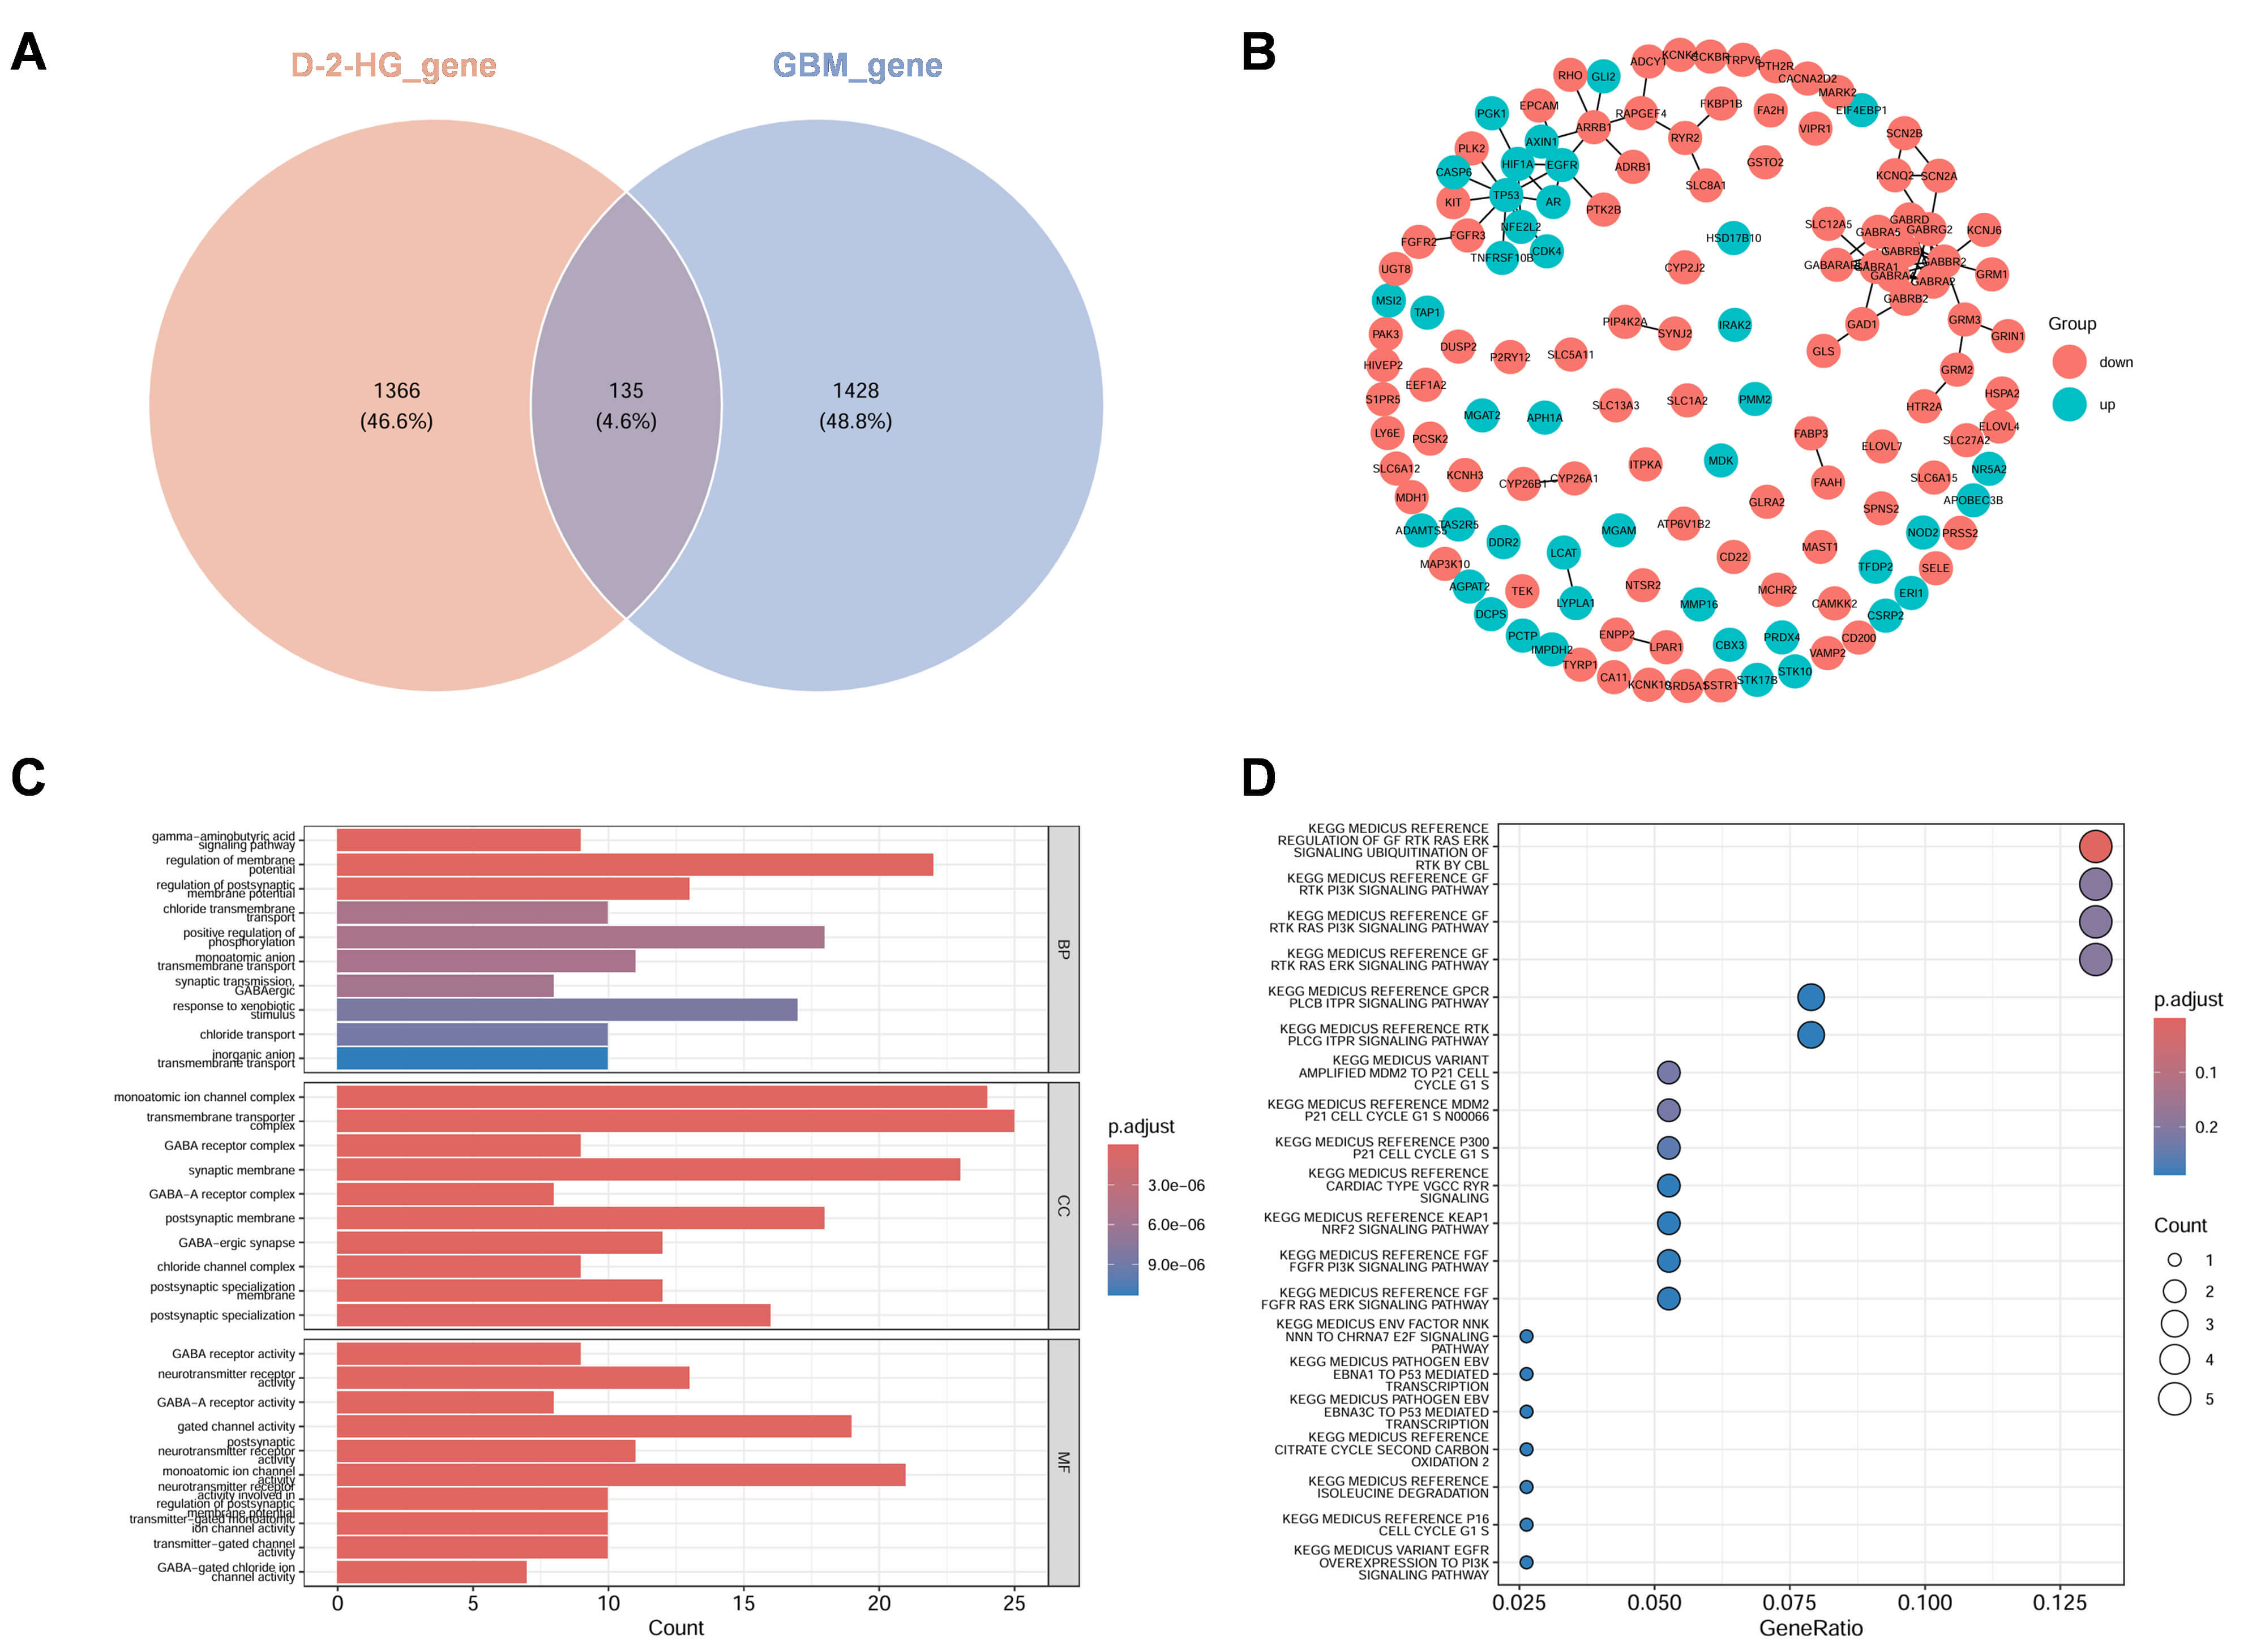 Fig. 4.
Identification of disease targets associated with D-2-HG in GBM. (A) A Venn diagram illustrates the comparison between genes associated with D-2-HG exposure (depicted in red) and those related to GBM (represented in blue), revealing a total of 135 genes that are common to both categories, accounting for 4.6% of the total. (B) The Protein-Protein Interaction (PPI) network delineates the relationships among these overlapping genes, where red nodes indicate upregulated genes, green nodes signify downregulated genes, and the edges represent predicted interactions. (C) Gene Ontology (GO) enrichment analysis categorizes the overlapping genes into Biological Process (BP), Cellular Component (CC), and Molecular Function (MF). The X-axis denotes the gene count, while the color gradient reflects the adjusted p-value, with darker red shades indicating greater significance. (D) The Kyoto Encyclopedia of Genes and Genomes (KEGG) analysis highlights the pathways that are enriched for the overlapping genes. The X-axis illustrates the gene ratio, the size of the dots corresponds to the gene count, and the color gradient indicates the adjusted p-value, with red representing higher significance.
To decode the core genes associated with D-2-HG-related GBM, we performed a
comprehensive machine learning analysis on 135 candidate targets, constructing a
total of 98 predictive models. Among these, the Stepglm [both] + GBM ensemble
model outperformed others, yielding the highest accuracy across both training and
validation cohorts (Fig. 5A). This computational pipeline identified a signature
of six pivotal genes: eukaryotic translation initiation factor 4E binding protein
1 (EIF4EBP1), fatty acid binding protein 3 (FABP3), potassium
voltage-gated channel subfamily Q member 2 (KCNQ2), epithelial cell
adhesion molecule (EPCAM), sphingosine-1-phosphate receptor 5
(S1PR5), and metabotropic glutamate receptor 3 (GRM3). The
diagnostic robustness of these hubs was corroborated by ROC curve analysis (AUC
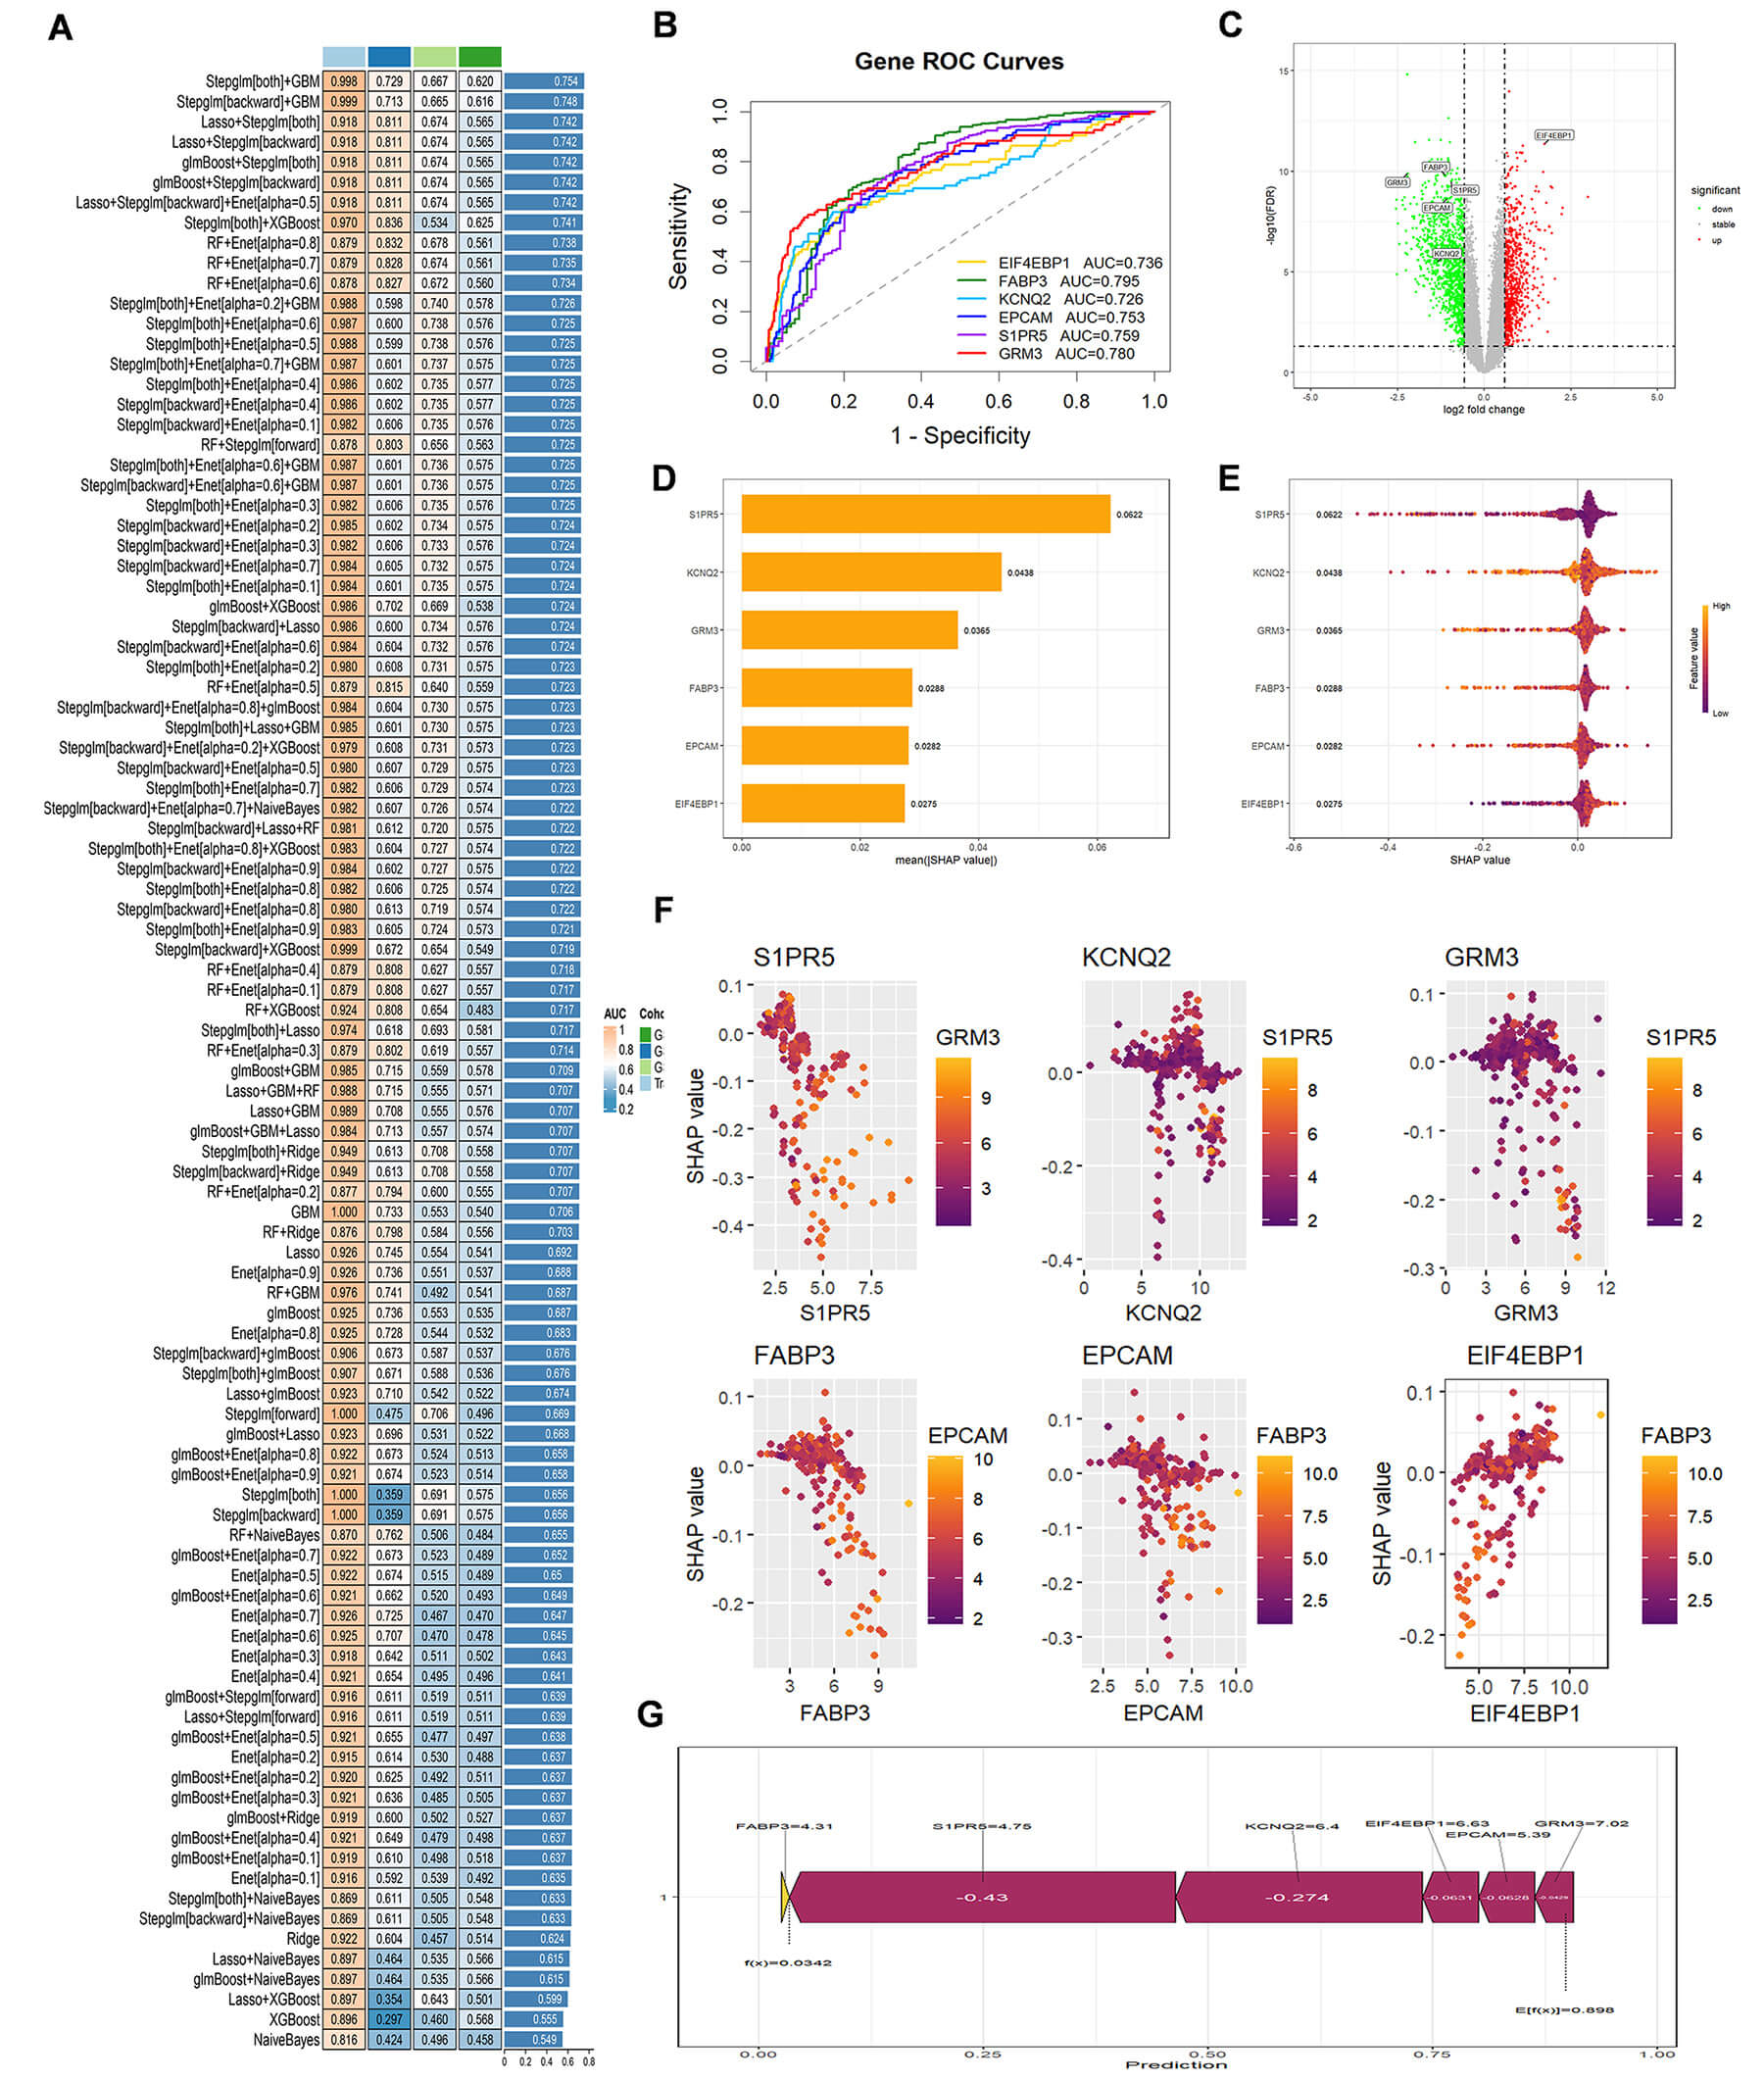 Fig. 5.
Identification of essential genes involved in D-2-HG-induced GBM. (A) Comparative Analysis of Model Performance: The heatmap illustrates the area under the curve (AUC) values for different models across various cohorts. The left column represents the models, while the right column displays the corresponding AUC values (with higher values indicating superior performance). The color coding reflects the sources of the cohorts. (B) ROC Curves: ROC curves for key genes (EIF4EBP1, FABP3, KCNQ2, EPCAM, S1PR5, GRM3). X-axis = false positive rate, Y-axis = sensitivity. AUC indicates predictive performance. (C) Volcano Plot: volcano plot shows DEGs. X-axis = log2FC, Y-axis = –log10(p-value). Red = upregulated, green = downregulated, with key genes labeled. (D) Feature Importance Ranking: A bar graph ranks top genes by feature importance. Larger bars = greater contribution to the model. (E) Violin Plot: violin plot shows gene expression distributions across conditions. Width represents data density, while colors indicate expression levels. (F) SHAP (SHapley Additive exPlanations) Value Distribution: The scatter plots illustrate the distribution of SHAP values for significant genes, highlighting their influence on predictive outcomes. (G) SHAP Summary Plot: The summary plot of SHAP values reveals the contributions of various genes to the predictions. A negative SHAP value signifies a diminishing effect, whereas a positive value indicates an enhancing effect.
To assess the possible binding interactions of D-2-HG with the protein products of the identified core genes (EIF4EBP1, FABP3, KCNQ2, EPCAM, S1PR5, GRM3), a detailed molecular docking analysis was conducted. To validate the reliability of our docking protocol and establish a comparative baseline, we additionally performed docking simulations between D-2-HG and two reference proteins: cell division cycle 42 (CDC42) and DNA methyltransferase 1 (DNMT1) [21, 22]. The results indicated that D-2-HG exhibited a notable binding affinity across all six identified target proteins, with binding energies comparable to or exceeding those of the reference controls (CDC42: [–5.2580] kcal/mol; DNMT1: [–4.9684] kcal/mol). This implies the formation of stable and spontaneous molecular complexes. In accordance with the established criteria in molecular docking studies, a binding energy threshold of less than 0 kcal/mol signifies spontaneous binding, while values falling below –5.0 kcal/mol reflect an exceptional binding affinity (see Table 1). The visualization of the binding conformations, as depicted in Fig. 6, further corroborated the stability of the docking arrangements for all D-2-HG–protein complexes. These findings provide structural evidence that underpins the direct molecular interactions between D-2-HG and the GBM-related core targets identified via our machine learning approach.
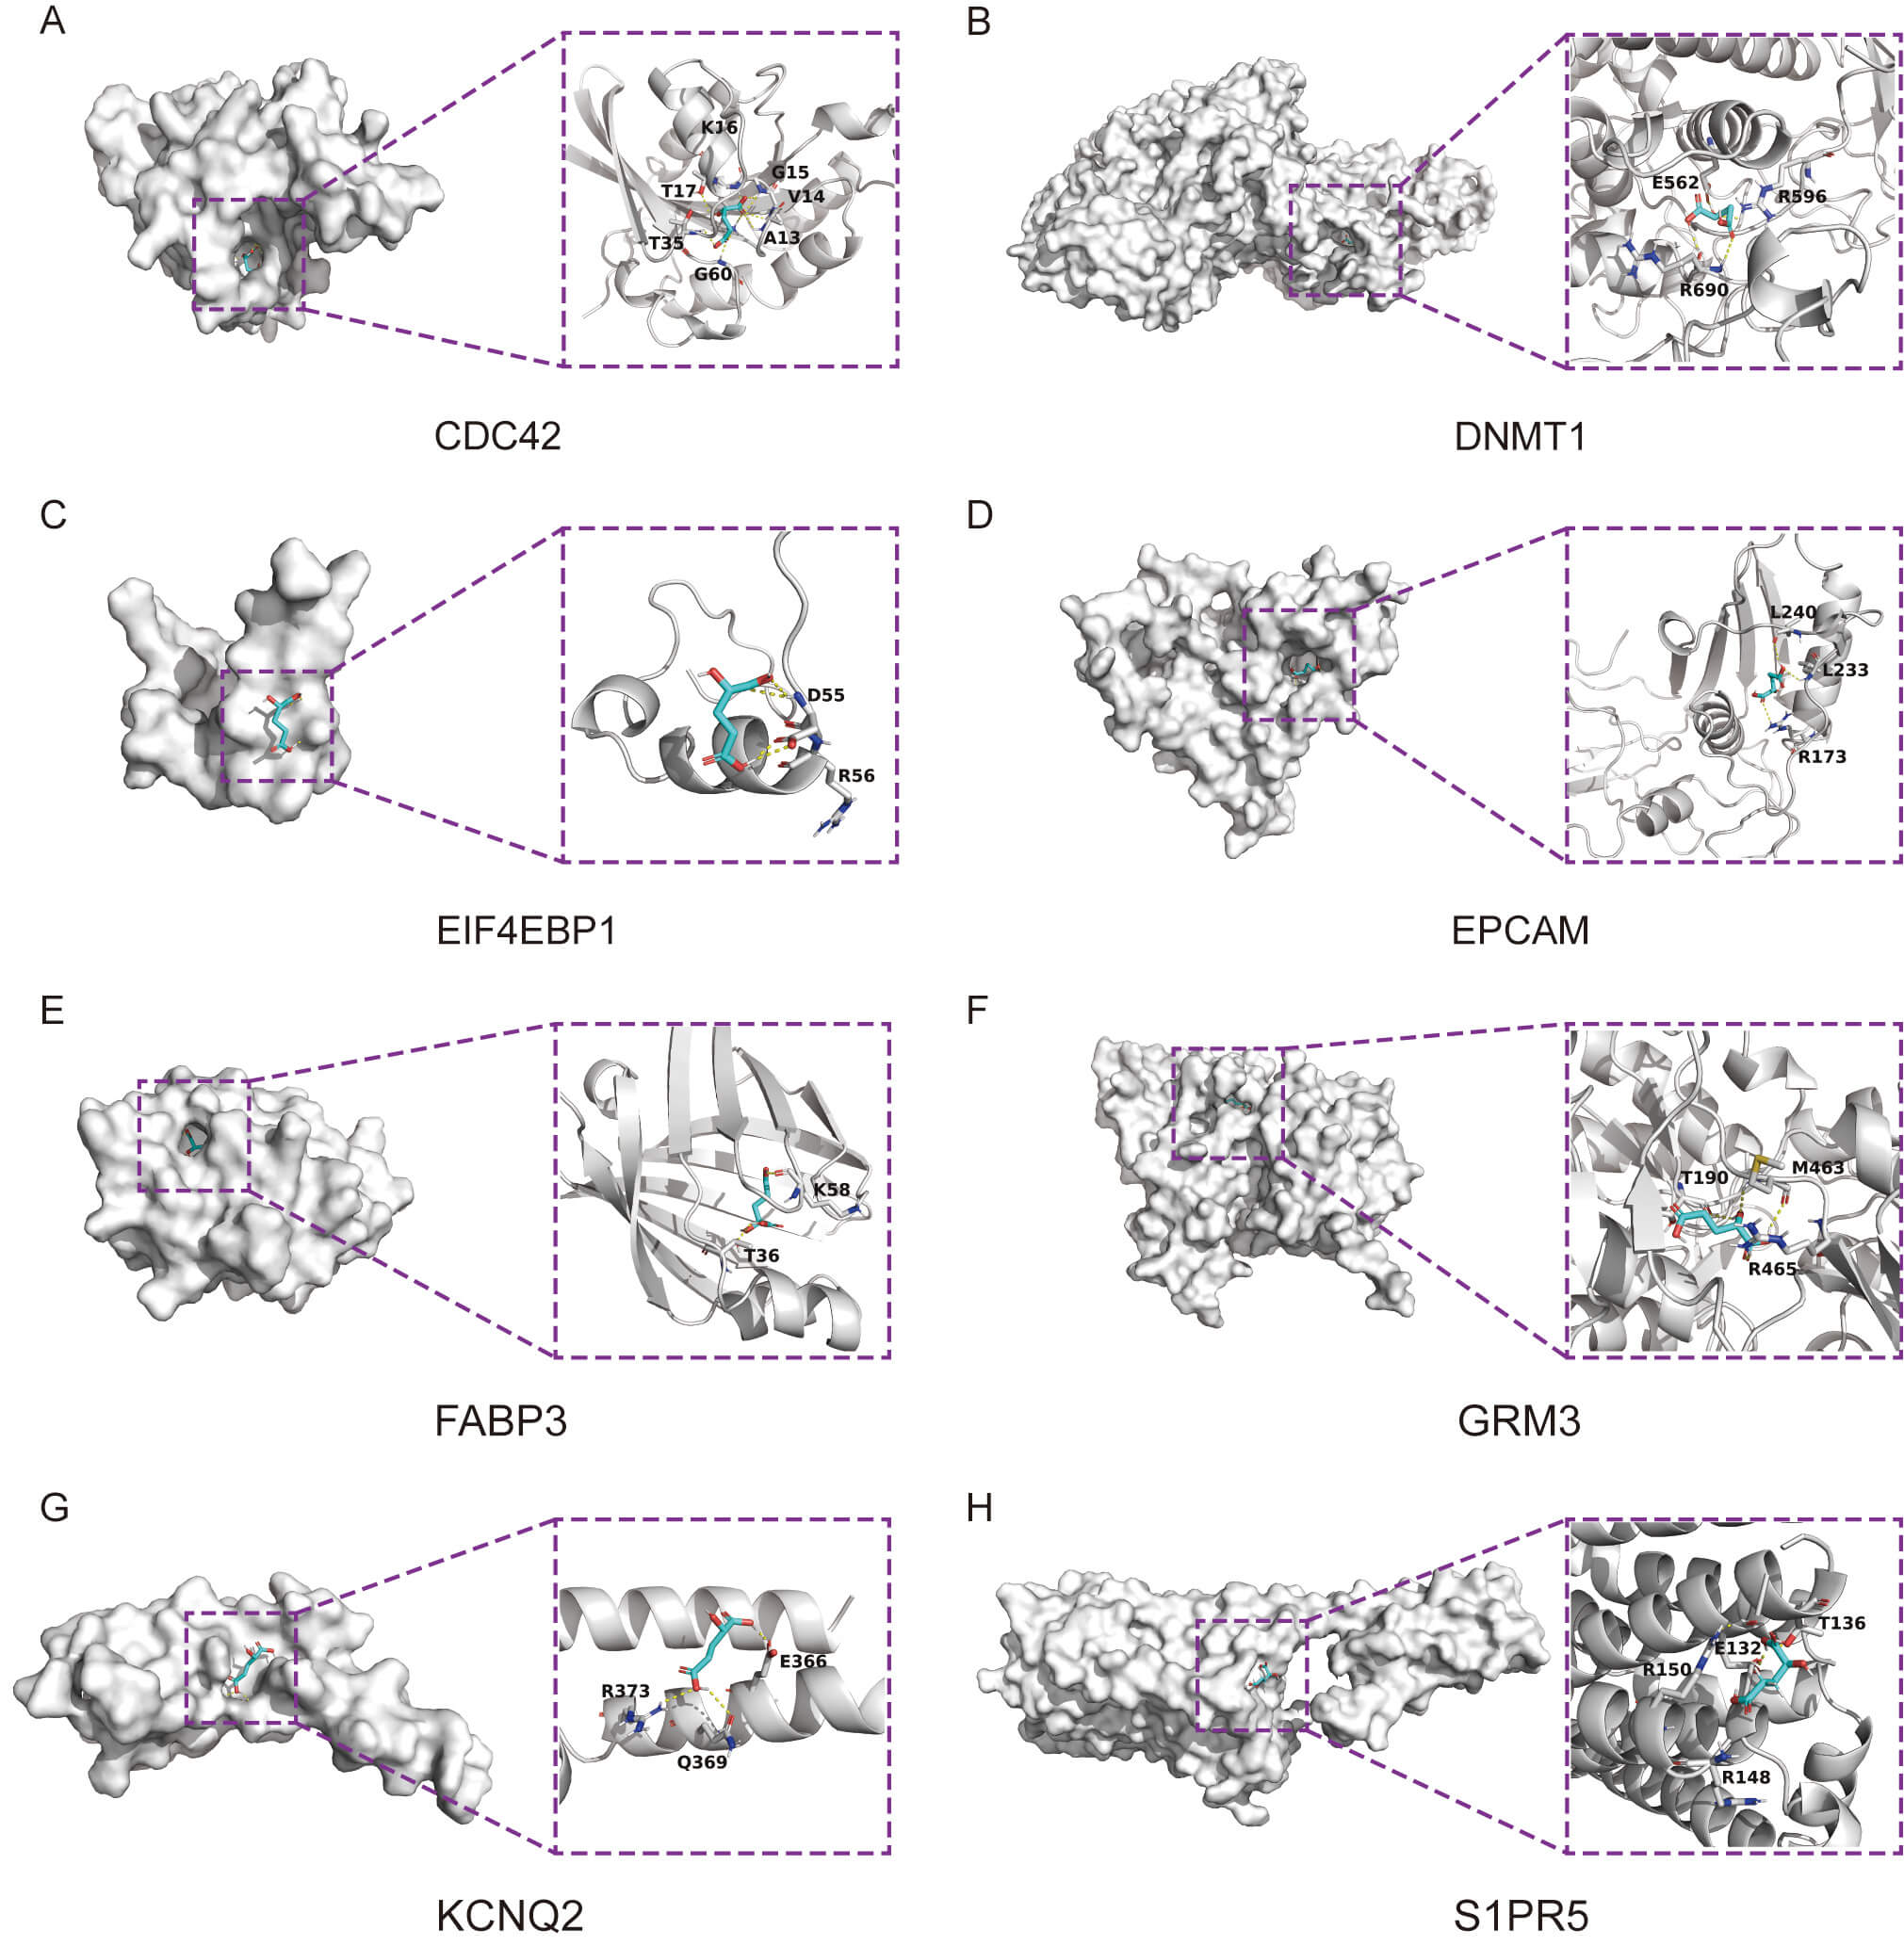 Fig. 6.
Validation of molecular docking for D-2-HG-Core gene interactions. (A) Docking analysis of CDC42 with D-2-HG. (B) Docking analysis of DNMT1 in association with D-2-HG. (C) Docking analysis of EIF4EBP1 in association with D-2-HG. (D) Docking analysis of EPCAM in relation to D-2-HG. (E) Docking analysis of FABP3 in connection with D-2-HG. (F) Docking analysis of GRM3 in conjunction with D-2-HG. (G) Docking analysis of KCNQ2 with D-2-HG. (H) Docking analysis of S1PR5 in association with D-2-HG.
| Ligand | Receptor | Bind. energy (kcal/mol) | Bind. sites |
| D-2-HG | CDC42 | –5.2580 | A13, V14, G15, K16, T17, T35, G60 |
| DNMT1 | –4.9684 | E562, R596, R690 | |
| EIF4EBP1 | –3.9259 | D55, R56 | |
| EPCAM | –4.7959 | L173, L233, L240 | |
| FABP3 | –4.7896 | T36, K58 | |
| GRM3 | –5.2156 | T190, M463, R465 | |
| KCNQ2 | –4.7438 | E366, Q369, R373 | |
| S1PR5 | –4.4563 | E132, T136, R148, R150 |
CDC42, cell division cycle 42; DNMT1, DNA methyltransferase 1.
The oncogenic effects of D-2-HG in GBM primarily stem from gain-of-function
mutations in the IDH gene, particularly the IDH1 R132H mutation
[23, 24]. This mutation confers a neomorphic activity upon IDH1, enabling
it to excessively reduce the normal TCA cycle metabolite
A comprehensive analysis of multi-omics data, utilizing sophisticated machine learning techniques alongside bioinformatics methodologies, has systematically revealed potential molecular targets that connect D-2-HG to the development of GBM. Through a rigorous screening process, six core genes—EIF4EBP1, FABP3, KCNQ2, EPCAM, S1PR5, and GRM3—were found to be particularly prominent. Differential expression analysis revealed that EIF4EBP1 was upregulated in GBM, while FABP3, KCNQ2, EPCAM, S1PR5, and GRM3 were downregulated. The application of machine learning models has substantiated the significant diagnostic potential of the identified gene signature. Interpretative analysis utilizing SHAP values revealed that S1PR5 (SHAP value = 0.0622) and KCNQ2 (SHAP value = 0.0438) emerged as the most pivotal predictors. Furthermore, molecular docking simulations provided additional evidence for the biological implications of these results, demonstrating a robust binding affinity between D-2-HG and the products of the core genes, facilitated by specific interactions among amino acids.
The identified core genes exert their functions through a cross-regulatory axis
involving metabolism, epigenetics, and signaling pathways, and may exhibit
significant synergistic or antagonistic interactions with the oncogenic
metabolite D-2-HG produced by IDH mutation. D-2-HG, which accumulates
due to IDH mutations, can competitively inhibit
Based on the current literature review, we have identified that these key genes are implicated in tumorigenesis and cancer progression, with most having been investigated in the context of GBM. Notably, no existing studies have reported direct or indirect interactions between these key genes and D-2-HG. However, through integrated machine learning and molecular docking approaches, our study reveals a close association between these genes and D-2-HG. Given that D-2-HG has been established as a driver in the formation of IDH-mutant glioma [50], these findings highlight substantial and valuable research avenues that remain unexplored, underscoring the significance of our current investigation. For instance, EIF4EBP1 acts as a key downstream effector of the mTORC1 complex. Upon phosphorylation by mTORC1, EIF4EBP1 releases the translation initiation factor eIF4E, thereby initiating cap-dependent translation and facilitating the synthesis of pro-oncogenic proteins (e.g., cyclins, growth factors). This process ultimately drives the proliferation, survival, and metabolic reprogramming of glioma cells [51]. By affecting the adenosine monophosphate (AMP)/ATP ratio, D-2-HG could indirectly modulate AMPK activity. This would engage the AMPK-mTORC1-EIF4EBP1 signaling axis, potentially establishing a negative feedback mechanism that limits uncontrolled proliferation and restricts tumor overgrowth [52, 53]. This finding corroborates the clinical observation that IDH-mutant gliomas typically exhibit a slower growth rate and a more favorable prognosis.
This research encompasses several fundamental limitations. While the sample size is adequate for initial analysis, it could restrict the wider applicability and generalizability of the findings to larger populations. Additionally, while factors such as age, genetic predispositions, and lifestyle choices were somewhat accounted for, there may still be residual influences that could affect the findings. Furthermore, the outcomes predicted through computational methods necessitate further experimental verification to establish their true biological significance and precision, a crucial aim for our forthcoming investigations. Consequently, subsequent investigations ought to focus on augmenting both the magnitude and heterogeneity of the participant group, in addition to utilizing various methodologies, such as in vitro and in vivo studies, to substantiate and corroborate the significant findings. This approach will enhance the reliability and applicability of the research outcomes. Notwithstanding these limitations, the comprehensive examination of the interconnected molecular pathways between D-2-HG and GBM presented in this research carries considerable implications for public health. Future research should focus on the interactions between these key genes and D-2-HG to explore potential targeted therapeutics for improving the survival prognosis of glioma patients.
The present research indicates that D-2-HG could play a role in the development of GBM through the modulation of particular genes. Molecular docking analyses demonstrated notable binding affinity between D-2-HG and its corresponding target proteins. These results establish a basis for additional exploration into the pathways through which D-2-HG may facilitate the onset and advancement of GBM. Future research should focus on elucidating the quantitative relationship between D-2-HG levels and GBM formation and prognosis, as well as exploring potential therapeutic interventions using targeted drugs or natural products for GBM treatment.
No supplementary files are uploaded with this submission. The original data supporting this work are available from the corresponding author upon reasonable request.
JZ and QBW formulated the overall research objectives and purposes of this paper; YFZ is responsible for data retrieval,data processing and analysis in this study; XFY has done important work in molecular docking and image integration; QLL contributed to drafting the manuscript and interpreting the data for the work.; QLL and JZ performed valuable work in revising the paper’s content and reviewing the data processing. All authors contributed to critical revision of the manuscript for important intellectual content. All authors read and approved the final manuscript. All authors have participated sufficiently in the work and agreed to be accountable for all aspects of the work.
This research is to mine the data in the public database, mainly the geo database. This database is open source and does not need additional ethical approval.
We would like to express our gratitude to all those who helped us during the writing of this manuscript. Thanks to all the peer reviewers for their opinions and suggestions.
This research received no external funding.
The authors declare no conflict of interest.
During the preparation of this work, the authors used ChatGPT-3.5 in order to check spelling and grammar. After using this tool, the authors reviewed and edited the content as needed and take full responsibility for the content of the publication.
References
Publisher’s Note: IMR Press stays neutral with regard to jurisdictional claims in published maps and institutional affiliations.