


 , Weiying Gu 1,†, Yan Lin 1, Yang Cao 1, Jiaru Luo 1, He Yu 1, Jingyi Dai 2, Zhuojun Zheng 1,*
 , Yan Liu 1,*
1 Department of Hematology, The Third Affiliated Hospital of Soochow University, 213003 Changzhou, Jiangsu, China
2 Department of Tumor Biological Treatment, The Third Affiliated Hospital of Soochow University, 213003 Changzhou, Jiangsu, China
†These authors contributed equally.
Abstract
Monoclonal gammopathy of undetermined significance (MGUS) is a precursor to multiple myeloma (MM), but the mechanisms of progression remain unclear.
Transcriptomic datasets procured from the Gene Expression Omnibus (GEO) underwent thorough analysis to ascertain disease-related modules using weighted gene co-expression network analysis. A prognostic model (MGUSscore) was constructed via least absolute shrinkage and selection operator (LASSO) regression within the GSE136337 cohort and validated across independent datasets (The Cancer Genome Atlas - multiple myeloma [TCGA-MM], GSE4581, GSE57317). Crucially, the investigation integrated original single-cell ATAC-seq profiling, immune landscape characterization, and pharmacogenomic sensitivity prediction. Protein-level disparities were validated in clinical specimens using immunohistochemistry and multiplex immunofluorescence.
DAP3 and UBE2S were identified as central drivers of progression. The MGUSscore effectively stratified patients into risk categories, with high-risk individuals exhibiting significantly inferior survival outcomes (p < 0.001). Notably, the high-risk group was characterized by distinct immune infiltration patterns and predicted responsiveness to specific chemotherapies. Experimental validation confirmed markedly elevated DAP3 and UBE2S protein expression in MM compared to MGUS tissues.
Collectively, DAP3 and UBE2S may constitute promising therapeutic targets for MM intervention, meriting additional investigative efforts.
Keywords
- monoclonal gammopathy of undetermined significance
- multiple myeloma
- gene expression profiling
- tumor microenvironment
- immunohistochemistry
Monoclonal gammopathy of undetermined significance (MGUS) is defined by an abnormal monoclonal immunoglobulin or its light chain fragments detected in serum and/or urine, accompanied by a clonal plasma cell or lymphoplasmacytic cell population comprising less than 10% of the total bone marrow cellular content. This condition primarily manifests in individuals exceeding 50 years of age, with a pronounced predilection for males [1, 2]. Although initially presenting without clinical manifestations, MGUS patients encounter a persistent risk for transformation into more aggressive plasma cell neoplasms, notably multiple myeloma (MM). Annual deterioration occurs in approximately 1% of MGUS patients, whereas roughly 10% of smoldering multiple myeloma (SMM) cases advance to MM within a five-year post-diagnostic period. Notably, 18% of MGUS patients demonstrate elevated progression risk over a 20-year timeframe [3]. The clinically silent presentation of MGUS frequently results in diagnostic delays, thereby complicating preventive and therapeutic interventions [4, 5].
MM emerges as the second most prevalent hematologic malignancy, characterized by dysregulated proliferation of abnormal clonal plasma cells within the bone marrow. The pathological expansion generates profound clinical manifestations, encompassing osteolytic lesions, renal dysfunction, anemia, and hypercalcemia [6]. The progression from MGUS to MM represents a sophisticated transformation involving substantial genetic and microenvironmental modifications. Fundamental genetic alterations, encompassing chromosomal numerical variations and specific translocation events, serve critical functions in driving malignant plasma cell clonal expansion. Concurrently, the bone marrow microenvironment undergoes significant restructuring to facilitate malignant progression, characterized by enhanced vascular development and increased stromal cell adaptability [7]. Understanding these clinical and biological markers remains crucial for predicting MGUS to MM progression, enabling strategic patient stratification and targeted monitoring with early therapeutic interventions. Despite extensive research, the precise molecular mechanisms governing MGUS to MM transformation remain incompletely understood, emphasizing the continued necessity for comprehensive investigative approaches.
Recent advancements in computational biology and genomic array methodologies have increasingly become pivotal instruments within biomedical research [8]. Comprehensive evaluations of differentially expressed genes (DEGs) and their corresponding protein expressions in individuals with MM potentially elucidate the molecular mechanisms underlying the transition from MGUS to MM. These analytical approaches demonstrate significant potential for identifying novel diagnostic indicators and therapeutic targets. Utilizing sophisticated bioinformatics analytical strategies, this research aimed to delineate common molecular pathways, fundamental interconnected genes, and critical genetic elements associated with MGUS and MM progression. The primary research intent focused on exploring shared pathological mechanisms and potential therapeutic interventions, ultimately seeking to improve diagnostic precision and clinical management strategies for patients experiencing these hematological conditions.
Transcriptome sequencing datasets pertaining to MGUS and MM were procured from the Gene Expression Omnibus (GEO) database [9]. From the comprehensive GSE6477 dataset (GPL96 platform) [10], which originally contains 162 samples across various disease stages, a specific subset aligned with the study aims was selected. This subset captures bone marrow transcriptome information from 15 samples explicitly labeled as healthy donors, 22 MGUS patients, and 73 newly diagnosed MM patients, while smoldering and relapsed cases were excluded to focus on primary disease progression. Similarly, from the 78 total samples available in the GSE5900 [11] dataset (GPL570 platform) data gathered from 22 healthy subjects and 44 MGUS patients were utilized, with SMM cases being excluded. These datasets were applied for differential gene expression analysis and weighted gene co-expression network analysis (WGCNA). The GSE13633dataset (GPL2714 platform) [12], which encompasses transcriptomic and survival data from MM patients, was utilized to develop the prognostic risk model. Crucial prognostic genes were determined via univariate Cox and least absolute shrinkage and selection operator (LASSO) regression analyses through integration of information from GSE136337 and The Cancer Genome Atlas - multiple myeloma (TCGA-MM, 787 bone marrow samples). The robustness and predictive capacity of the model were subsequently evaluated across three independent cohorts: TCGA-MM, GSE4581 (414 MM, GPL570 platform), and GSE57317 (55 MM, GPL570 platform) [13].
Each GEO dataset was examined independently within its corresponding platform, without combining raw data across GPL96, GPL570, or GPL2714 platforms. For each dataset, raw expression data were subjected to background correction and quantile normalization, followed by log2 transformation. All data underwent quality control and standardization procedures to ensure internal consistency and comparability across analyses.
Initially, the ‘limma’ package [14] was employed to determine DEGs within the
MGUS and MM cohorts versus control specimens. The selection parameters for DEGs
were established as AveExpr
Gene module identification concerning MGUS and MM progression was executed
through independent WGCNA analyses on the GSE6477 and GSE5900 datasets. The
methodology of WGCNA demonstrates exceptional proficiency in processing
large-scale datasets, enabling precise identification of gene clusters
substantially linked to pathological progression via sophisticated clustering and
modularization methodologies [15]. Quality control and normalization procedures
were first applied to ensure data consistency. Crucially, to guarantee
statistical robustness, the appropriate soft-thresholding power (
By integrating transcriptomic data and employing gene co-expression network analytical techniques, a comprehensive strategy was utilized to delineate pivotal genes linked to MM and MGUS progression. The investigative approach encompassed executing set-based operations across four distinct gene collections: DEGs and WGCNA module genes for both MM and MGUS. Intersection analyses were subsequently conducted, initially between MM-related DEGs and MM-related WGCNA module genes (designated as set A), and subsequently between MGUS-related DEGs and MGUS-related WGCNA module genes (designated as set B). The ultimate candidate gene collection (referred to as set C) emerged from the convergence of sets A and B. This methodological strategy was graphically represented through a Venn diagram, wherein individual closed curves depicted various gene collections, with intersecting regions emphasizing the critical genes of significant interest.
The clinical relevance of pivotal DEGs was investigated through an initial evaluation of their diagnostic potential utilizing receiver operating characteristic (ROC) analysis within the GSE6477 dataset. Correlations between gene expression patterns, patient survival outcomes, disease staging, and chromosomal aberrations were subsequently examined. Within the GSE136337 dataset, univariate Cox regression analysis identified genes demonstrating significant links to MM prognosis, while LASSO regression was employed to refine these candidates into the most informative prognostic markers. A risk score model (MGUS-related risk score, MGUSscore) was constructed based on this refined gene set, incorporating two hub genes, DAP3 and UBE2S. Patients were classified into high- and low-risk cohorts based on the median risk score, with overall survival (OS) differences evaluated through Kaplan–Meier (K–M) analysis. The prognostic value of the MGUSscore was evaluated in conjunction with clinical variables (including age, gender, International Staging System [ISS] stage, Lactate Dehydrogenase (LDH), and cytogenetics) through multivariable Cox regression analysis. Predictive performance was evaluated through time-dependent ROC curve analysis, the Concordance index (C-index), and calibration curves. A prognostic nomogram for predicting 1-, 3-, and 5-year OS was constructed utilizing the rms R package (version 6.7-0; Frank E. Harrell Jr., Vanderbilt University School of Medicine, Nashville, TN, USA). The TCGA-MM cohort was jointly analyzed with GSE136337 to facilitate core prognostic gene identification and to further evaluate the robustness and predictive performance of the MGUSscore. The detailed clinical characteristics of the GSE136337 and TCGA-MM cohorts are summarized in Table 1. External validation was subsequently performed across two independent cohorts, GSE4581 and GSE57317.
| Database | GSE136337 | TCGA-MM | |
| cases of MM | 426 | 787 | |
| Age | |||
| 213 (50.0%) | 315 (40.0%) | ||
| 213 (50.0%) | 466 (59.2%) | ||
| NA | 0 (0.0%) | 6 (0.8%) | |
| Gender | |||
| female | 165 (38.7%) | 321 (40.8%) | |
| male | 261 (61.3%) | 460 (58.4%) | |
| NA | 0 (0.0%) | 6 (0.8%) | |
| Median OS (years) | 7.58 [0–14.5] | 2.18 [0.003–5.44] | |
| Median PFS (years) | 4 [0–12.92] | - | |
| Chromosomal variations. | |||
| del 1p | 90 (23.2%) | - | |
| del 13q | 77 (18.1%) | - | |
| del 1p32 | 85 (19.6%) | - | |
| ISS stage | |||
| I | 168 (39.4%) | 265 (33.7%) | |
| II | 135 (31.7%) | 274 (34.8%) | |
| III | 121 (28.4%) | 220 (27.9%) | |
| NA | 2 (0.5%) | 28 (3.6%) | |
TCGA-MM, The Cancer Genome Atlas - multiple myeloma; MM, multiple myeloma; OS, overall survival; PFS, progression-free survival; ISS, International Staging System. The hyphen (-) indicates data not available.
DEGs between the two cohorts were determined utilizing the ‘limma’ package, with
selection criteria of AveExpr
Progressive advancements in disease research have rendered the substantial impact of immune responses on disease progression increasingly apparent. Immune scores, stromal scores, and ESTIMATE scores were computed for high and low-risk cohorts utilizing the ESTIMATE algorithm. The proportions of immune cell infiltration were determined through the ‘CIBERSORT’ [17] analytical tool. Subsequently, linear regression analysis was implemented to elucidate the associations between immune cell infiltration patterns and risk scores.
Utilizing data procured from the Genomics of Drug Sensitivity in Cancer (GDSC) database, recognized as the most comprehensive pharmacogenomics resource available, chemotherapy sensitivity predictions were generated for individual tumor specimens through implementation of the ‘oncoPredict’ [18] R package. The half-maximal inhibitory concentration (IC50) values for respective pharmaceutical agents were determined via regression analysis, with predictive accuracy being assessed through 10-fold cross-validation methodology employing the GDSC training dataset.
Single-cell transcriptome datasets were procured from the GEO database, specifically the GSE176131 [19] dataset. The repository comprised data collected from 2 healthy control subjects and 9 MM patients, facilitating comprehensive single-cell correlation investigations. Single-cell RNA-seq data processing was implemented through the ‘Seurat’ [20] R package, with cellular expression matrix normalization conducted via the ‘LogNormalize’ methodology. Dimensionality reduction was achieved by principal component analysis, where the top 50 principal components were selected for cellular clustering based on marker gene identification using the elbow plot criterion. Subsequently, the expression profiles of DAP3 and UBE2S across varied cell populations were systematically evaluated.
Single-cell ATAC-seq profiling was conducted on primary specimens derived from
three independent individuals: one newly diagnosed (primary) multiple myeloma
patient, one relapsed/refractory multiple myeloma patient, and one healthy donor
as a control. The final high-quality dataset comprised 9016 cells, consisting of
827 normal plasma cells from the healthy control, 5175 primary malignant cells
from the newly diagnosed patient, and 3014 recurrent malignant cells from the
relapsed patient. Reads were aligned to the hg38 genome, and peaks were
identified via MACS2. Quality control retained cells with a transcription start
site (TSS) enrichment score
This investigation encompassed three newly diagnosed, treatment-naïve MM patients alongside three untreated MGUS patients serving as controls. Tissue specimens underwent processing for both immunohistochemistry (IHC) and multiplex immunofluorescence (mIF) staining to evaluate UBE2S and DAP3 expression patterns. For IHC analysis, tissue specimens were deparaffinized and rehydrated, subsequently subjected to EDTA-mediated antigen retrieval, followed by serum-based blocking procedures. Primary antibodies targeting UBE2S (1:100, ab197945, Abcam, Cambridge, UK) and DAP3 (1:100, ab302889, Abcam, Cambridge, UK) were applied, with 3,3′-Diaminobenzidine (DAB) staining employed for visualization. Hematoxylin counterstaining was implemented, and images were acquired using light microscopy (BX53, Olympus, Tokyo, Japan).
For mIF analysis, specimens underwent EDTA antigen retrieval treatment and 3% hydrogen peroxide exposure in darkness for 25 minutes, succeeded by serum blocking. Primary antibodies underwent overnight incubation at 4 °C, after which fluorescent secondary antibodies were incubated for 1 hour. Nuclear staining was accomplished using 4′,6-diamidino-2-phenylindole (DAPI), and the slides were subsequently mounted employing antifade mounting medium. mIF signals for UBE2S (red), DAP3 (green), and nuclei (blue) were visualized under fluorescence microscopy. Tissue specimens were subjected to IHC and mIF staining procedures utilizing commercially available reagents and antibodies, with comprehensive details provided in Supplementary Tables 1,2.
Statistical analyses were conducted utilizing R language (version 4.3.3,
Foundation for Statistical Computing, Vienna, Austria), Comparisons between two
groups were performed using the Wilcoxon rank-sum test, while comparisons among
three or more groups were conducted using the Kruskal-Wallis test. A p
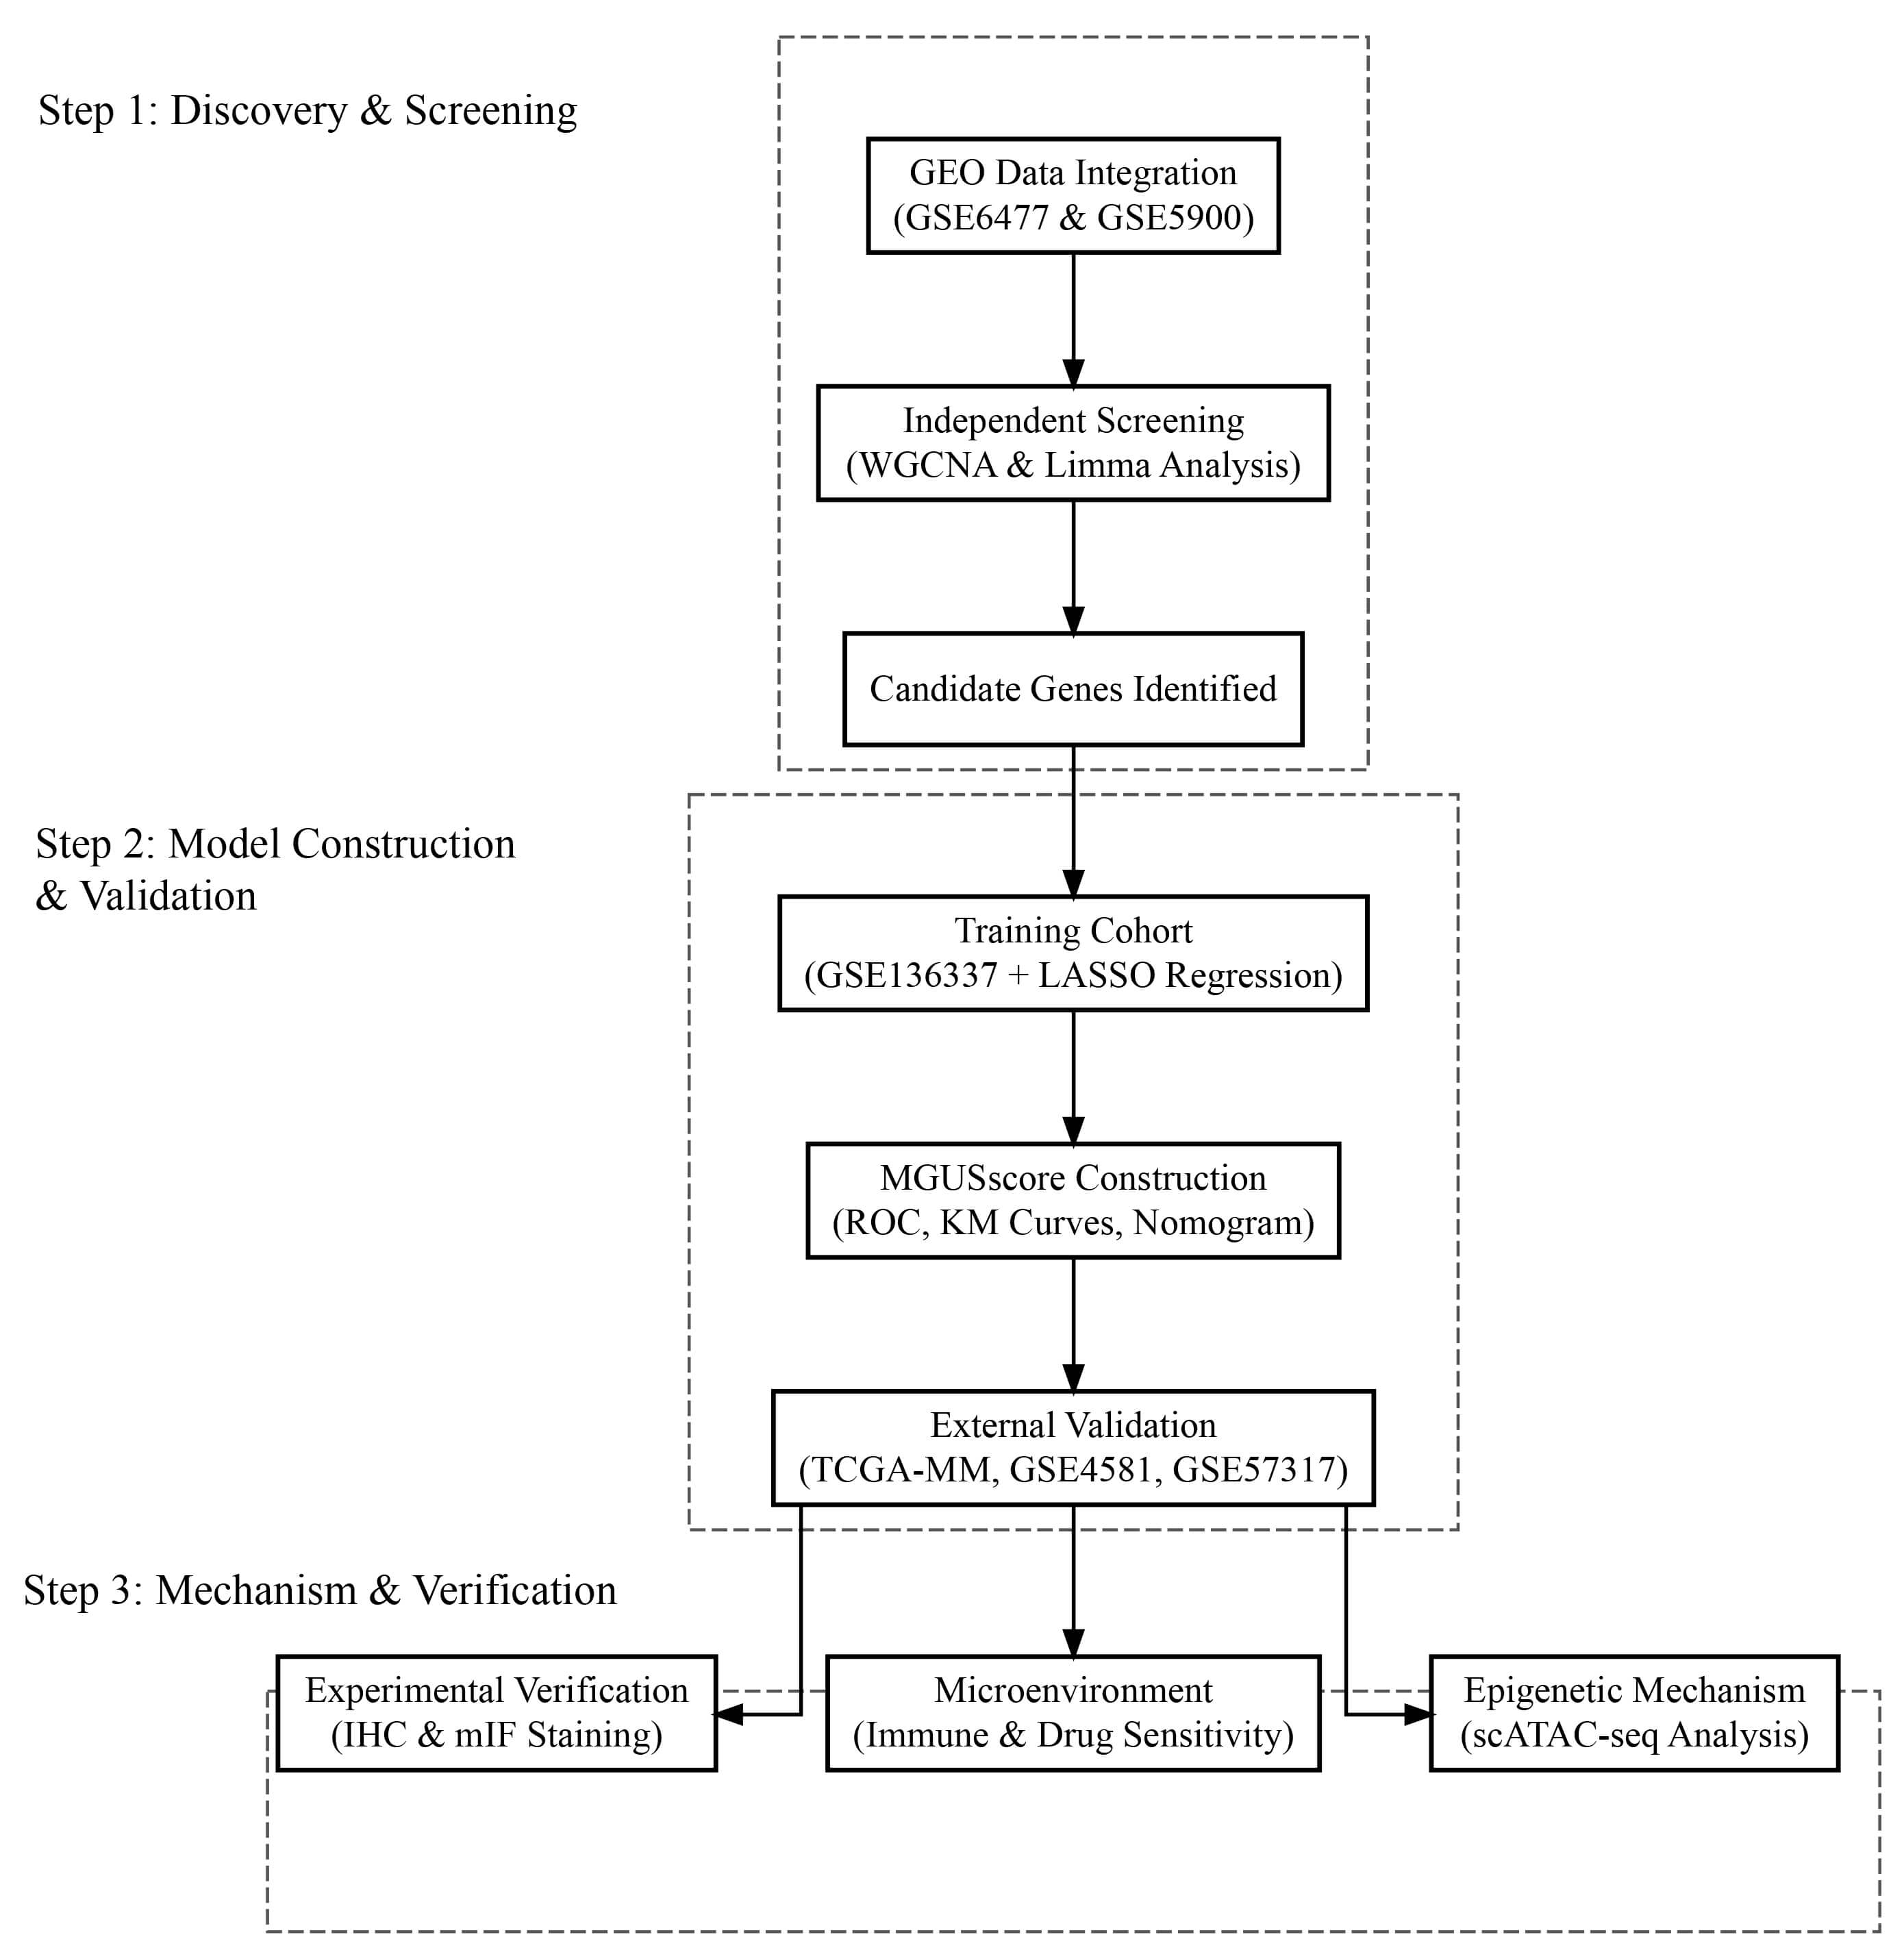 Fig. 1.
Flowchart illustrating the comprehensive study design, bioinformatic analysis, and experimental validation workflow. GEO, Gene Expression Omnibus; WGCNA, weighted gene co-expression network analysis; LASSO, least absolute shrinkage and selection operator; ROC, receiver operating characteristic; KM, Kaplan–Meier; IHC, immunohistochemistry; mIF, multiplex immunofluorescence; scATAC-seq, single-cell assay for transposase-accessible chromatin with sequencing.
Analysis of the GSE6477 dataset identified 961 DEGs between patients with MM and
healthy controls (Fig. 2A). Conversely, the GSE5900 dataset revealed 355 DEGs
between MGUS and normal controls (Fig. 2B). Heatmaps in Fig. 2C,D depict the 20
DEGs. Using WGCNA on the GSE6477 dataset, 12 gene modules significantly
associated with MM were identified, each uniquely color-coded (Fig. 3A,B). The
green, yellow, blue, and black modules demonstrated strong correlations with MM,
with correlation coefficients and statistical significances as follows: green
(r = –0.61, p = 4
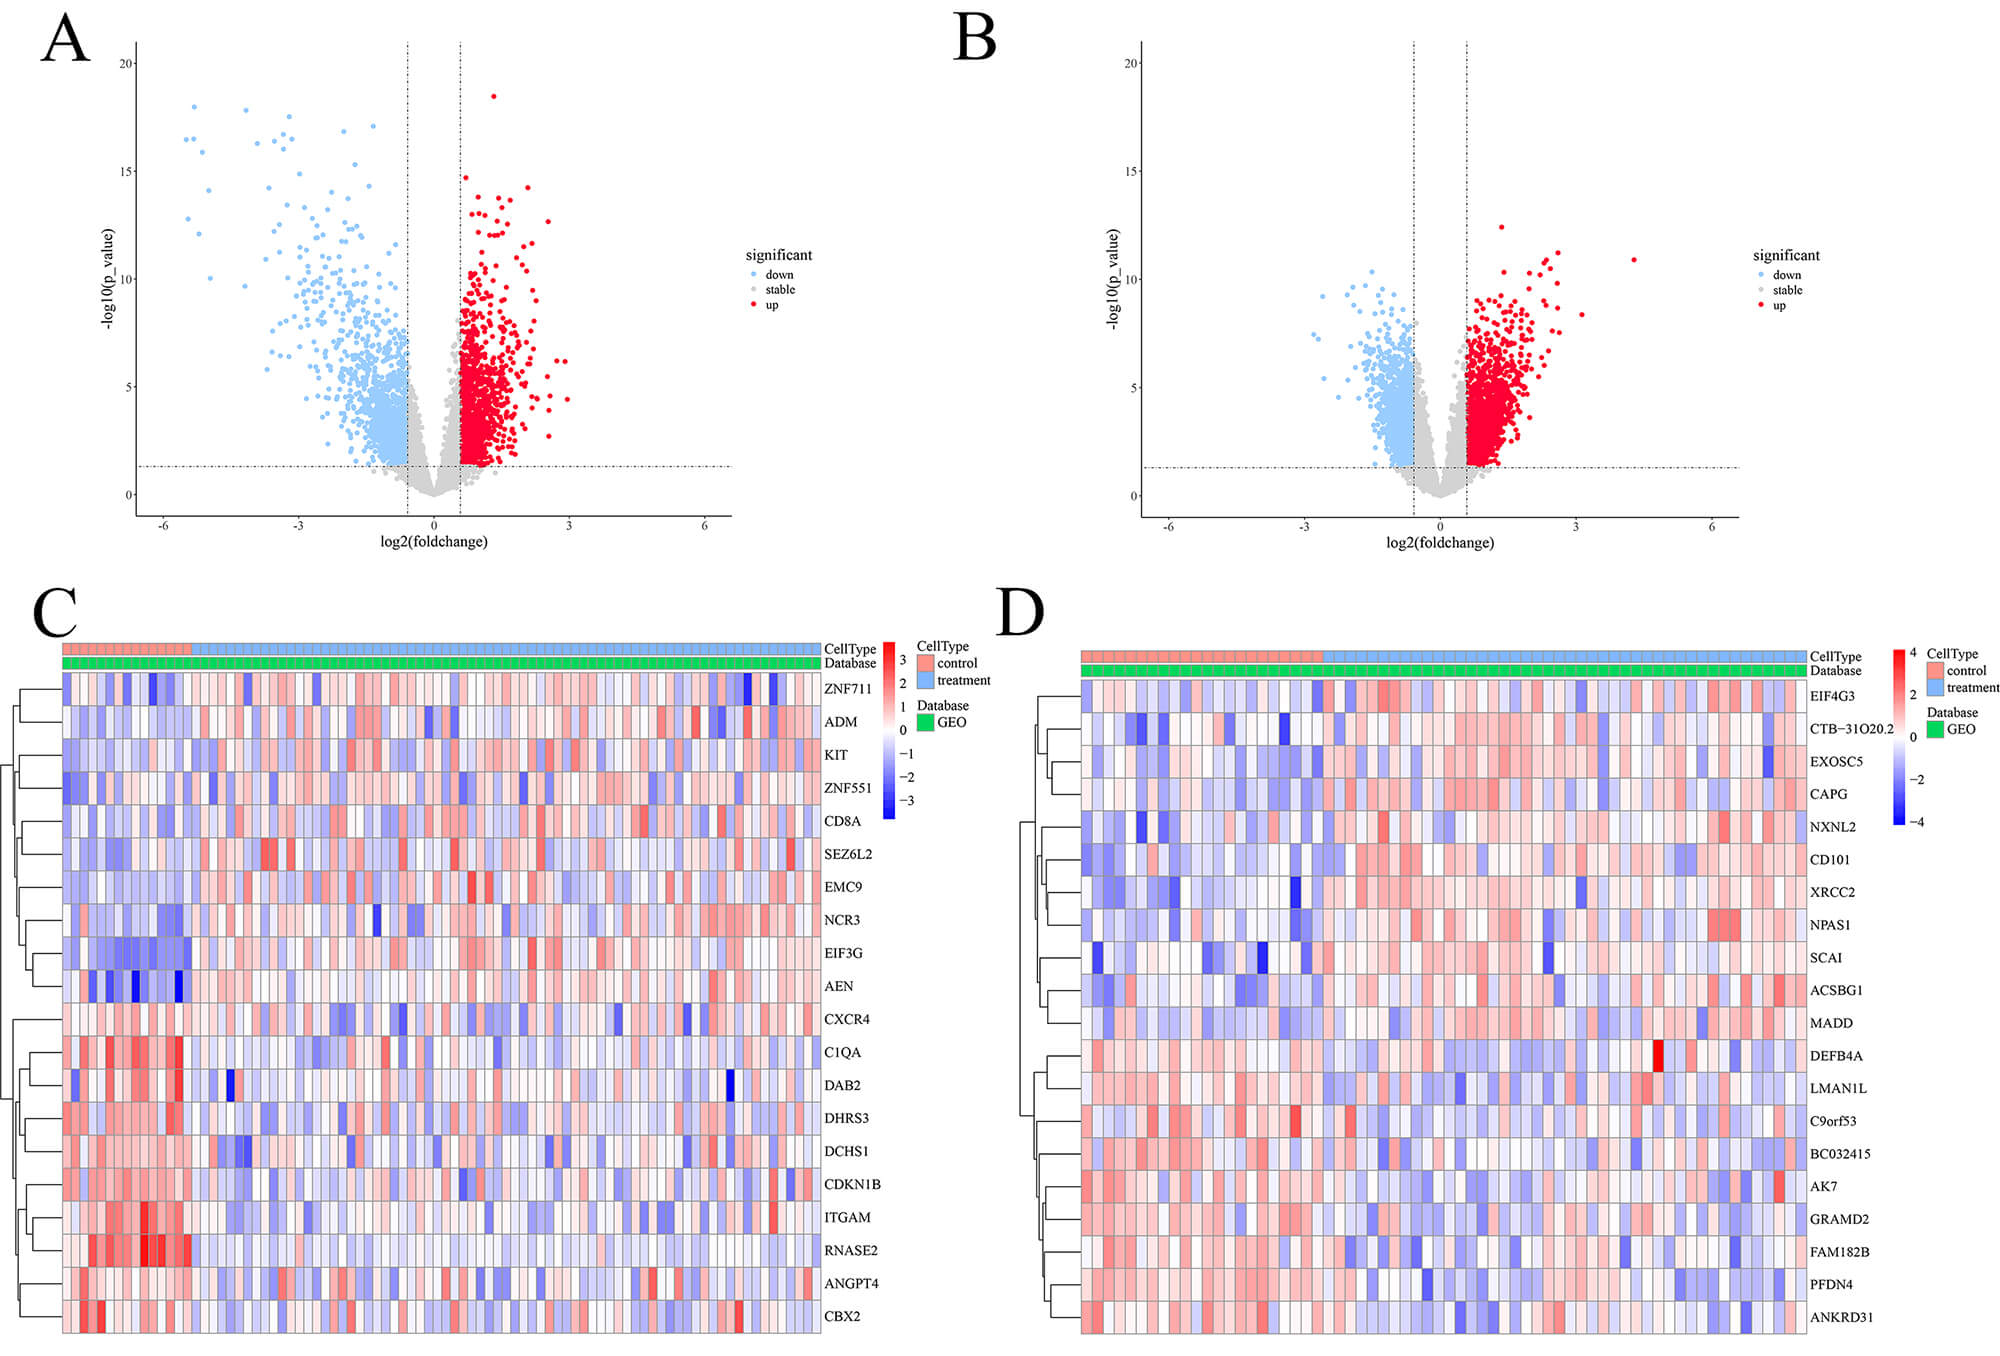 Fig. 2.
DEGs in MM and MGUS cohorts. (A,B) Volcano plots depicting the differential expression analysis in the consolidated cohorts of GSE6477 (A) and GSE5900 (B). Red dots indicate significantly upregulated genes, blue dots indicate downregulated genes, and gray dots represent genes with no significant difference. (C,D) Heatmaps displaying the expression profiles of the top 20 DEGs in MM (C) and MGUS (D). Columns represent samples (Control vs. Treatment) and rows represent genes. The color scale ranges from blue (low expression) to red (high expression). DEGs, differentially expressed genes; MGUS, monoclonal gammopathy of undetermined significance.
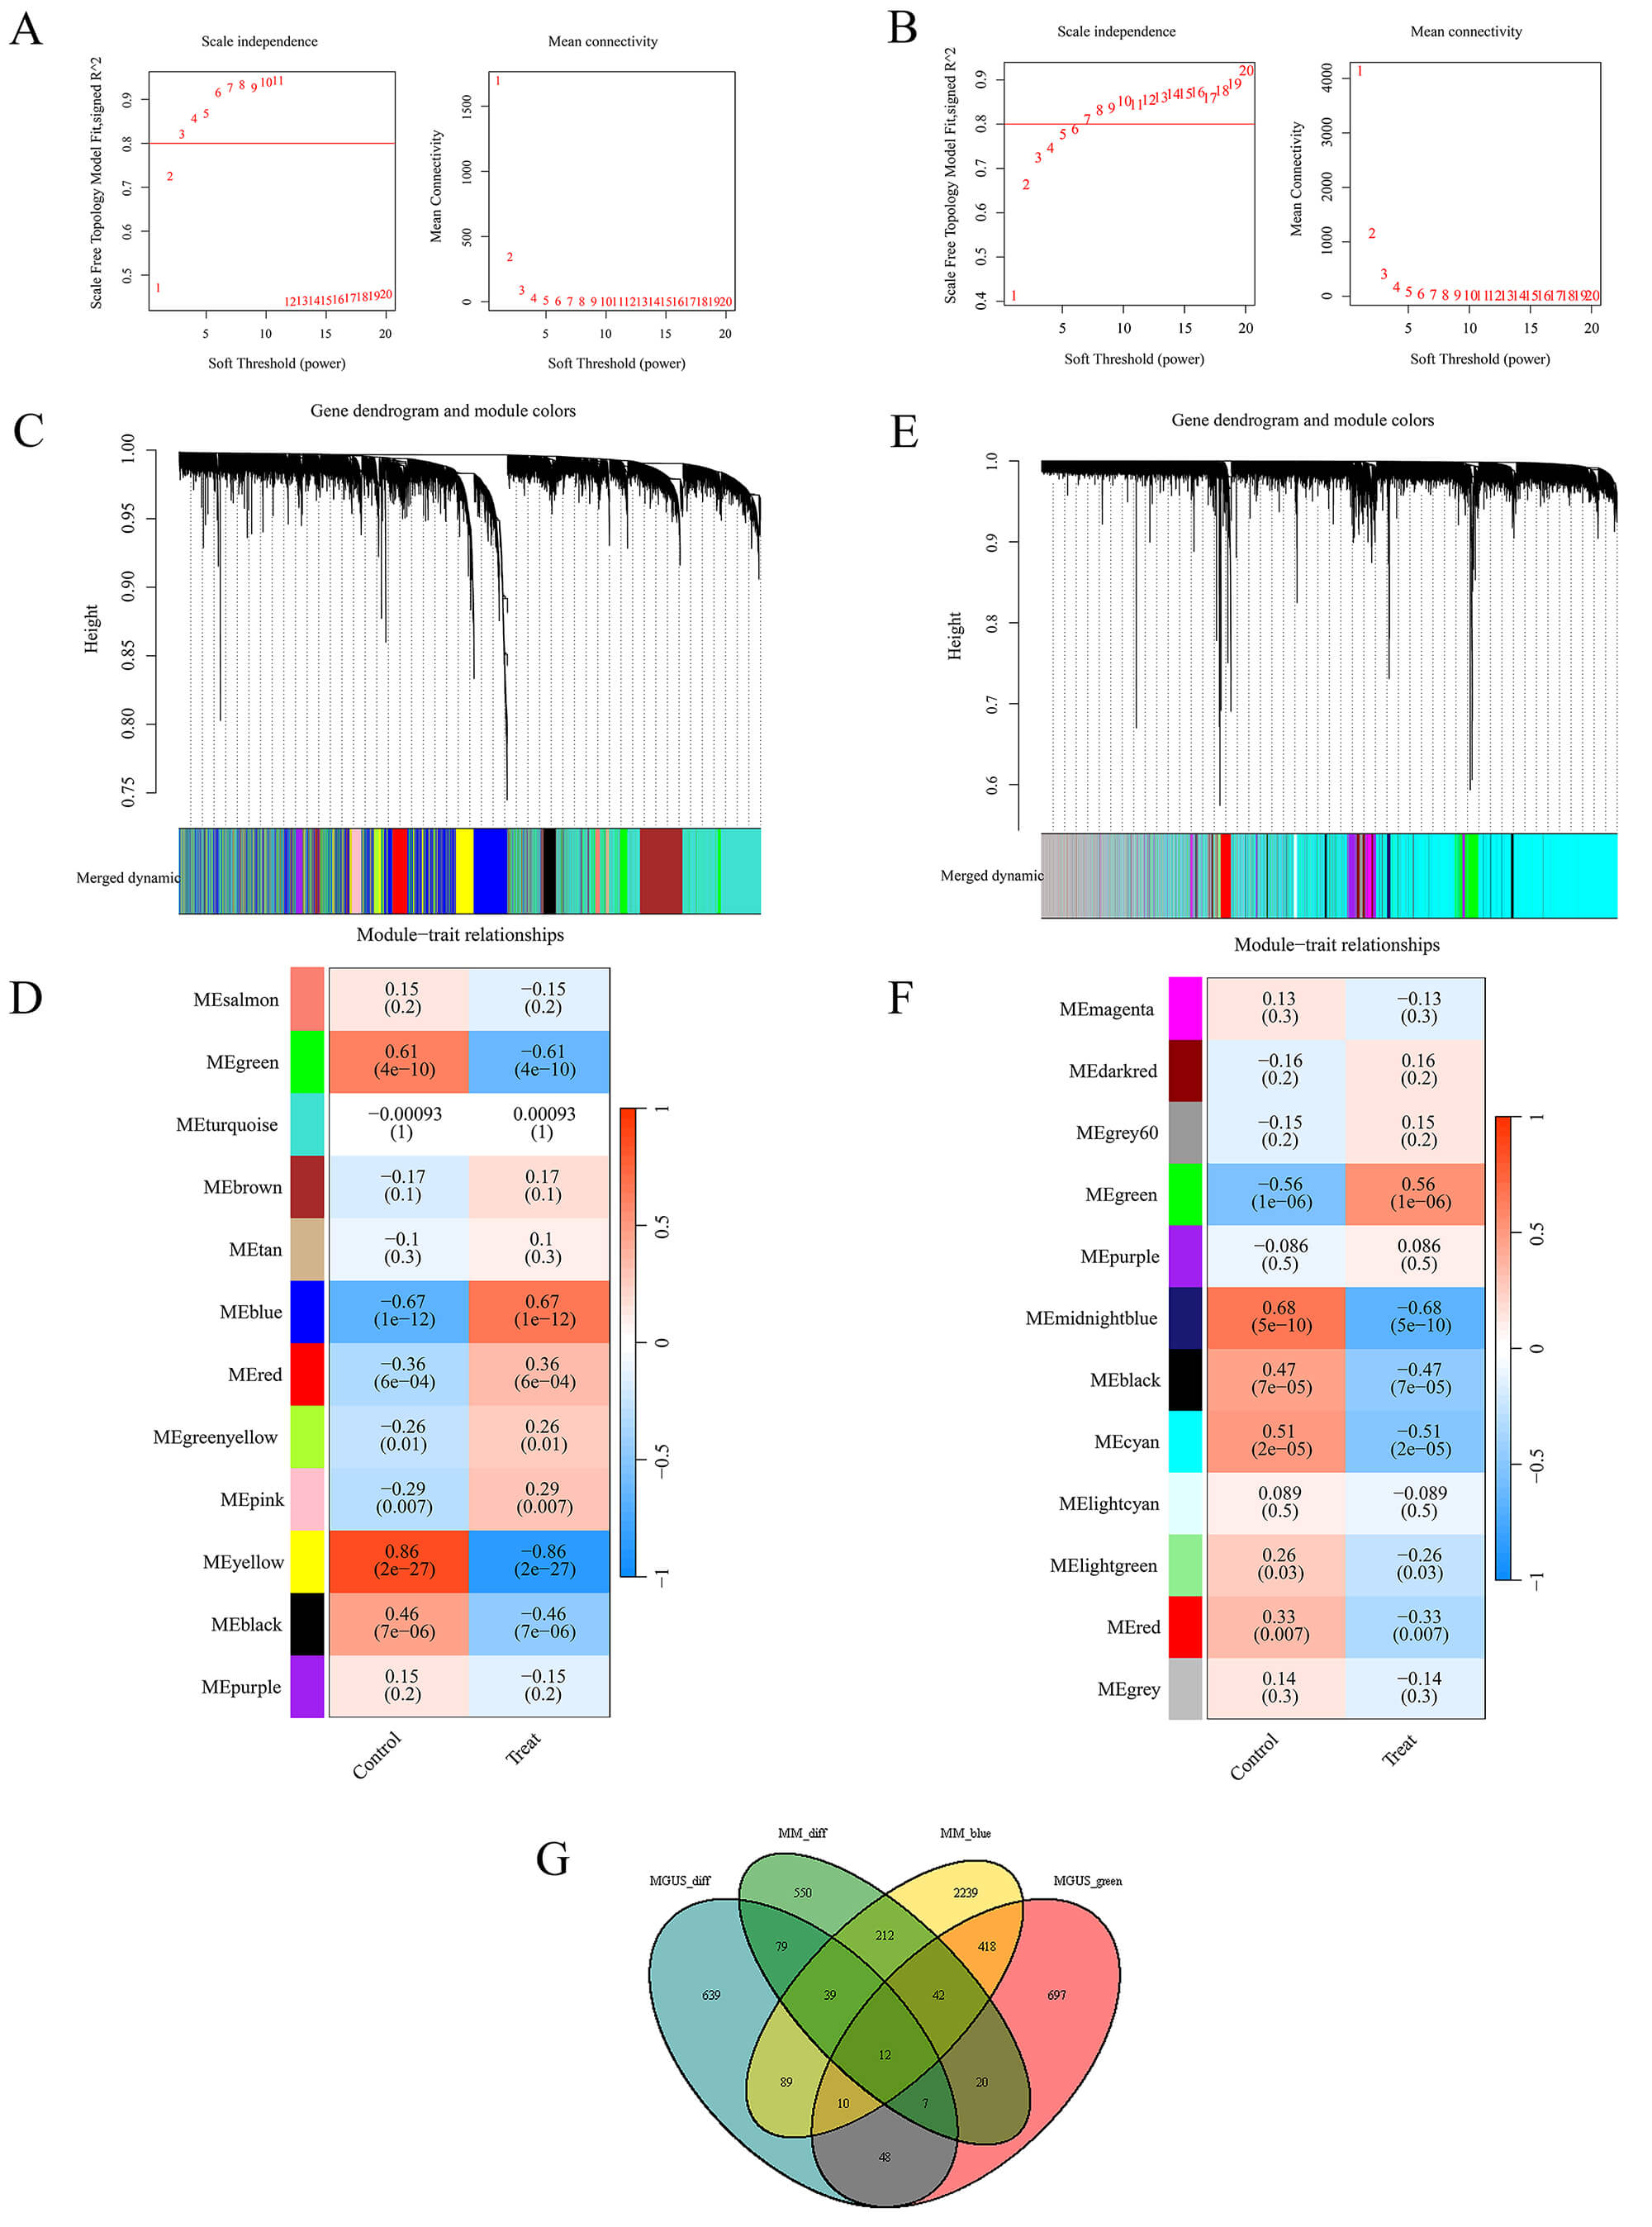 Fig. 3.
WGCNA analysis conducted across MM and MGUS patient cohorts. (A,B) Analysis of network topology for soft-thresholding power selection in MM (A) and MGUS (B) specimens. Left panels show the scale-free fit index (y-axis) versus soft-thresholding power (x-axis); right panels display mean connectivity. (C) Hierarchical clustering dendrogram depicting MM gene organization, where distinct chromatic representations indicate separate co-expression modules. (D) Heat map visualization illustrating module-trait correlations within MM datasets. (E) Hierarchical clustering dendrogram depicting MGUS gene organization, where distinct chromatic representations indicate separate co-expression modules. (F) Heat map visualization illustrating module-trait correlations within MGUS datasets. (G) Venn diagram illustrating the intersection of genes between identified key WGCNA modules (MMblue, MGUSgreen) and differentially expressed genes (MMdiff, MGUSdiff).
Diagnostic performance of the 12 intersection genes was assessed through ROC curve analysis utilizing the GSE6477 dataset. The area under the curve (AUC) serves as a metric for evaluating diagnostic accuracy. Proximity to 1.0 in AUC values signifies superior diagnostic precision, whereas values approximating 0.5 reflect diminished discriminatory power. An AUC of 0.5 represents a lack of meaningful diagnostic differentiation. The graphical representation in Fig. 4 reveals that each of the 12 genes exhibits AUC values exceeding 0.8, thereby indicating substantial diagnostic potential for MM.
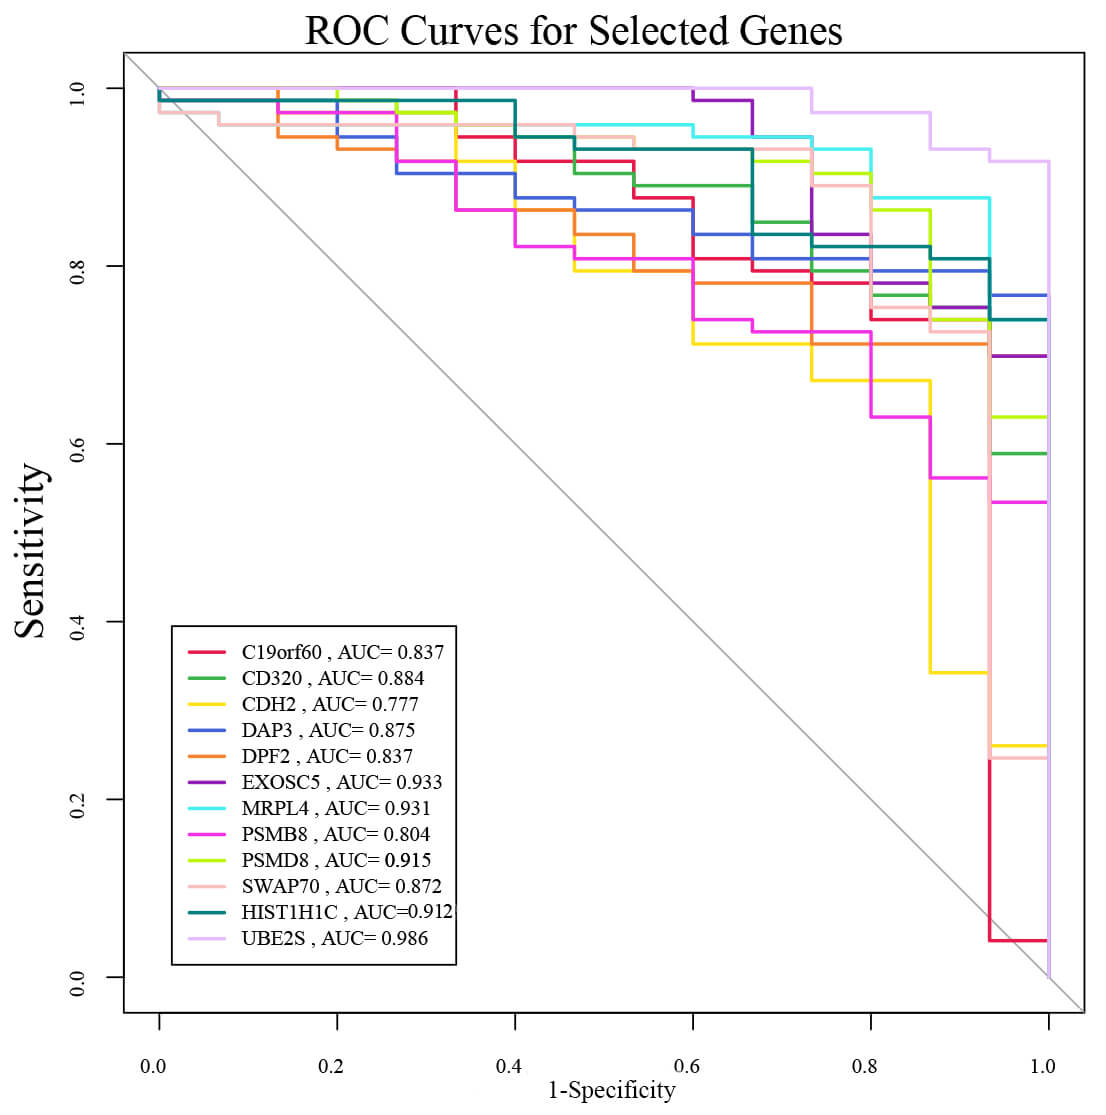 Fig. 4.
ROC analysis of 12 candidate genes in GSE6477. The AUC reflects predictive accuracy. AUC, area under the curve.
The GSE136337 and TCGA datasets, encompassing OS and status information of MM
patients, were initially retrieved for analytical purposes. Within GSE136337, two
patients exhibiting a survival duration of 0 were eliminated from the analytical
framework. GSE136337 was designated as the training cohort for risk model
development, whereas TCGA-MM, in conjunction with GSE136337, was employed to
identify pivotal prognostic genes and subsequently utilized for model validation.
Within the training cohort, univariate Cox regression analysis was initially
executed to ascertain genes demonstrating significant association with OS
(p
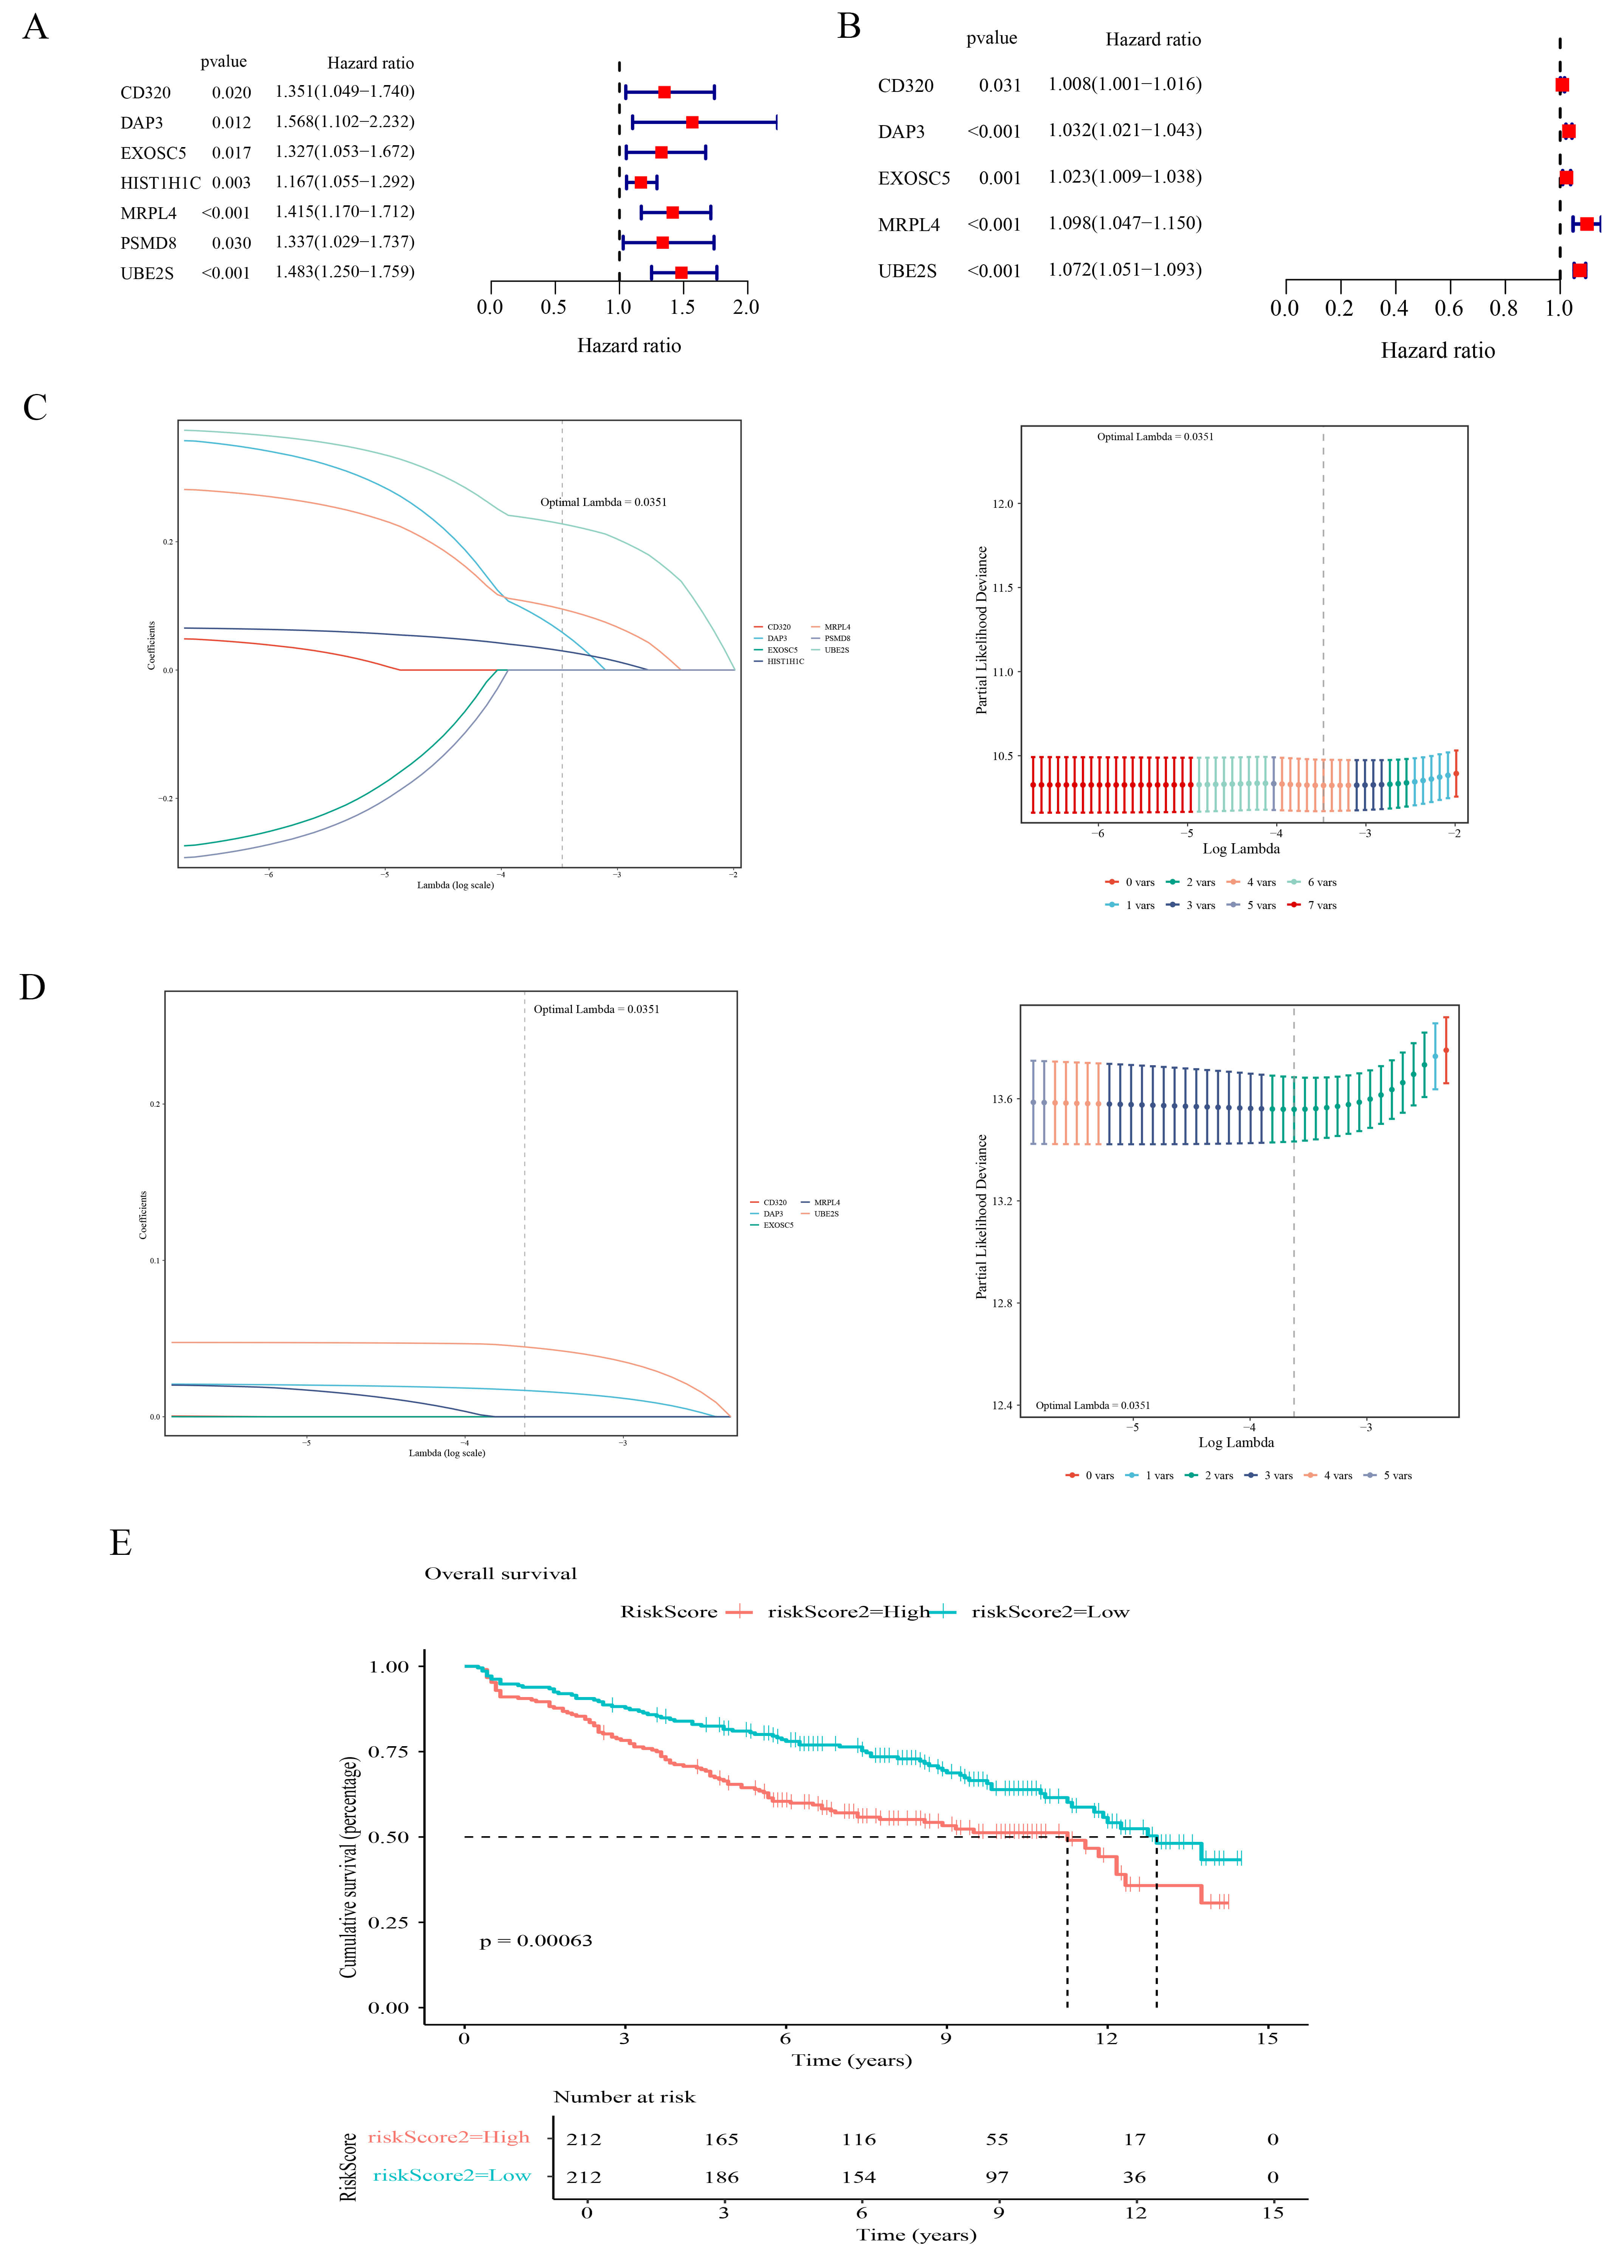 Fig. 5.
Development of the prognostic model utilizing candidate genes. (A,B) Forest plots of univariate Cox analysis in GSE136337 (A) and TCGA-MM (B). Squares represent Hazard Ratios (HR) and horizontal lines indicate 95% Confidence Intervals (CI). (C,D) LASSO regression analysis in GSE136337 (C) and TCGA-MM (D). Left panels: coefficient profiles; Right panels: parameter selection via 10-fold cross-validation. (E) K-M survival curves of MM patients stratified by MGUSscore in GSE136337. Patients were stratified by median risk score into high-risk (red) and low-risk (blue) groups.
Significant differences were observed regarding ISS stage, LDH,
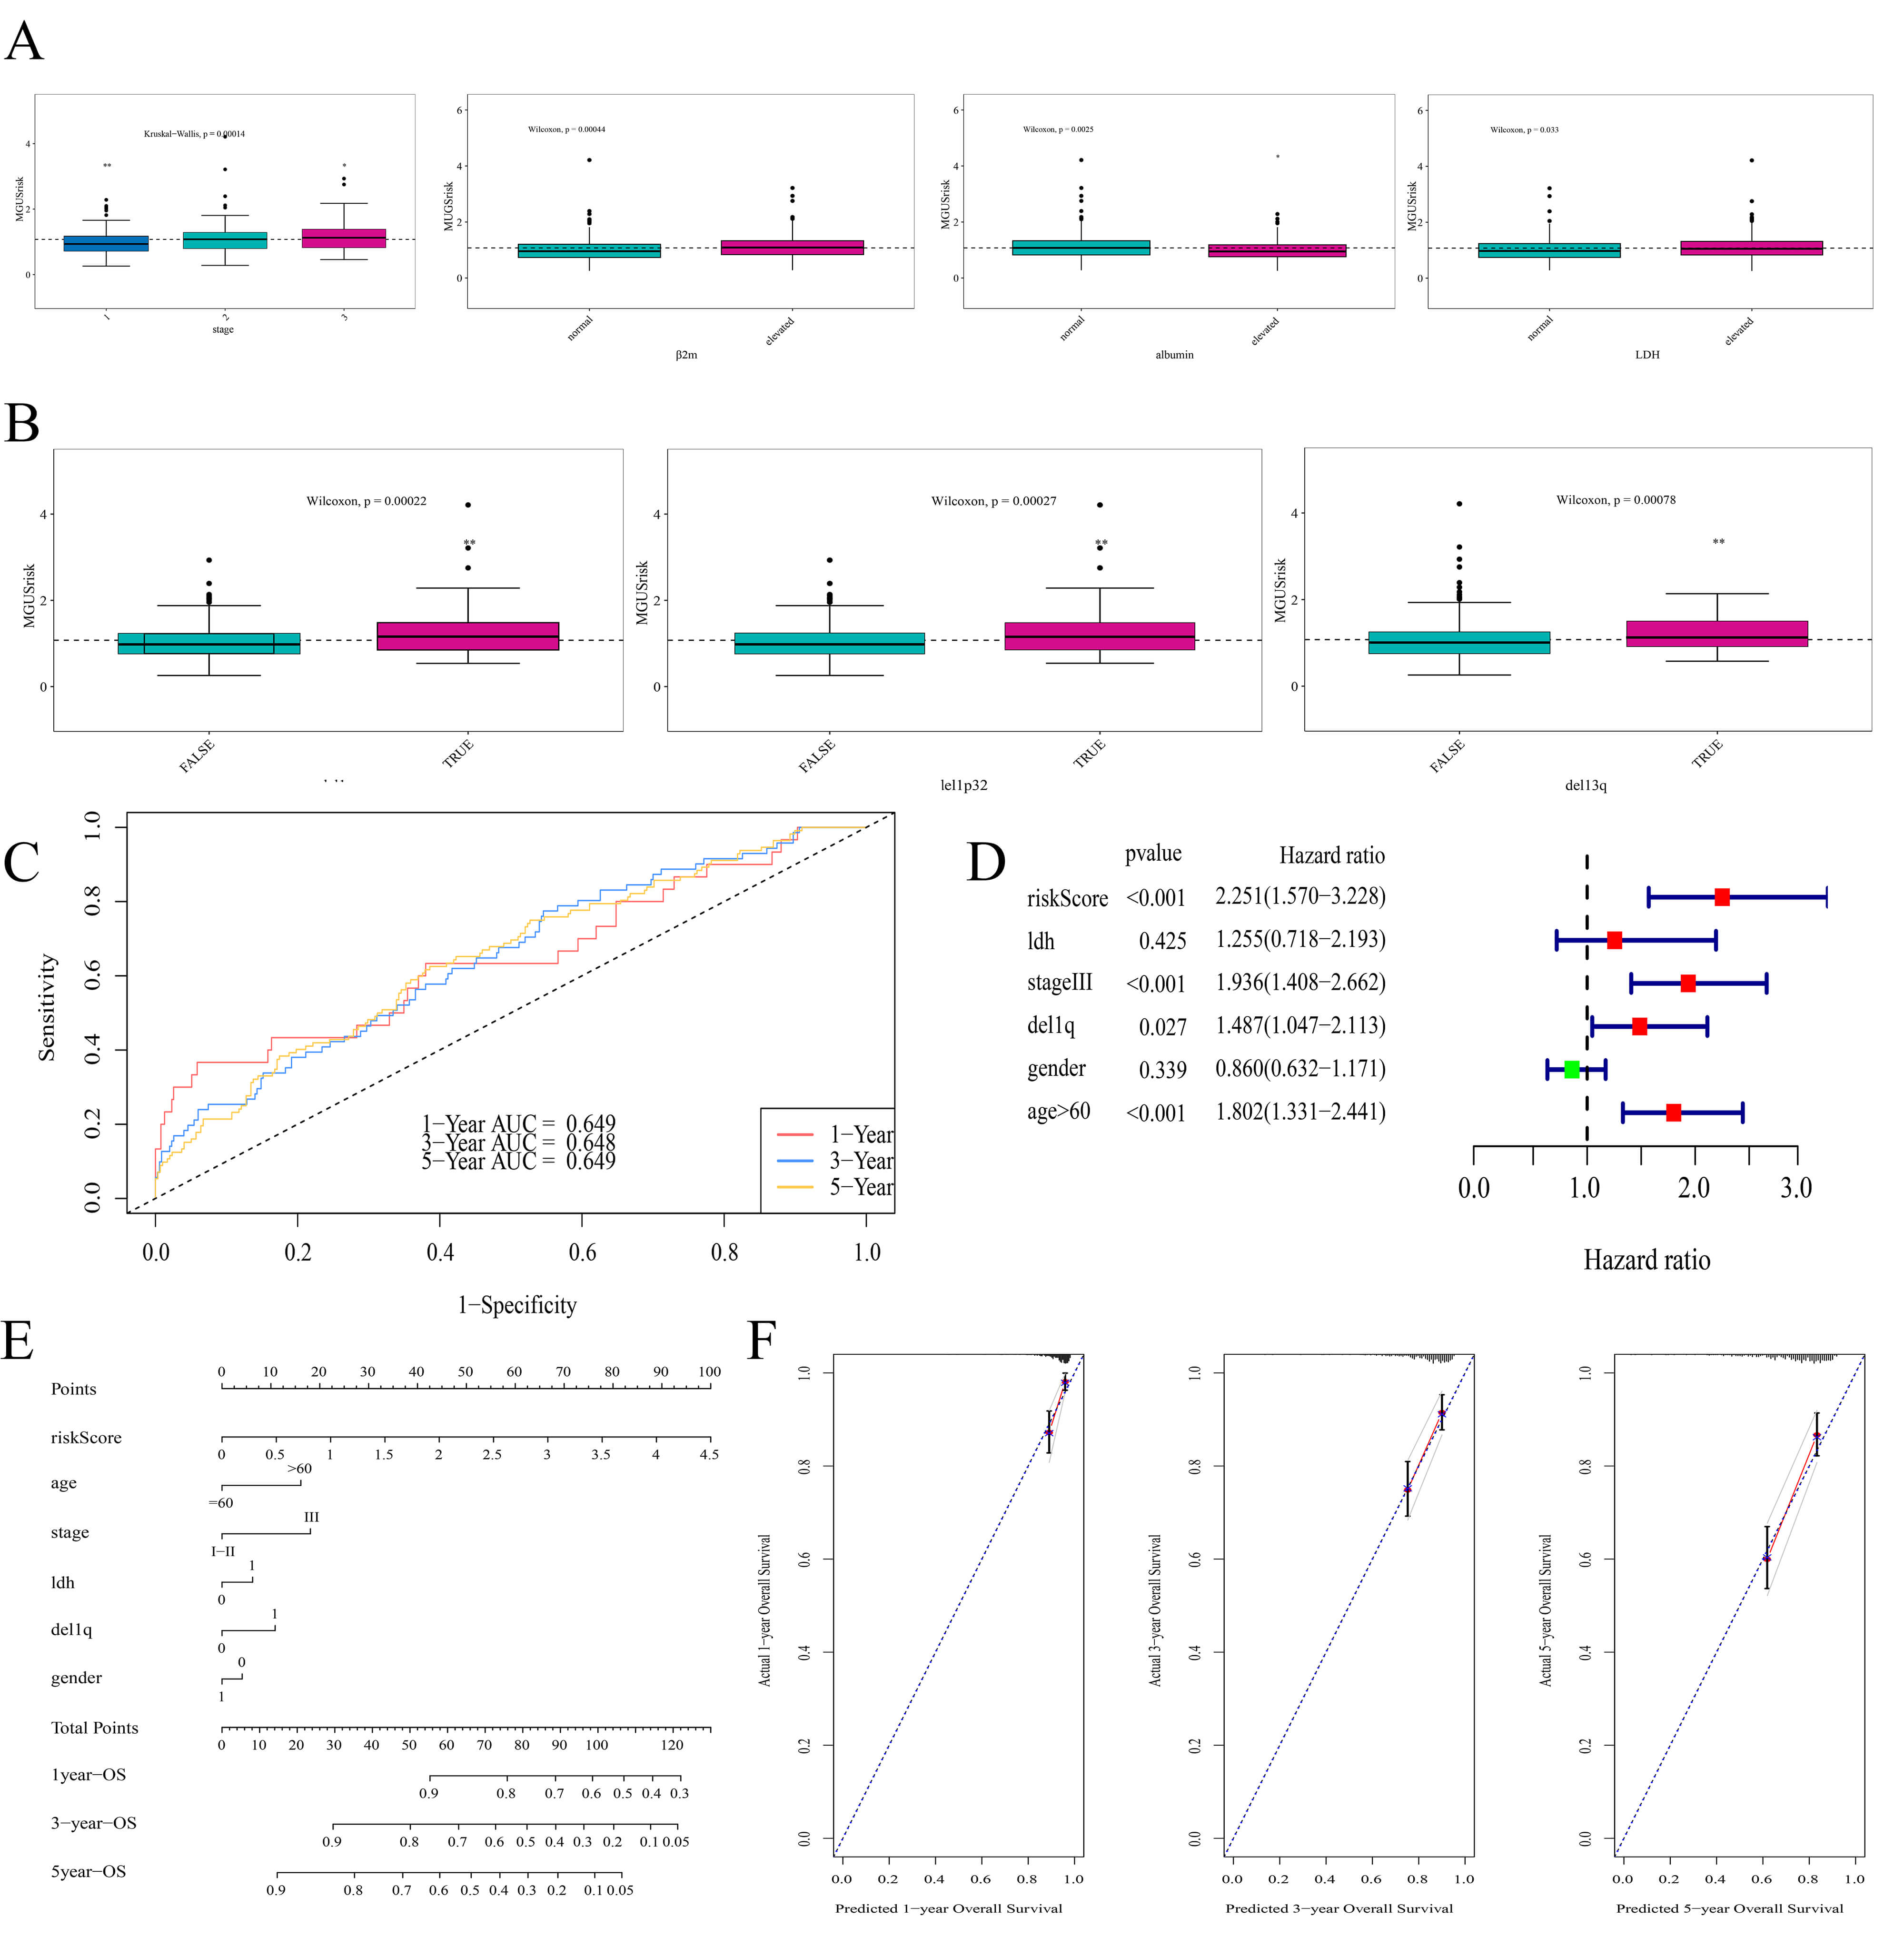 Fig. 6.
Clinical relevance and prognostic performance of MGUSscore. (A)
Correlation between disease stage,
The prognostic effectiveness of the MGUSscore received subsequent validation through three independent cohorts. K–M survival analyses uniformly demonstrated that patients classified in the high-risk cohort exhibited notably diminished OS versus their low-risk counterparts across all datasets (Fig. 7A–C). Time-dependent ROC curve analyses further substantiated the model’s generalizability. In the TCGA-MM cohort, AUC values for 1-, 3-, and 5-year OS were ascertained as 0.660, 0.690, and 0.690, respectively (Fig. 7D). For the GSE4581 cohort, AUC values for 1-, 3-, and 5-year OS were procured as 0.661, 0.678, and 0.697, respectively (Fig. 7E). Likewise, in the GSE57317 cohort, AUC values for 1-, 2-, and 3-year OS all exceeded 0.7 (Fig. 7F).
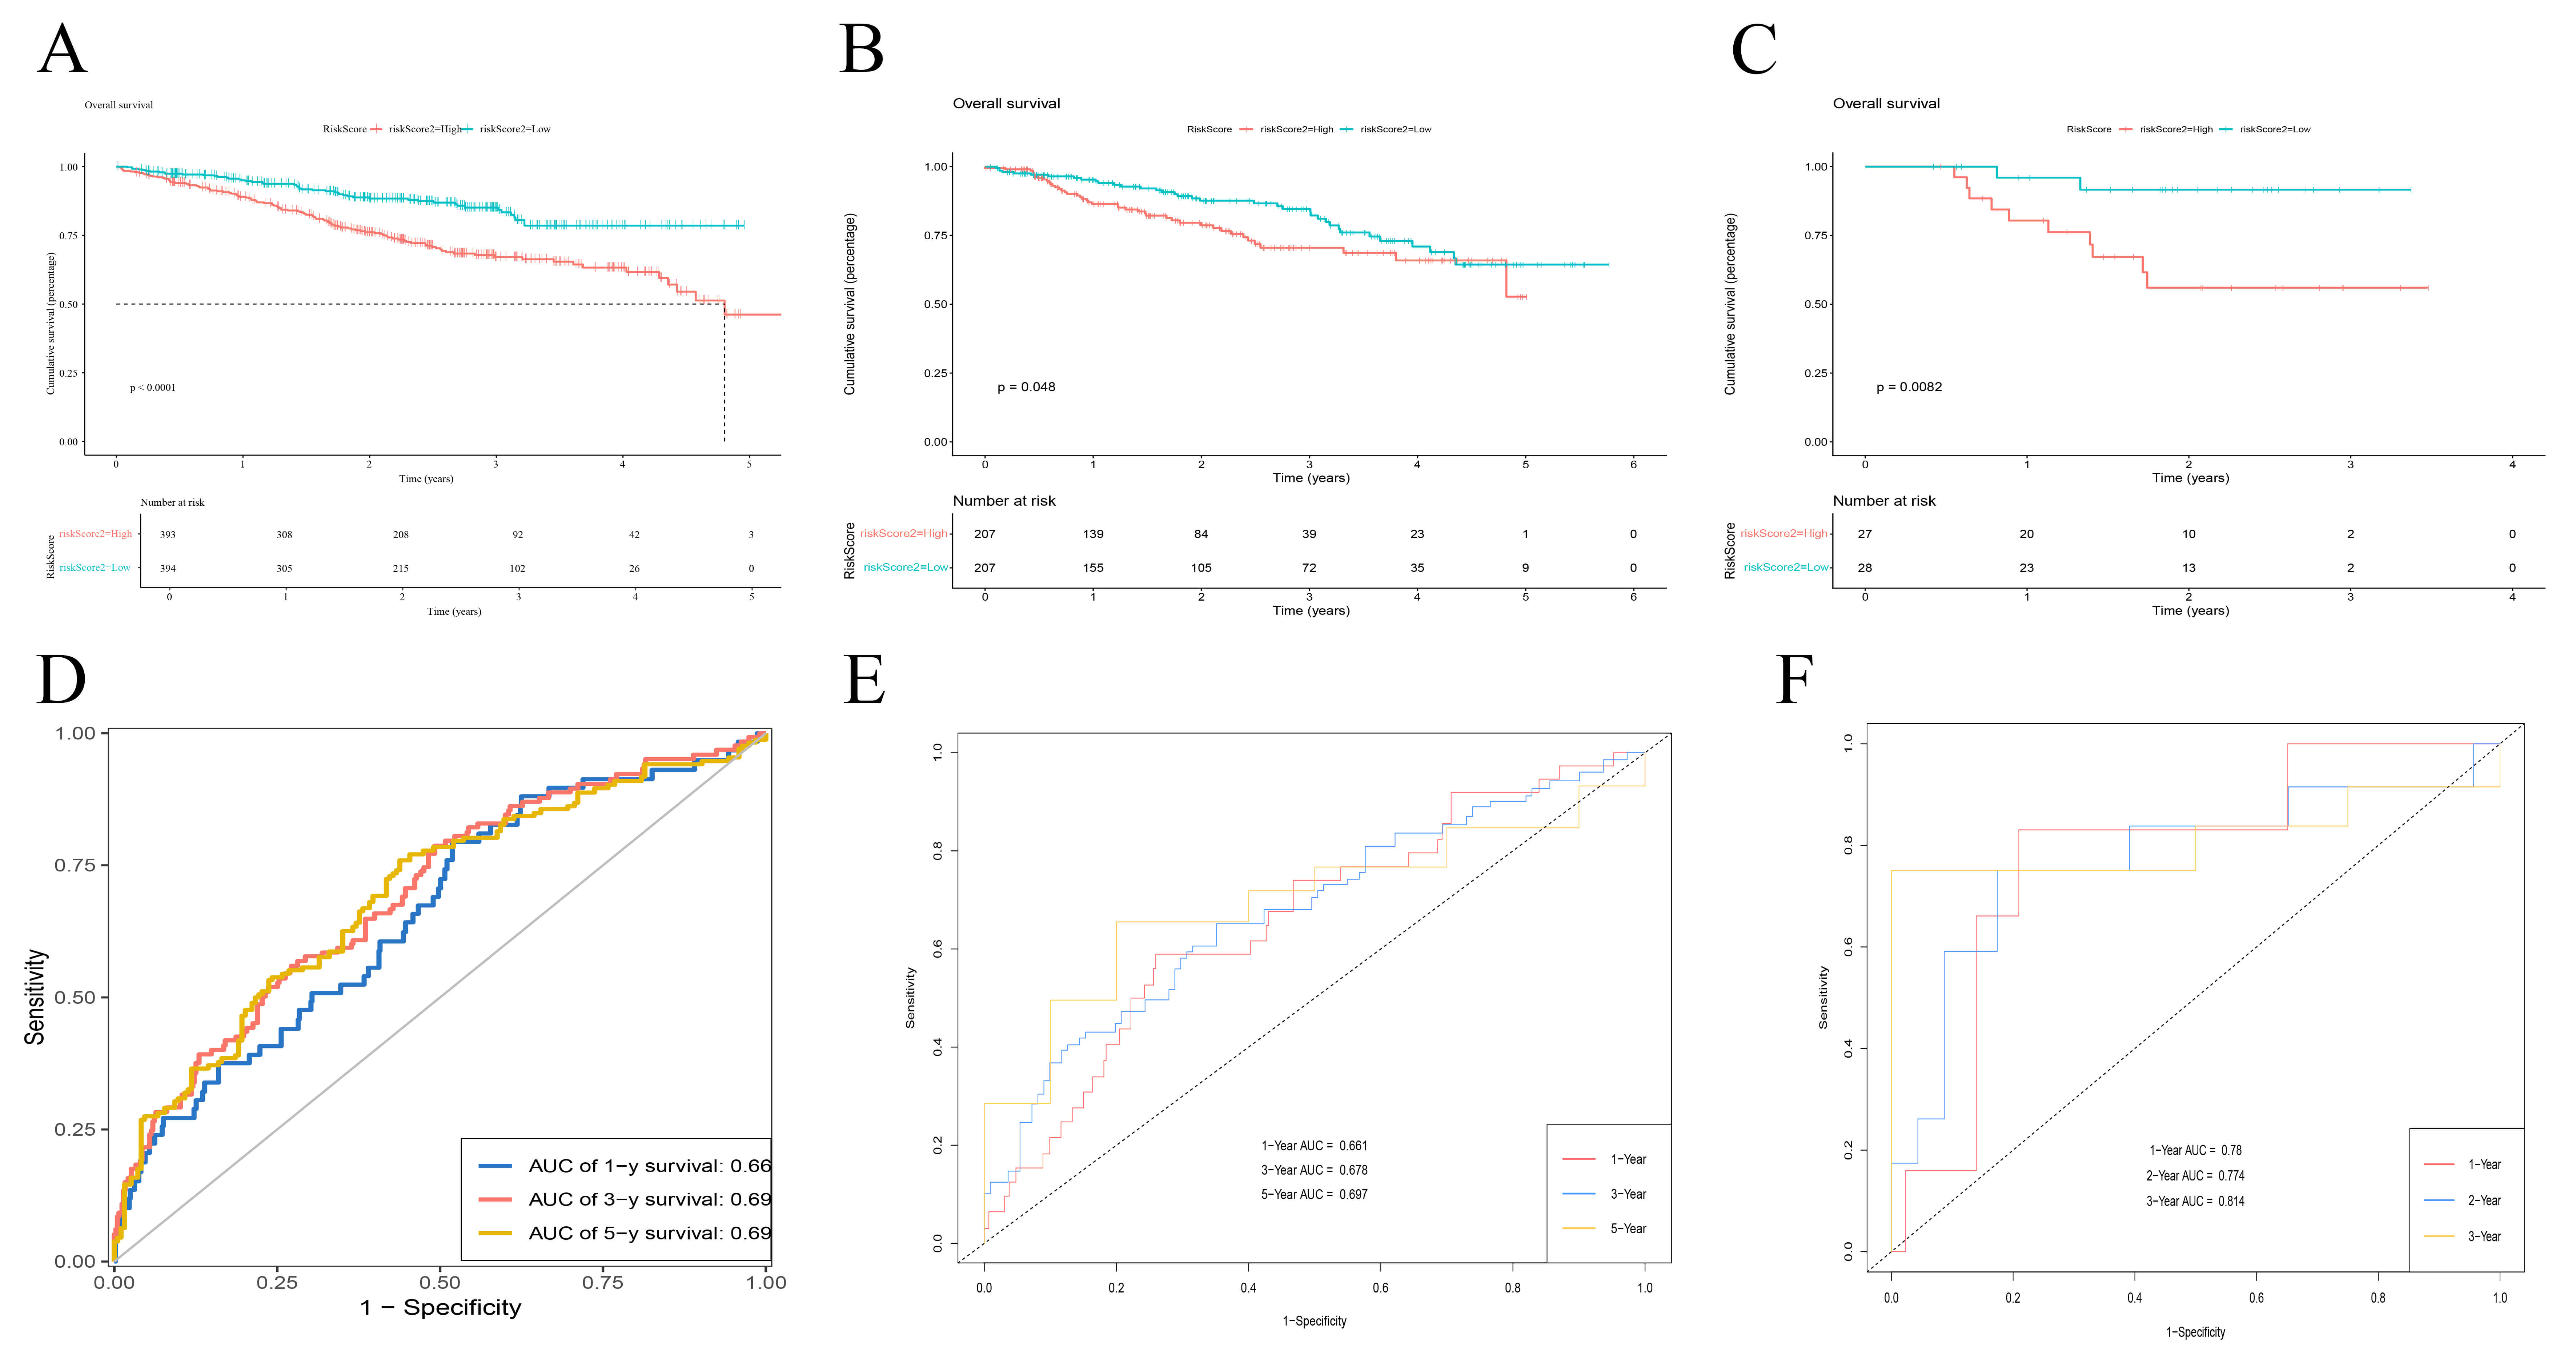 Fig. 7.
Prognostic validation of MGUSscore across multiple cohorts. (A–C) Kaplan-Meier overall survival curves for the TCGA-MM (A), GSE4581 (B), and GSE57317 (C) cohorts. Patients were stratified into high-risk (red) and low-risk (blue) groups based on the median MGUSscore. p-values were calculated using the log-rank test. (D–F) Time-dependent ROC curves evaluating the prognostic accuracy of MGUSscore. Panels display the Area Under the Curve (AUC) for predicting: (D) 1-, 3-, and 5-year overall survival in TCGA-MM; (E) 1-, 3-, and 5-year overall survival in GSE4581; (F) 1-, 2-, and 3-year overall survival in GSE57317.
Differential expression validation of DAP3 and UBE2S genes through the GSE6477 dataset demonstrated statistically significant elevation in MM patient populations relative to MGUS subjects and normal individuals (Fig. 8A). Subsequent clinical investigations utilizing the GSE136337 dataset indicated that elevated genetic expression of these specific genes linked to diminished OS and progression-free survival (PFS) parameters (Fig. 8B,C). Moreover, DAP3 and UBE2S exhibited a link to the ISS of MM (Fig. 9A). Additionally, elevated UBE2S expression was linked to chromosomal abnormalities, including 1 del1p, del13q, and del1p32, whereas DAP3 was linked exclusively to del13q (Fig. 9B–D). These observations suggest that DAP3 and UBE2S may contribute to the malignant progression of MM.
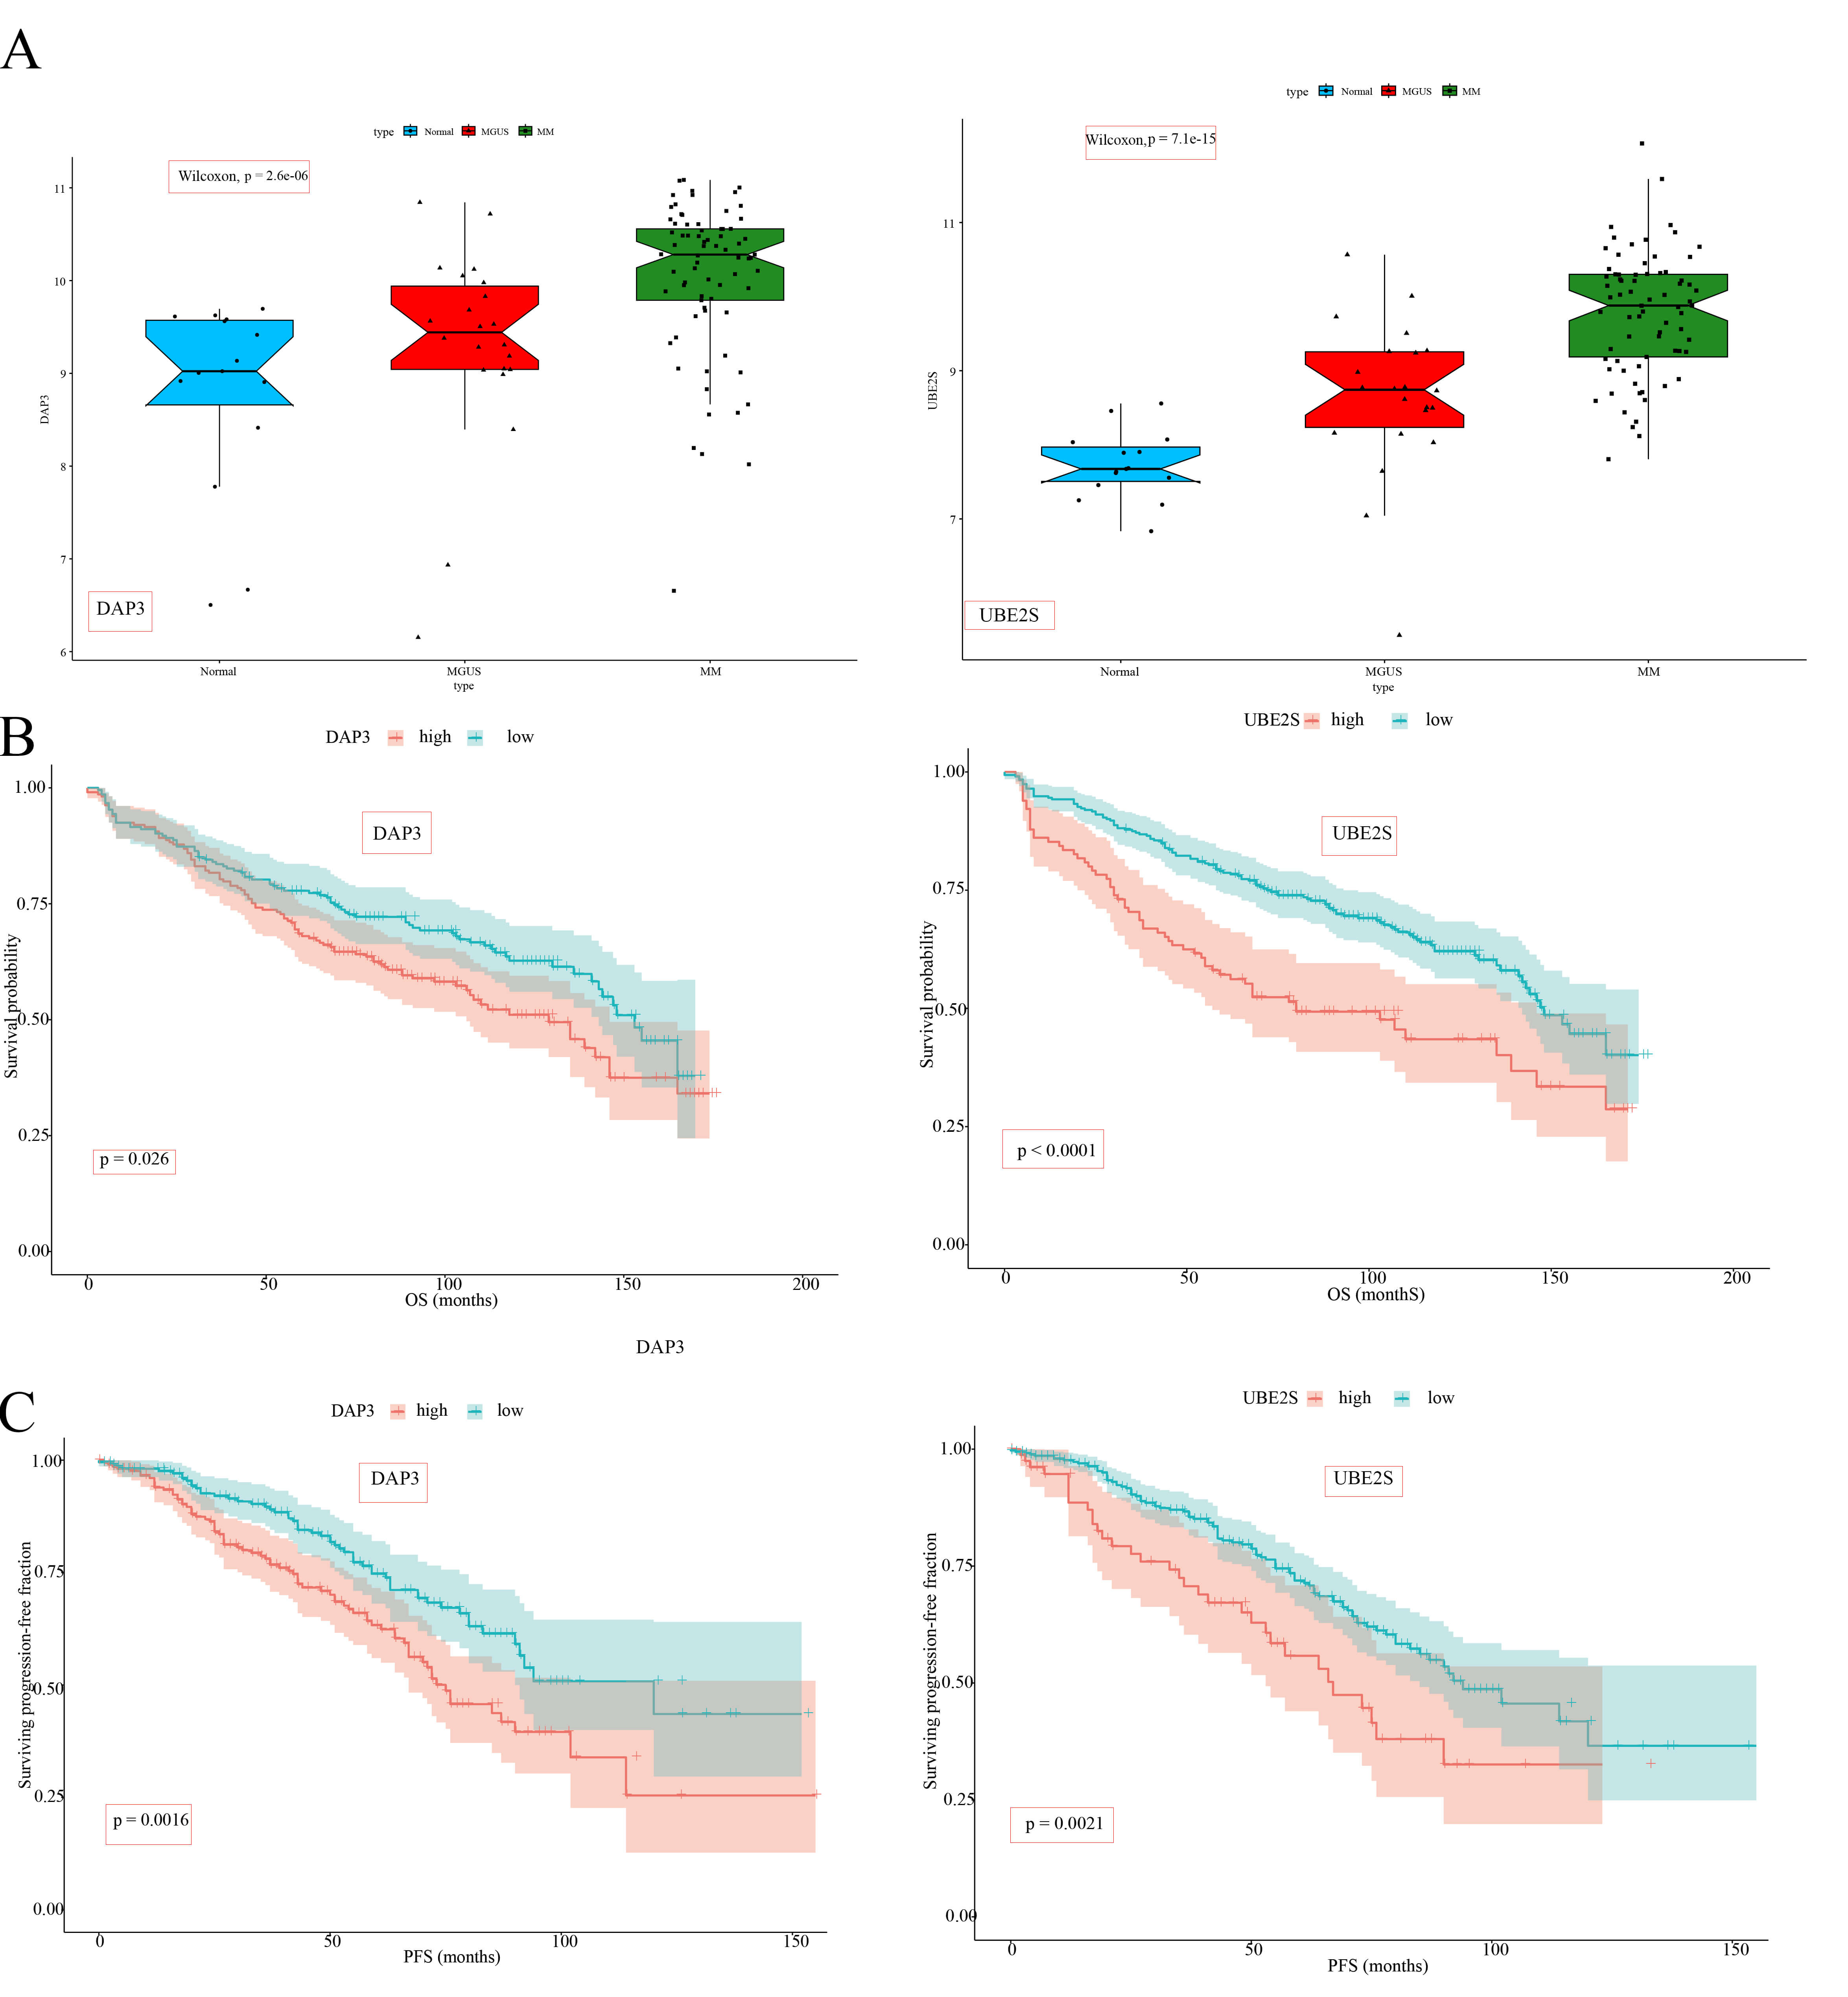 Fig. 8.
Expression patterns and prognostic implications of DAP3 and UBE2S in MM. (A) Boxplots comparing the expression levels of DAP3 and UBE2S across Normal (blue), MGUS (red), and MM (green) groups in the GSE6477 dataset. (B) K–M survival curves demonstrating the correlation between DAP3 and UBE2S expression levels and OS in MM patients derived from the GSE136337 cohort. Patients were stratified into high-expression (red) and low-expression (blue) groups based on optimal cut-off values. (C) K–M survival curves depicting the link between DAP3 and UBE2S expression levels and PFS in MM patients derived from the GSE136337 cohort. Color coding and stratification are consistent with (B).
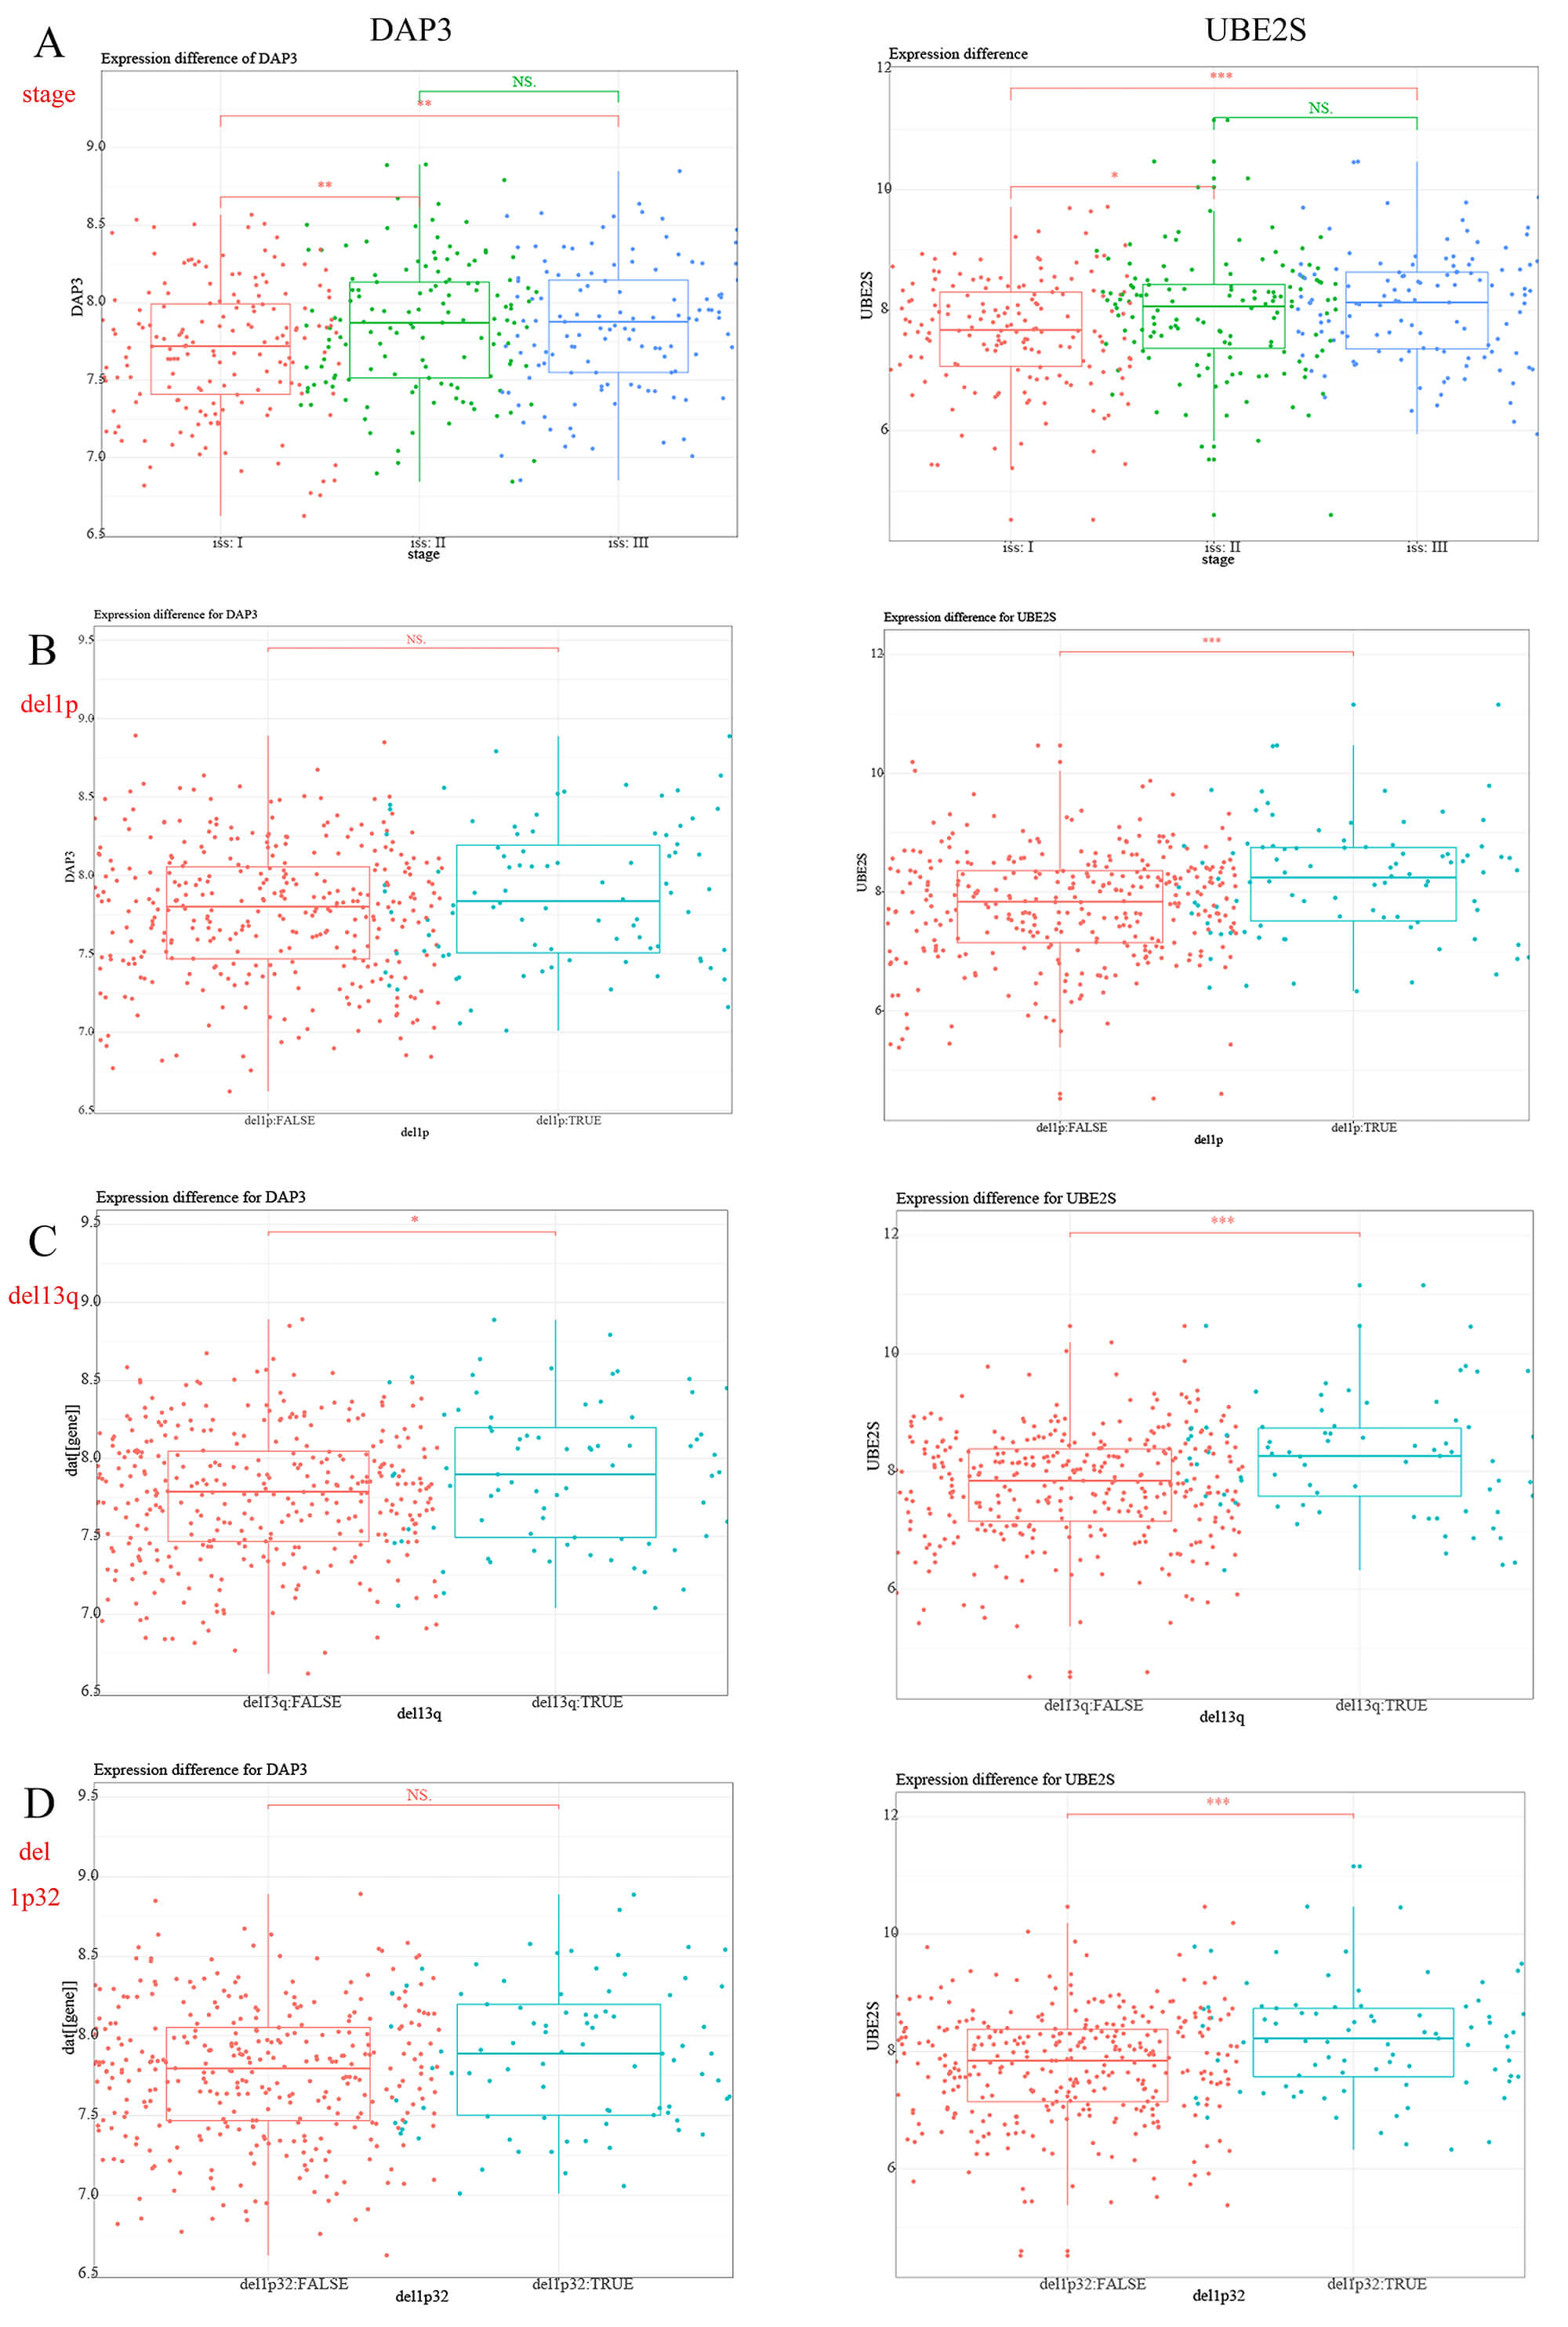 Fig. 9.
Correlation of DAP3 and UBE2S expression levels with clinical
and cytogenetic characteristics in MM. (A) Boxplots comparing DAP3
(left) and UBE2S (right) expression levels across International Staging
System (ISS) stages: Stage I (red), Stage II (green), and Stage III (blue).
(B–D) Boxplots comparing gene expression between patients with and without
specific chromosomal deletions: (B) del(1p), (C) del(13q), and (D) del(1p32).
Patients are stratified by the absence (red, FALSE) or presence (blue, TRUE) of
the deletion. Statistical significance: *p
Comparative expression analysis executed between the two risk cohorts identified
a sum of 108 DEGs (
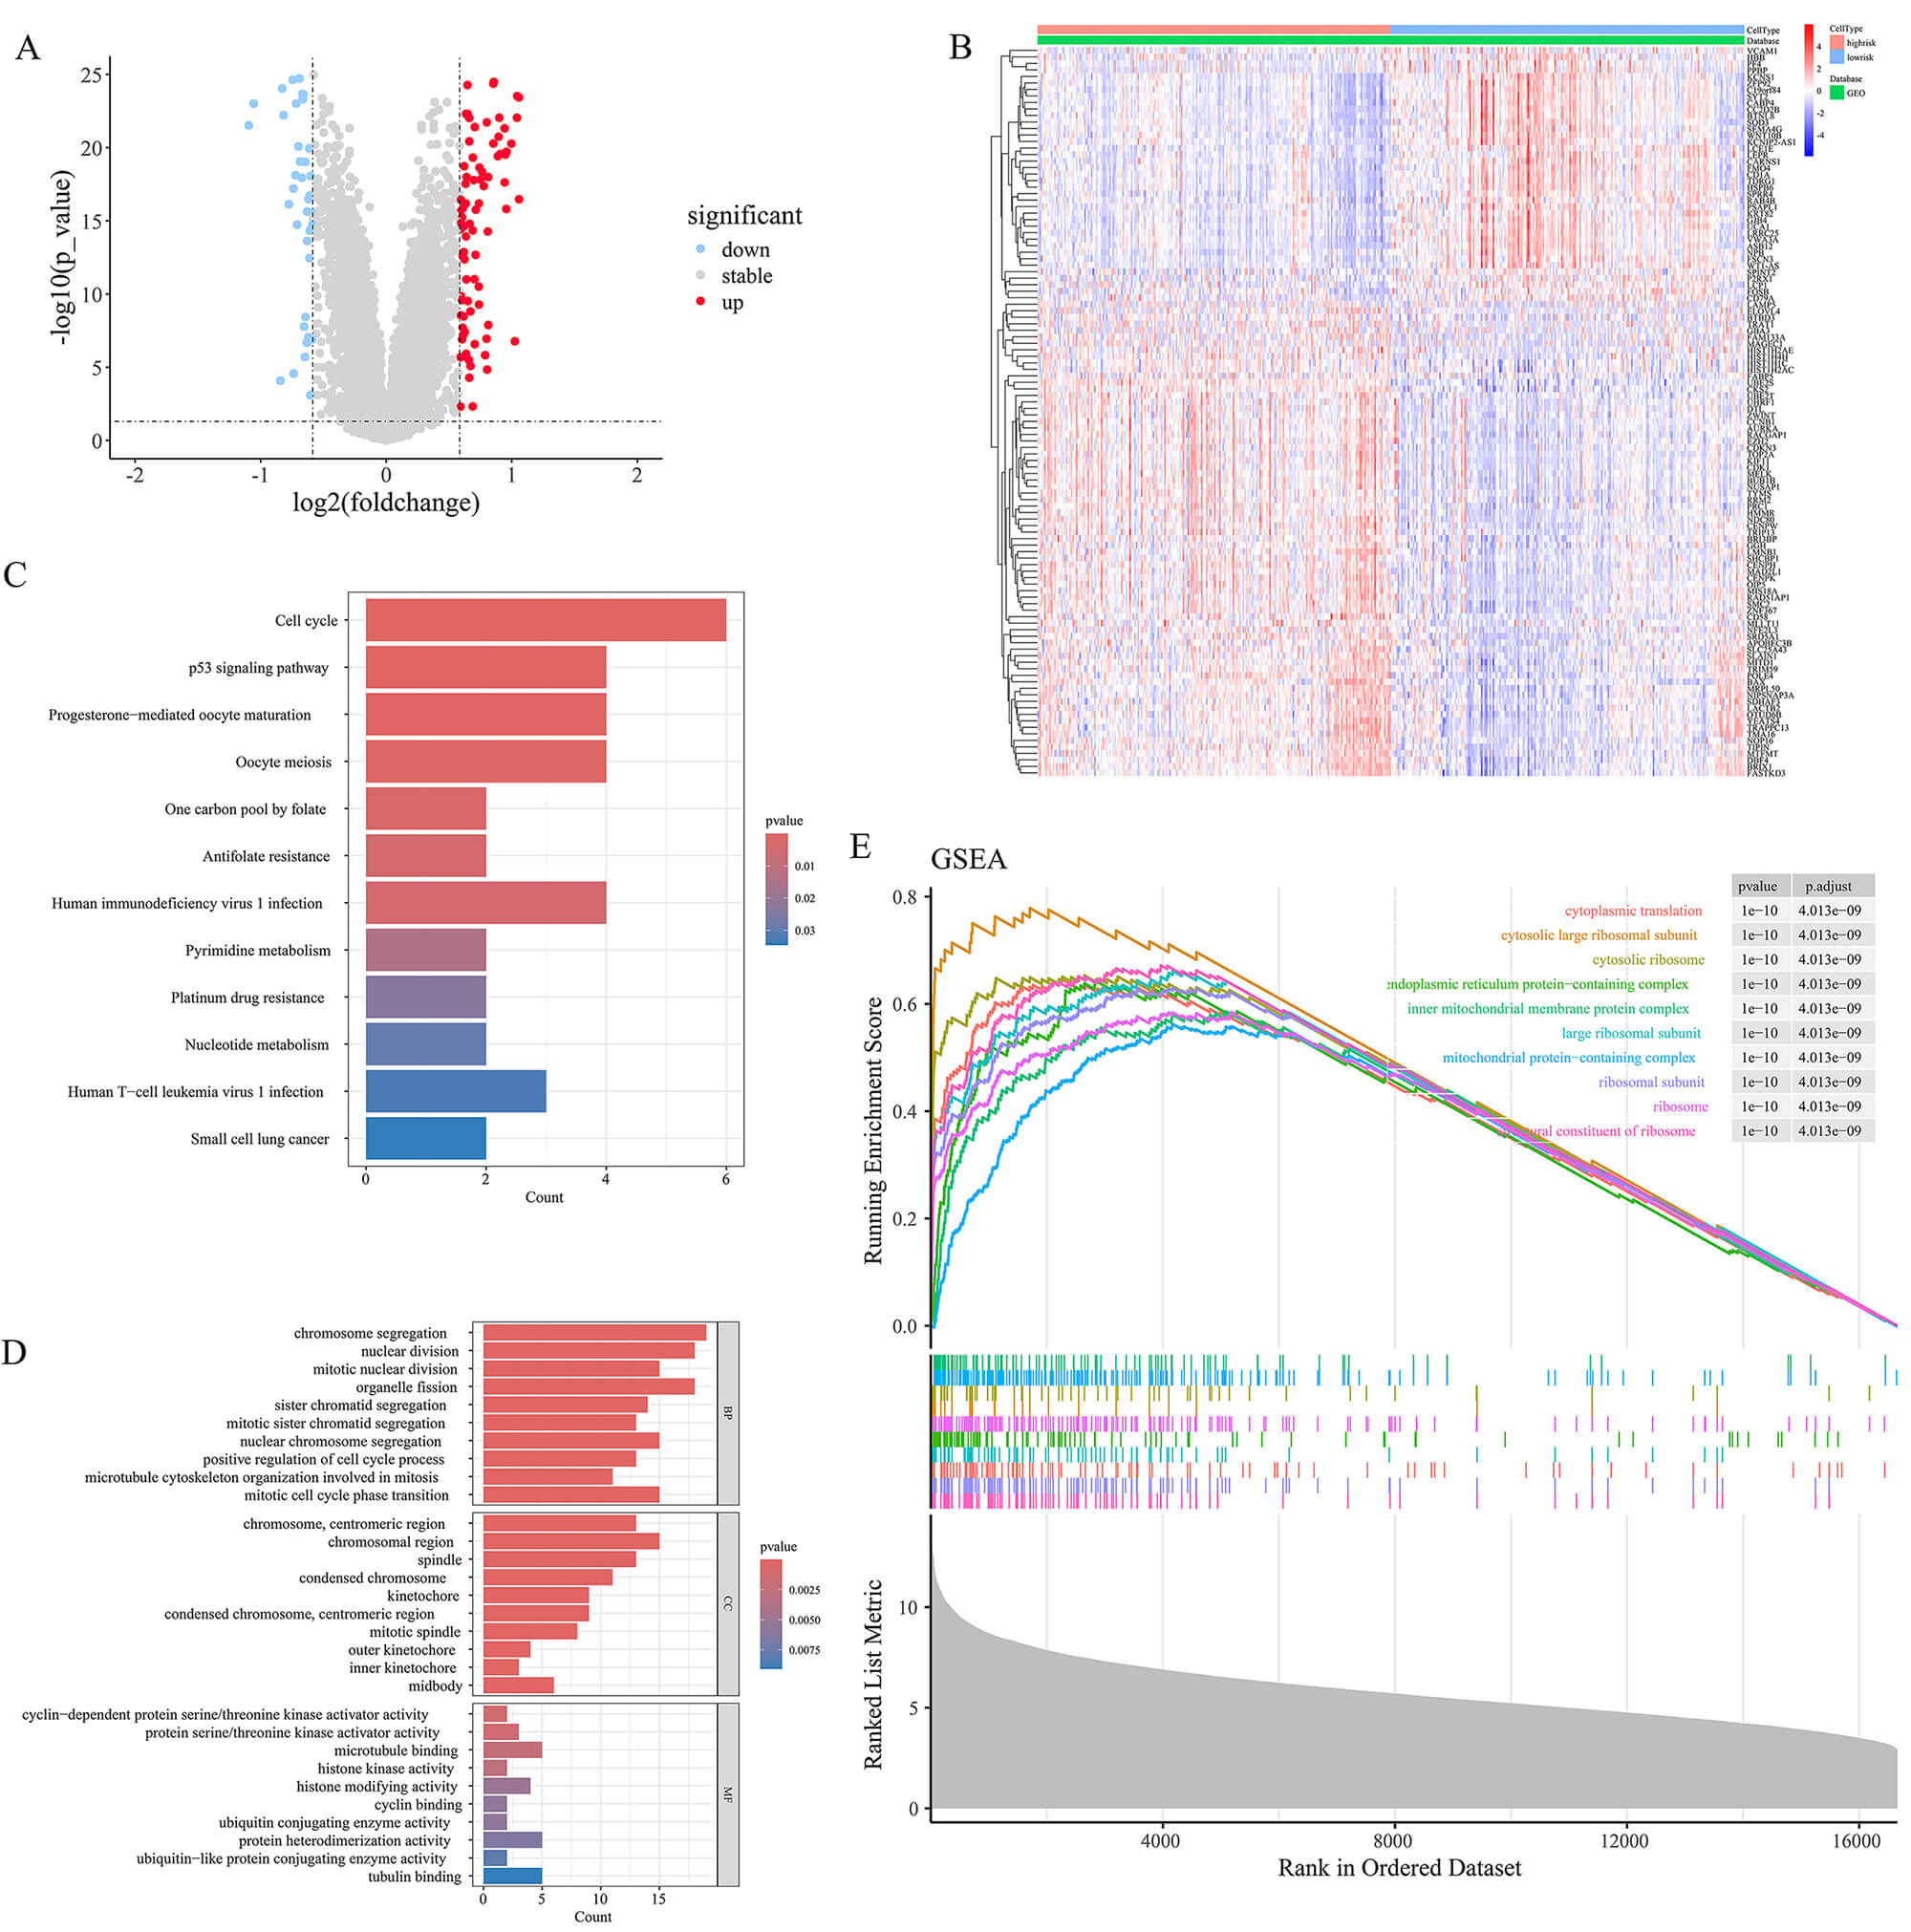 Fig. 10.
Differential expression and functional enrichment analysis between high- and low-MGUSscore cohorts. (A) Volcano plot displaying the DEGs between the high and low MGUSscore cohorts (Red: upregulated; Blue: downregulated; Gray: not significant). (B) Heatmap of DEGs. The color gradient ranges from blue (low expression) to red (high expression). (C,D) Bar charts displaying KEGG pathway (C) and GO term (D) enrichment results. (E) Gene Set Enrichment Analysis (GSEA) plot showing enriched pathways in the high-risk group.
Spearman correlation analysis demonstrated a notable link between the two core genes and infiltrating immune cells present in the tumor microenvironment (TME), with particular emphasis on plasma cells (Fig. 11A,B). Subsequent analysis demonstrated that elevated MGUSscore was markedly associated with enhanced infiltration of plasma cells, and resting memory CD4+ T cells, while exhibiting decreased infiltration of CD8+ T cells and M1 macrophages (Fig. 11C). The high-MGUS score cohort demonstrated reduced stromal, immune, and ESTIMATE scores, accompanied by an elevated tumor purity score, suggesting enhanced tumor purity and deteriorated prognosis (Fig. 11D).
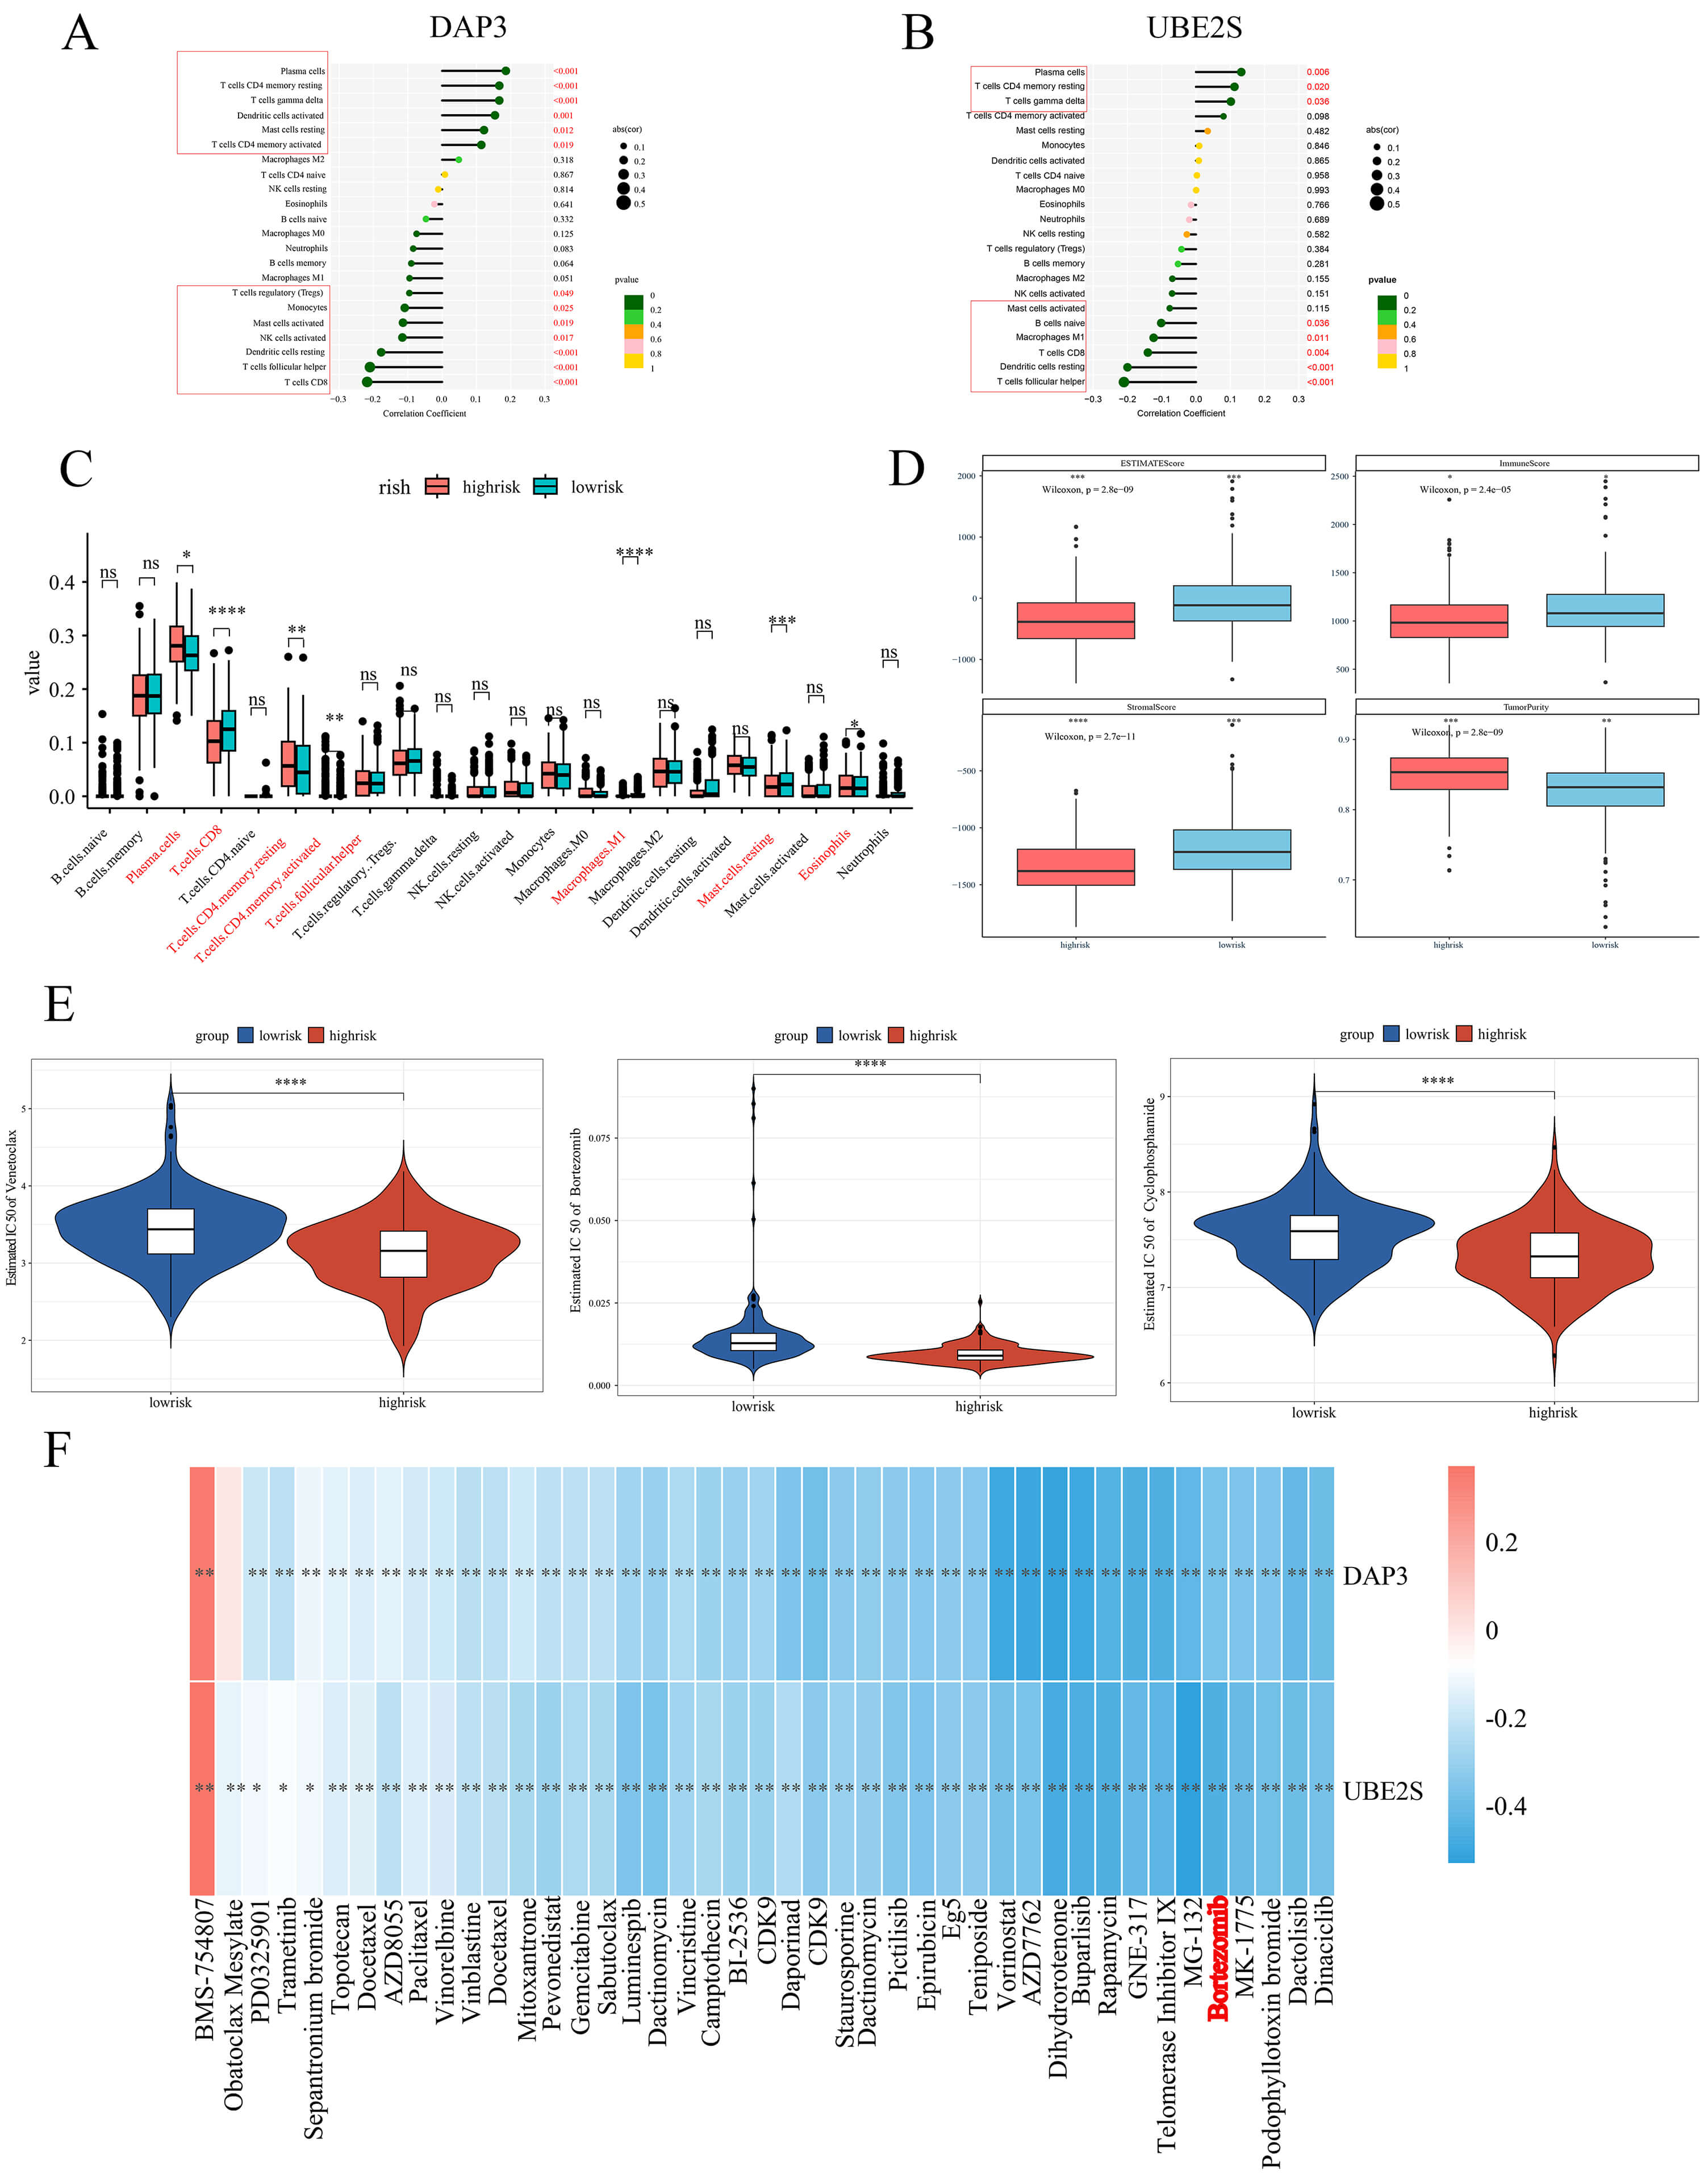 Fig. 11.
Immune infiltration and drug sensitivity analysis in high- and
low-MGUSscore cohorts. (A,B) Lollipop charts showing correlations between immune
cells and DAP3 (A) or UBE2S (B). Dot size represents
correlation coefficient; color indicates p-value. (C) Boxplots comparing
immune cell infiltration between high-risk (red) and low-risk (blue) groups. (D)
Boxplots of tumor microenvironment scores (ESTIMATE, Stromal, Immune, Tumor
Purity) in high-risk (red) and low-risk (blue) groups. p-values were
calculated by Kruskal-Wallis test. (E) Violin plots of predicted IC50 values for
Venetoclax, Bortezomib, and Cyclophosphamide. Red: high-risk; Blue: low-risk. (F)
Heatmap showing correlations between gene expression and drug sensitivity. Color
gradient ranges from blue (negative correlation) to red (positive correlation).
*p
Drug sensitivity predictions for individual patients were generated utilizing sensitivity data derived from the GDSC database. Within the high-risk cohort, reduced IC50 values were observed for Venetoclax, Bortezomib, and Cyclophosphamide (Fig. 11E). The graphical representations demonstrate differential sensitivity patterns to Bortezomib across distinct risk stratifications, wherein diminished IC50 values typically indicate enhanced drug susceptibility. Such comparative analysis enables the evaluation of therapeutic response variations between high- and low-risk patient populations, thereby establishing a foundation for personalized treatment protocols. Furthermore, the correlation between the two core genes and frequently employed anti-neoplastic agents was investigated. The findings revealed that expression levels of both genes exhibited negative correlations with the IC50 values of Bortezomib (Fig. 11F), indicating that higher expression of these genes is associated with increased sensitivity to the drug.
Single-cell data procured from GSE176131 underwent analysis utilizing the Seurat package. Cell clustering was executed through the UMAP algorithm, with subsequent annotation into B cells, CD4+ T cells, CD8+ T cells, myeloid cells, immature red cells, and plasma cells to facilitate gene expression observation [19] (Fig. 12A). Predominant expression of DAP3 and UBE2S was observed within plasma cells and CD8+ T cells (Fig. 12B). Subsequently, plasma cells and CD8+ T cells were extracted for additional analysis, with core genes being visualized through UMAP plots (Fig. 12C). Expression levels of DAP3 and UBE2S within plasma cells and CD8+ T cells demonstrated elevation corresponding to MM grading progression (Fig. 12D–G). Trajectory analysis was conducted using Monocle3 [21, 22, 23] within the identical low-dimensional space to represent potential developmental pathways of these cellular populations, thereby illustrating DAP3 and UBE2S expression patterns throughout cellular development (Fig. 12H). Validation through the Human Protein Atlas [24] demonstrated substantial expression of DAP3 and UBE2S within plasma cells, thereby corroborating previously obtained findings (Fig. 12I,J).
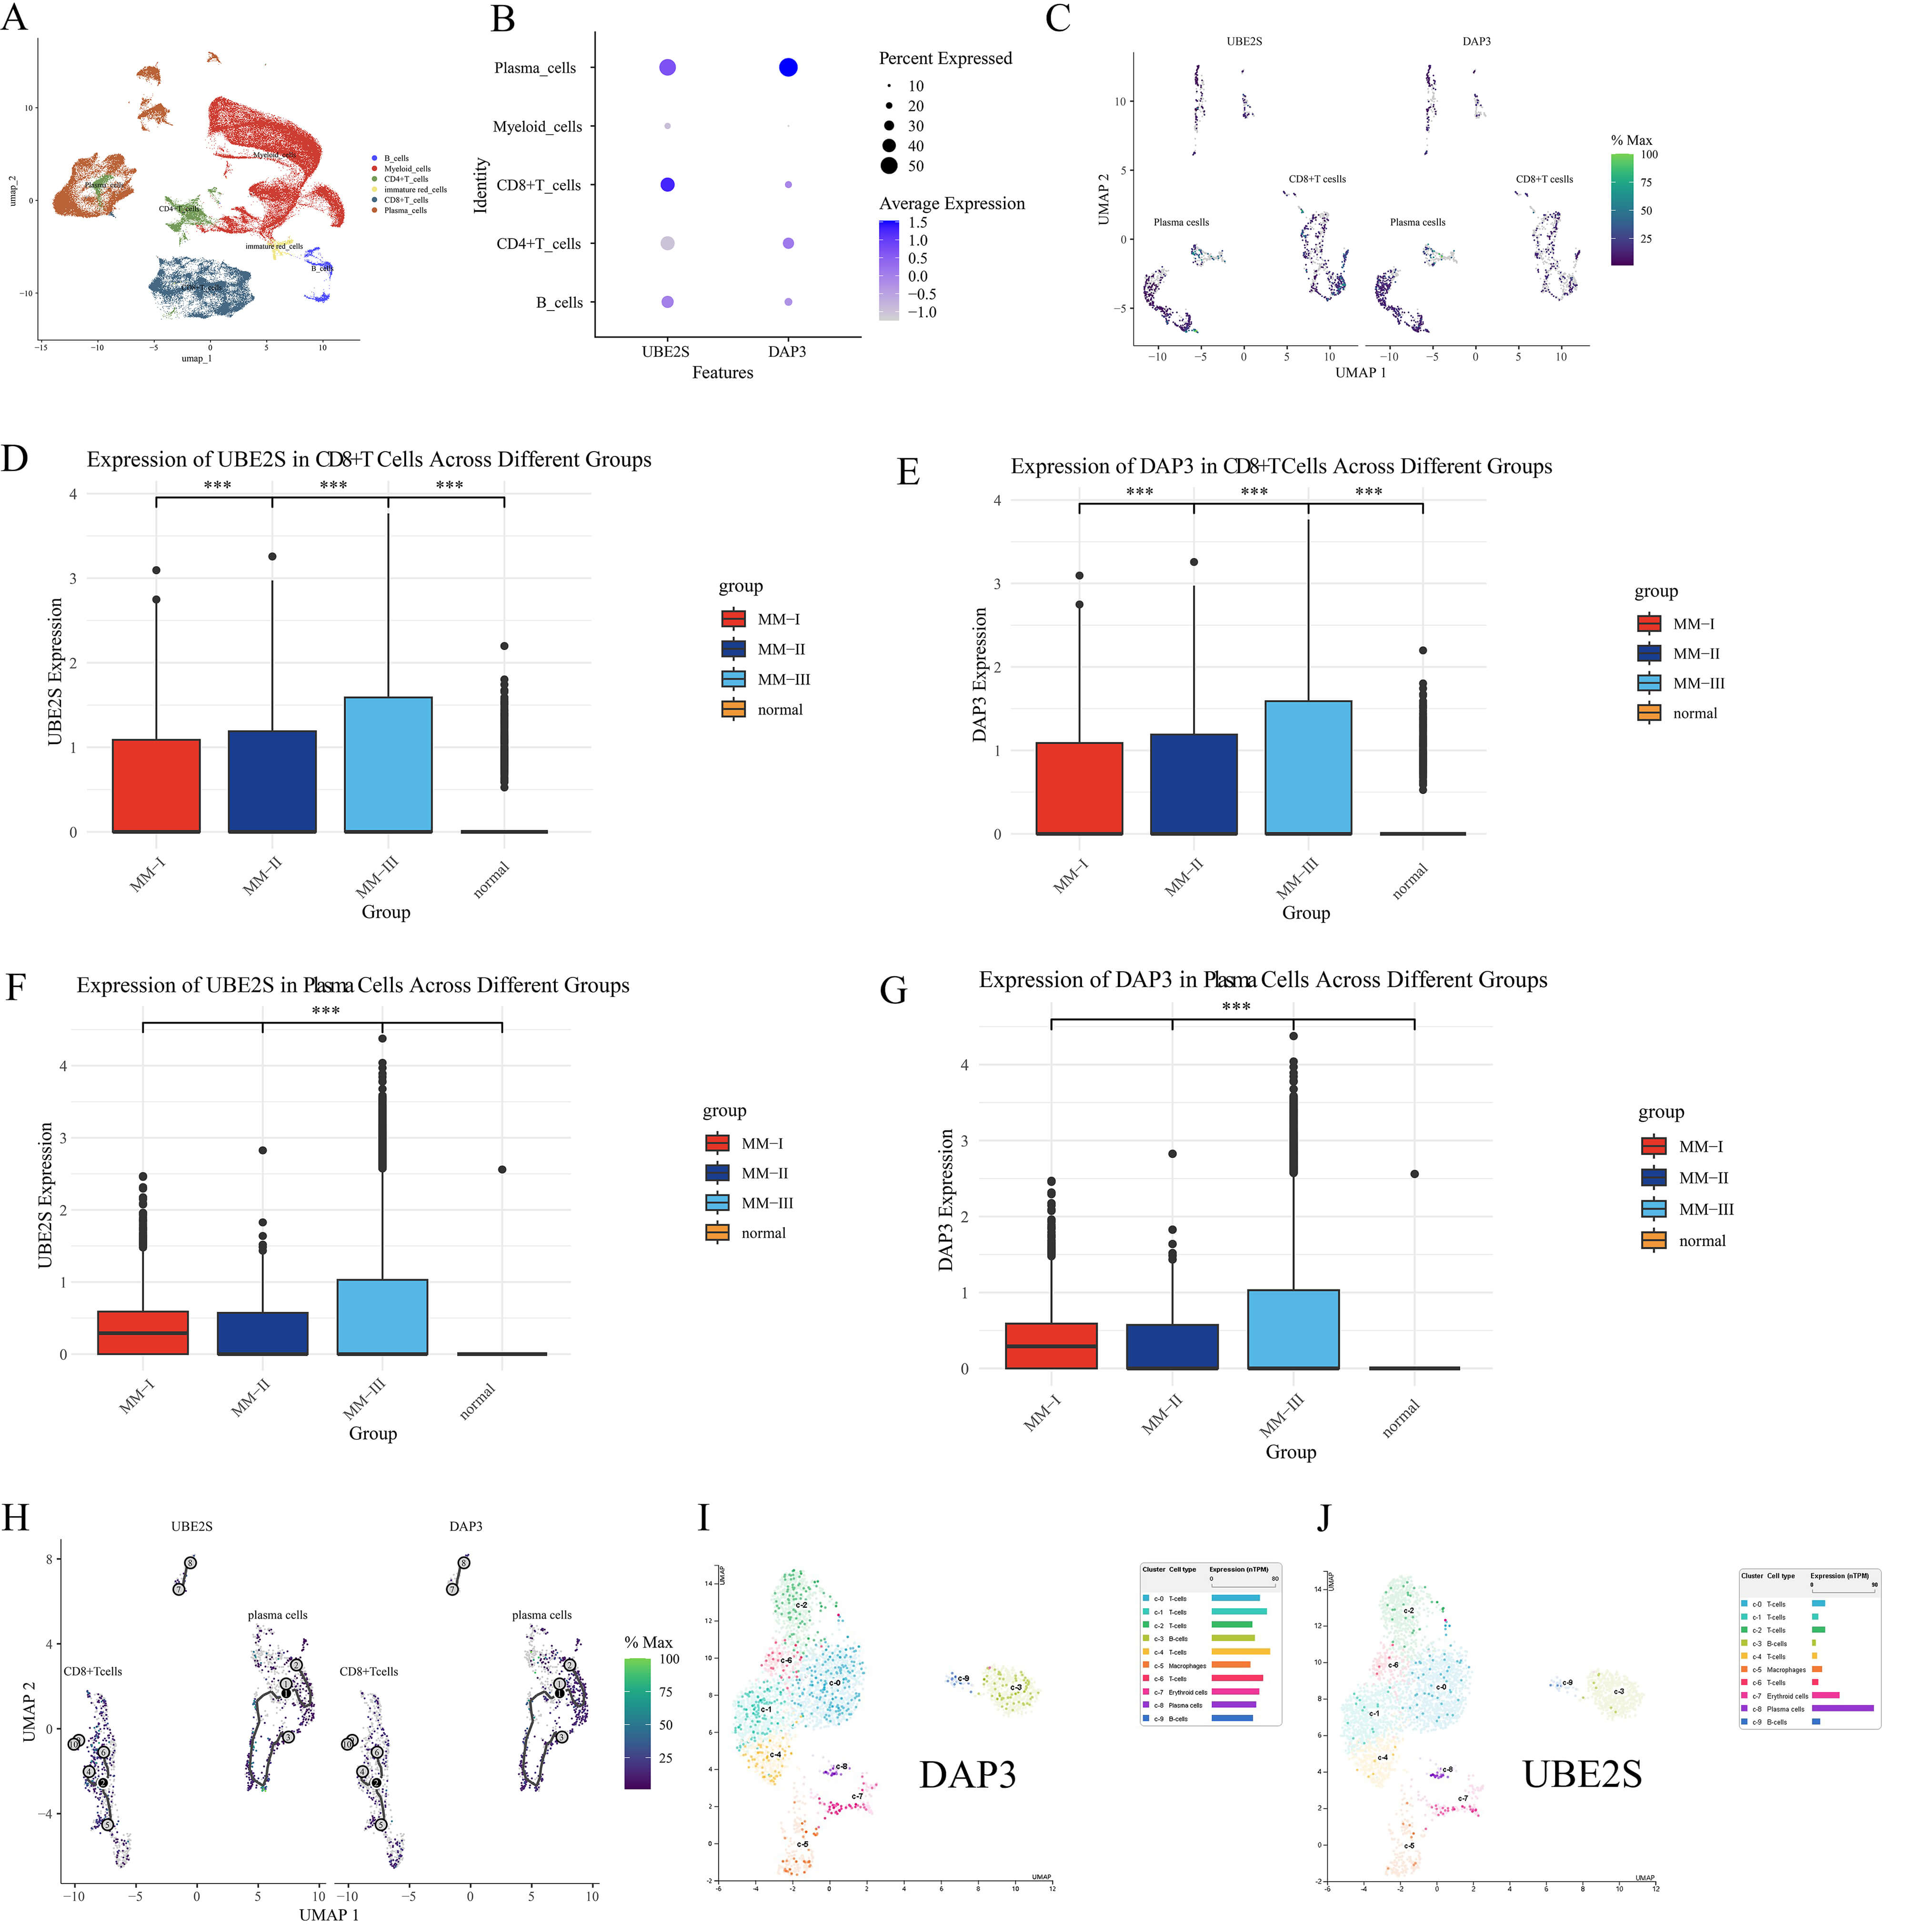 Fig. 12.
Single-cell analysis of DAP3 and UBE2S in MM. (A) Annotated
UMAP plot of cell clusters. (B) Dot plot of gene expression (Dot size: %
expressed; Color: average expression). (C) UMAP visualization depicting core gene
expression within isolated plasma cells and CD8+ T cells. (D–G) Bar plots
of UBE2S and DAP3 levels in CD8+ T cells (D,E) and Plasma
cells (F,G) across Normal and MM groups (***p
Single-cell ATAC-seq profiles comprising 827 normal, 5175 primary, and 3014
recurrent plasma cells were analyzed to delineate epigenetic landscapes.
Dimensionality reduction utilizing UMAP revealed significant heterogeneity, with
malignant populations clustering distinctly from normal controls, indicating
profound chromatin remodeling (Fig. 13A,B). Assessment of chromatin-inferred gene
activity demonstrated sustained DAP3 accessibility across malignant clusters
(Fig. 13C), whereas UBE2S exhibited marked upregulation in myeloma cells relative
to controls (Fig. 13D). Quantitatively, a distinct “Normal
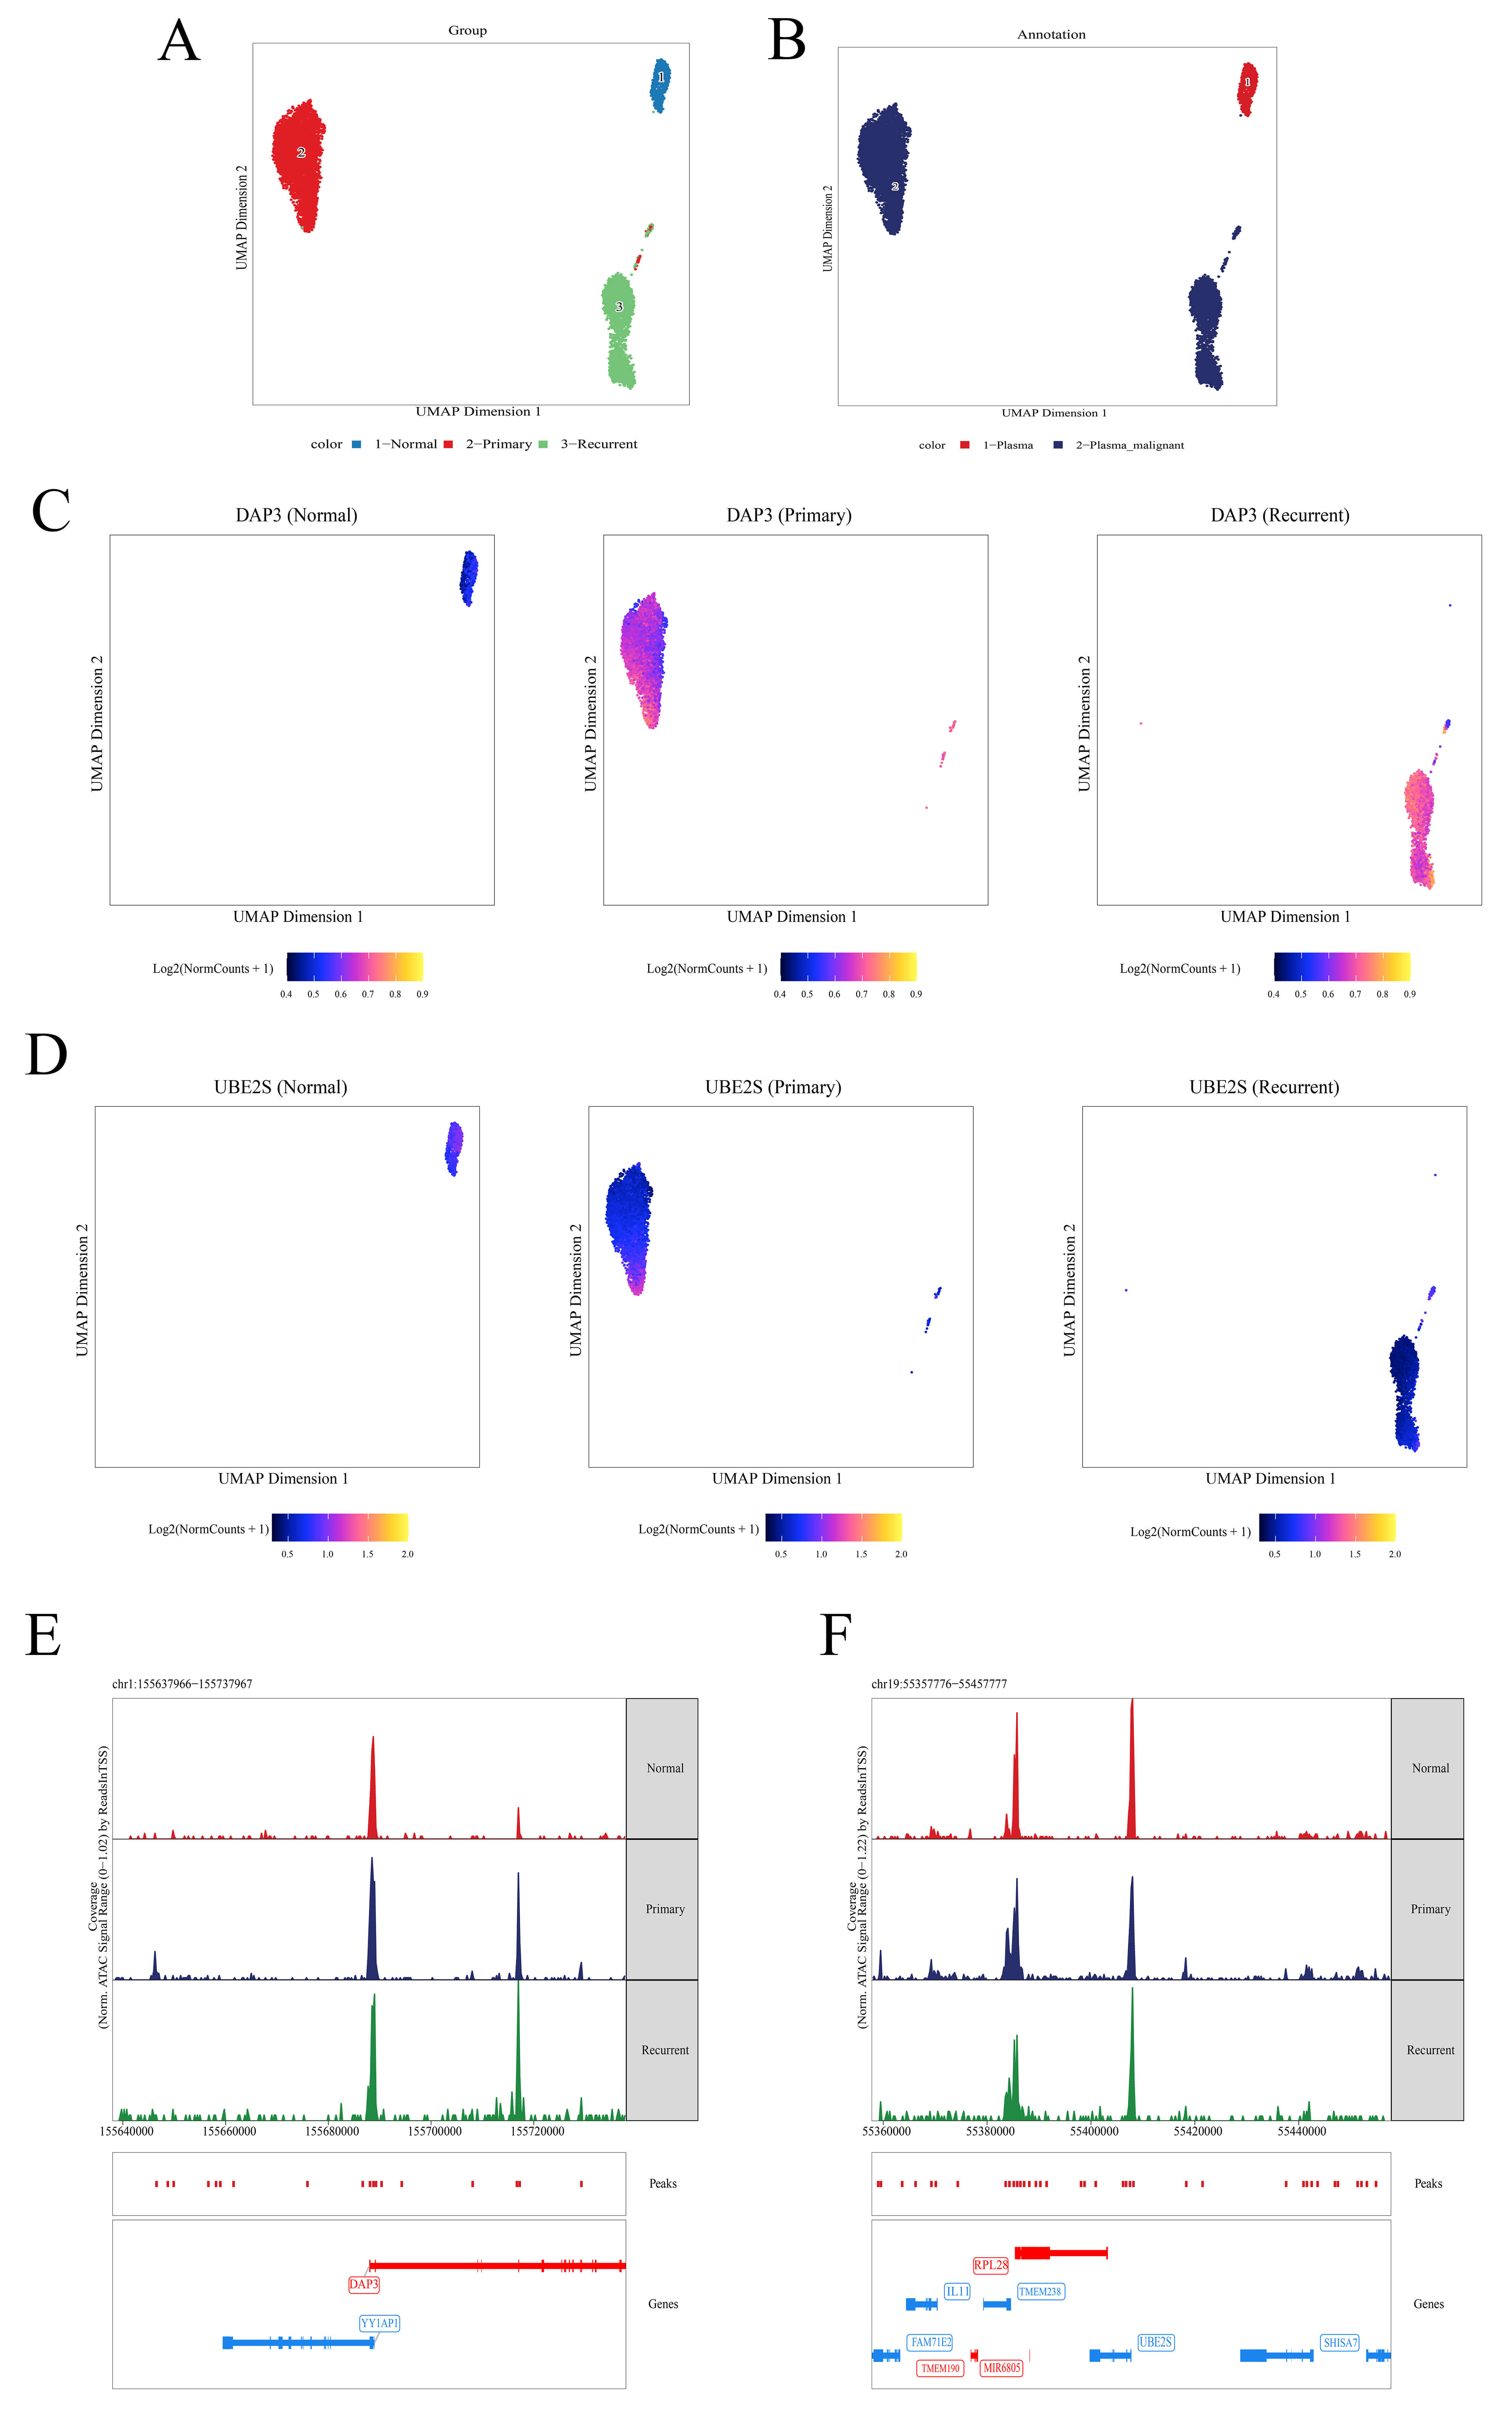 Fig. 13.
Single-cell chromatin accessibility landscape of DAP3 and UBE2S. (A) UMAP plot colored by sample group: Normal (blue), Primary (red), and Recurrent (green). (B) UMAP plot colored by annotation: Plasma (red) and Malignant Plasma (blue). (C,D) Feature plots displaying chromatin accessibility for DAP3 (C) and UBE2S (D); color gradient from blue (low) to yellow (high) indicates signal intensity. (E) Normalized signal tracks at the DAP3 locus (chr1:155,637,966–155,737,967) for Normal (red), Primary (blue), and Recurrent (green) samples. (F) Normalized signal tracks at the UBE2S locus (chr19:55,357,776–55,457,777), formatted as in (E).
Both IHC and mIF analyses corroborated the observations that UBE2S and DAP3
expression levels were markedly elevated in MM tissues versus MGUS controls,
demonstrating statistical significance. IHC analyses demonstrated intensified DAB
staining patterns for UBE2S and DAP3 within MM specimens, whereas mIF exhibited
more pronounced red (UBE2S) and green (DAP3) fluorescent signals in MM tissues
(Fig. 14A,B and Fig. 15A,B). Subcellular localization analysis revealed that DAP3
was predominantly located in the cytoplasm, whereas UBE2S showed diffuse
expression in both the nucleus and cytoplasm. Semi-quantitative assessment of mIF
additionally validated that UBE2S and DAP3 expression levels were substantially
upregulated in MM versus MGUS (p
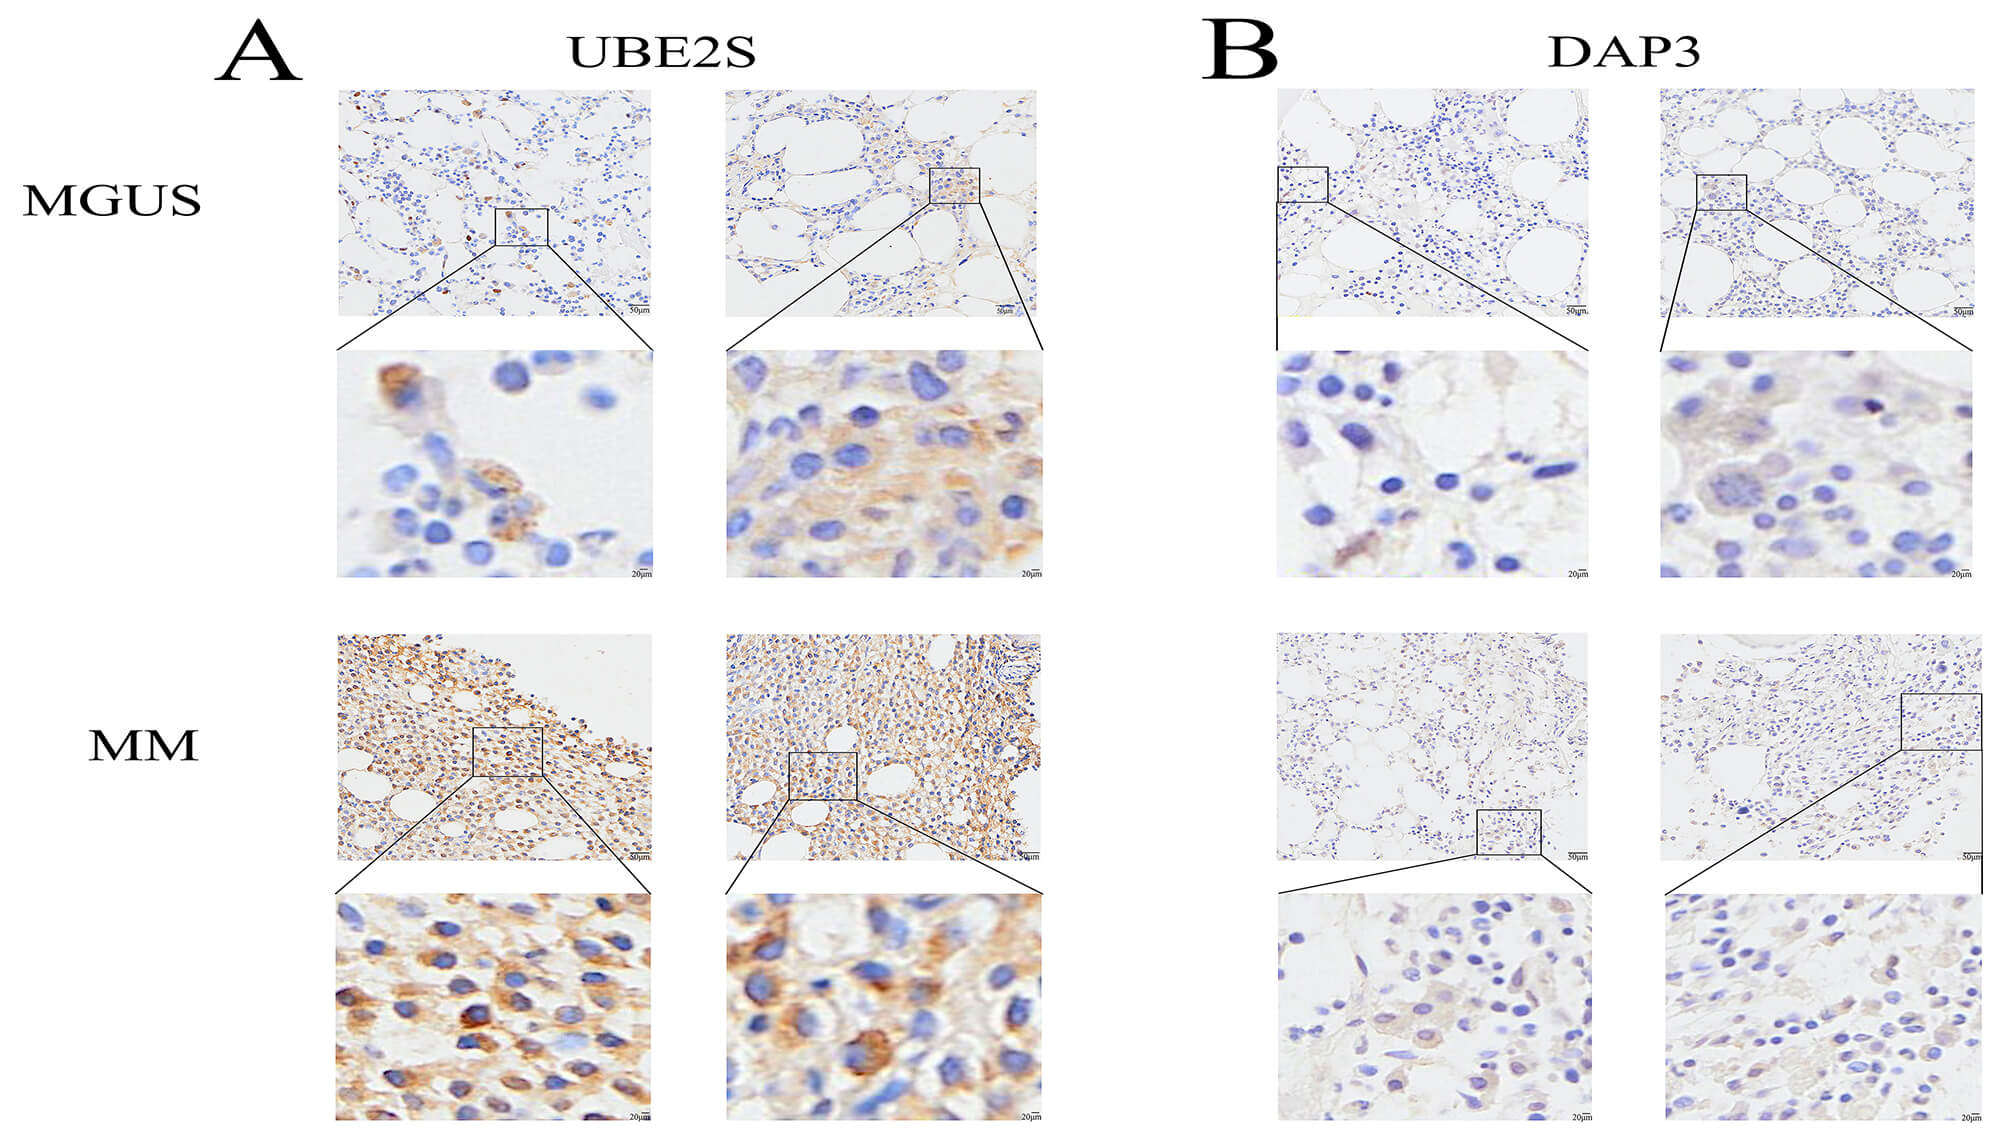 Fig. 14.
IHC validation of UBE2S and DAP3 in MGUS and MM tissues. (A,B) Representative immunohistochemical staining patterns for UBE2S (A) and DAP3 (B) within MGUS and MM tissue specimens. In each panel, the upper image shows a low-magnification view, and the lower image displays a higher-magnification view of the boxed region. Brown staining indicates positive protein expression. Scale bars: 50 µm (main images) and 20 µm (magnified inserts).
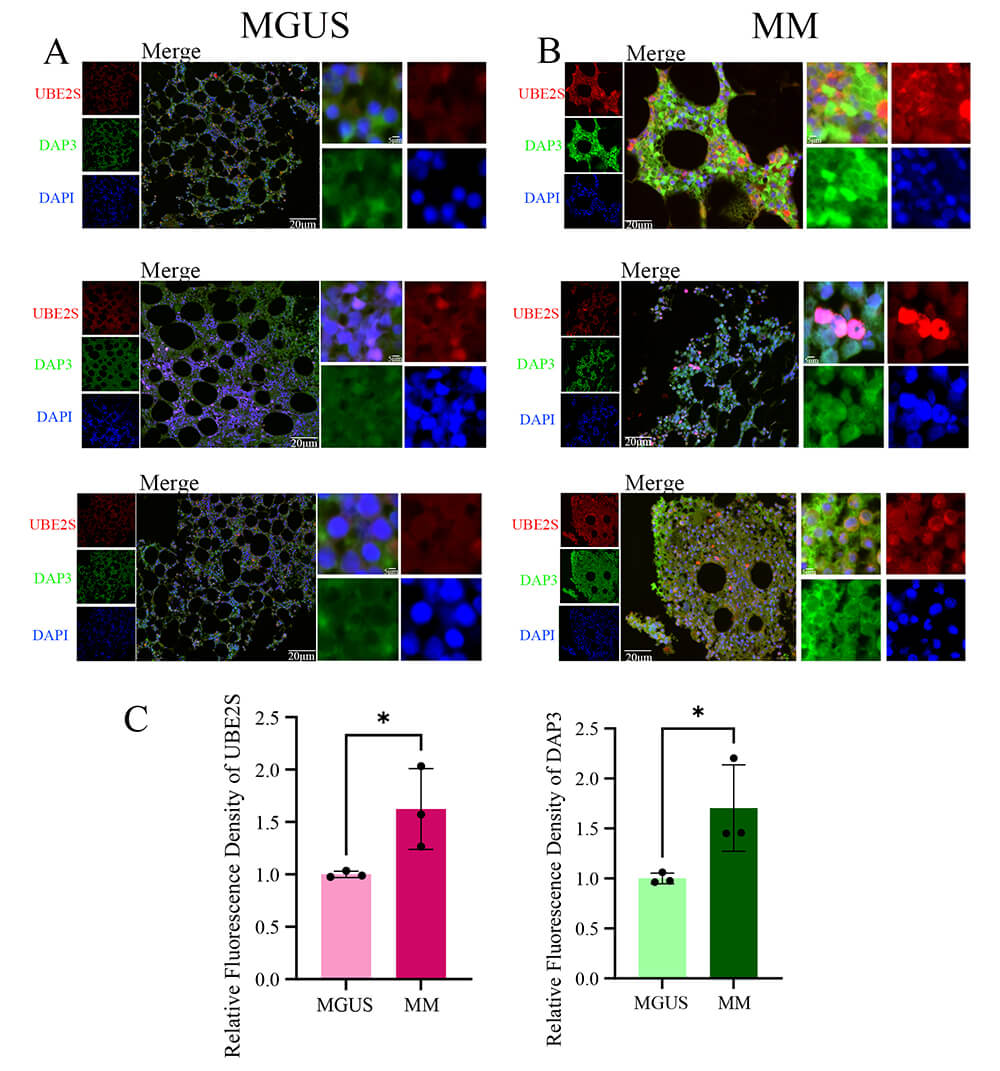 Fig. 15.
mIF validation of DAP3 and UBE2S expression in MGUS and MM
tissues. (A,B) Representative immunofluorescence images of MGUS (A) and MM (B) tissues. The left panels show individual channels for UBE2S (red), DAP3 (green), and DAPI (blue); the center panels show the merged view; the right panels show high-magnification insets of the merged view. DAP3 exhibits predominantly cytoplasmic localization, while UBE2S displays diffuse expression in both the nucleus and cytoplasm. (C) Quantitative assessment of relative fluorescence intensity for UBE2S (left) and DAP3 (right). *p
MM represents an intractable malignant plasma cell neoplasm characterized by irreparable organ impairment. The disease typically progresses through three distinct stages: MGUS, SMM, and Symptomatic or active MM [25]. In individuals aged over 50 years, MGUS prevalence surpasses 3%, exhibiting an annual progression rate to MM of 1%. SMM progresses to MM at roughly 10% per year within the initial five years following diagnosis [26, 27]. Timely therapeutic intervention and prophylactic strategies are essential for decelerating MM progression. Nevertheless, dependable biomarkers for forecasting the transition from MGUS to MM continue to be elusive. Understanding the molecular foundation that underlies this progression remains essential for identifying high-risk MGUS patients and establishing novel therapeutic targets. Consistent with this need, Khalili et al. [28] recently employed a systems biology analysis to map disease evolution, highlighting the role of transcriptional dysregulation, particularly within the AP-1 family. Aligning with this perspective, our study utilizes similar bioinformatic modeling to further dissect this complex landscape, identifying DAP3 and UBE2S as distinct key drivers. These complementary findings suggest that alongside transcriptional changes, (indicated by UBE2S identification) and mitochondrial homeostasis likely represent critical for malignant transformation, validating the utility of network-based approaches in uncovering therapeutic targets.
Utilizing computational bioinformatics methodologies, an examination of MGUS (GSE5900) and MM (GSE6477) datasets facilitated the identification of DEGs shared across MGUS, MM, and control specimens. By implementing WGCNA, ddisease-related modules were identified and then cross-referenced with the detected DEGs, leading to the final selection of 12 potential candidate genes. After univariate Cox regression analysis and LASSO methodology, two pivotal genes, DAP3 and UBE2S, were identified and utilized to construct a prognostic scoring system (MGUSscore). Multivariate analysis validated this scoring system as an independent prognostic indicator, whereby patients classified as high-risk demonstrated markedly diminished OS and PFS. The predictive precision was further corroborated through ROC curve analysis and nomogram construction. However, with AUC values fluctuating between 0.66 and 0.70, the model exhibits moderate performance. This suggests that the MGUSscore should not be used in isolation. Instead, it offers the most value when integrated with standard clinical risk factors to guide patient management.
Clinical correlation analyses demonstrated substantially elevated expression levels of these two pivotal genes in MM versus MGUS and healthy controls. The identified genes exhibit correlations not only with OS and PFS but also reveal associations with ISS staging, where advanced phases demonstrate heightened gene expression patterns. Notably, UBE2S displayed enhanced expression in populations with 1p, 13q, and 1p32 deletions versus normal subgroups maintaining intact chromosomal regions, while DAP3 showed particular linkages with 13q deletions. Investigative findings indicate that 1p deletion frequency in MM approaches roughly 30%, in marked contrast to merely 6% in MGUS. This genetic alteration commonly occurs alongside 1q21 region amplification, detected in 40% of MM and 25% of MGUS cases, and links to elevated risk of MGUS progression to MM and unfavorable patient outcomes [29]. Furthermore, del13 demonstrates connections to MGUS transformation into MM [30]. These observations suggest potential mechanistic roles of these two critical genes in malignant cellular transition processes.
DAP3, alternatively designated as S29mt, MRPS29, and bMRP-10, represents an apoptosis-associated protein [31]. Contemporary investigations demonstrate that DAP3 exhibits significant correlation with tumor advancement [32] and therapeutic resistance [33]. Functioning as a mitochondrial ribosomal constituent predominantly localized within the mitochondrial matrix, DAP3 serves essential regulatory functions in mitochondrial homeostasis. Suppression of DAP3 expression enhances cellular susceptibility to mitochondria-mediated intrinsic apoptotic pathways [34]. Furthermore, DAP3 functions as a splicing-regulatory RNA-binding protein in malignancies, with aberrant splicing events modulated by DAP3 manifesting across diverse cancer types [35]. UBE2S, designated as Ubiquitin-conjugating enzyme E2S, assumes pivotal significance in the pathogenesis and advancement of diverse malignant neoplasms through enhancement of cellular invasion, migration, and proliferation via modulation of DNA repair mechanisms, DNA damage responses, and cell cycle regulation [36, 37, 38]. This investigation corroborates these observations.
Beyond biological functions, our single-cell ATAC-seq analysis uncovers distinct epigenetic mechanisms. DAP3 maintains a consistently accessible chromatin state, suggesting it serves as a stable survival factor. Conversely, UBE2S exhibits a dynamic ‘gain-of-function’ pattern, peaking in newly diagnosed MM. Notably, UBE2S accessibility in relapsed samples was lower than in primary MM. This aligns with the therapeutic clonal selection model [39]. Treatments often eradicate dominant, highly proliferative clones—those likely possessing the highest UBE2S activity. Consequently, recurrent tumors may consist of resistant subclones with moderated expression, allowing them to evade therapy via ‘expression escape’. Crucially, it must be noted that scATAC-seq infers gene activity based on chromatin openness, representing regulatory potential rather than direct protein abundance. Therefore, actual protein expression in relapsed disease may diverge from these genomic predictions due to complex post-transcriptional regulations.
The pathogenesis of MM is profoundly influenced by the dynamic interplay between the evolving immune microenvironment and the bone marrow niche, which collectively dictate disease initiation and drug responses. Recent studies underscore that this ecosystem is not a static background but actively co-evolves with clonal plasma cells starting from early disease stages. Preliminary immune microenvironmental modifications, encompassing both immune stimulation and depletion, are detectable during the MGUS phase, offering a systems biology framework for comprehending TME restructuring [40]. In this investigation, the elevated MGUSscore cohort demonstrated enhanced infiltration of plasma cells, quiescent and resting memory CD4+ T cells while exhibiting decreased infiltration of CD8+ T cells and M1 macrophages. Plasma cells, functioning as neoplastic cells in MM, displayed augmented infiltration correlated with increased tumor burden and diminished prognosis in high-risk patients [41]. The observed paucity of cytotoxic CD8+ T cells in the high-risk group indicates an immunosuppressive, immune-excluded tumor microenvironment, a hallmark of advanced disease and poor outcomes. Follicular helper T cells and their subset Tfh17 have been demonstrated to be modified in MM, with an increased Tfh17/Tfh ratio correlating with disease advancement [42]. Regarding M1 macrophages, which conventionally possess anti-tumor properties, their decreased infiltration in the high-risk group suggests a potential redirection toward M2 polarization or a depletion of anti-tumor myeloid populations driven by tumor-derived factors [43]. Dormant mast cells and eosinophils may regulate the TME through cytokine secretion or local inflammation modulation, although the precise mechanisms require further elucidation [44].
In terms of immunoregulatory mechanisms, DAP3 has been identified as a downstream effector of the Ikaros protein [45]. As Ikaros function is often essential for MM cell survival, its sustained activity likely drives the progressive elevation of DAP3 expression observed in our study. This aberrantly high level of DAP3 in malignant plasma cells may confer a survival advantage against immune-mediated cytotoxicity. Such persistent tumor survival, despite immune attack, could indirectly sustain chronic antigen stimulation, thereby eventually leading to the functional impairment and exhaustion of antitumor effectors described above. UBE2S may facilitate TME remodeling through modulation of immune-tumor cell interactions, functioning as a “double-edged sword” in neoplastic progression [46]. This investigation demonstrates a positive correlation between UBE2S and DAP3 expression with plasma cell populations. Additionally, single-cell analysis substantiated that both genes demonstrate enhanced expression levels, particularly within B cell and plasma cell compartments, in MM patients, with expression intensities escalating concomitantly with disease progression. Intriguingly, our single-cell analysis revealed a more complex dynamic regarding CD8+ T cells. While the total number of CD8+ T cells was reduced in high-risk patients, UBE2S and DAP3 expression was significantly upregulated within the surviving CD8+ T cell population. This implies that these genes may play an intrinsic role in T cell biology. We hypothesize that aberrant upregulation of UBE2S and DAP3 within CD8+ T cells could contribute to their dysfunction, progressive exhaustion, or susceptibility to activation-induced cell death, ultimately leading to the reduced overall numbers observed at the tissue level. Collectively, these findings suggest that UBE2S and DAP3 actively modulate cellular communication within this ecosystem, thereby bridging the gap between clonal plasma cell evolution and the establishment of therapeutic resistance.
Integrating these observations, we propose that UBE2S and DAP3 significantly modulate cellular communication within this ecosystem, potentially bridging the gap between clonal plasma cell evolution and the establishment of therapeutic resistance. Despite the elevation of certain antitumor immune cell populations within the high-risk cohort, the overall TME demonstrated predominantly immunosuppressive features, characterized by diminished stromal, immune, and ESTIMATE scores coupled with elevated tumor purity, which potentially compromises efficacious antitumor responses and may account for the concurrent presence of elevated MGUSscore alongside adverse prognosis. This finding aligns with documented evidence in MM regarding T-cell exhaustion, Treg and MDSC activation, and enhanced expression of inhibitory checkpoint molecules, encompassing PD-1/PD-L1 [47]. Therefore, the immunological profile observed within the high MGUSscore cohort may partially reflect the intricate regulatory influence exerted by DAP3 and UBE2S upon the tumor immune microenvironment, along with their prospective roles in MM disease progression.
Drug sensitivity analysis suggests that patients with elevated MGUSscore may demonstrate enhanced responsiveness to therapeutic agents, including Bortezomib, Venetoclax, and Cyclophosphamide. These predictions derive from computational algorithms utilizing the GDSC database, which establishes correlations between gene expression profiles and IC50 values, though experimental validation remains pending. A plausible mechanism involves the heightened dependency of high-risk malignant cells on particular molecular pathways, such as proteasome function, potentially conferring increased susceptibility to proteasome inhibitors through in silico modeling. Nevertheless, actual clinical efficacy may be modulated by supplementary variables, encompassing immunosuppressive TMEs, T-cell exhaustion phenomena, and intratumoral heterogeneity. These observations illuminate the promise of employing gene expression-based predictive models for personalized therapeutic approaches, while emphasizing the necessity for rigorous experimental and clinical validation.
Several limitations warrant acknowledgment in this investigation. Initially, the computationally predicted drug sensitivities, encompassing enhanced responsiveness to Bortezomib within the high-risk cohort, represent purely algorithmic predictions necessitating experimental or clinical validation through MM-specific patient populations. Subsequently, while this investigation emphasizes the potential contributions of UBE2S and DAP3 in modulating the TME and affecting disease progression, the fundamental molecular mechanisms remain inadequately elucidated. Future investigations should examine how these pivotal genes regulate plasma cell behavior and immune interactions. Ideally, these studies should utilize flow cytometry or spatial transcriptomics to functionally characterize immune subsets and integrate established immune signatures to validate the exhaustion phenotypes described herein. Extension of these analyses to early MGUS stages may unveil actionable vulnerabilities for early therapeutic intervention and establish a more robust biological foundation for the MGUSscore as both a prognostic and therapeutic instrument.
This bioinformatics study elucidates the pivotal contributions of two central genes (DAP3 and UBE2S) in MGUS to MM pathogenesis and disease progression. These identified genes potentially facilitate malignant transformation through diverse immune cellular pathways, exhibiting substantial correlations with MM development and prognosis. Furthermore, they demonstrate enhanced responsiveness to bortezomib therapy. The constructed prognostic scoring system (MGUSscore), derived from MGUS-associated core genes, effectively stratifies MM patients into high- and low-risk cohorts based on survival outcomes, highlighting its robust predictive capability. This investigation offers essential insights into MM pathogenesis, identifies potential therapeutic targets, and promotes precision medicine development.
In this study, our data sources include the TCGA (The Cancer Genome Atlas, https://www.cancer.gov/tcga), GEO (Gene Expression Omnibus, https://www.ncbi.nlm.nih.gov/geo/), and the Human Protein Atlas (https://www.proteinatlas.org/). The datasets used and analyzed during the current study are available from the corresponding author on reasonable request.
YJF and WYG contributed equally to this work as co–first authors. ZJZ and YLiu conceived the study and designed the research protocol. YJF and WYG drafted the manuscript. Data acquisition and analysis were performed by YJF, WYG, YLin, and HY. Immunohistochemistry and immunofluorescence experiments were conducted by YJF and JYD. Figures and visualization were prepared by YC, JRL, and HY. YJF, WYG, ZJZ, YLin, and YLiu critically revised the manuscript for important intellectual content. YLiu (corresponding author) and ZJZ (co–corresponding author) supervised the project and approved the final version. All authors made substantial contributions to the study, reviewed the manuscript, and approved the submitted version. All authors contributed to editorial changes in the manuscript. All authors have participated sufficiently in the work and agreed to be accountable for all aspects of the work.
This study was approved by the Ethics Committee of the Third Affiliated Hospital of Soochow University (Ethics Approval Number: [2024]51). All patients involved in this study provided written informed consent prior to participation. All procedures were conducted in accordance with the ethical standards of the Declaration of Helsinki.
We thank Bullet Edits Limited for BulletEdits the linguistic editing and proofreading of the manuscript.
This work was supported by the Changzhou Municipal Health Commission Science and Technology Project (Advanced Technology) (QY202401); the Changzhou Science and Technology Plan Project (Social Development) (CE20235060); the Changzhou Science and Technology Project (Applied Based Research) (CJ20243014); the Changzhou Science and Technology Project (Applied Based Research) (CJ20243015); the Changzhou Science and Technology Project (Applied Based Research) (CJ20230047); the Changzhou Clinical Medical Center and the Outstanding Talent of Changzhou “The 14th Five-Year Plan” High-Level Health Talents Training Project.
The authors declare no conflict of interest.
Supplementary material associated with this article can be found, in the online version, at https://doi.org/10.31083/FBL46992.
References
Publisher’s Note: IMR Press stays neutral with regard to jurisdictional claims in published maps and institutional affiliations.