1. Introduction
Myopia has become a global public health problem. In East Asia and Southeast
Asia, the prevalence of myopia among adolescents is approximately 80–90%, and
the prevalence of high myopia is 10–20% [1, 2]. In addition, high myopia
(–6.0 D) can lead to severe complications such as irreversible vision
loss, retinal detachment, cataracts, and macular atrophy [3]. A survey conducted
among children aged 5–15 years in China found that the prevalence of myopia
gradually increases with age, from 5.7% at the age of 5 years to 30.1% at the
age of 10 years and 78.4% at the age of 15 years [4]. Therefore, exploring the
pathogenesis of myopia and discovering new targets for the clinical treatment of
myopia are highly important.
Close work aggravates myopia progression, and it is hypothesized that more
accommodation is produced to stimulate eyeball growth during close work [5].
Studies have shown that the ciliary muscle of children with myopia increases
abnormally, indicating that the development of myopia may be related to the
ciliary muscle [6]. In addition, myopia is usually accompanied by accommodation
lag, and abnormalities in the ciliary muscle may be the source of accommodation
lag, resulting in retinal defocus and axial elongation of the eyeball [7, 8].
Therefore, the ciliary muscle plays an essential role in the progression of
myopia, although the exact mechanisms remain unclear.
As smooth muscle, the ciliary muscle comprises mainly muscle fiber bundles, and
type I collagen (Col-1), Col-3, and fibronectin (FN) are present in the
connective tissue between muscle bundles [9]. Moreover, matrix metalloproteinases
(MMPs) 1, 2, 3, 11, 12, 14, 15, 16, 17, 19, and 24, as well as tissue inhibitors
of metalloproteinases (TIMPs) in the ciliary muscle, are also widely expressed.
Many studies have shown that the Ras homolog family member A
(RhoA)/Rho-associated protein kinase (ROCK) signaling pathway is involved in
regulating cell proliferation and differentiation, which induces cytoskeleton
reorganization, thus affecting vascular permeability, tissue permeability, and
stress fiber formation. Fibrosis can occur in multiple organs of the body and is
characterized mainly by hyperplasia of fibrous connective tissue and a reduction
in parenchymal cells [10, 11]. Under the influence of certain pathological
factors, the fibrotic response can occur in intraocular tissues, such as corneal
fibrosis, conjunctival fibrosis, retinal fibrosis, and scleral fibrosis [12, 13, 14].
During the development of fibrosis, fibrosis manifests mainly as extracellular
matrix (ECM) deposition and excessive generation of mesenchymal stromal cells
(such as fibroblasts and myofibroblasts), among which the activation of
fibroblasts plays an important role in the development of fibrosis [15]. In
fibrotic tissues, interstitial fibroblasts can be transformed into
myofibroblasts, which further accumulate and secrete excessive collagen,
eventually forming a fibrotic collagen network [16].
Additionally, dedifferentiated epithelial cells acquire mesenchymal markers,
which transform them into mesenchymal, stromal-like cells. A significant portion
of myofibroblasts during fibrosis are derived from fibroblasts transformed by
epithelial-mesenchymal transition (EMT) of epithelial cells [17]. Key regulators
of the EMT process include the Snail family transcription factors (Snail1 and
Slug), the Twist family transcription factors (Twist1 and Twist2), and the
transcription factor zinc finger E-box binding protein 1(Zeb1). An increase in
the expression levels of these transcription factors facilitates the occurrence
of EMT. EMT is the process by which epithelial cells differentiate into
mesenchymal cells. EMT is involved in development, wound healing, and stem cell
behavior, and it contributes to the development of fibrosis.
Additionally, transforming growth factor (TGF)- family signaling plays
a dominant role in reprogramming gene expression and in nontranscriptional
changes during EMT [18]. TGF- is involved in the development of
fibrosis, mainly by regulating ECM deposition and reducing ECM degradation by
inhibiting the activity of MMPs [19]. TGF-1 induces the activation of
the Rho-associated protein kinase (ROCK) signaling pathway and regulates the
expression of -smooth muscle actin (-SMA) and Col I [20].
Therefore, the TGF-/RhoA/ROCK signaling pathway may affect the ciliary
body morphology and ECM deposition to induce ciliary body fibrosis, leading to
dysfunction of the ciliary body and ultimately myopia progression. Currently, the
EMT and fibrosis of the ciliary body have not been studied in experimental myopia
guinea pig models. This study aimed to delineate the alterations in ciliary body
morphology and biomechanical properties during myopia, utilizing a –6.0 D
lens-induced guinea pig model of myopia (LIM). The expression levels of
TGF-1, RhoA, ROCK1/2, -SMA, and MMP-1 in LIM guinea pig
ciliary body were investigated. The present research will facilitate a better
understanding of the changes in the ciliary body microenvironment during myopia
progression, providing new insights into the pathogenesis of myopia.
2. Materials and Methods
2.1 Animals and Groups
The present study was approved by the Ethics Committee of the Affiliated
Hospital of Shandong University of Traditional Chinese Medicine (AWE-2022-055).
All the animal studies were performed in strict accordance with the ARVO
Statement for the Use of Animals in Ophthalmic and Vision Research. Three-color
short-haired healthy guinea pigs (2 weeks old, male, and 110–130 g) were
supplied by Danyang Changyi Experimental Animal Breeding Co., Ltd. In an animal
room with a constant temperature of 20–25 °C, all animals were reared
in clean, transparent plastic cages (5–6 per cage) under 300 lux light for a
12/12 h day and night cycle, with feeding conditions. Before enrollment, all
experimental animals received ocular examination by a computerized refractometer
(TOPCON, KR8900, Japan) and a hand-held retinal camera (Japan Kowa Co., Ltd.,
Genesis-D) to eliminate spontaneous myopia, cataracts, or corneal disease. After
a 1-week adaptive feeding period, the study cohort of 120 healthy guinea pigs
underwent randomization into the normal control (NC) and LIM group, 1-week (n =
40), 2-week (n = 40), and 6-week (n = 40) subgroups according to the duration of
myopia induction. To induce LIM, –6.0 D lenses were placed on the right eyes of
guinea pigs in the LIM group, while the left eyes, which received no treatment,
served as self-controls. The lenses were kept clean throughout the duration of
myopia progression, and the guinea pigs in the NC group received no intervention.
In addition, functional verification experiments were conducted using the ROCK
inhibitor Y-27632 (SJ-MX1027A, Shandong SparkJade Biotechnology Co., Ltd., Jinan,
China). In the Y27632 group of myopic guinea pigs, Y27632 was administered as eye
drops to the right eye three times a day at a concentration of 10 mM.
2.2 Measurement of Diopter and Axial Length
The diopter of the guinea pigs was evaluated before enrollment and after 1 week,
2 weeks, and 6 weeks of myopia induction. Prior to the examination, 10
gL-1 cyclopentolate hydrochloride eye drops (Alcon, USA) were
instilled into the conjunctival sac once every 5 min for a total of 3 times.
After the pupil was in a state of complete divergence, a strip retinoscope (Liu
Liu Vision Technology Co., Ltd., YZ24, Suzhou, China) was used for binocular
diopter detection. The diopter value was obtained from the average of the
vertical and horizontal meridians. The ocular axial length was measured by the
ophthalmic A-scan ultrasonography (Cinescan, Quantel Medical, France). The
instrument parameters were as follows [21]: the propagation velocity of the
anterior chamber was 1557 ms-1, the propagation velocity of the
vitreous body was 1540 ms-1, and the propagation velocity of the
lens was 1723 ms-1. Before the measurements, the guinea pigs in
each group were anesthetized with 4 mgmL-1 Obukaine hydrochloride
eye drops (Santen Pharmaceutical Co., Ltd., Japan), and the probe was then gently
touched to the cornea to measure the axial length. The average value of 10
continuous measurements represented the final axial length of the guinea pig. All
the above measurements of diopter and axial length were conducted by the same
inspector under the same operating standards. All experiments were independently
repeated at least three times, and all measurement data are presented as means
SEM (n = 30).
2.3 Ciliary Body Isolation
After 1, 2, and 6 weeks of myopia induction, the guinea pigs in each group were
anesthetized by intraperitoneal injection of 3% pentobarbital sodium (30 mg/kg), and
the right eyeballs were removed. The ciliary body tissue was then isolated under
a microscope. The ciliary body tissue was washed in 1 PBS rinse
solution (CR0014, SparkJade, China), placed in cryogenic vials (NEST Biotech,
Wuxi, China), weighed, quickly frozen in liquid nitrogen, and stored at –80
°C. The guinea pigs were euthanized by an additional intraperitoneal
injection of pentobarbital sodium (200 mg/kg) to achieve excessive anesthesia.
2.4 Real-Time Quantitative Polymerase Chain Reaction (RT-qPCR)
At the indicated times, the ciliary bodies of guinea pigs were randomly
isolated, and total RNA was isolated with a modified SPARKeasy tissue/cell RNA
extraction kit (AC0202-B, SparkJade, Jinan, China). Some of these RNA samples were also
used for subsequent RT2 Profiler™ PCR Array detection. After
the transcription of cDNA, the expression levels of the TGF-1,
RhoA, ROCK1, ROCK2, -SMA, MMP1, Snail1, Slug, Twist1, Twist2, and
Zeb1 genes in the ciliary body were detected by RT-qPCR. The primer
sequences are listed in Table 1, and the specificity of the RT-qPCR product was
confirmed by melting curve analysis. The following PCR cycling program was used:
30 s at 95 °C; 45 cycles of 10 s at 95 °C and 10 s at 62
°C. All experiments were independently repeated at least three times,
and these RT-qPCR data are presented as means standard error of the mean
(SEM) (n = 6). To quantify relative gene expressions in the ciliary body,
transcript levels were normalized to the housekeeping gene
Glyceraldehyde-3-phosphate dehydrogenase (GAPDH) and calculated via the
2-ΔΔCT method.
Table 1.
Primer sequences of Q-PCR reaction.
| Gene |
Primer sequences |
| GAPDH |
F: 5′-CTGACCTGCCGCCTGGAGAAACC-3′ |
| R: 5′-ATGCCAGCCCCAGCGTCAAAAGT-3′ |
| TGF-1 |
F: 5′-AACCGGCCCTTCCTGCTCCTCAT-3′ |
| R: 5′-CGCCGGGGTTGTGCTGGTTGTA-3′ |
| RhoA |
F: 5′-TTTCTGTCCCAACGTACCCATTAT-3′ |
| R: 5′-ACAAGACAAGGCACCCAGATTTTT-3′ |
| ROCK1 |
F: 5′-ATGAAGGGGAATGTAGAAAAGACG-3′ |
| R: 5′-TTGGCAGGAAAGTGGTAGAGTGTA-3′ |
| ROCK2 |
F: 5′-CGAGGCCGAGCAGTATTTCT-3′ |
| R: 5′-TCGGCGAGCTCCTGTTTGTG-3′ |
| -SMA |
F: 5′-CCGGCTTTGCTGGGGACGAT-3′ |
| R: 5′-CCGGTTGGCCTTGGGATTGAG-3′ |
| MMP1 |
F: 5′-CAGAGGAGAACACGGTGACAATAA-3′ |
| R: 5′-CATGAGCCGCAGAATAATACAAGT-3′ |
| Snail1 |
F: 5′-ATGCCGCGCTCGTTCCTTGTCA-3′ |
| R: 5′-GCCCTTCCCGCTGTCCTCGTCA-3′ |
| Slug (Snail2) |
F: 5′-TGCCGCGCTCCTTCCTG-3′ |
| R: 5′-ATGGTAATGGGGCTGTATGCTC-3′ |
| Twist1 |
F: 5′-GCAGGGCAAGCGCGGCAAAAA-3′ |
| R: 5′-CCGAGGGCAGAGTGGGGATGAT-3′ |
| Twist2 |
F: 5′-CGGGCAAGCGCGGCAAGAA-3′ |
| R: 5′-CGAGGGCAGCGTGGGGATGAT-3′ |
| Zeb1 |
F: 5′-CACAGTCTGGGGGTAATCGTAAAT-3′ |
| R: 5′-TTGTGGCCGGGTGGGACTG-3′ |
GAPDH, Glyceraldehyde-3-phosphate dehydrogenase; TGF,
transforming growth factor; RhoA, Ras homolog family member A;
ROCK, Rho-associated protein kinase; -SMA,
-smooth muscle actin; MMP, matrix metalloproteinase;
Snail (Slug), Snail family transcriptional repressor;
Twist, Twist transcription factor; Zeb1, zinc finger E-box
binding protein 1.
2.5 Western Blot Analysis
At the indicated times, the ciliary body tissues of the right eye of the guinea
pigs in each group were separated (n = 6), and total protein was extracted with
radioimmunoprecipitation assay (RIPA) lysis buffer (EA0002, Sparkjade, China)
containing phenylmethylsulfonyl fluoride (PMSF) (EA0005, Sparkjade, China). After
homogenization and sonication, the lysed tissues were centrifuged at 5000
g for 5 min, and the supernatants were collected. The concentration of
total protein was measured with an enhanced BCA protein concentration assay kit
(P0010, Beyotime, Shanghai, China) in a 96-well plate (NEST Biotech., Wuxi, China). The
proteins were separated on 10% sodium dodecyl sulfate (SDS)-polyacrylamide gel
electrophoresis (PAGE) gels (EC1023-B, SparkJade, China) and then transferred to
a polyvinylidene fluoride (PVDF) membrane. The PVDF membrane was subsequently
blocked with 5% nonfat milk solution for 1.5 h. After blocking, the PVDF
membrane was incubated at 4 °C overnight with the primary antibody
mixture (dilution ratio = 1:1000, ED0013) (Table 2). The PVDF membrane was then
incubated with goat anti-rabbit IgG (H+L) HRP (EF0002, SparkJade, China) diluent
(dilution ratio = 1:5000) for 1 hour. Finally, the FUSION FX multifunction
imaging system (Vilber Lourmat, Marne-la-Vallée, France) was applied to
capture the images and quantified by using the Fusion CAPT software (Vilber
Lourmat, France).
Table 2.
Primary antibody reagents.
| Name |
Source |
| Rabbit Anti-TGF beta1 (bs-0086R) |
Bioss Biotechnology Co., Ltd., Beijing |
| RhoA Rabbit pAb (A13947) |
Wuhan Aibotech Biotechnology Co., Ltd. |
| Rabbit Anti-ROCK1 (bs-1166R) |
Bioss Biotechnology Co., Ltd., Beijing |
| Rabbit Anti-ROCK2 (bs-1205R) |
Bioss Biotechnology Co., Ltd., Beijing |
| Rabbit Anti-alpha smooth muscle Actin (bs-0189R) |
Bioss Biotechnology Co., Ltd., Beijing |
| Rabbit Anti-MMP-1 (bs-4597R) |
Bioss Biotechnology Co., Ltd., Beijing |
| Rabbit Anti- E-Cadherin (F0005) |
Selleck Biotechnology Co., Ltd., USA |
| Anti-N-Cadherin Rabbit pAb (WL01047) |
Wanleibio Co., Ltd., Shenyang |
| -Actin Rabbit mAb (High Dilution) (AC026) |
Wuhan Aibotech Biotechnology Co., Ltd. |
2.6 Detection of RhoA Activity by G-LISA Assay
Ciliary body tissues of guinea pigs from each group were isolated and placed on
ice, followed by protein extraction using ice-cold lysis buffer and subsequent
protein quantification. RhoA activity was determined by the
G-LISA® RhoA Activation Assay (BK124-L, cytoskeleton, USA).
Protein concentrations were normalized to 0.2 mg/mL, and samples were loaded in
triplicate along with blank and positive controls onto RhoA-GTP coated plates.
After incubating at 4 °C for 30 min with shaking, the plates were washed
and incubated with anti-RhoA primary antibody (45 min, room temperature, 400
rpm), followed by a secondary antibody under the same conditions. HRP substrate
was added after the final washes, and the reaction was stopped after 15 min at 37
°C. Absorbance was measured at 490 nm using a microplate reader.
2.7 RT2 profiler™ PCR Array for Fibrosis
To explore the changes in fibrosis-related gene expression in the ciliary body
of the LIM guinea pigs, the RT2 Profiler™ PCR Array (Qiagen,
Germany) for fibrosis was used. Briefly, RNA from the ciliary body in the NC and
LIM groups was extracted after myopia induction for 2 weeks, and cDNA was
synthesized (AG0302-B, Sparkjade, China). The PCR array assay was performed
according to the manufacturer’s instructions. The cycle threshold (CT) values
were calculated using the PCR machine’s program, followed by PCR array data
analysis.
2.8 Ingenuity Pathway Analysis (IPA)
Differentially expressed genes (DEGs) were defined as those meeting the
following criteria: a false discovery rate (FDR) of 0.01, an absolute fold
change of 1.5, and a p-value 0.05. IPA is a web-based
software application (http://www.ingenuity.com) that identifies biological
pathways and functions associated with biomolecules. After uploading the screened
DEGs to the IPA bioinformatics analysis suite (version 1.0, QIAGEN, DUS,
Germany), IPA classical signaling pathway analysis, disease and functional
analysis, upstream regulatory factor analysis, and downstream disease and
functional enrichment analysis were performed.
2.9 PacBio Sequencing
After 2 weeks of myopia induction, the ocular ciliary body of guinea pigs in the
NC and LIM groups was separated under sterile conditions, and total RNA was
extracted and purified. The RNA integrity number (RIN) was assessed after
purification, and the total RNA content was 2 µg, the RIN value was
8, and the OD value/280 ratio was 2.0~2.2 for each sample
(n = 3). A single-molecule real-time (SMRT) sequencing platform was used to
perform PacBio sequencing for each sample. DESeq2 was used to identify
differentially expressed (DE) genes in the NC and LIM groups, employing screening
criteria of a fold change between groups 1.5 and an adjusted
p value 0.05. Gene annotation enrichment analysis was then performed
on the differentially expressed genes using Metascape (https://metascape.org).
2.10 Masson’s Staining
After 6 weeks of myopia induction, the eyes from the NC, LIM, and Y27632 groups
were separated and immediately placed in EP tubes containing fixative solution
for 24 h for routine dehydration, paraffin embedding, and sectioning for Masson’s
staining (Servicebio Co., Ltd., Wuhan, China) (n = 3). Briefly, eyeballs were
fixed with 4% paraformaldehyde, and the sections were subjected to routine
dehydration, paraffin embedding, and dewaxing in water. After overnight
incubation with potassium dichromate, ferric hematoxylin, phosphomolybdate,
aniline blue, and ponceau acid magenta were used for staining. Finally, the
sections were dehydrated and then sealed. With this staining method, collagen
fibers appear blue, muscle fibers appear red, and cell nuclei appear blue-black.
2.11 Immunohistochemistry (IHC)
After fixing the ciliary body tissue with eye fixative, it was subjected to
routine dehydration, paraffin embedding, sectioning, and dewaxing. The tissue
sections were then blocked with 5% bovine serum albumin, followed by incubation
with -SMA and Col-1 primary antibodies at 4 °C overnight.
After washing with PBS, the tissue sections were incubated with a secondary
antibody at 37 ℃ for 30 min. Subsequently, the samples were washed with PBS and
subjected to DAB staining. Finally, tissue sections were imaged under a light
microscope, and the resulting micrographs were quantified using ImageJ software.
2.12 Immunofluorescence (IF)
After 6 weeks of myopia induction, the eyeballs were separated (n = 3). The same
procedure was performed as described for IHC. After antigen retrieval, the
sections were washed with PBS (5 min 3) and blocked with BSA, which
was added dropwise, for 30 min. The primary antibody against TGF-1 was
added dropwise, followed by incubation at 4 °C overnight. The tissue
sections were then incubated with a secondary antibody for 50 min, followed by
incubation in the dark with DAPI staining solution for 10 min. The tissue
sections were quenched with an autofluorescence quencher for 5 min, sealed with
an antifluorescence quencher, and observed by a fluorescence microscope (Nikon,
Eclipse, 55i, Tokyo, Japan).
2.13 Transmission Electron Microscopy (TEM)
The right eyes of the guinea pigs in the NC and LIM groups (n = 3) were immersed
in electron microscope fixation solution (Wuhan Sevier Biotechnology Co., Ltd.,
Wuhan, China) at 4 °C for 4 h. Next, the ciliary body tissue was cut to
approximately 1 mm 1 mm 1 mm, fixed for 24 h, washed with
PBS, and then fixed with 1% osmium acid. The sections were subsequently rinsed
with gradient ethanol and dehydrated with acetone. Finally, the tissue sections
were observed via TEM (Hitachi, Ltd., HT7700, Japan).
2.14 Young’s Modulus
Young’s modulus is a physical quantity that describes the resistance of a solid
material to deformation. It is also referred to the tensile modulus. Young’s
modulus is the most common type of elastic modulus, and it measures the stiffness
of an isotropic elastomer. The mechanical properties of guinea pig ciliary body
tissue from each group were evaluated using the Piuma nanoindentation system
(OPTICS11, Amsterdam, Netherlands) (n = 3). To minimize the effects of
post-mortem tissue autolysis and alterations in biomechanical properties, all
nanoindentation tests were completed within 60 min post-enucleation. The entire
testing procedure was conducted at a physiological temperature of 37 °C
to simulate the in vivo environment, utilizing a stage-top incubator
system. To prevent dehydration and subsequent stiffening of the tissue, the
ciliary body samples were continuously immersed in pre-warmed PBS throughout the
indentation process, ensuring normal hydration and mechanical properties. All
indentation tests were performed using a spherical tip with a radius of 27
µm and a cantilever with a stiffness of 0.49 N/m, and the indentation was
applied at the center of each piece of ciliary tissue. The elastic modulus of the
ciliary tissue was determined, and the data were analyzed using DataViewer v2
(Amsterdam, the Netherlands).
2.15 Noninvasive Micro-Test Technology (NMT)
NMT (Younger USA LLC) was used to measure Ca2+ fluxes in the ciliary body
tissues of guinea pigs in each group, using a 35 mm cell culture dish. Firstly,
prepare, install, and calibrate Ca2+ selective microelectrodes. Fill the
back of the glass microsensor with electrolyte (100 mmol/L CaCl2), with a
length of about 1 cm from the tip; then fill the tip of the glass microsensor
with 40 µm of Ca2+ liquid ion exchanger (XY-SJ Ca, Younger US); After
calibration with 1 mmol/L, 0.5 mmol/L, and 0.05 mmol Ca2+ calibration
solutions, electrodes with slopes 22 mV/decade can be used for subsequent
detection. After 6 weeks of myopia induction, the ciliary body tissue of each
group of guinea pigs was isolated under sterile conditions (n = 3), immobilized
in PBS, and then placed in the test solution. To measure the changes in Ca2+
concentration occurring outside the tissue membrane, the electrode movement
frequency, or sampling frequency, was set at 0.3 Hz. After recording for 5 min,
the raw data microvolt differences (µV) were imported and
converted into the Ca2+ flux using JCal version 3.3 (Miami, FL, USA).
2.16 Functional Experiments on the Intervention Effect of ROCK
Inhibitors
To clarify the primary driving role of TGF-/RhoA/ROCK pathway
activation in myopic ciliary body EMT and fibrosis, we performed functional
validation experiments using the ROCK inhibitor Y-27632. After 6 weeks of Y-27632
intervention, the binocular refraction and axial length of myopic guinea pigs
were measured. Additionally, Masson staining, IHC, and IF assays were combined to
further explore the levels of ciliary body EMT and fibrosis following Y-27632
intervention.
2.17 Statistical Analysis
The results are presented as means SEM, and SPSS statistical software
(SPSS Version 20.0, Chicago, USA) was used to analyze the data. For comparisons
across multiple groups, we first assessed normality and homogeneity of variance.
Upon confirmation, one-way ANOVA was applied, followed by Tukey’s post hoc test
for all pairwise comparisons. p 0.05 was considered significantly
different. Unless otherwise noted, each experiment was repeated three or more
times with biologically independent samples.
3. Results
3.1 Changes in Diopter Values and Axial Lengths
Before myopia induction, there were no statistically significant differences in
diopter values (NC vs. LIM. 3.70 1.36 D vs. 3.35 1.03 D) or axial
lengths (NC vs. LIM. 8.04 0.09 mm vs. 8.07 0.11 mm) between the
NC and LIM groups (p 0.05). After 1, 2, and 6 weeks of myopia
induction, the diopter values (NC vs. LIM. 1 w: 2.68 1.02 D vs. –2.20
1.49 D; 2 w: 2.52 1.28 D vs. –2.81 1.91 D; 6 w: 2.27
1.05 D vs. –4.93 1.10 D) of the right eyes in the LIM group were
significantly greater than those in the NC group (all p 0.001) (Fig. 1A). Compared with those in the NC group, the differences in diopter values (NC
vs. LIM. 1 w: 0.87 1.22 D vs. –2.60 0.88 D; 2 w: 0.16
1.32 D vs. –3.89 1.77 D; 6 w: 0.47 0.65 D vs. –5.77
1.07 D) between the right eyes and the left eyes in the LIM group were
significantly greater (all p 0.001) (Fig. 1B). After 1 week, 2 weeks
and 6 weeks of lens-induced myopia, the axial lengths (NC vs. LIM. 1 w: 8.17
0.05 mm vs. 8.23 0.08 mm; 2 w: 8.18 0.06 mm vs. 8.29
0.07 mm; 6 w: 8.40 0.10 mm vs. 8.72 0.13 mm) of the right
eyes in the LIM group were significantly greater than those in the NC group (all
p 0.05) (Fig. 1C), and the differences in axial length (NC vs. LIM.
1 w: 0.00 0.02 mm vs. 0.05 0.03 mm; 2 w: 0.02 0.05 mm vs.
0.09 0.07 mm; 6 w: 0.03 0.09 mm vs. 0.14 0.05 mm) between
the right eyes and the left eyes were significantly greater than those in the NC
group (all p 0.05) (Fig. 1D). Moreover, during the process of
lens-induced myopia, the body weight, food intake and other behavioral activities
of guinea pigs in the LIM group did not significantly chang from those in the NC
group.
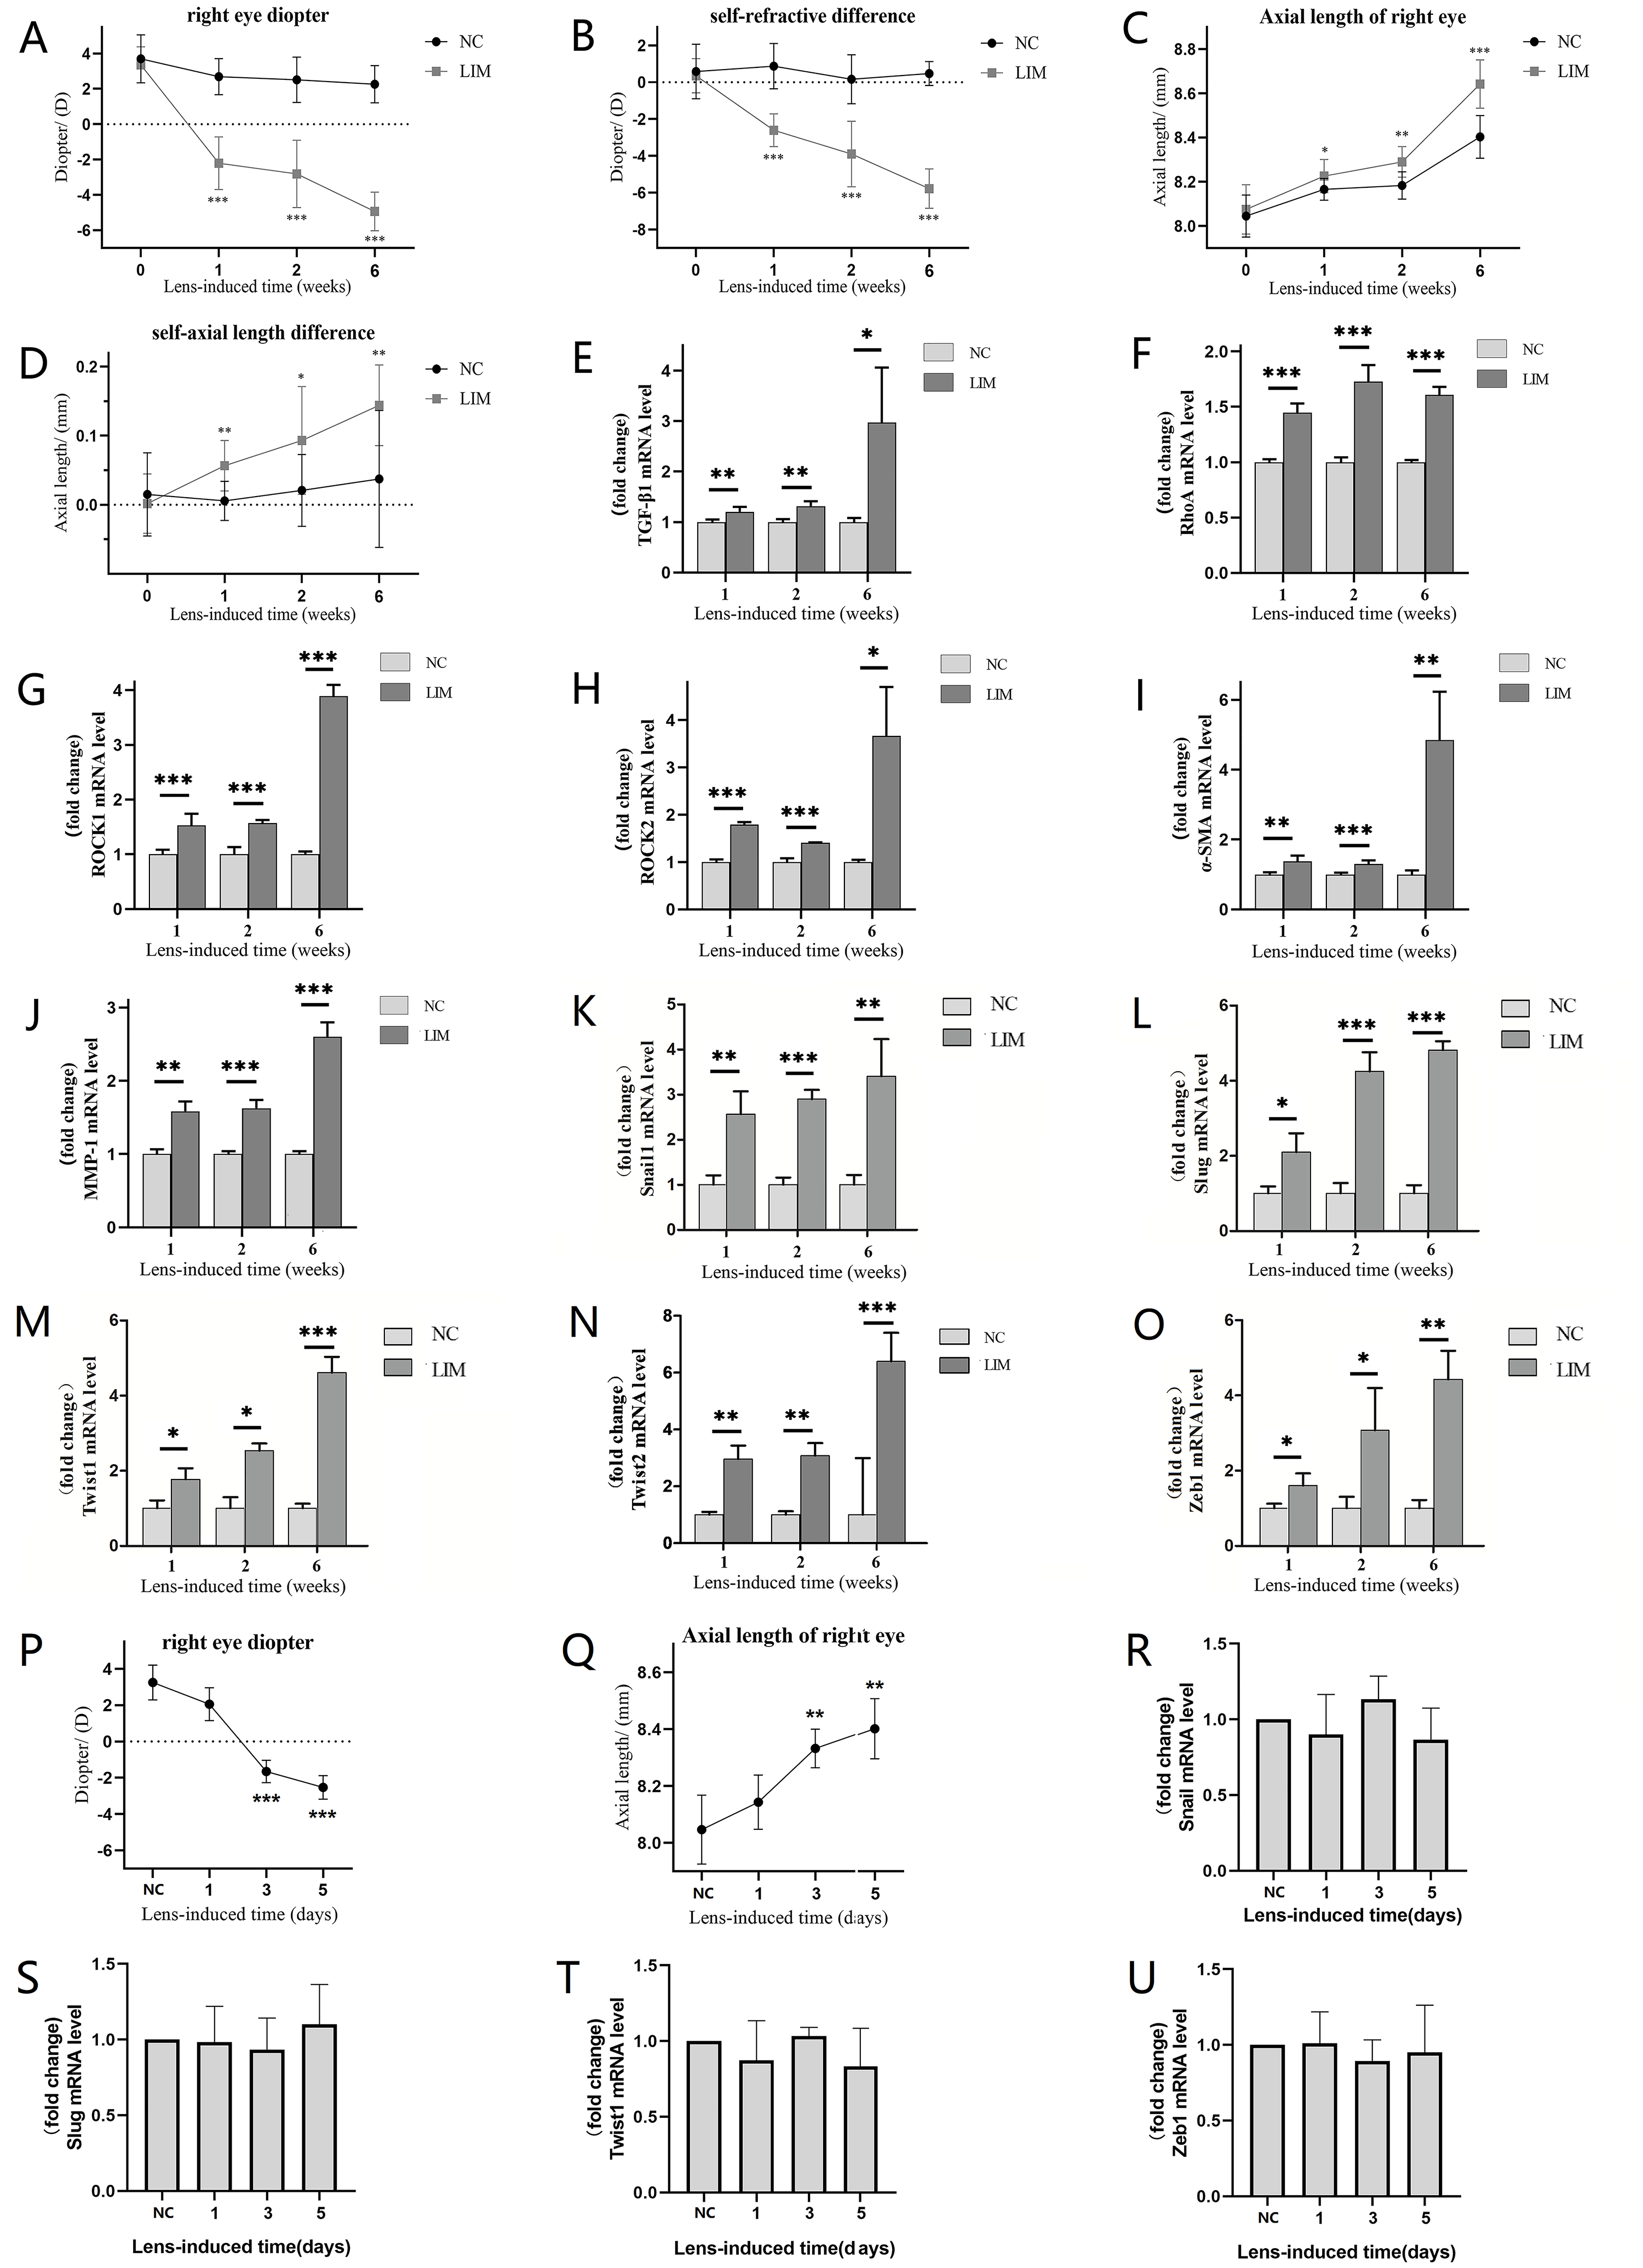 Fig. 1.
Changes in diopter, axial length, TGF-/RhoA/ROCK
signaling pathway, EMT transcription factors, and fibrosis-related genes in the
ciliary body of guinea pigs in each group after 1-, 2-, and 6-week myopia
induction. (A) The diopter of the right eye in the LIM group was significantly
higher than that in the NC group. (B) The diopter difference between the right
eye and the left eye in the LIM group was significantly increased compared with
the NC group. (C) The axial length of the right eye in the LIM group increased
compared with the NC group. (D) The difference between the axial lengths of the
right eye and the left eye in the LIM group was significant. (E) The expression
of TGF-1 mRNA. (F) The expression of RhoA mRNA. (G)
The expression of ROCK1 mRNA. (H) The expression of ROCK2 mRNA.
(I) The expression of -SMA mRNA. (J) The expression of
MMP1 mRNA. (K) The expression of Snail1 mRNA. (L) The
expression of Slug mRNA. (M) The expression of Twist1 mRNA. (N)
The expression of Twist2 mRNA. (O) The expression of Zeb1 mRNA.
(P) The diopter changes of the right eye in the LIM group in the ultra-early
stage of lens-induced myopia. (Q) The axial length changes of the right eye in
the LIM group in the ultra-early stage of lens-induced myopia. (R) The expression
of Snail1 mRNA in the ultra-early stage of lens-induced myopia. (S) The
expression of Slug mRNA in the ultra-early stage of lens-induced myopia. (T) The
expression of Twist1 mRNA in the ultra-early stage of lens-induced
myopia. (U) The expression of Zeb1 mRNA in the ultra-early stage of
lens-induced myopia. All RT-qPCR data are presented as mean standard
error of the mean (SEM) (n = 6). *p 0.05, **p 0.01, and
***p 0.001. TGF, transforming growth factor; RhoA,
Ras homolog family member A; ROCK, Rho-associated protein kinase;
-SMA, -smooth muscle actin; MMP, matrix
metalloproteinase; LIM, lens-induced myopia; NC, normal control.
3.2 TGF-/RhoA/ROCK Signaling Pathway, EMT Transcription
Factors, and Fibrosis-Related Genes in Ciliary Body
After 1, 2, and 6 weeks of myopia induction, the mRNA expression levels of
TGF-1 (Fig. 1E), RhoA (Fig. 1F), ROCK1 (Fig. 1G), ROCK2 (Fig. 1H),-SMA (Fig. 1I), and
MMP1 (Fig. 1J) in the ciliary body of the LIM group were significantly
greater than those in the NC group (all p 0.01), and these
TGF-/RhoA/ROCK signaling pathway components and fibrosis-related genes
increased more significantly after 6 weeks of myopia induction. Furthermore, the
mRNA expression levels of EMT transcription factors such as Snail1 (Fig. 1K), Slug (Fig. 1L), Twist1 (Fig. 1M), Twist2 (Fig. 1N), and Zeb1 (Fig. 1O) in the ciliary body of the LIM group were
significantly higher than those in the NC group after 1-, and 2-week myopia
induction (all p 0.01), confirming that EMT occurred in the ciliary
body at the early stage of myopia. However, to clarify whether EMT-mediated
fibrosis is the initiating event or merely a consequence of prior functional
alterations, we dynamically monitored EMT transcription factors, refractive
error, and axial length parameters at ultra-early time points (1, 3, and 5 days).
This aimed to evaluate the relationship between the temporal sequence of EMT and
functional changes with earlier times. Results showed that on day 1 after lens
induction, there were no significant differences in the refractive error or axial
length of the right eye between the LIM group and the NC group (Fig. 1P,Q), nor
were there notable changes in the mRNA levels of EMT-related transcription
factors (Fig. 1R–U). On days 3 and 5 after lens induction, the refractive error
and axial length of the right eye in the LIM group increased significantly (all
p 0.01), while the mRNA levels of EMT-related transcription factors
remained unchanged (Fig. 1R–U). These findings indicate that functional changes,
such as increases in biological parameters of refractive error and axial length,
occur earlier than alterations in EMT transcription factor levels during the
ultra-early stage of lens-induced myopia. This suggests that EMT-mediated
fibrosis is not an initiating event but merely a consequence of prior functional
modifications.
3.3 TGF-/RhoA/ROCK Signaling- and Fibrosis-Related Proteins
in the Ciliary Body
As shown in Fig. 2A, after 1, 2, and 6 weeks of myopia induction, the protein
levels of TGF-1 (Fig. 2B), ROCK1 (Fig. 2D), and ROCK2 (Fig. 2E) in the
ciliary body of LIM eyes were significantly greater than in the NC group (all
p 0.05). In addition, the protein expression of RhoA (Fig. 2C),
-SMA (Fig. 2F), and MMP1 (Fig. 2G) in the ciliary body of LIM eyes was
significantly greater in the LIM group than in the NC group (all p
0.01), and the increases were especially significant at 6 weeks after myopia
induction (all p 0.01). The protein expression of N-cadherin (Fig. 2H,J) in the ciliary body of guinea pig eyes in the LIM group after inducing
myopia for 1, 2, and 6 weeks was significantly higher than that in the NC group
(all p 0.05). After inducing myopia for 2 and 6 weeks, the
expression of E-cadherin (Fig. 2H,I) protein in the ciliary body of guinea pig
eyes in the LIM group increased (all p 0.05), and the expression was
particularly significant at 6 weeks after inducing myopia (all p
0.05). Moreover, the results showed that after inducing myopia for 1, 2, and 6
weeks, the activity of RhoA in the ciliary body of guinea pigs in the LIM group
was higher than that in the NC group (Fig. 2K) (all p 0.05), and it
was particularly significant at 6 weeks, suggesting that the occurrence and
development of myopia are closely related to the activation of the RhoA signaling
pathway.
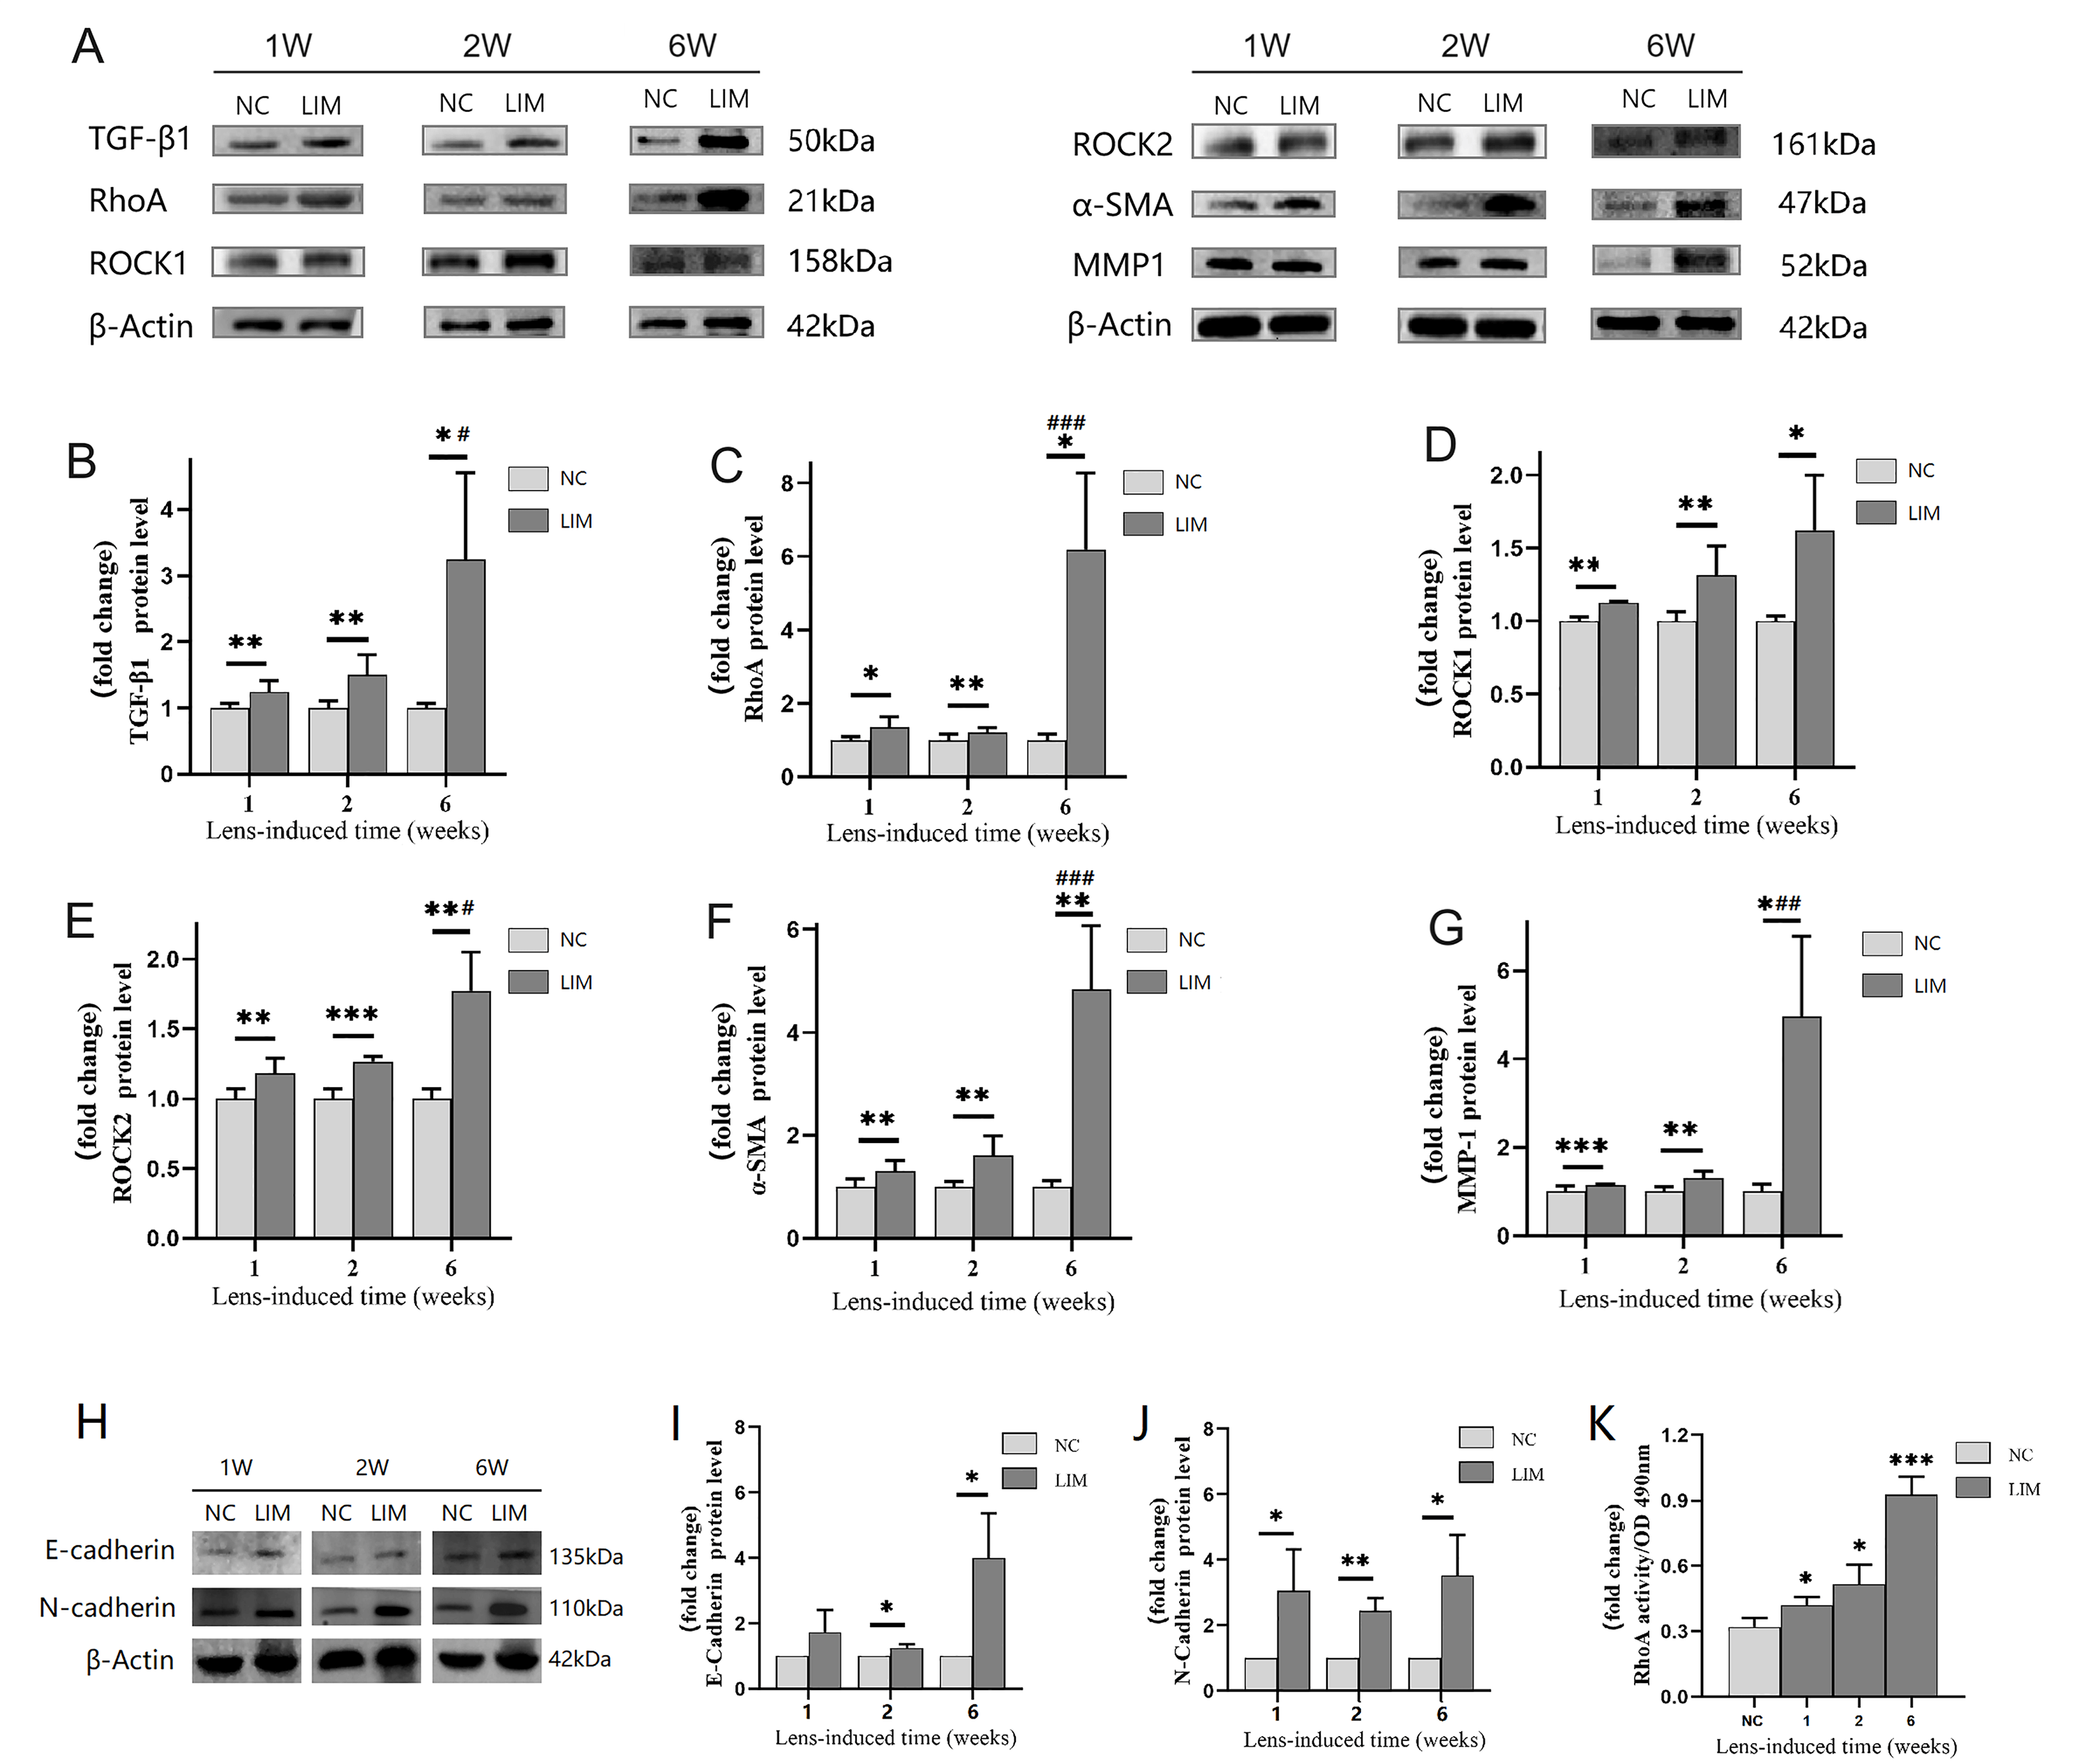 Fig. 2.
The protein levels related to the TGF-/RhoA/ROCK
signaling pathway and fibrosis in the ciliary body. (A) TGF-/RhoA/ROCK
signaling pathway and fibrosis related protein expression. (B–G) Histogram of
optical density analysis in TGF-1, RhoA, ROCK1, ROCK2, -SMA
and MMP-1 proteins. (H) Expression of E-cadherin and N-cadherin proteins. (I)
Histogram of optical density analysis in E-cadherin protein. (J) Histogram of
optical density analysis in N-cadherin protein. (K) G-LISA detection of RhoA
activity. All data are presented as mean SEM (n = 6). Compared with the
NC group, *p 0.05, **p 0.01, and ***p
0.001. Compared with the LIM group in week 1, #p 0.05,
##p 0.01, and ###p 0.001.
3.4 Fibrosis RT2 Profiler PCR Array
Fig. 3 shows that there were 42 DEGs in the LIM group (vs. NC), including 35
upregulated DEGs (red) and 7 downregulated DEGs (blue) (Fig. 3A). Further
analysis of the DEGs revealed that the upregulated genes accounted for 41.67% of
the 84 gene arrays, and 31.43% of the upregulated genes had differential
multiples 2.0, indicating that many fibrosis-related mechanisms were
activated in the ciliary body of guinea pigs with myopia (Fig. 3B). Moreover,
cluster analysis of the expression degree of DEGs in all the groups revealed
upregulated genes related to fibrosis, which involved mainly Tgfbr2, Col3a1,
Col1a2, and Hgf, as well as matrix metalloproteinase (MMP) family genes (Mmp2,
Mmp3, Mmp9, and Mmp14). These findings suggested that the pathological process of
myopia is associated with the activation of the TGF- signaling pathway
and the involvement of tissue repair processes such as fibrosis (Fig. 3C).
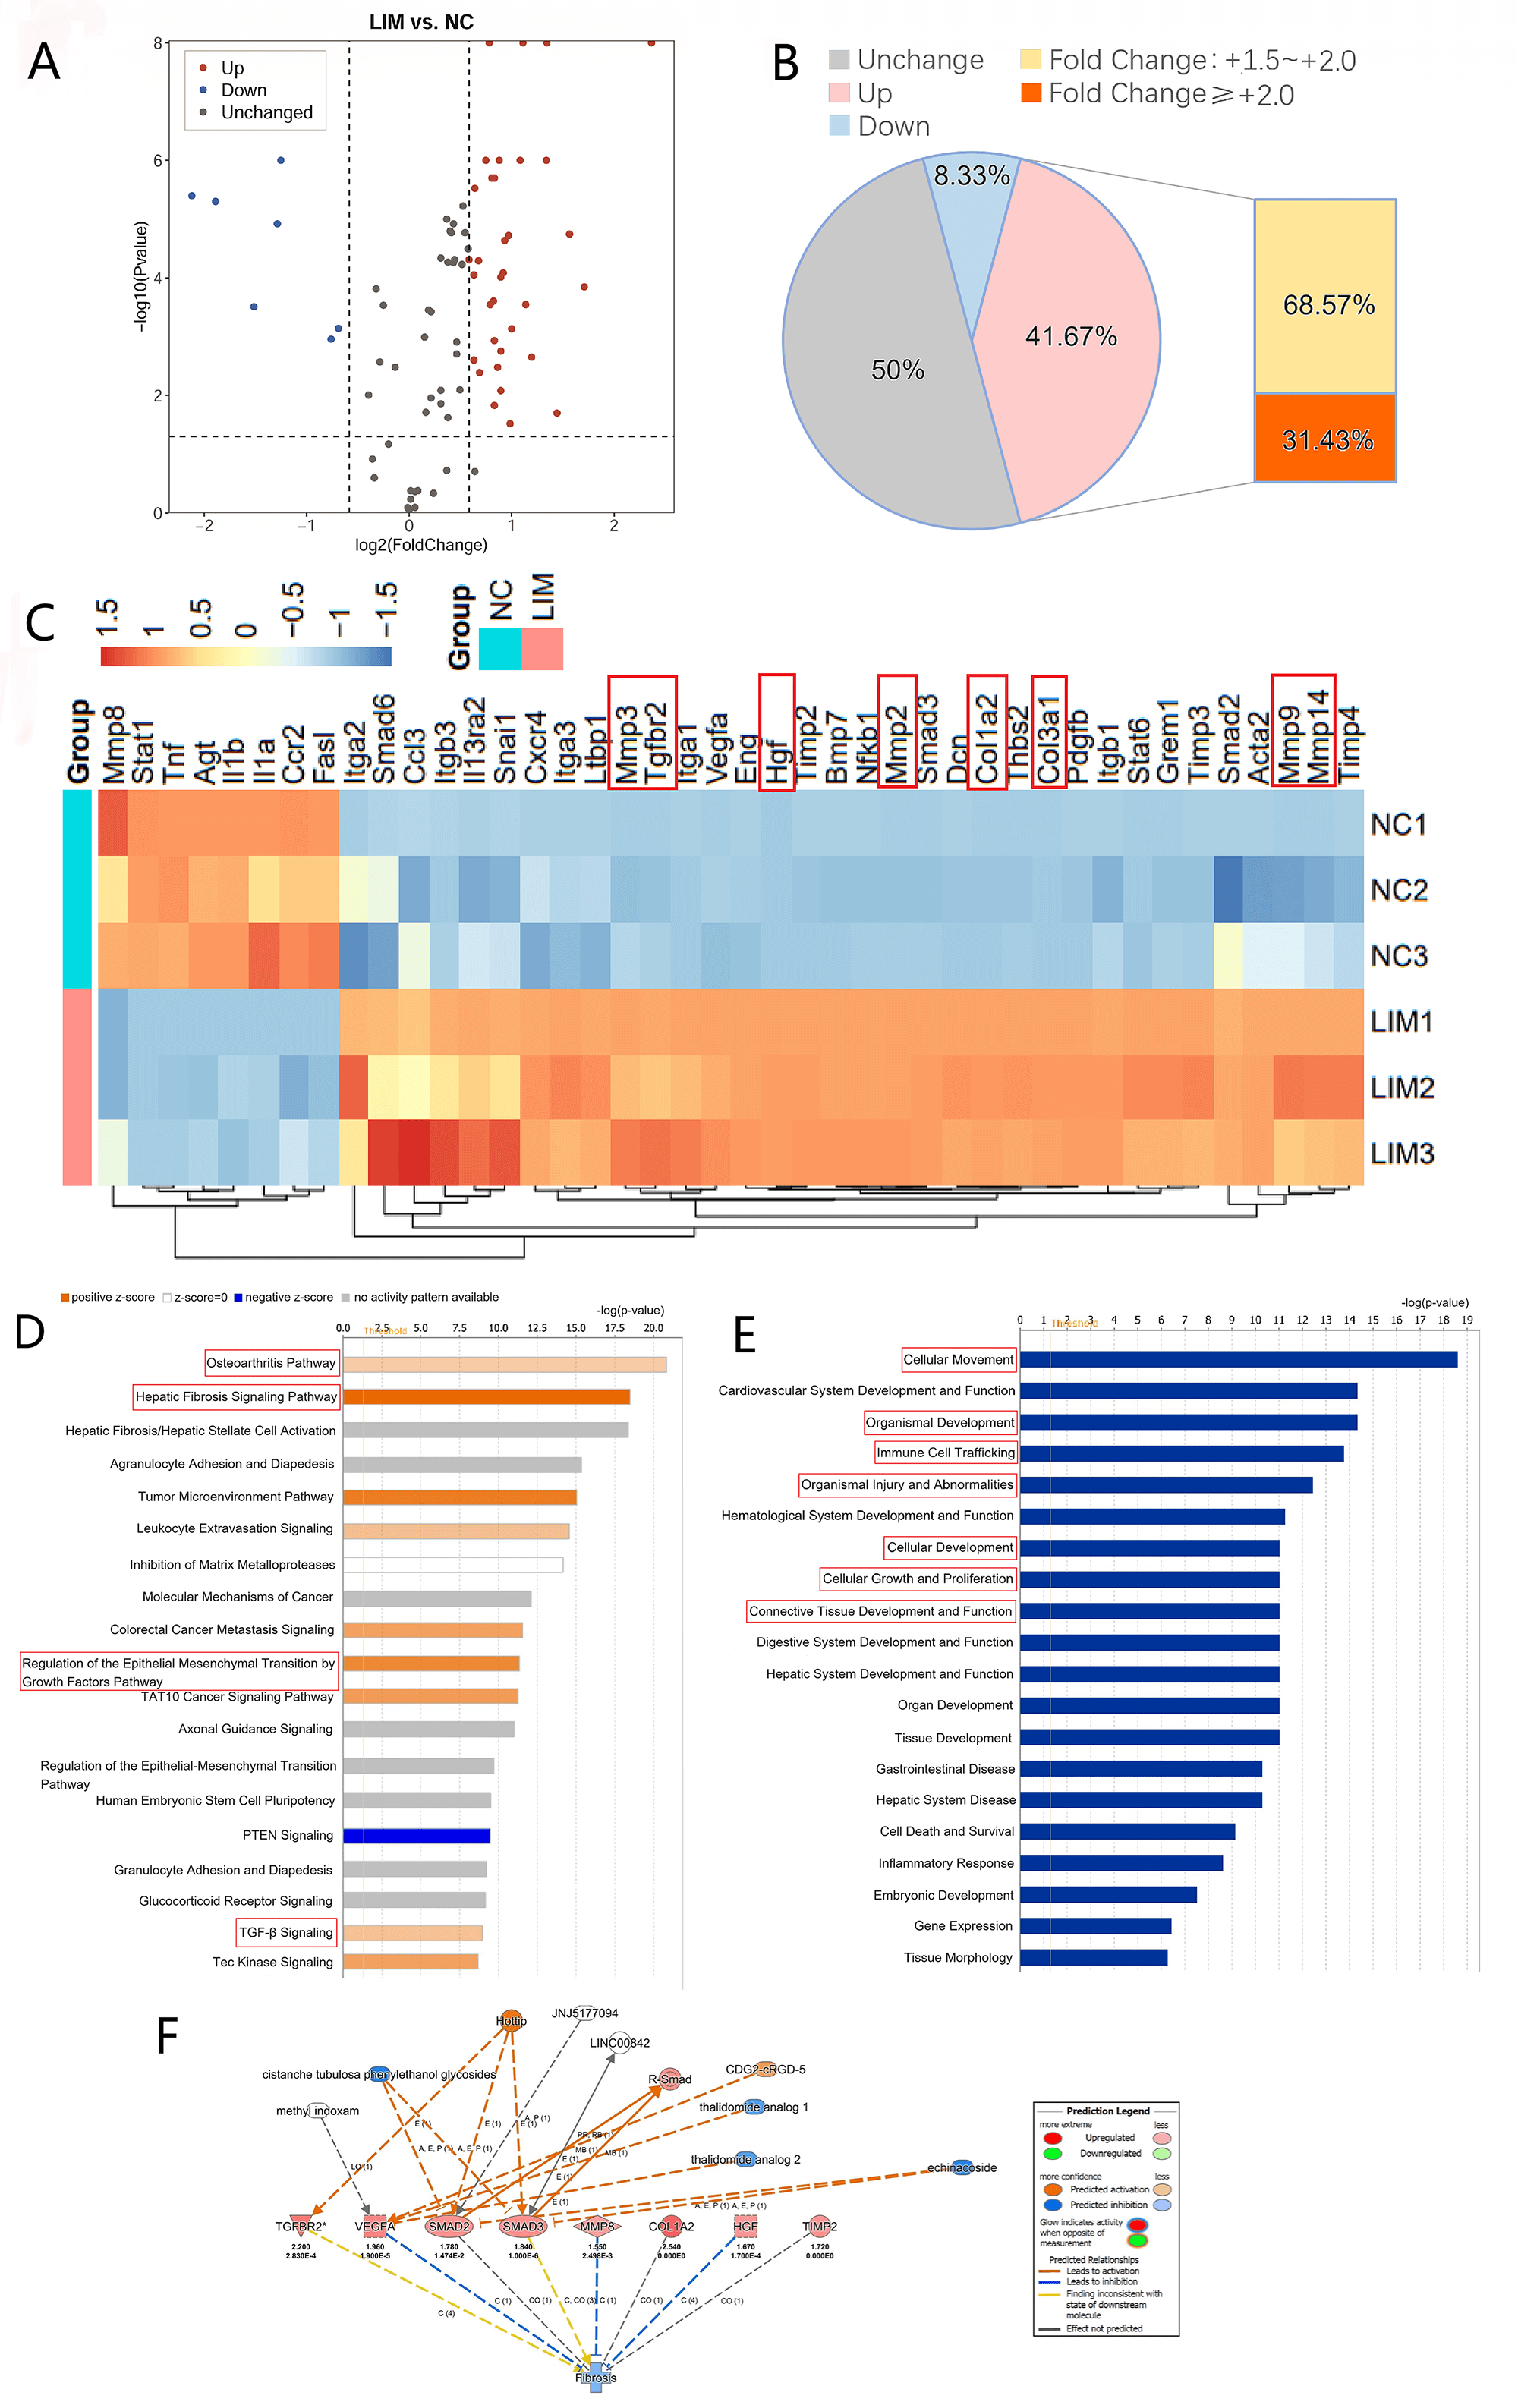 Fig. 3.
Changes in 84 gene levels related to fibrosis and Ingenuity
pathway analysis of DEGs in the ciliary body fibrosis PCR array of the LIM group
in the ciliary body tissue of each group after 2-week myopia induction (n = 3).
(A) Volcano map of 84 fibrosis related genes, compared with the NC group, among
the DEGs in the LIM group with a fold difference 1.5 and
p 0.05. (B) Pie chart of 84 fibrosis-related genes in different
categories. (C) Heat maps of 42 DEGs detected by 84 gene array of fibrosis, the
gene clustering was enrichment analyzed based on the similarity of gene
expression between samples. (D) IPA classical signaling pathway analysis. (E)
Disease and functional analysis. (F) Upstream regulatory factors and downstream
disease and function enrichment analysis. DEGs, Differentially expressed genes;
IPA, Ingenuity pathway analysis.
3.5 IPA
IPA revealed that the pathways associated with the DEGs were activated in the
LIM group compared with those in the NC group (Fig. 3D), and these pathways
involved mainly the osteoarthritis pathway, the hepatic fibrosis signaling
pathway, the regulation of EMT by the growth factor pathway, and the
TGF- signaling pathway. Disease and function analyses of the DEGs
revealed that the differential genes in the LIM group (vs. the NC group) were
related mainly to cellular growth and proliferation, cellular movement, cellular
development, and immune cell trafficking. In addition, the DEGs in the LIM group
(vs. the NC group) affected organizational development, organizational injury and
abnormalities, connective tissue development, and function (Fig. 3E). Thus,
during the development of myopia, cell metabolism and homeostasis may be
significantly affected, and the development and function of tissues and organs in
the body may be significantly altered, eventually leading to tissue damage and
abnormalities (Fig. 3E). Moreover, the upregulation of MMP8 and HGF may lead to
the inhibition of ciliary body fibrosis in guinea pigs with myopia (Fig. 3F).
3.6 PacBio Sequencing
In total, 139 DEGs were identified in the ciliary muscle tissue of guinea pigs
in the NC group and LIM group, including 29 upregulated genes and 120
downregulated genes. The cell type dot plot revealed that the DEGs were
associated mainly with fetal retina bipolar cells, fetal retina photoreceptor
cells, adult olfactory neuroepithelial stromal fibroblasts and fetal eye
photoreceptor cells (Fig. 4A), and atypical scarring of the skin was enriched in
the analysis of the disease gene network (Fig. 4B). GO enrichment analysis
revealed that these DEGs were related mainly to the biological process of protein
localization to the photoreceptor outer segment (Fig. 4C) and to the myometrial
relaxation and contraction pathways (Fig. 4D), which provides evidence for the
observed dysfunction of ciliary body elasticity in myopia. In addition, RHO
GTPase activation of IQGAPs, adherens junction interactions, and VEGFR2-mediated
vascular permeability were enriched in the Reactome gene sets (Fig. 4E). IQGAPs
are key effector proteins and intersections of RhoA and Rac1. Enrichment analysis
suggests significant changes in the activity of the Rho GTPase family (including
RhoA) in the myopic ciliary body. GO enrichment analysis of the transcription
factor targets of the DEGs revealed associations with the following terms:
skeletal muscle cell differentiation, skeletal muscle tissue development, and
skeletal muscle organ development (Fig. 4F); MAPK targets/nuclear events mediated
by MAP kinases and MAP kinase activation (Fig. 4G); and the effect of MFAP5 on
the permeability and motility of endothelial cells via cytoskeleton rearrangement
(Fig. 4H). Notably, the COL3A1 and TGF1 DEGs were involved in visual
perception, the formation of annular gap junctions, the Beta-catenin-independent
WNT signaling pathway, and other biological functions according to the DEG
distribution map (Fig. 4I), suggesting the activation of the TGF-/RhoA
signaling pathway and the occurrence of fibrosis in myopic body tissues. These
findings indicated that myometrial relaxation and contraction pathways, as well
as adhesion junction interactions, are involved in the occurrence of myopia,
which is strongly correlated with ciliary body fibrosis.
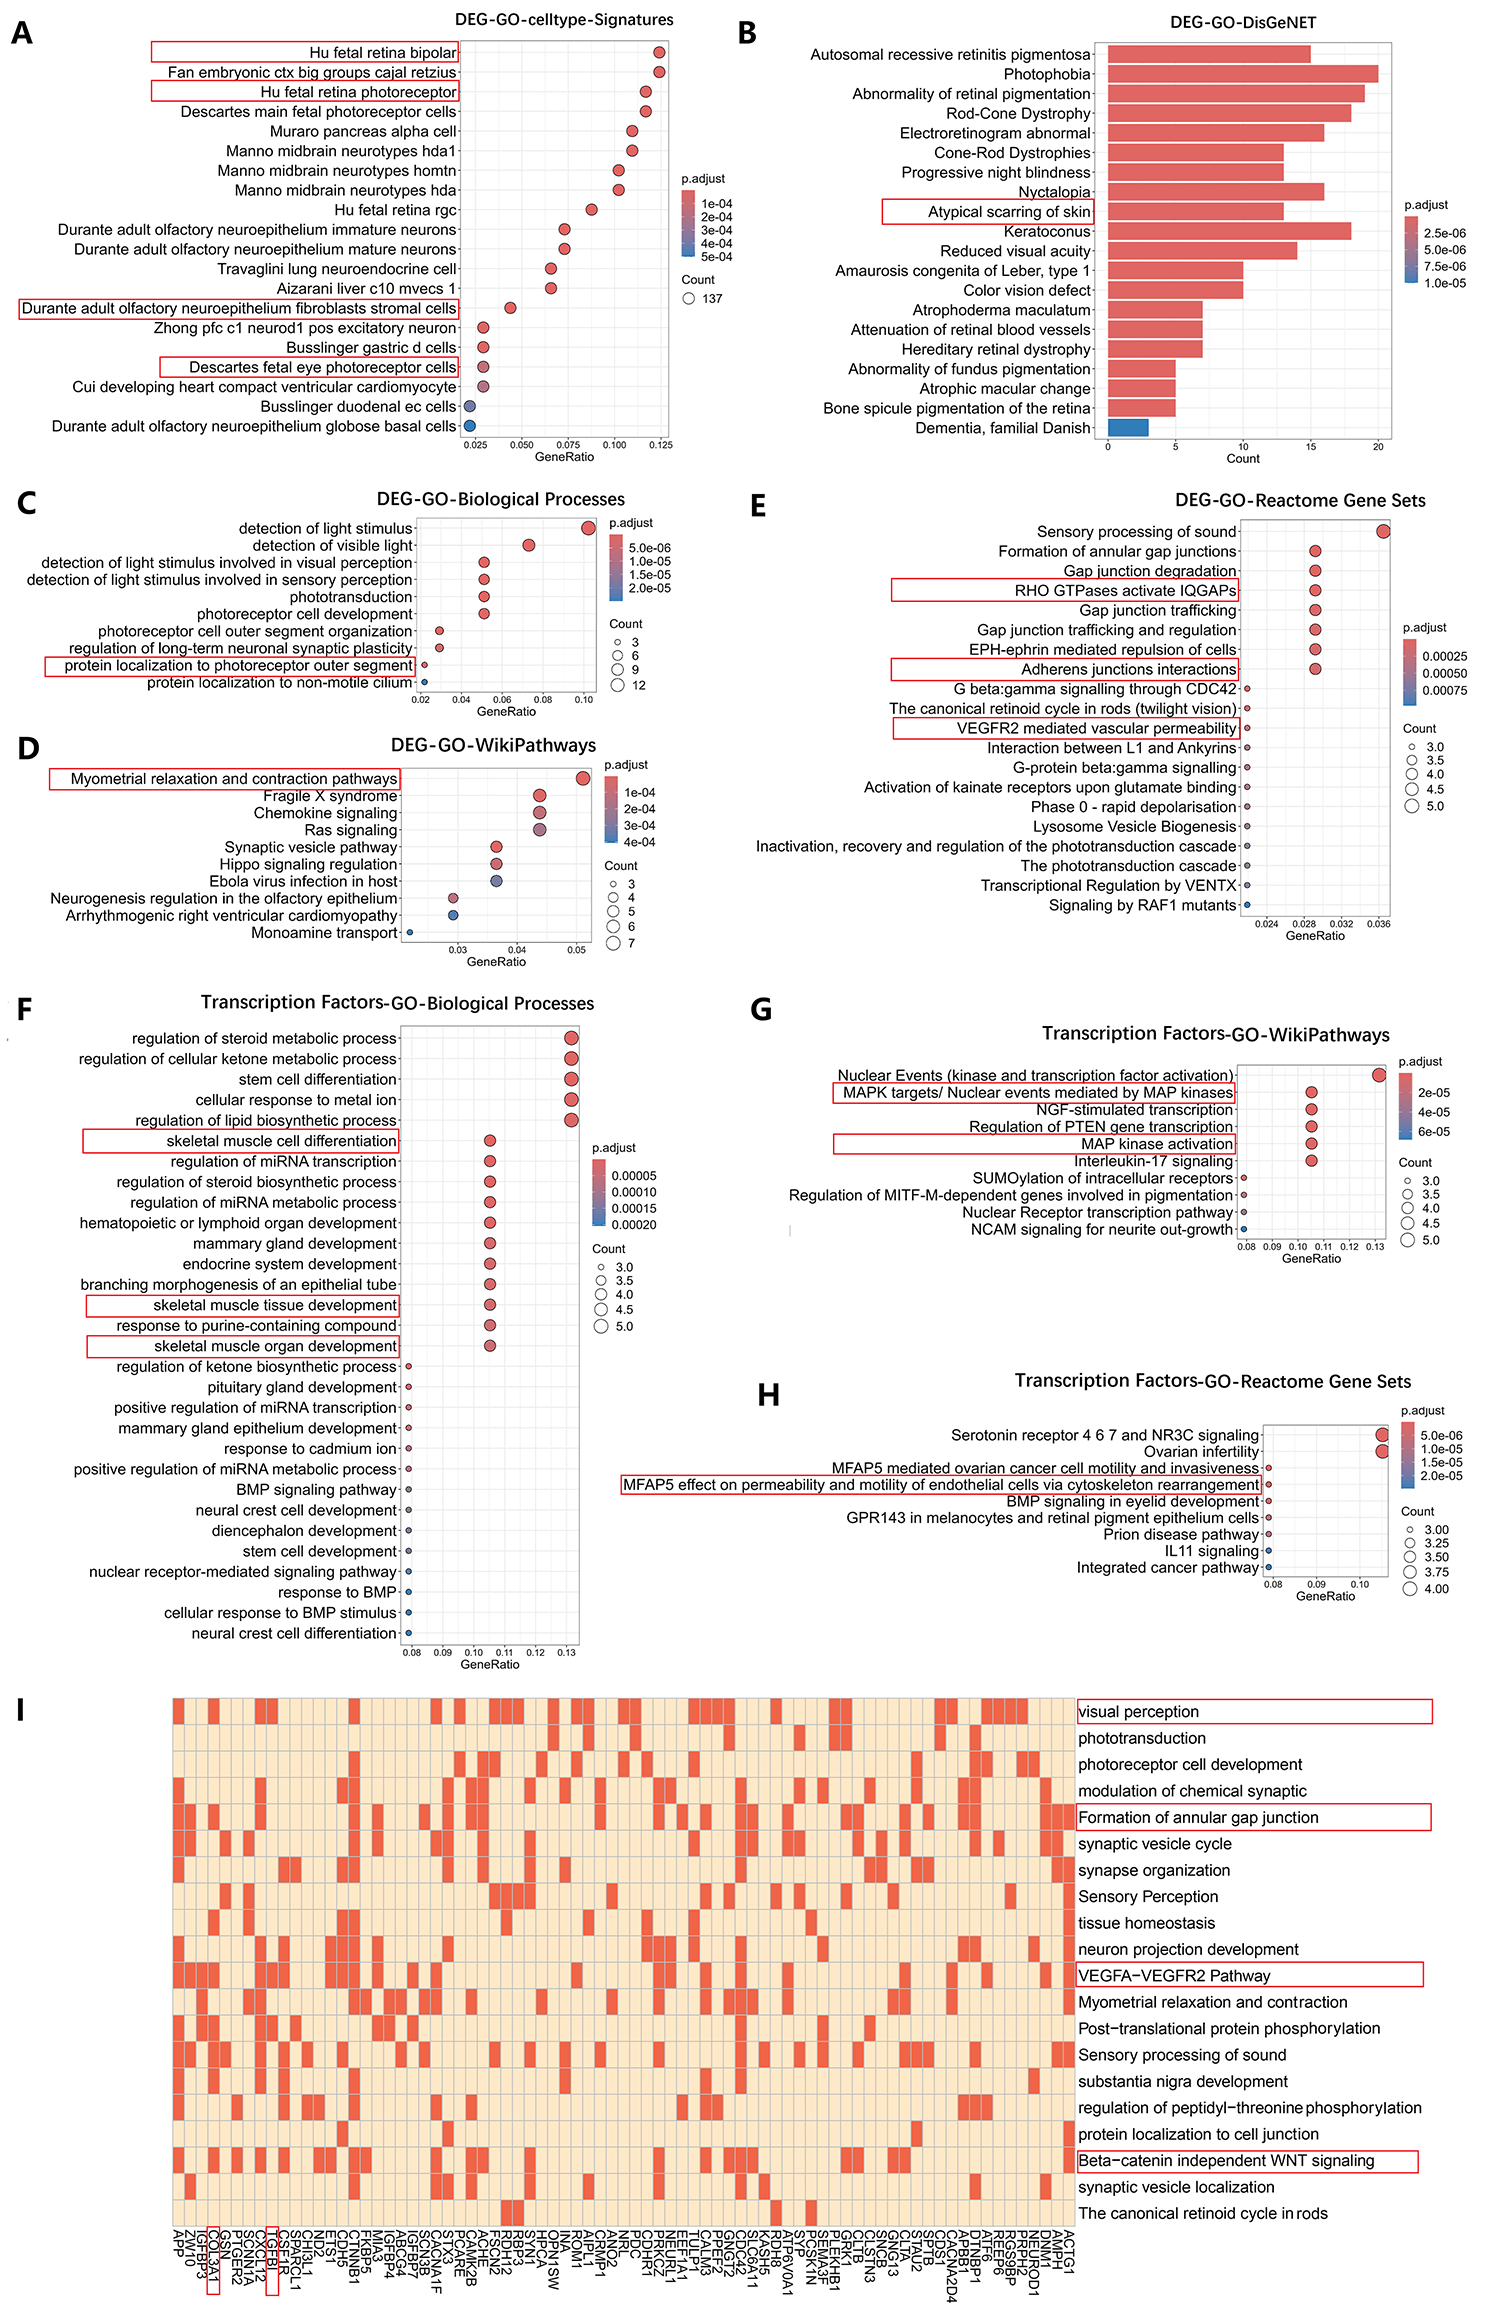 Fig. 4.
GO enrichment analysis of the differentially expressed mRNAs and
Transcription factor targets. (A) Celltype dotplot of differentially expressed
genes (DEGs). (B) DisGeNet barplot of DEGs. (C) Biological process (BP) dotplot
of DEGs. (D) WikiPathways dotplot of DEGs. (E) Reactome Gene set dotplot of DEGs.
(F) Biological process (BP) dotplot of Transcription factor targets. (G)
WikiPathways dotplot of Transcription factor targets. (H) Reactome gene set
dotplot of Transcription factor. (I) DEGs distribution map.
3.7 Masson’s Staining and IHC
Compared with that in the NC group, the degree of fibrosis (as indicated by blue
color) (NC vs. LIM. 0.24763159 0.013337% vs. 0.408256574
0.013965%) in the ciliary body of guinea pigs in the LIM group was aggravated
after 6 weeks of myopia induction (Fig. 5A,B). In addition,
immunohistochemistry was utilized to evaluate the levels of
-SMA and Col-1 in the ciliary body tissues of guinea pigs with myopia.
The expression of -SMA (NC vs. LIM. 0.1734483 0.0431506% vs.
0.3568124 0.0344084%) and Col-1 (NC vs. LIM. 0.24763159
0.013337% vs. 0.408256574 0.013965%) in the ciliary body of guinea pigs
in the 6-week LIM group was greater than that in the NC group (Fig. 5C,D),
suggesting that ciliary body fibrosis and activation of fibroblasts occurred in
the process of myopia.
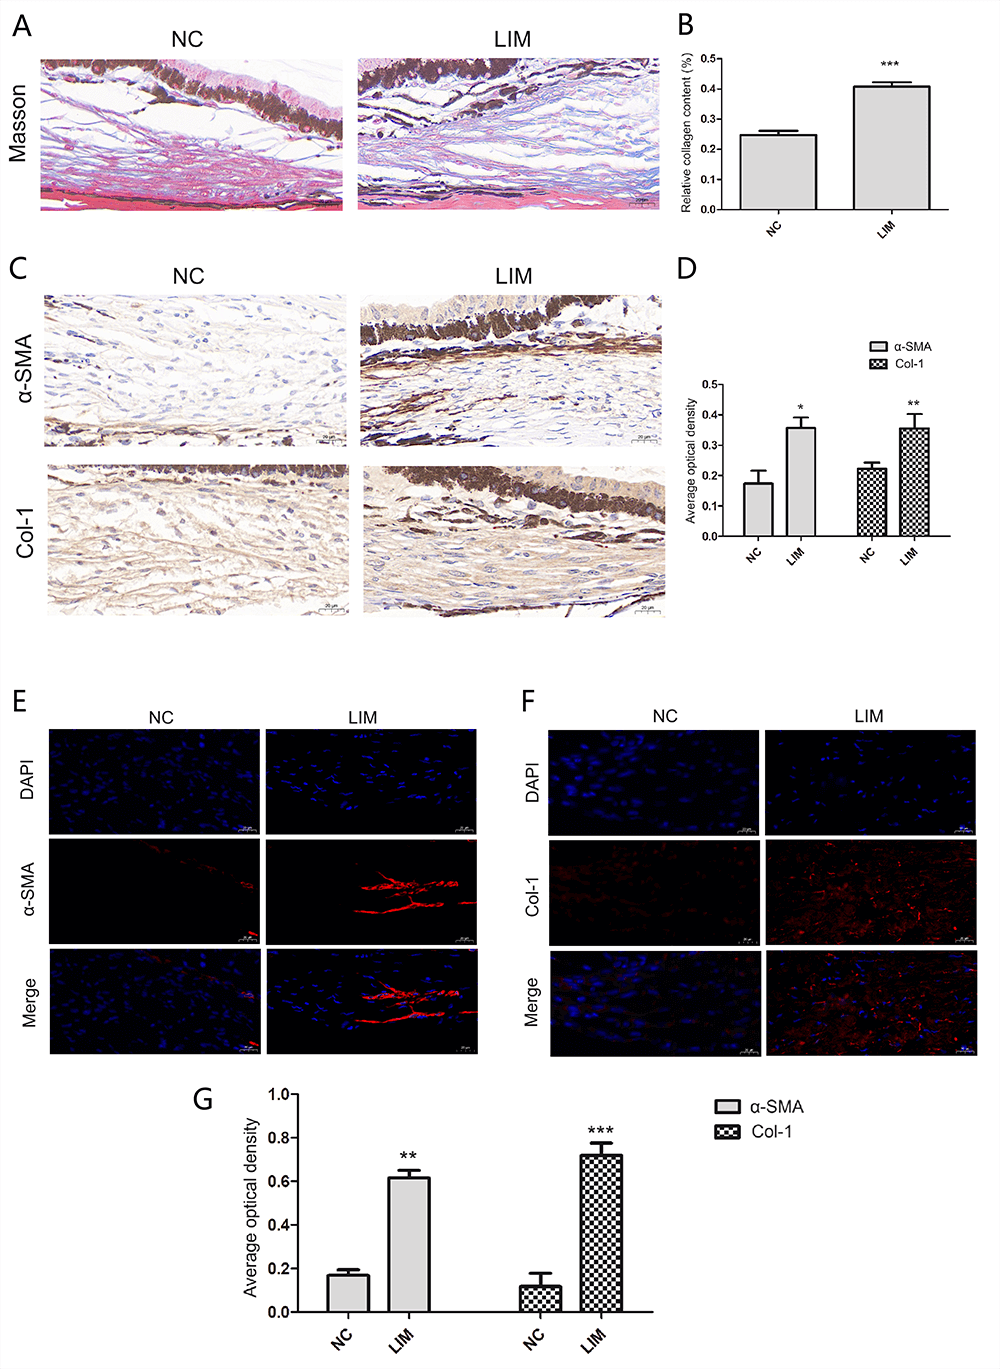 Fig. 5.
The fibrotic progression of the ciliary body tissue detected by
Masson Staining, immunohistochemistry, and immunofluorescence after 6-week myopia
induction. (A) Masson Staining (400), Bar = 20 µm. (B) Histogram
of relative collagen content analysis. Compared with the NC group, ***p
0.001. (C) Immunohistochemistry (400), Bar = 20 µm. (D)
Histogram of optical density analysis in -SMA and Col-1 proteins.
Compared with the NC group, *p 0.05 and **p 0.01. (E)
The -SMA levels in the ciliary body (400), Bar = 20 µm.
(F) The Col-1 levels in the ciliary body (400), Bar = 20 µm. (G)
Histogram of optical density analysis in -SMA and Col-1 proteins. All
data are presented as mean SEM (n = 3). Compared with the NC group,
**p 0.01, and ***p 0.001.
3.8 IF
In Fig. 5, the nuclei stained with DAPI appear blue, and the corresponding
fluorescein-labeled positive expression of -SMA (Fig. 5E) and Col-1
(Fig. 5F) is shown in red. The expression of -SMA (NC vs. LIM.
0.1691442 0.0258369% vs. 0.616374 0.0341538%) and Col-1 (NC vs.
LIM. 0.1174157 0.0608709% vs. 0.7198452 0.0560648%) in the
ciliary body tissue of the LIM group was greater than that in the NC group (Fig. 5G), indicating the myofibroblast activation and ciliary body fibrosis in the
pathological process of myopia.
3.9 TEM
The structural characteristics of the ciliary body in each group were evaluated
by TEM. The epithelial cells in the NC group had a complete cell membrane, a
regular morphology, tight cell connections, and fewer fibroblasts (Fig. 6A). In
the LIM group, the epithelial cells lacked a regular morphology, and the cells
were slender, with fibroblast-like characteristics, indicating the occurrence of
ciliary body EMT and fibrosis in myopia (Fig. 6B).
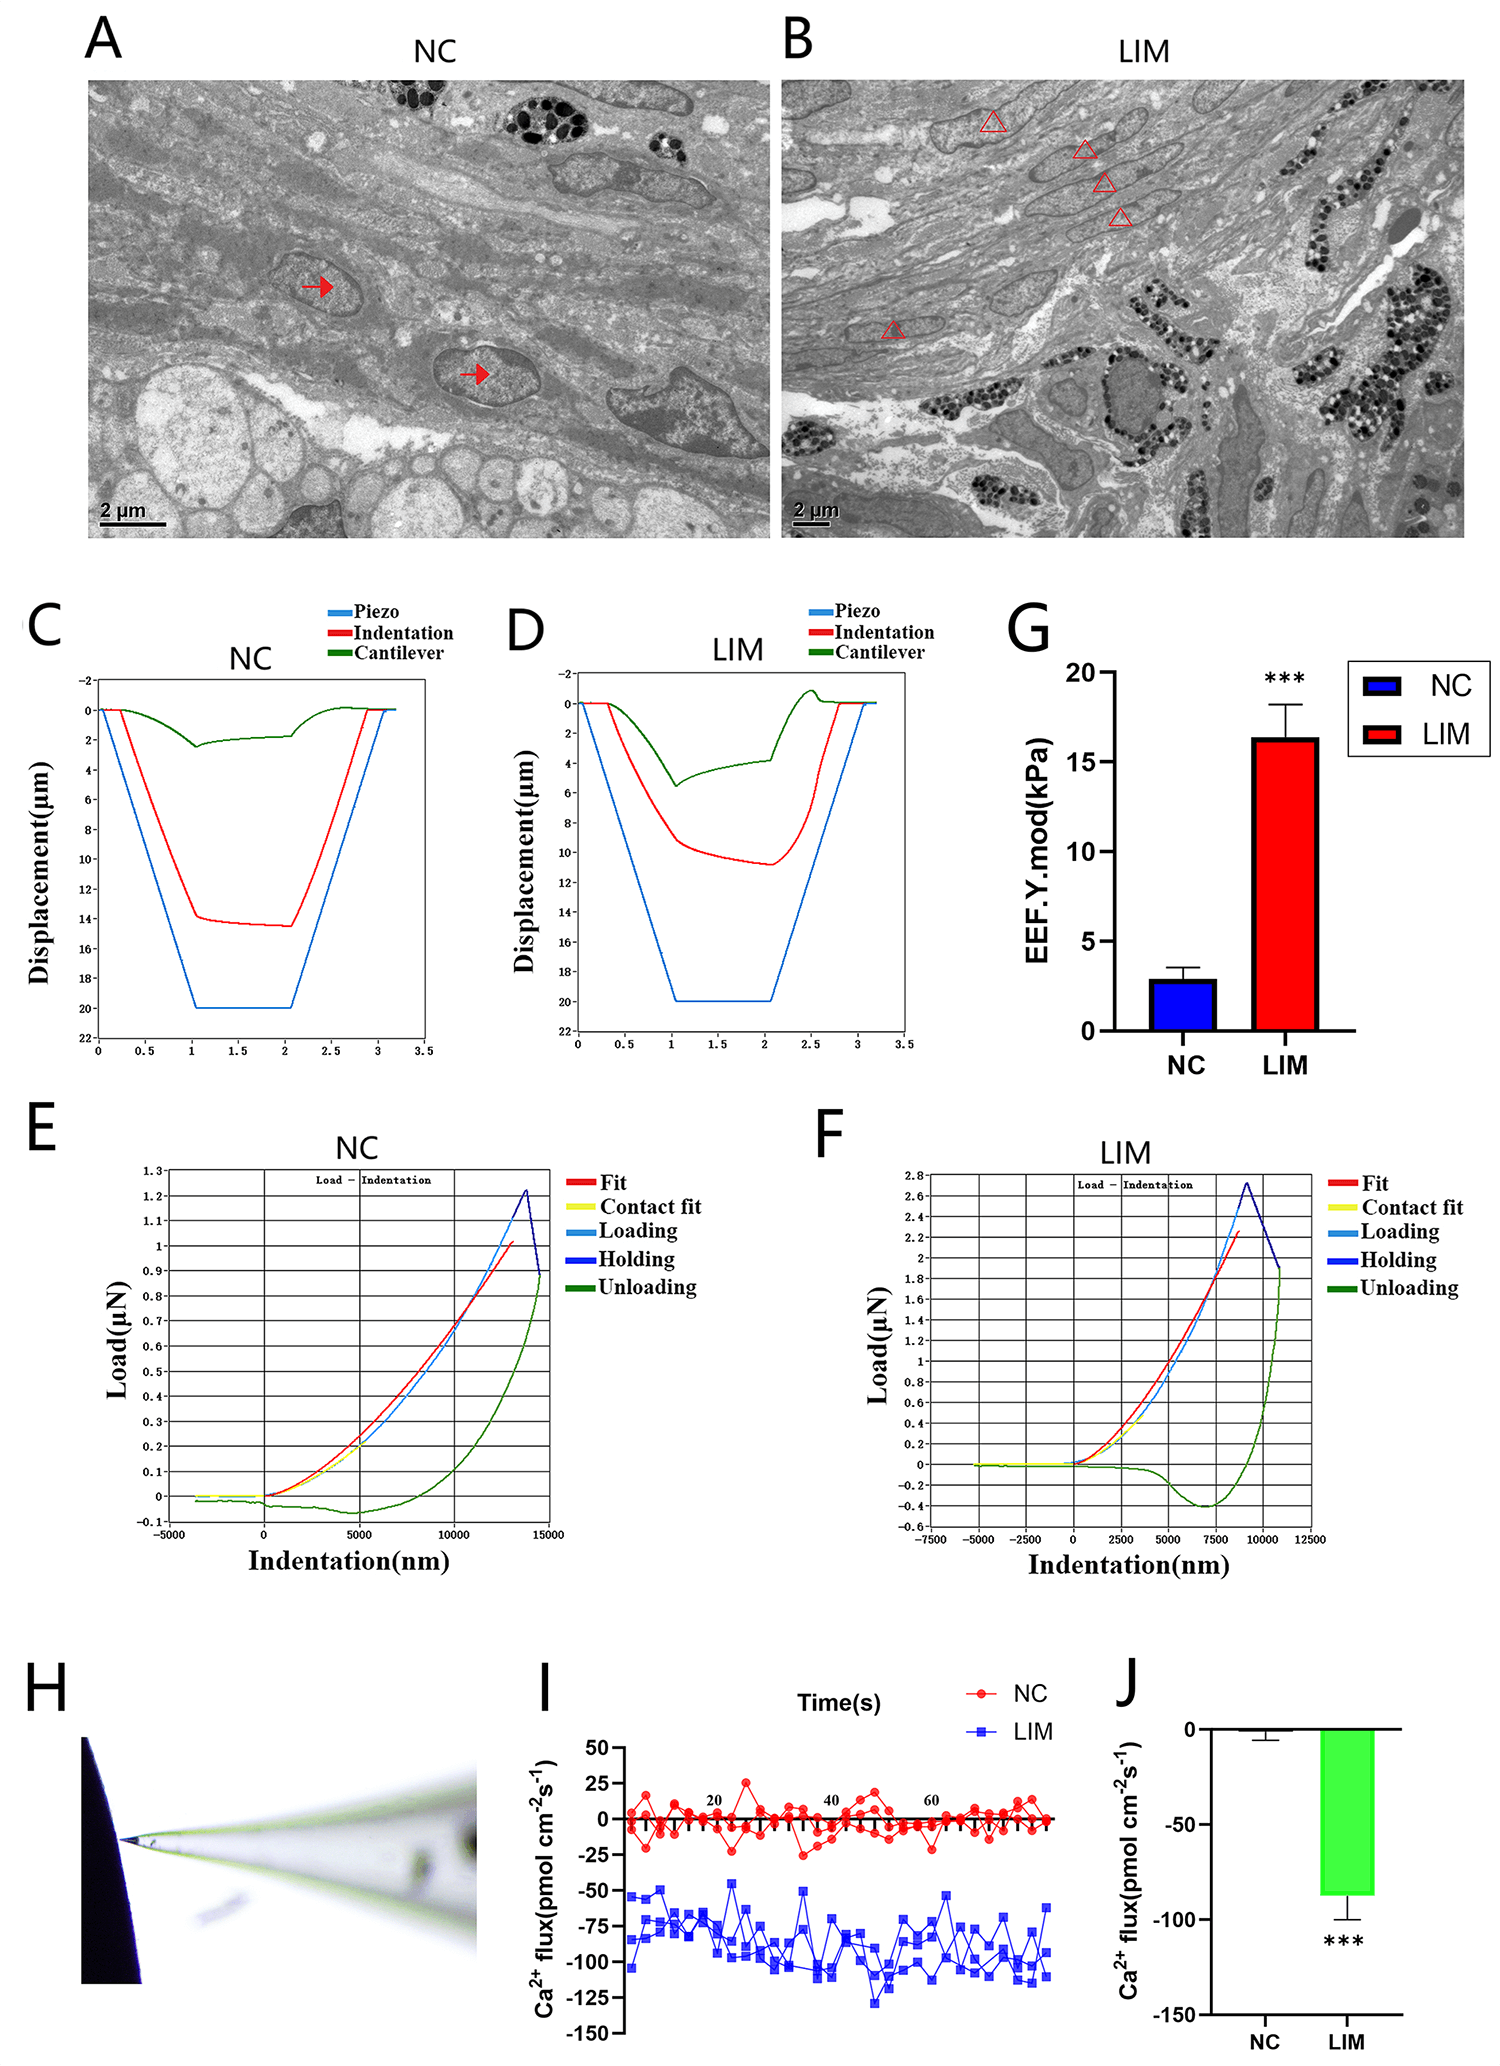 Fig. 6.
The ciliary body of the NC group and LIM group was observed by
TEM, Piuma nanoindentation system, and Non-invasive Micro-Test Technology (NMT)
after 6-week myopia induction (10000). All data are presented as mean
SEM (n = 9). (A) The ciliary body of the NC group was observed by TEM. Bar = 2 μm.
(B) The ciliary body of the LIM group was observed by TEM (n = 3).
: Epithelial Cells, : Fibroblasts. Bar = 2 μm. (C,D)
Displacement-time curve. (E,F) The load-indentation curve of the nanoindentation
test depicts the dynamic change of load and indentation from load to hold to
unloading when subjected to external force. (G) Young’s modulus statistic plot (n
= 3). Compared with the NC group, ***p 0.001. (H) NMT operation
chart, (I) Ca2+ flux, and (J) Analysis of Ca2+ flux (n = 3). Compared
with the NC group, ***p 0.001. TEM, Transmission electron
microscopy.
3.10 Young’s Modulus
Young’s modulus is the ratio of stress () to strain () in
the linear elastic deformation stage of a structured material. Young’s modulus is
the core quantitative index of the elastic properties of a structured material,
and it directly reflects the resistance of a structured material to external
forces in the elastic deformation stage. After 6 weeks of myopia induction, the
Young’s modulus of the ciliary body tissue in the guinea pigs in the NC and LIM
groups was measured. Compared with the NC group, the LIM group presented an
increase in the Young’s modulus of the ciliary body tissue in guinea pigs (Fig. 6C–G). A higher Young’s modulus indicates a stiffer structure and therefore a
smaller elastic deformation for a given applied load. The increase in elastic
modulus and decrease in elasticity of the ciliary body tissue in the LIM group
guinea pigs further confirmed the occurrence of fibrosis in the ciliary body of
guinea pigs with myopia.
3.11 NMT
After 6 weeks of myopia induction, the Ca2+ levels in the ciliary body
tissue of guinea pigs in the NC and LIM groups were measured via NMT (Fig. 6H).
Abnormal intracellular Ca2+ regulation is involved in the occurrence and
development of tissue fibrosis, and an increase in the intracellular Ca2+
level can promote tissue fibrosis. Compared with that in the NC group, the level
of Ca2+ inflow in the ciliary body tissue of guinea pigs in the LIM group
was increased, which indicated that the occurrence of myopia was related to the
aggravation of ciliary body fibrosis (Fig. 6I,J).
3.12 ROCK Inhibition Attenuates Myopia and Ciliary Body Fibrosis
The results showed that after Y-27632 intervention, both the refractive error of
the right eye and the interocular refractive error difference in guinea pigs were
lower than those in the lens-induced myopia (LIM) group (Fig. 7A,B) (all
p 0.05), and the axial length as well as the interocular axial length
difference were also significantly improved (Fig. 7C,D) (p 0.05).
Masson staining revealed that compared with the LIM group, the degree of ciliary
body fibrosis in guinea pigs was reduced after Y-27632 intervention (Fig. 7E,F).
Moreover, IHC and IF were used to evaluate the levels of -SMA and Col-1
in the ciliary body tissues of myopic guinea pigs after ROCK inhibition. The
expressions of -SMA and Col-1 in the ciliary body of the group were
lower than those in the LIM group (Fig. 7G–J), suggesting that ROCK inhibition
can ameliorate the pathological levels of EMT and fibrosis in the ciliary body of
myopic guinea pigs.
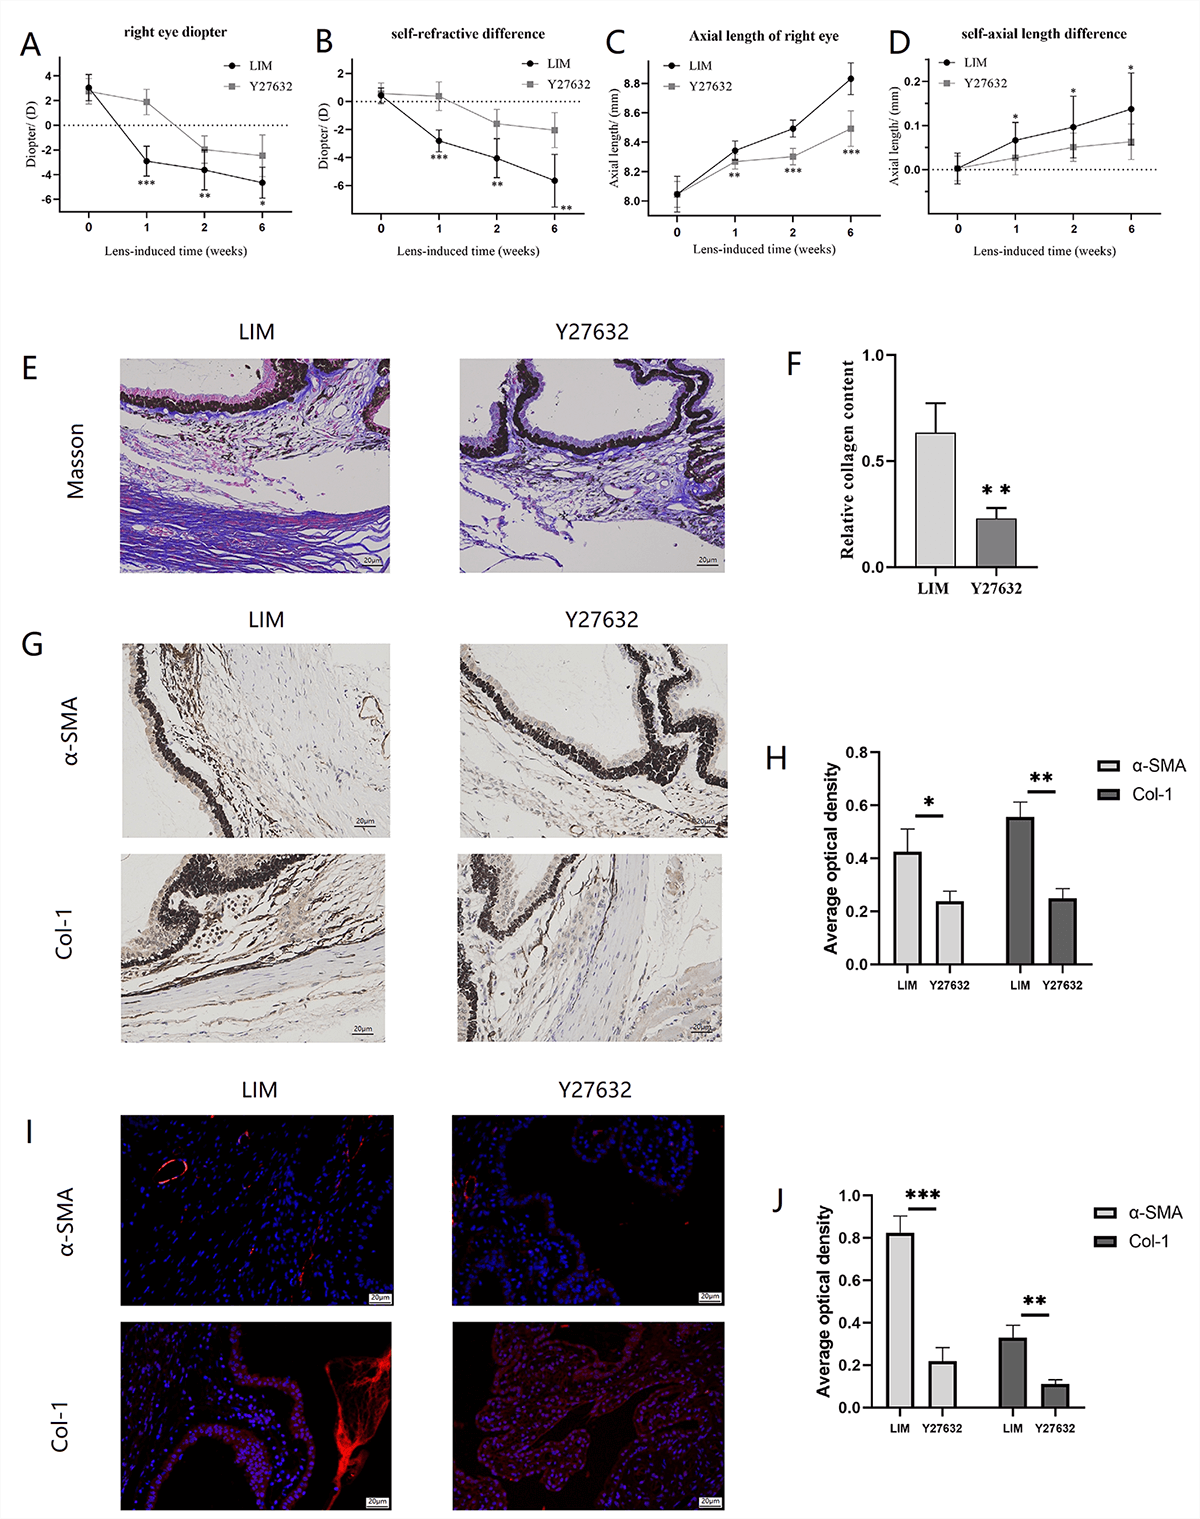 Fig. 7.
The ocular biological parameters, ciliary body EMT and fibrosis
levels of myopic guinea pigs after inhibiting ROCK for 6 weeks. (A) Refractive
error of the right eye in guinea pigs from the LIM group and Y-27632 group. (B)
Interocular difference in refractive error between the right and left eyes of
individual guinea pigs in the LIM group and Y-27632 group. (C) Axial length of
the right eye in guinea pigs from the LIM group and Y-27632 group. (D)
Interocular difference in axial length between the right and left eyes of
individual guinea pigs in the LIM group and Y-27632 group. (E) Masson Staining
(400), Bar = 20 µm. (F) Histogram of relative collagen content
analysis. (G) Immunohistochemistry (400), Bar = 20 µm. (H)
Histogram of optical density analysis in -SMA and Col-1 proteins. (I)
The Col-1 levels in the ciliary body (400), Bar = 20 µm. (J)
Histogram of optical density analysis in -SMA and Col-1 proteins. All
data are presented as mean SEM (n = 3). Compared with the LIM group,
*p 0.05, **p 0.01, and ***p 0.001.
4. Discussion
Myopia is a common disease in children and adolescents, and it is primarily due
to excessive axial growth, resulting in blurred vision [22]. It is predicted that
4.758 billion individuals in the world will suffer from myopia by 2050, 19.7% of
whom will suffer from high myopia [23]. The accommodation system of the eye
consists of the ciliary process, ciliary muscle, choroid, suspensory ligament,
lens capsule, and lens [24]. Adaptive regulation occurs when the ciliary muscle
and ciliary process move forward and inward to release the tension of the
suspensory ligament attached to the lens capsule [25]. Therefore, as one of the
main structures of the intraocular regulatory system, the ciliary body may be
involved in the occurrence and development of myopia. Chen et al. [26]
measured the position of the ciliary body in the lens when the ciliary muscle
relaxes or contracts in a mouse, and they reported that ciliary muscle relaxation
increases the distance between the ciliary body and the lens; in contrast,
ciliary contraction causes the ciliary body to move toward the lens. In addition,
ultrasound biomicroscopy (UBM) and optical coherence tomography (OCT) can be used
to quantify and locate the ciliary body in vivo, and the ciliary body of
patients with myopia becomes larger and shrinks with age [27]. In this study,
after 1 week, 2 weeks, and 6 weeks of myopia induction, the differences in
diopter values and axial lengths between LIM eyes and control eyes were
significantly greater than those in the NC group. Over time, the diopter value
and axial length gradually increased with increasing duration of myopia
induction. Therefore, we speculate that during the occurrence and development of
myopia, a decrease in intraocular refractive adjustment ability leads to
continuous contraction of the ciliary body, and the growth of the ocular axis is
promoted by hyperopia defocus, which induces the development of myopia.
TGF- signaling can control the transcriptional dysregulation of target
genes related to cell proliferation and structure as well as the production of
ECM proteins, including fibronectin, laminin, etc. [28]. TGF- initiates
the transformation of fibroblasts into antiapoptotic myofibroblasts following
various injury stimuli, such as inflammation, injury, hyperglycemia, hypoxia, and
apoptosis in the local environment [29, 30]. Myofibroblasts express -SMA
(a myofibroblast marker), secrete ECM components (including MMP-1), induce the
apoptosis of alveolar epithelial cells, and promote the development of pulmonary
fibrosis [31, 32, 33]. In addition, TGF--induced EMT can also lead to the
development of ocular fibrosis, such as anterior subcapsular cataracts and
posterior capsular opacities [34]. MMPs degrade the ECM and decompose ECM
substrates, including Col, laminin, fibronectin, hyaluronan, and proteoglycans
[35, 36]. MMP-1 is a major protease in the MMP family that specifically degrades
Col-I, -II, -III, -V, and -IX [37]. MMP-1 is expressed in various cells, such as
stromal fibroblasts, endothelial cells, and epithelial cells [38]. Under normal
physiological conditions, the expression of MMP-1 is low, but under pathological
conditions, MMP-1 expression may be significantly increased [39]. Wang et
al. [40] reported that increased MMP-1 activity increases the decomposition of
the ECM, leading to fibrosis. In the present study, myopia progression under lens
induction increased the expression of TGF-1, -SMA, and MMP-1,
indicating that myopia progression is involved in the aggravation of EMT and
fibrosis.
ROCK is regulated by Rho-GTPases and is involved in the control of multiple
physiological functions, including cell contraction, migration, proliferation,
and adhesion. The Rho signaling pathway can be activated during fibrosis and is
involved in in the development of tissue fibrosis. Additionally, the RhoA/ROCK
signaling pathway is involved in EMT. TGF-1 can rapidly activate the
RhoA/ROCK signaling pathway, which further affects -SMA production and
cytoskeleton-mediated myopia induction, and it induces the formation of stress
fibers and the expression of mesenchymal characteristics, thereby participating
in the EMT process [41]. Ji et al. [29] reported that in pulmonary
fibrosis, TGF-1 stimulation of lung fibroblasts increases the expression
of RhoA, RhoC, and ROCK1, indicating that the RhoA/ROCK pathway is involved in
the proliferation, differentiation, and excessive deposition of the extracellular
matrix of lung fibroblasts. Additionally, Masszi et al. [42] revealed
that RhoA is involved in both cytoskeleton remodeling and the activation of the
-SMA promoter in TGF-1-induced EMT in renal epithelial cells.
The ciliary muscle contains the ciliary epithelium, stroma, and muscle [43].
During EMT, epithelial cells lose their polygonal morphology and adherent cell
contacts, and they gain fibroblast-like features, including elongated morphology,
increased expression of mesenchymal markers, and motility. The present study
demonstrated that the ciliary body of guinea pigs in the LIM group lacked regular
epithelial cells, as evidenced by slender and fibroblast-like cells, accompanied
by vacuoles after cell loss, indicating that EMT occurred in the ciliary body of
LIM guinea pigs, which transformed normal epithelial cells into fibroblasts,
accompanied by apoptosis. In addition, this study revealed that the expression of
TGF-1, RhoA, ROCK1, ROCK2, -SMA, and MMP-1 in the ciliary body
of LIM guinea pigs after 1, 2, and 6 weeks of myopia induction was significantly
greater than that in the ciliary body of the NC group. During the development of
myopia, we speculate that the ciliary myoepithelial cells in LIM guinea pigs are
damaged, leading to the activation of TGF-1 expression. This process
converts epithelial cells into fibroblasts through the RhoA/ROCK signal
transduction pathway, resulting in the formation of myofibroblasts and
facilitating the EMT. Myofibroblasts specifically express -SMA, secrete
ECM components, and further participate in the development of tissue fibrosis,
thereby influencing the regulatory function of the ciliary body.
Fibroblasts are activated by the stimulation of the TGF- factor. The
activated fibroblasts express -SMA and form myofibroblasts. Fibroblasts
can respond dynamically to environmental signals, exhibiting significant
plasticity, transforming into various functional cell types, and adopting
different activation states [44]. Fibroblasts in an activated state are present
in the physiological conditions of normal wound healing and various diseases,
such as chronic wound healing, tissue fibrosis, and cancer [45]. In response to
injury, activated fibroblasts acquire the ability to migrate, produce ECM
proteins, and become proto-myofibroblasts. These proto-myofibroblasts represent
the intermediate stage before they mature into contractile myofibroblasts. Fully
mature myofibroblasts highly express -SMA and are involved in
pathological processes such as fibrosis [46]. Persistent myofibroblasts are also
produced by the transformation of endothelial cells into mesenchymal cells.
Continuous myofibroblasts produce ECM but also express high levels of collagen
genes and participate in profibrotic signaling [47]. In addition, the plasticity
of fibroblasts is affected by factors of the tissue itself, such as mechanical
stress and tissue stiffness. When fibroblasts are placed in a hard
microenvironment, they are more likely to transform into transient myofibroblasts
that produce ECM [48]. Furthermore, it is inferred that Physical interactions
with macrophages also further affect the activation of fibroblasts. A recent
study has revealed that integrin-mediated binding between macrophages and
fibroblasts triggers calcium (Ca2+) influx in fibroblasts, driving
contraction events leading to collagen contraction. Strong adhesion between two
cell types helps maintain the sustained activation of myofibroblasts via
TGF- signaling [49]. Future studies should investigate whether
integrin-mediated adhesion occurs between macrophages and fibroblasts in the
myopic ciliary body, and whether this interaction triggers pro-fibrotic
signaling, including Ca2+ influx and TGF- activation, as reported
in other fibrotic contexts. As a smooth muscle, the ciliary muscle is mainly
responsible for relaxation and contraction regulation. Fukiage et al.
[50] reported that both ROCK1 and ROCK2 mRNAs are expressed in most ocular
tissues of rabbits and monkeys and that ROCK may regulate ciliary muscle
contraction through phosphorylation of MLCP. Thus, we speculate that the
activation of ROCK leads to contraction of actin, which is involved in smooth
muscle cell contraction.
The imbalance of Ca2+ homeostasis is closely related to fibrotic diseases.
During the development of renal fibrosis, calcium channel expression or
intracellular Ca2+ levels are significantly increased in both in
vivo renal tissues and in vitro fibroblasts, podocytes and renal
tubular epithelial cells, suggesting that the abnormal regulation of
intracellular Ca2+ is involved in the occurrence and development of renal
fibrosis [51]. Orai1-dependent Ca2+ entry promotes atherogenesis possibly by
promoting foam cell formation and vascular inflammation [52]. Cytomechanical
sensation has been recognized as an indirect causative factor of fibrotic lesions
[53]. Rap 1 regulates mechanical transduction by sensing mechanical stress and
promoting muscle contraction or relaxation, thereby reshaping collagen fibers in
the tumor interstitial environment [54, 55]. The level of intracellular calcium
ions is a key factor affecting cell contraction; an increase in intracellular
calcium ions triggers the release of a large amount of calcium in the
sarcoplasmic reticulum, resulting in an instant increase in Ca2+ influx,
which increases contractile ability [56] and promotes the contraction of
muscle fibers. Young’s modulus can be used to measure the ability of a material
to resist elastic deformation and thus evaluate the elastic properties of the
material. Hooke’s law states that within the elastic limit, the stress
() is proportional to the strain (), and the
proportionality coefficient is Young’s modulus (E); thus, when the mechanical
stress increases, Young’s modulus increases, and Ca2+ inflow increases. In
the present study, there was an increase in Young’s modulus and significant
Ca2+ influx in the ciliary body tissue in the LIM group, indicating that the
occurrence and development of myopia involve an increase in mechanical stress.
The increase in Ca2+ concentration is an observational phenomenon related to
the myopia model, but its specific interaction relationship with the ROCK pathway
remains to be clarified. In addition, we plan to adopt ROCK inhibitors and
Ca2+ channel blocking intervention to clarify whether the enhanced Ca2+
influx is an upstream trigger or a downstream effect of ROCK activation and
further reveal the causal relationship between these two key signal nodes in
myopic ciliary body remodeling.
Myofibroblasts transformed by the EMT of ciliary epithelial cells function as
fibroblasts and smooth muscle cells [57]. Our previous studies revealed that
retinal fibrosis is involved in the occurrence and development of myopia and that
activation of the PI3K/AKT/ERK signaling pathway promotes the expression of MMP2,
Col1, and -SMA, thereby inducing retinal fibrosis [58]. In the present
study, the expression levels of TGF-1, RhoA, ROCK1, and ROCK2 in the
ciliary body of guinea pigs after 2 weeks of myopia induction were significantly
greater than those in the NC group, and -SMA and Col-1 were also highly
expressed. These results suggested that the enhancement of intraocular refractive
regulation of ciliary body contraction in guinea pigs in the early stage of
myopia promotes the activation of the TGF-/RhoA/ROCK signaling pathway,
resulting in actomyosin contraction. The expression levels of RhoA, ROCK1, ROCK2,
and fibrosis-related molecules in the ciliary body of guinea pigs after 6 weeks
of myopia induction continued to increase due to increased contraction.
Therefore, activation of the TGF-/RhoA/ROCK signaling pathway leads to
ciliary body fibrosis and dysfunction, further inducing myopic ciliary body EMT
and fibrosis (Fig. 8).
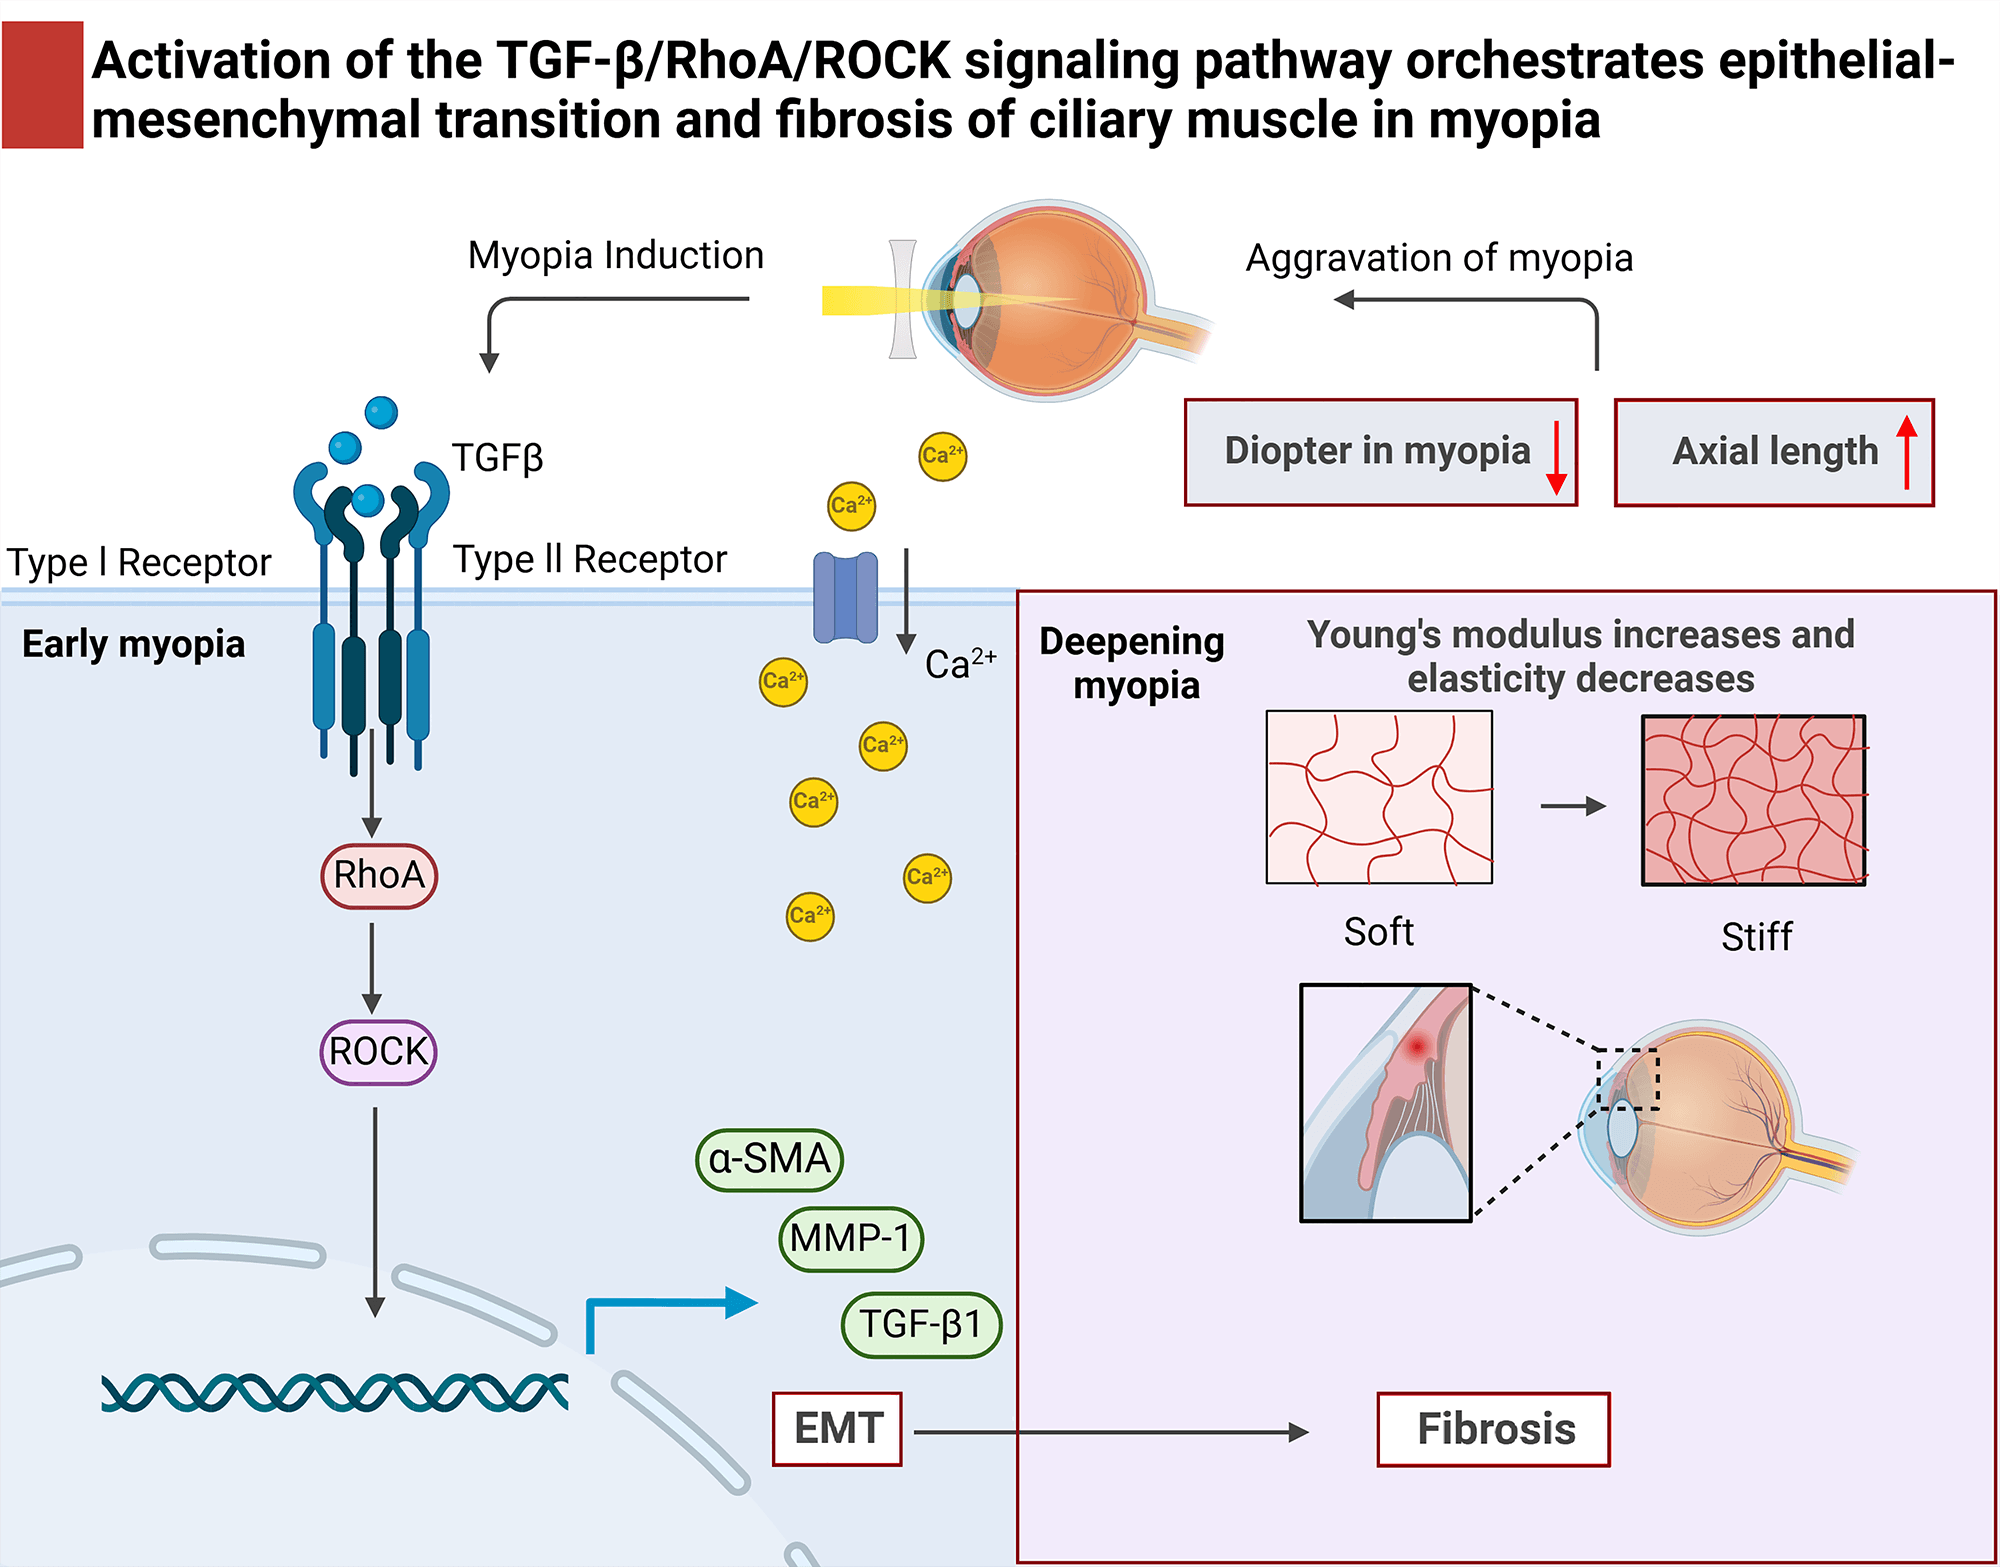 Fig. 8.
Activation of the TGF-/RhoA/ROCK signaling pathway
orchestrates epithelial-mesenchymal transition and fibrosis of the ciliary body
in myopia. (1) In the early stage of myopia, the activation of
TGF-/RhoA/ROCK signaling pathway and EMT in the ciliary body; (2) In
deepening myopia, the experimental myopic ciliary body Ca2+ inflow and
elastic modulus increase, elasticity decreases, fibroblasts are activated,
fibrosis worsens, accompanied by abnormal ciliary body tissue morphology in the
aggravation of myopia; (3) The activation of the TGF-/RhoA/ROCK
signaling pathway induced epithelial mesenchymal transition in myopic ciliary
body, leading to ciliary body fibrosis and dysfunction, thereby increasing myopic
refraction and axial length, exacerbating the pathological progression of myopia.
: Increase; : Reduce.
During the progression of myopia, the sclera undergoes remodeling, manifested as
the degradation and rearrangement of collagen fibers, thinning of the sclera, and
elongation of the eye axis. TGF- is a key factor in maintaining collagen
synthesis and tissue strength. Its reduction directly leads to a decrease in
collagen (such as COL-1) synthesis and tissue thinning. TGF- serves as a
key mediator for collagen loss in the sclera of myopic eyes. Therefore, a
reduction in TGF- subtypes and a significant decrease in collagen
synthesis occur in the sclera of myopic eyes [59]. The previous research results
of our research team also showed that during the scleral remodeling process of
lens-induced myopic guinea pigs, there was a decrease in the levels of
TGF-1, COL-1, and -SMA [60, 61, 62], which is consistent with the
previous reports of lower TGF-1 levels in myopic sclera [63, 64].
Therefore, the ciliary body does not merely convey a simple “pro-fibrotic”
signal to the sclera, but rather a “pro-remodeling” or “de-stabilizing”
signal. This signal leads to the disruption of scleral homeostasis, manifested as
a decrease in TGF-1 levels and the loss of collagen.
Significantly, the pathological significance of our findings is further
underscored by the well-established role of the RhoA/ROCK pathway in another
major ocular disease: glaucoma. ROCK inhibitors (e.g., Netarsudil, Ripasudil) are
clinically approved therapeutics for glaucoma, whose primary mechanism of action
is to induce relaxation of the ciliary muscle and the trabecular meshwork,
thereby facilitating aqueous humor outflow and reducing intraocular pressure
(IOP) [65, 66]. In glaucoma, excessive ROCK activity increases the contractile
tone in the outflow pathway, making its inhibition a valuable therapeutic
approach. Our study indicates that in the myopic ciliary body, ROCK overactivity
similarly leads to a hyper-contractile and profibrotic state, characterized by
EMT, -SMA expression, and ECM remodeling. This convergence of pathway
dysregulation in two distinct ocular conditions suggests that the ciliary body is
a common node of pathophysiology. It raises the intriguing hypothesis that ROCK
inhibition, which is beneficial in glaucoma by relaxing the ciliary body to
improve outflow, might also mitigate the fibrotic and dysfunctional changes we
observed in the myopic ciliary body. Therefore, dysregulation of the
TGF-/RhoA/ROCK axis may represent a shared mechanism contributing to
both high IOP in glaucoma and impaired accommodation and ocular growth in myopia.
This connection significantly broadens the implications of our findings beyond
myopia and positions them within a validated clinical framework.
Our research holds potential prospects for the clinical treatment of myopia.
Firstly, the activation of the TGF-/RhoA/ROCK pathway and fibrotic
process occurring in the ciliary body provide a potential pathological
explanation for the clinical observations of ‘accommodative lag’ and the
difficulty in reversing myopia progression. This suggests that the onset and
development of myopia involve not only passive axial elongation but also an
active, pathological remodeling of anterior segment accommodation function. More
importantly, our research has identified a new potential therapeutic target for
intervening in the early stage of myopia, which may inhibit or slow down the
progression of myopia from the source by targeting the reversal of ciliary
fibrosis remodeling. It is worth noting that ROCK inhibitors have accumulated a
large amount of clinical safety data in glaucoma, which may contribute to the
rapid conversion pathway of “drug reuse” or the development of similar myopia
control drugs. In addition, validating the effectiveness of locally administered
ROCK inhibitors in animal models and exploring the use of ciliary
fibrosis-related markers as indicators of myopia activity and treatment response
will be crucial steps in translating these findings into clinical practice.
Our current research is not without its limitations. A significant area for
future investigation is the potential reversibility of the pathological process
of ciliary body fibrosis in myopic guinea pigs. To address this, we plan to
introduce a recovery group comprising myopic guinea pigs. This group will undergo
removal of negative lens induction at various time points throughout the
development of myopic ciliary body fibrosis. Subsequently, we will assess whether
there is a reduction in the levels of epithelial-mesenchymal transition (EMT) and
fibrosis markers. This approach may yield valuable insights into the reversible
nature of ciliary body fibrosis in the context of myopia. Due to the limitations
of some advanced detection methods, such as high cost and complex technology, we
use a smaller sample size (n = 3). Although this provides a clear preliminary
insight, it requires careful interpretation and a larger cohort for further
verification in the future. In addition, we plan to explore the deeper mechanism
of inhibiting the activation of the TGF-/RhoA/ROCK signaling pathway
through drug intervention, improving the fibrosis of the ciliary body tissue, and
integrating retinal results to establish a direct correlation between ciliary
body fibrosis and changes in retinal morphology and function, creating new
possibilities for exploring clinical treatment targets for myopia.


 , Yixian Hao 2,†