


 , Binbin Wang 1,†, Yanfei Yu 1, Hansheng Zhang 1, Xueyong Zhou 1, Guangwen Wu 1, Yan Liu 2, Xiangyang Shi 1,*
1 Gastroenterology Department, The People’s Hospital of Chizhou, 247100 Chizhou, Anhui, China
2 Research and Development Center, Center of Human Microecology Engineering and Technology of Guangdong Province, 510700 Guangzhou, Guangdong, China
†These authors contributed equally.
Abstract
Gastric cancer (GC) remains a major global health burden, particularly in East Asia, with complex etiologies involving Helicobacter pylori infection, diet, host genetics, and environmental exposures. GC development follows the Correa sequence (CS), a multistep cascade from gastritis to atrophy, erosion, and carcinoma. Although gut microbiota (GM) dysbiosis and metabolic reprogramming have each been implicated in GC, their integrated dynamics across CS remain incompletely defined.
We recruited participants across five groups: normal controls (G1), gastritis (G2), atrophy (G3), erosion (G4), and GC (G5). Fecal and gastric tissue samples were analyzed using 16S rRNA sequencing and untargeted metabolomics under both ion modes. Microbial diversity was assessed by α- and β-diversity indices, linear discriminant analysis effect size (LEfSe), and functional prediction. Metabolic features were profiled by UHPLC-Q Exactive Orbitrap MS, and differential metabolites were identified using t-tests and partial least squares discriminant analysis (PLS-DA). Diagnostic potential was evaluated using receiver operating characteristic (ROC) curves.
Microbial α-diversity decreased significantly with progression, particularly in G3, while compositional shifts included depletion of Bacteroides and Faecalibacterium alongside enrichment of Actinobacteria, Peptostreptococcaceae, and Lachnoclostridium. LEfSe identified Bifidobacterium and Oscillospiraceae as potential biomarkers of advanced stages. ROC analyses demonstrated strong discriminatory power, with the class Actinobacteria achieving an area under the ROC curve (AUC) of 0.935 in distinguishing controls from GC. Fecal metabolomics revealed reductions in anti-inflammatory short-chain fatty acids (SCFAs) and increases in pro-inflammatory metabolites emerging at G3, while tissue metabolomics showed broader reprogramming in GC involving amino acid, nucleotide, lipid, and energy metabolism. Notably, erosion (G4) exhibited transitional features, whereas atrophy (G3) marked a distinct metabolic “breakpoint”.
By integrating GM and metabolomic data, this study delineates stage-specific microbial and metabolic alterations along the CS. Atrophy represents a pivotal inflection point in the transition from homeostasis to carcinogenesis, while erosion serves as a transitional state. Combined microbiota–metabolite signatures hold promise for non-invasive early detection, disease stratification, and mechanistic insights into metabolic dependencies in GC.
Keywords
- stomach neoplasms
- gastrointestinal microbiome
- metabolomics
- sequence analysis, DNA
- mass spectrometry
Gastric cancer (GC) is a major global health challenge, with pronounced geographic heterogeneity in incidence and mortality, and a particularly heavy burden in East Asia [1, 2]. Although overall GC incidence and mortality have declined worldwide in recent years, GC remains among the leading causes of cancer morbidity and mortality in certain regions such as China, accounting for nearly half of newly diagnosed cases globally [2]. The etiologies of GC are multifactorial, involving Helicobacter pylori (H. pylori) infection, dietary exposures, host genetic background, and environmental factors [3, 4]. Moreover, GC is highly heterogeneous in its clinicopathological presentation, encompassing distinct histological types and molecular features that jointly shape disease progression, therapeutic response, and patient outcomes [5, 6].
GC development follows a multistep pathological process known as the Correa sequence (CS). This classical model describes the gradual transition from normal gastric mucosa through chronic gastritis, atrophic gastritis, intestinal metaplasia, and dysplasia, ultimately culminating in intestinal-type GC [7, 8, 9]. H. pylori infection is considered a principal driver of this cascade, promoting lesion advancement through persistent inflammation and a series of molecular alterations [10, 11]. Recent progress in molecular biology and immunology has deepened our understanding of the CS, revealing stage-specific genomic alterations, epigenetic modifications, immune-microenvironment remodeling, and stem-cell-like properties [12]. These advances validate the traditional pathological framework while uncovering more complex mechanisms and heterogeneous trajectories, thereby providing a theoretical basis for early prevention, precision screening, and targeted therapy.
Multiple studies have demonstrated that the gut microbiota (GM) of patients with
GC differs markedly from that of healthy individuals, typically characterized by
reduced
Metabolomics studies leveraging plasma, serum, saliva, and other biofluids have identified numerous GC-associated metabolites. For example, a plasma model combining trimethylamine-N-oxide (TMAO) with rhamnose achieved an AUC of 0.961 for discriminating GC [23], while a serum panel composed of acylcarnitines (e.g., C6DC, C16OH) and arginine yielded an AUC of 0.99778 [24]. Salivary metabolomics identified cytosine and 2-oxoglutaric acid as biomarkers with sensitivities exceeding those of some classical serum markers [25]. Moreover, metabolomics of extracellular-vesicle cargo combined with a nanocapture workflow and machine learning achieved highly accurate classification of early GC (AUC = 1.0) [26]. These observations underscore the promise of metabolomics for noninvasive diagnosis.
Despite these advances, several critical knowledge gaps remain. Most previous studies have focused on either the gut microbiota or metabolomics in isolation, without systematically integrating both approaches to delineate stage-specific alterations during GC progression. In particular, the dynamic interplay between microbial dysbiosis and host metabolic reprogramming across the Correa sequence has not been comprehensively characterized. Furthermore, the diagnostic and prognostic utility of combined microbiota–metabolite signatures for early detection and disease stratification remains largely unexplored. Therefore, in this study we aimed to (i) comprehensively characterize gut microbiota composition and metabolic profiles in fecal and gastric tissue samples across different stages of GC; (ii) integrate microbiome and metabolomic data to elucidate key microbe–metabolite–host interaction networks; and (iii) evaluate the diagnostic potential of combined microbial and metabolic features in distinguishing early GC and precancerous lesions from controls. This integrative approach is expected to provide novel insights into the microbiota–metabolism axis in gastric carcinogenesis and may facilitate the development of non-invasive biomarkers for early detection and precision management.
A total of 93 participants were recruited at The People’s Hospital of Chizhou between [March, 2024] and [July, 2024], including normal controls (G1, n = 18), patients with gastritis (G2, n = 22, gastric atrophy (G3, n = 19), gastric erosion (G4, n = 18), and gastric cancer (G5, n = 16). Baseline demographic and clinical data were collected, including age, sex, hematological and biochemical parameters. Exclusion criteria were: (1) use of antibiotics, probiotics, or proton pump inhibitors within 4 weeks; (2) acute infection or autoimmune disease; (3) other malignancies; (4) severe liver, kidney, or metabolic disorders; and (5) gastrointestinal surgery history. All participants provided written informed consent. This study was conducted in accordance with the Declaration of Helsinki, and the study protocol was approved by the Ethics Committee of The People’s Hospital of Chizhou (approved No. 2023-KY-17).
H. pylori infection status was determined by either 13C-urea breath testing or histopathological examination of gastric biopsy samples obtained during endoscopy. Dietary information was collected via standardized questionnaires focusing on salt intake, spicy food consumption, and alcohol use. H. pylori positivity and basic dietary indicators were incorporated as covariates in subsequent analyses to control for potential confounding effects on the gut microbiota–metabolome associations.
Fresh stool samples were collected in sterile containers, immediately frozen at –80 °C, and used for 16S rRNA sequencing and fecal metabolomics. Gastric tissue samples were obtained during gastroscopy or surgery, rinsed in sterile saline, and stored at –80 °C for metabolomic profiling.
Microbial DNA was extracted from stool samples using the QIAamp DNA Stool Mini
Kit (Qiagen, Hilden, Germany). The V3–V4 regions of the 16S rRNA gene were
amplified with barcoded primers and Pfu high-fidelity DNA polymerase (TransGen
Biotech, Beijing, China). PCR products were purified, quantified using the
PicoGreen dsDNA assay (Thermo Fisher Scientific, Waltham, MA, USA), and libraries
were prepared with the TruSeq Nano DNA LT Library Prep Kit (Illumina, San Diego,
CA, USA). Sequencing was performed on the Illumina NovaSeq 6000 (Illumina Inc.,
San Diego, CA, USA) platform (2
Both fecal and tissue metabolites were extracted using cold methanol
precipitation, LC-MS grade methanol (Merck, Darmstadt, Germany). Quality control
(QC) samples were prepared by pooling aliquots from all study samples and
analyzed regularly during the batch to monitor stability. Peaks with detection
rate
Metabolite annotation followed the Metabolomics Standards Initiative (MSI) guidelines. MSI Level 1 and Level 2 identifications were assigned based on matching retention time and MS/MS spectra to in-house and public databases (HMDB, METLIN, MassBank). MSI Level 3 features were annotated using accurate mass and predicted fragmentation patterns. Only metabolites meeting these criteria were included in downstream integrative analyses.
For integrative cross-omics analysis, differential metabolites from all pairwise
group comparisons were first pooled, and duplicate features detected in positive
and negative ionization modes were merged to obtain a unified set of differential
metabolites. Differential genera were identified using LEfSe at the genus level
for each comparison group. Spearman correlation analysis was then performed
between all differential genera and the combined differential metabolite set, and
the resulting p-values were adjusted using the Benjamini–Hochberg false
discovery rate (FDR) procedure. Correlation pairs meeting the significance
threshold of p
Clinical data were analyzed using SPSS (v26.0, IBM Corp., Armonk, NY, USA)
and GraphPad Prism (v9.0, GraphPad Software, San Diego, CA, USA). Continuous
variables were expressed as mean
For clarity, “vs” comparisons in the Results section are defined as follows:
vs1 = G1 (normal) vs G2 (gastritis); vs2 = G1 (normal) vs G3 (atrophy); vs3 = G1
(normal) vs G4 (erosion); and vs4 = G1 (normal) vs G5 (gastric cancer). These
definitions apply consistently to all
Five groups were included: normal controls (G1), gastritis (G2), atrophy (G3),
erosion (G4), and GC (G5). The grouping was mainly based on the clinical
gastroscopy examination and the HE staining of gastric pathological sections
(Supplementary Figs. 1–5). The male-to-female ratio did not differ
significantly among groups (p
Helicobacter pylori (H. pylori) infection status was available for 83 of the 93 participants (89.2%). Infection rates increased progressively with disease stage-11% in G1, 41% in G2, 63% in G3, 67% in G4, and 75% in G5-showing a clear positive association with lesion severity. This variable was incorporated as a covariate in exploratory stratified analyses to minimize potential confounding in the microbiota–metabolome association.
To compare community composition across disease stages, we plotted the top-10 taxa at the phylum (LEVEL2) and genus (LEVEL6) levels for G1–G5 (Fig. 1A,B). At the phylum level, communities were dominated by Firmicutes and Bacteroides across groups. Bacteroides was relatively enriched in G1, whereas Firmicutes gradually became dominant with disease progression and was markedly increased in G5. Actinobacteria and Proteobacteria were also elevated in G5, accompanied by a relative decrease in Bacteroides. At the genus level, G1 was enriched for Bacteroides and Faecalibacterium, taxa linked to short-chain fatty acid (SCFA) production and anti-inflammatory effects. In G2–G3, several genera within Lachnospiraceae (e.g., Lachnoclostridium) increased; in G4, inflammation-associated taxa such as the Ruminococcus gnavus group were enriched. In G5, community restructuring was evident with increased Peptostreptococcaceae and Bifidobacterium, alongside a marked reduction in Faecalibacterium. Altogether, GC progression was characterized by enrichment of Firmicutes, Actinobacteria, and inflammation-related genera, with concurrent depletion of Bacteroides and SCFA producers, indicating a shift toward a pro-inflammatory, pro-carcinogenic microecology.
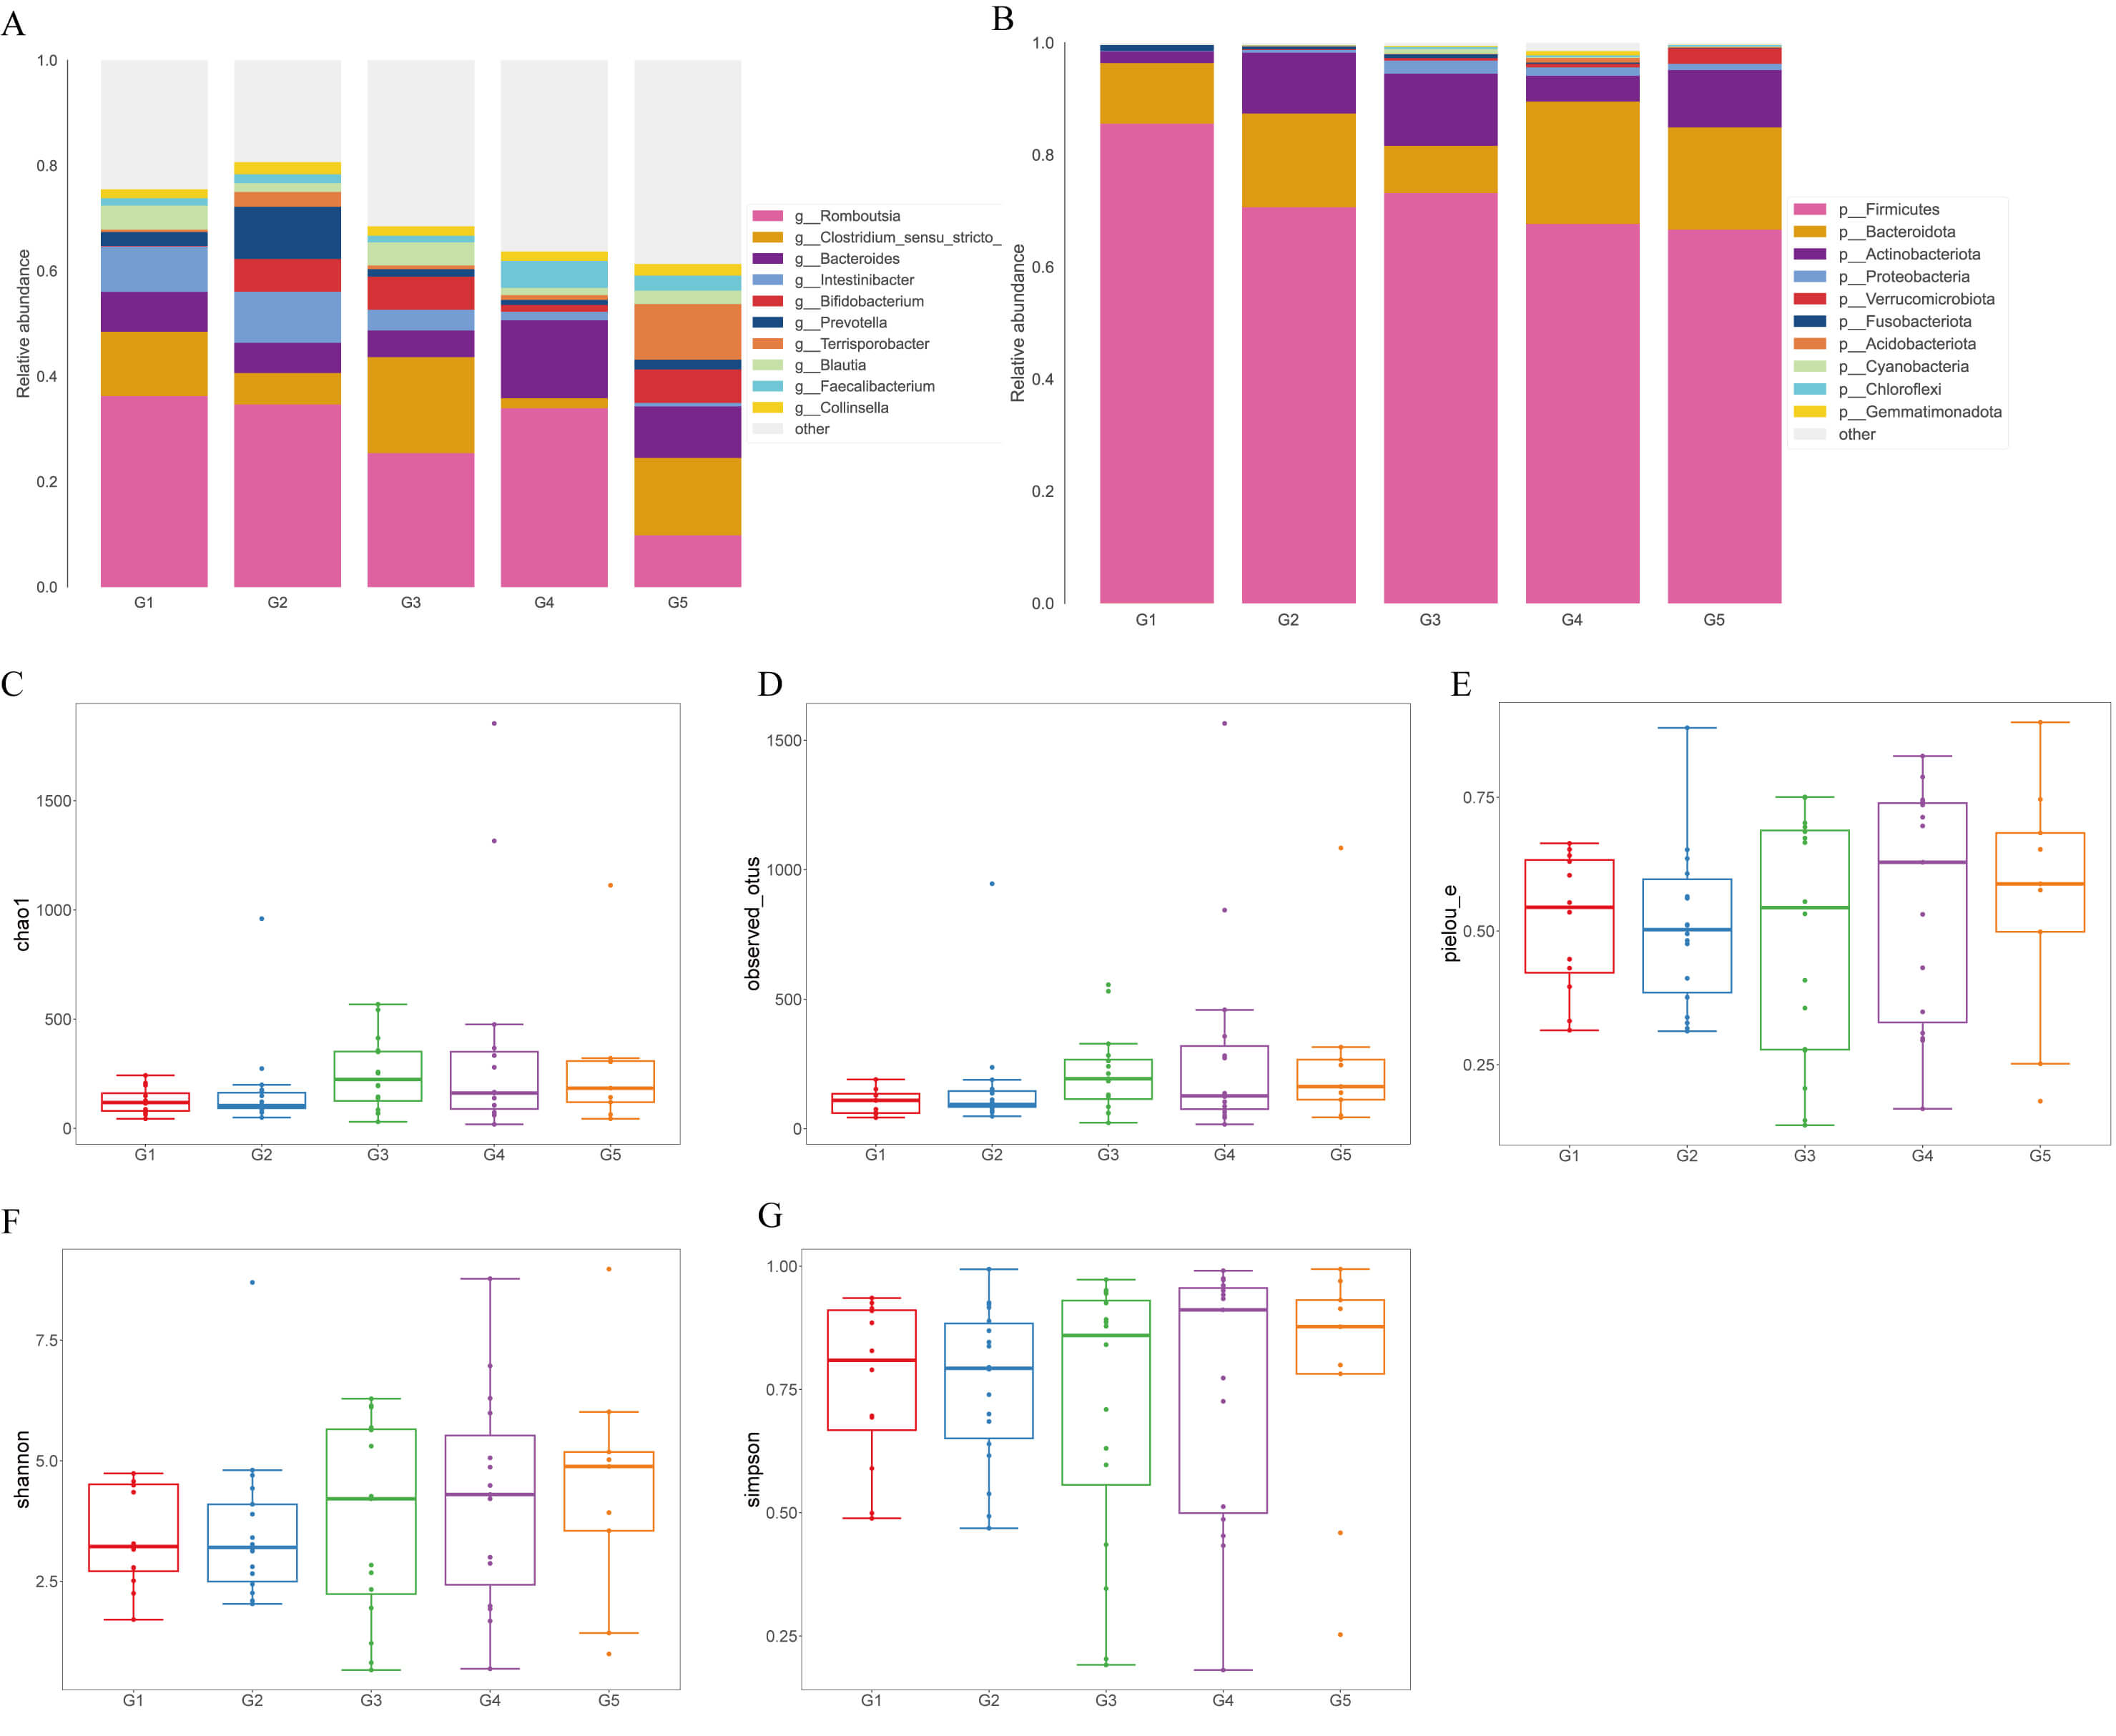 Fig. 1.
Gut microbiota composition and alpha diversity across groups. (A) Stacked bar plots showing the relative abundance of the top 10 bacterial
phyla across groups (G1–G5). (B) Stacked bar plots showing the relative
abundance of the top 10 bacterial genera across groups (G1–G5). (C–G) Alpha
diversity indices including Chao1, Observed OTUs, Pielou’s evenness (pielou_e), Shannon and Simpson. Error bars represent mean
We next evaluated alpha diversity using Chao1, Observed OTUs, Shannon, Simpson,
and Pielou’s evenness. As shown in Fig. 1C–G, both Chao1 and Observed OTUs were
significantly reduced in the G1 vs G3 (vs2) comparison, representing the
transition from normal mucosa to atrophic gastritis (Chao1: t = 2.668, p
= 0.015; Observed OTUs: U = 147.0, p = 0.019), indicating a clear
decline in richness. By contrast, Shannon and Simpson indices did not differ
among groups (p
To identify stage-specific microbial biomarkers along GC progression, we
performed LEfSe across G1–G5 (Fig. 2). Significant discriminatory features (LDA
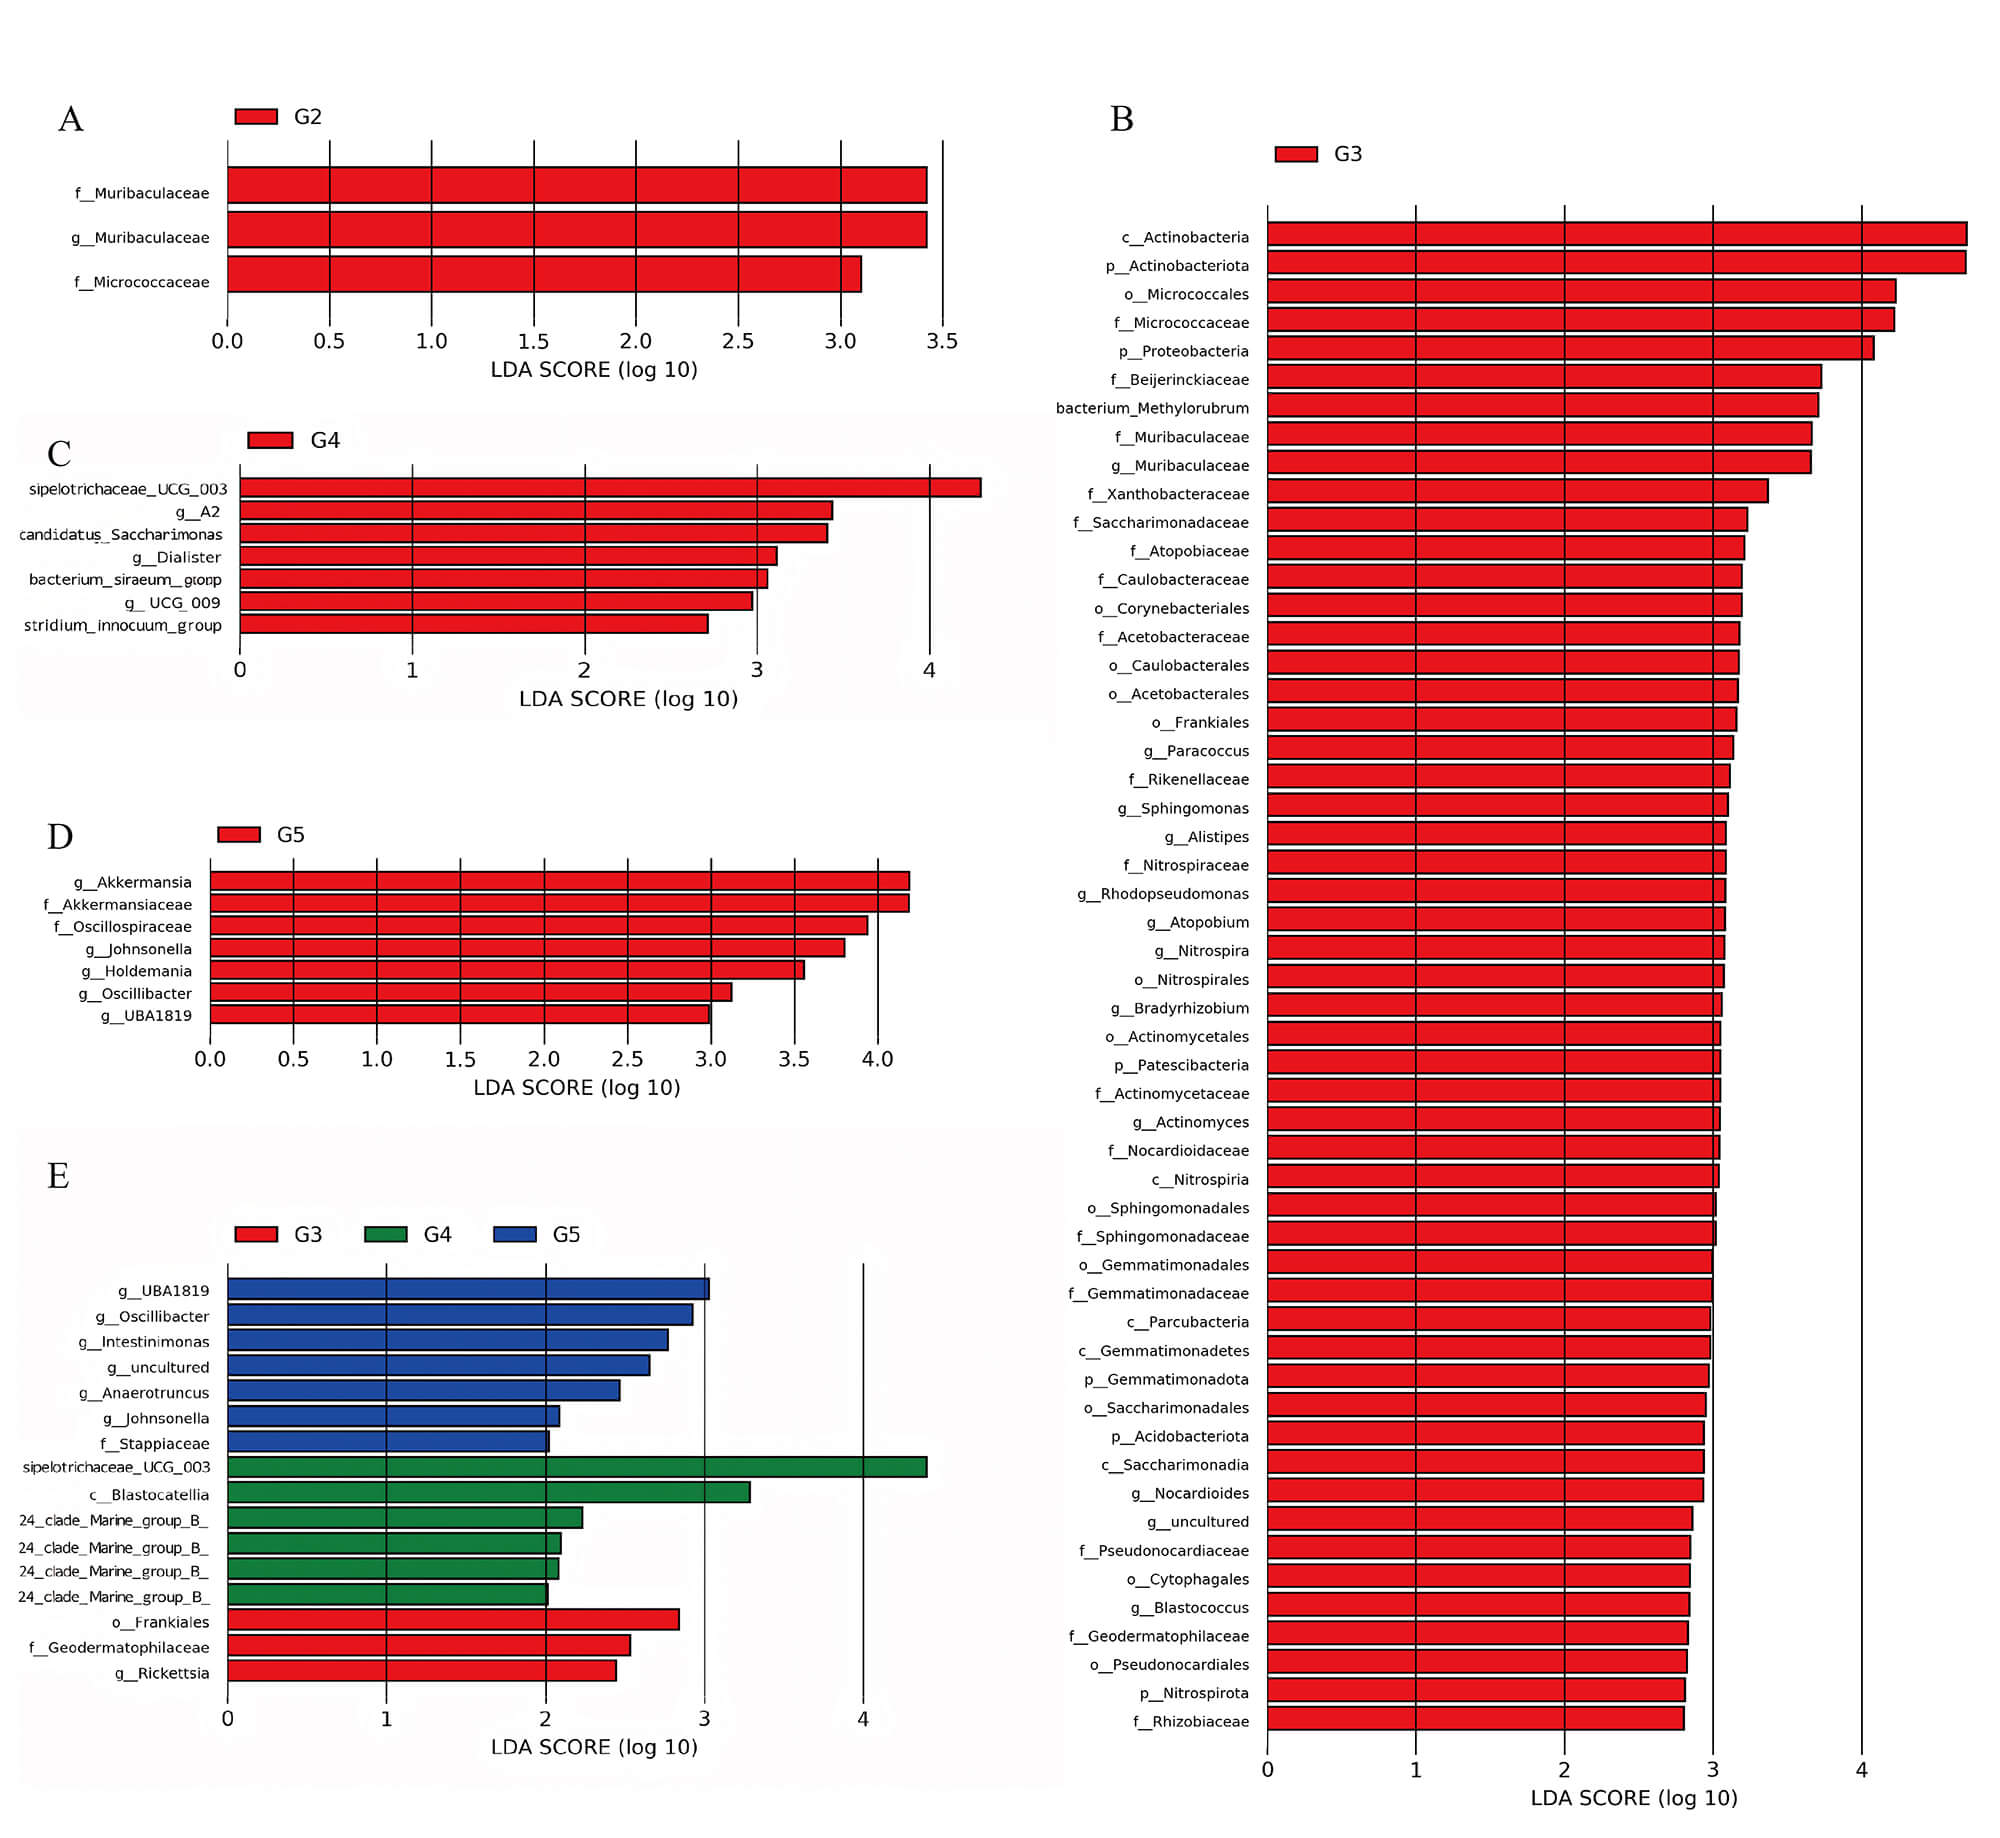 Fig. 2.
LEfSe analysis identifies stage-specific microbial biomarkers
across disease progression. LDA score bar charts highlight discriminative taxa
in group G2 (A), G3 (B), G4 (C), and G5 (D), respectively. (E) Comparative LDA
scores of significant biomarkers across groups G3, G4, and G5. Linear
Discriminant Analysis Effect Size (LEfSe) was performed with an LDA score
threshold
Receiver operating characteristic (ROC) analyses were conducted for each comparison, and the best-performing taxa by AUC were reported (Fig. 3). In VS2 (G1 vs G3), the class Actinobacteria had the highest performance (AUC = 0.81), implicating an association with atrophic lesions. In VS3 (G1 vs G4), the family Muribaculaceae (Bacteroides) achieved an AUC of 0.78. Together, these findings highlight recurring diagnostic value of Actinobacteria across stages, with the strongest performance in VS4 (AUC = 0.94).
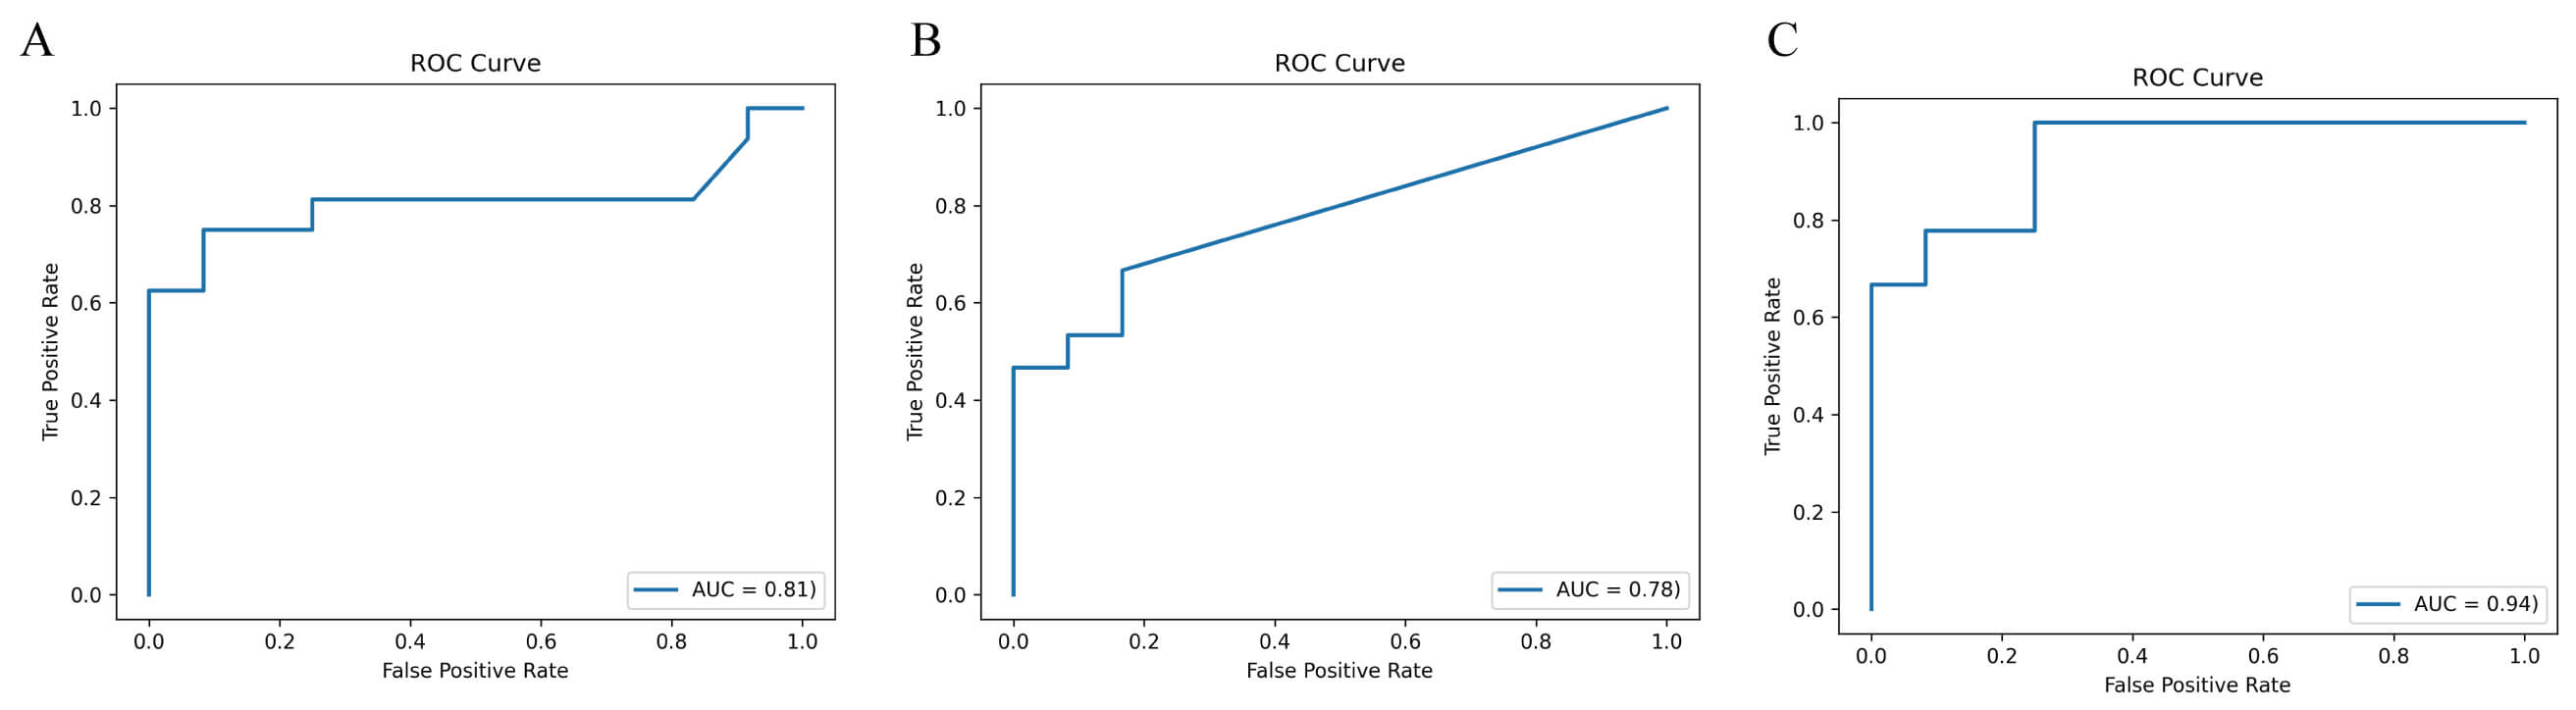 Fig. 3.
Diagnostic performance of key taxa. Receiver operating characteristic curves showing the discriminatory power of representative bacterial taxa across group comparisons (VS2–VS4). (A) Actinobacteria. (B) Muribaculaceae. (C) Actinobacteria. The area under the curve (AUC) is indicated for each biomarker.
To characterize metabolic remodeling across stages, we performed multivariate
analyses under negative- and positive-ion modes for G1–G5. Partial least squares
discriminant analysis (PLS-DA) demonstrated progressive separation of G1 from
diseased groups (G2–G5), with increasing distances along the disease continuum
(Fig. 4), indicating systemic remodeling of the fecal metabolome. Differential
metabolites identified by t-test were visualized as volcano plots (Fig. 4C,D). In G2 vs G1, nominally significant differences were observed for several
amino-acid derivatives and small molecules in both ion modes; however, After FDR
correction, a limited subset of metabolites remained statistically significant,
whereas additional nominally altered features (p
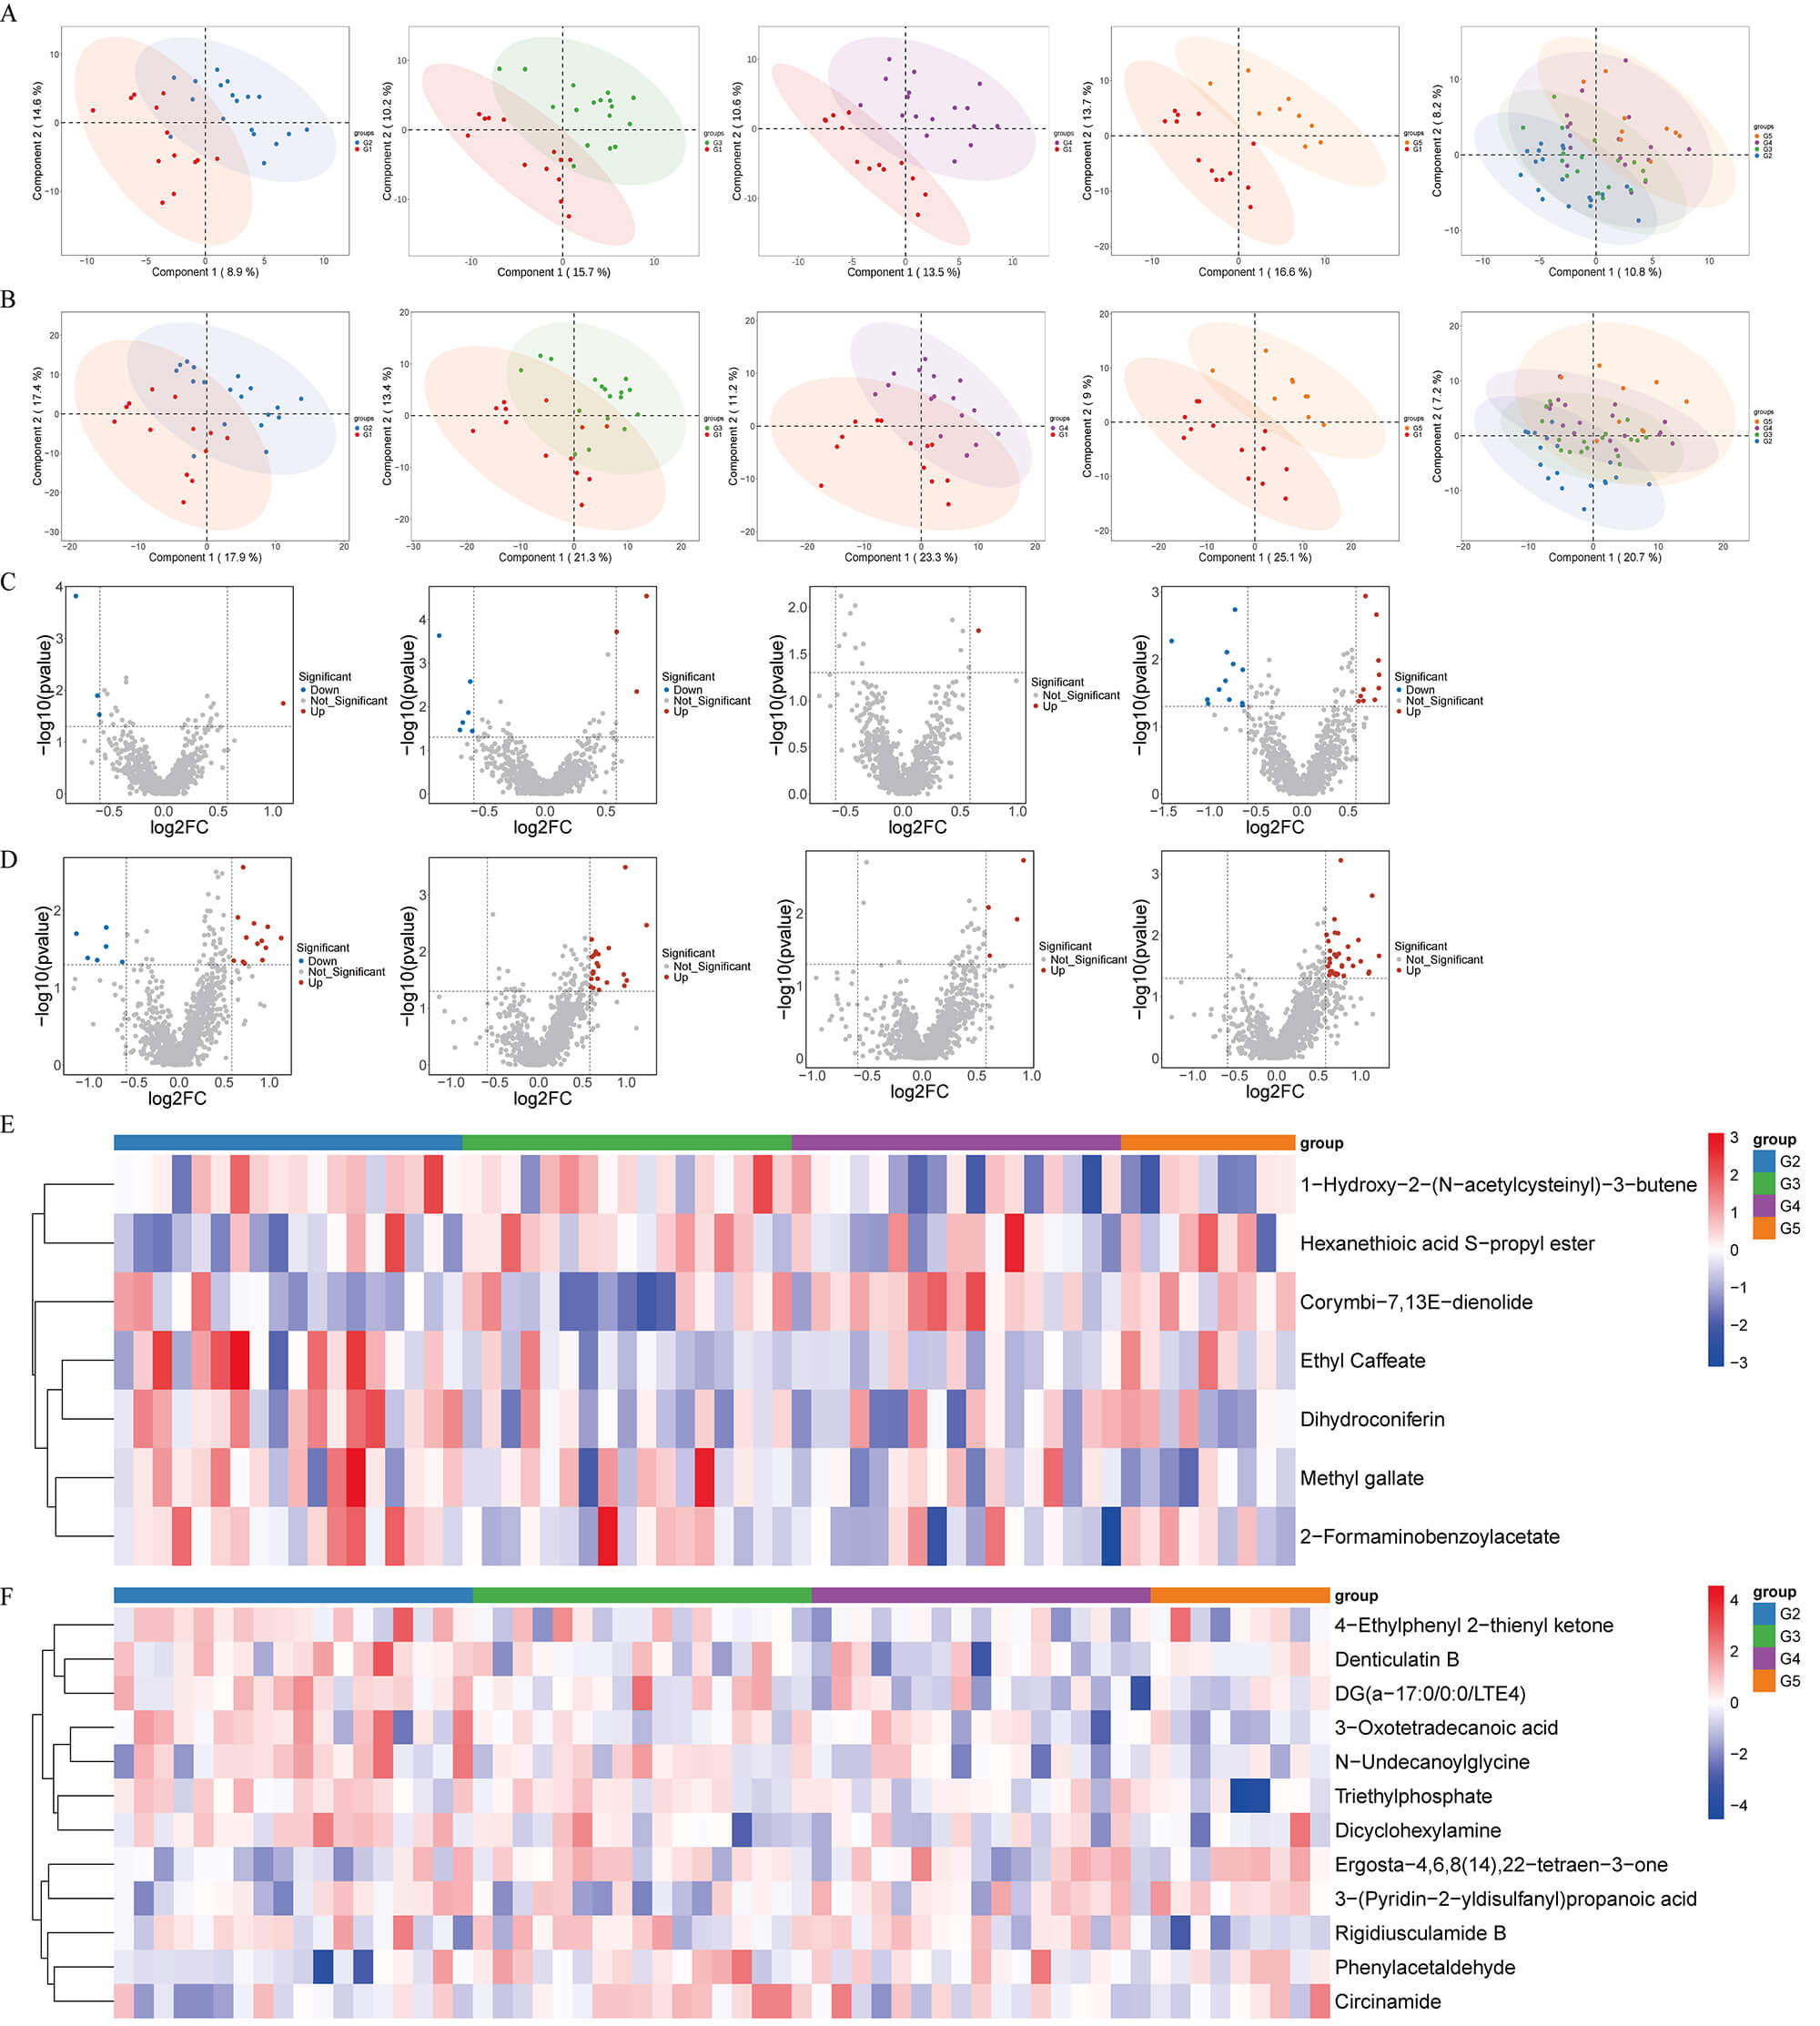 Fig. 4.
Fecal untargeted metabolomics analysis. (A,B) Partial least
squares discriminant analysis (PLS-DA) score plots of fecal metabolites under
negative-ion (A) and positive-ion (B) modes. (C,D) Volcano plots showing
differential fecal metabolites in G2 vs G1, G3 vs G1, G4 vs G1, and G5 vs G1
comparisons under negative-ion (C) and positive-ion (D). Red and blue points
represent significantly upregulated and downregulated metabolites, respectively
(p
To probe local metabolic reprogramming, we profiled gastric tissues across
G1–G5 under both ion modes. PLS-DA revealed clear separation among groups (Fig. 5A,B), mirroring fecal results: G1 gradually diverged from G2–G5, with the most
pronounced separation for G3 and G5, indicating marked tissue-level remodeling
with early abnormalities already evident in precancerous stages. Volcano plots
showed a stepwise accumulation of differential metabolites (Fig. 5C,D). G2 vs G1
displayed limited differences (amino-acid and energy-related small molecules),
suggesting weak early signals. Although numerous features exhibited nominal
significance, only a subset remained significant after FDR adjustment (FDR
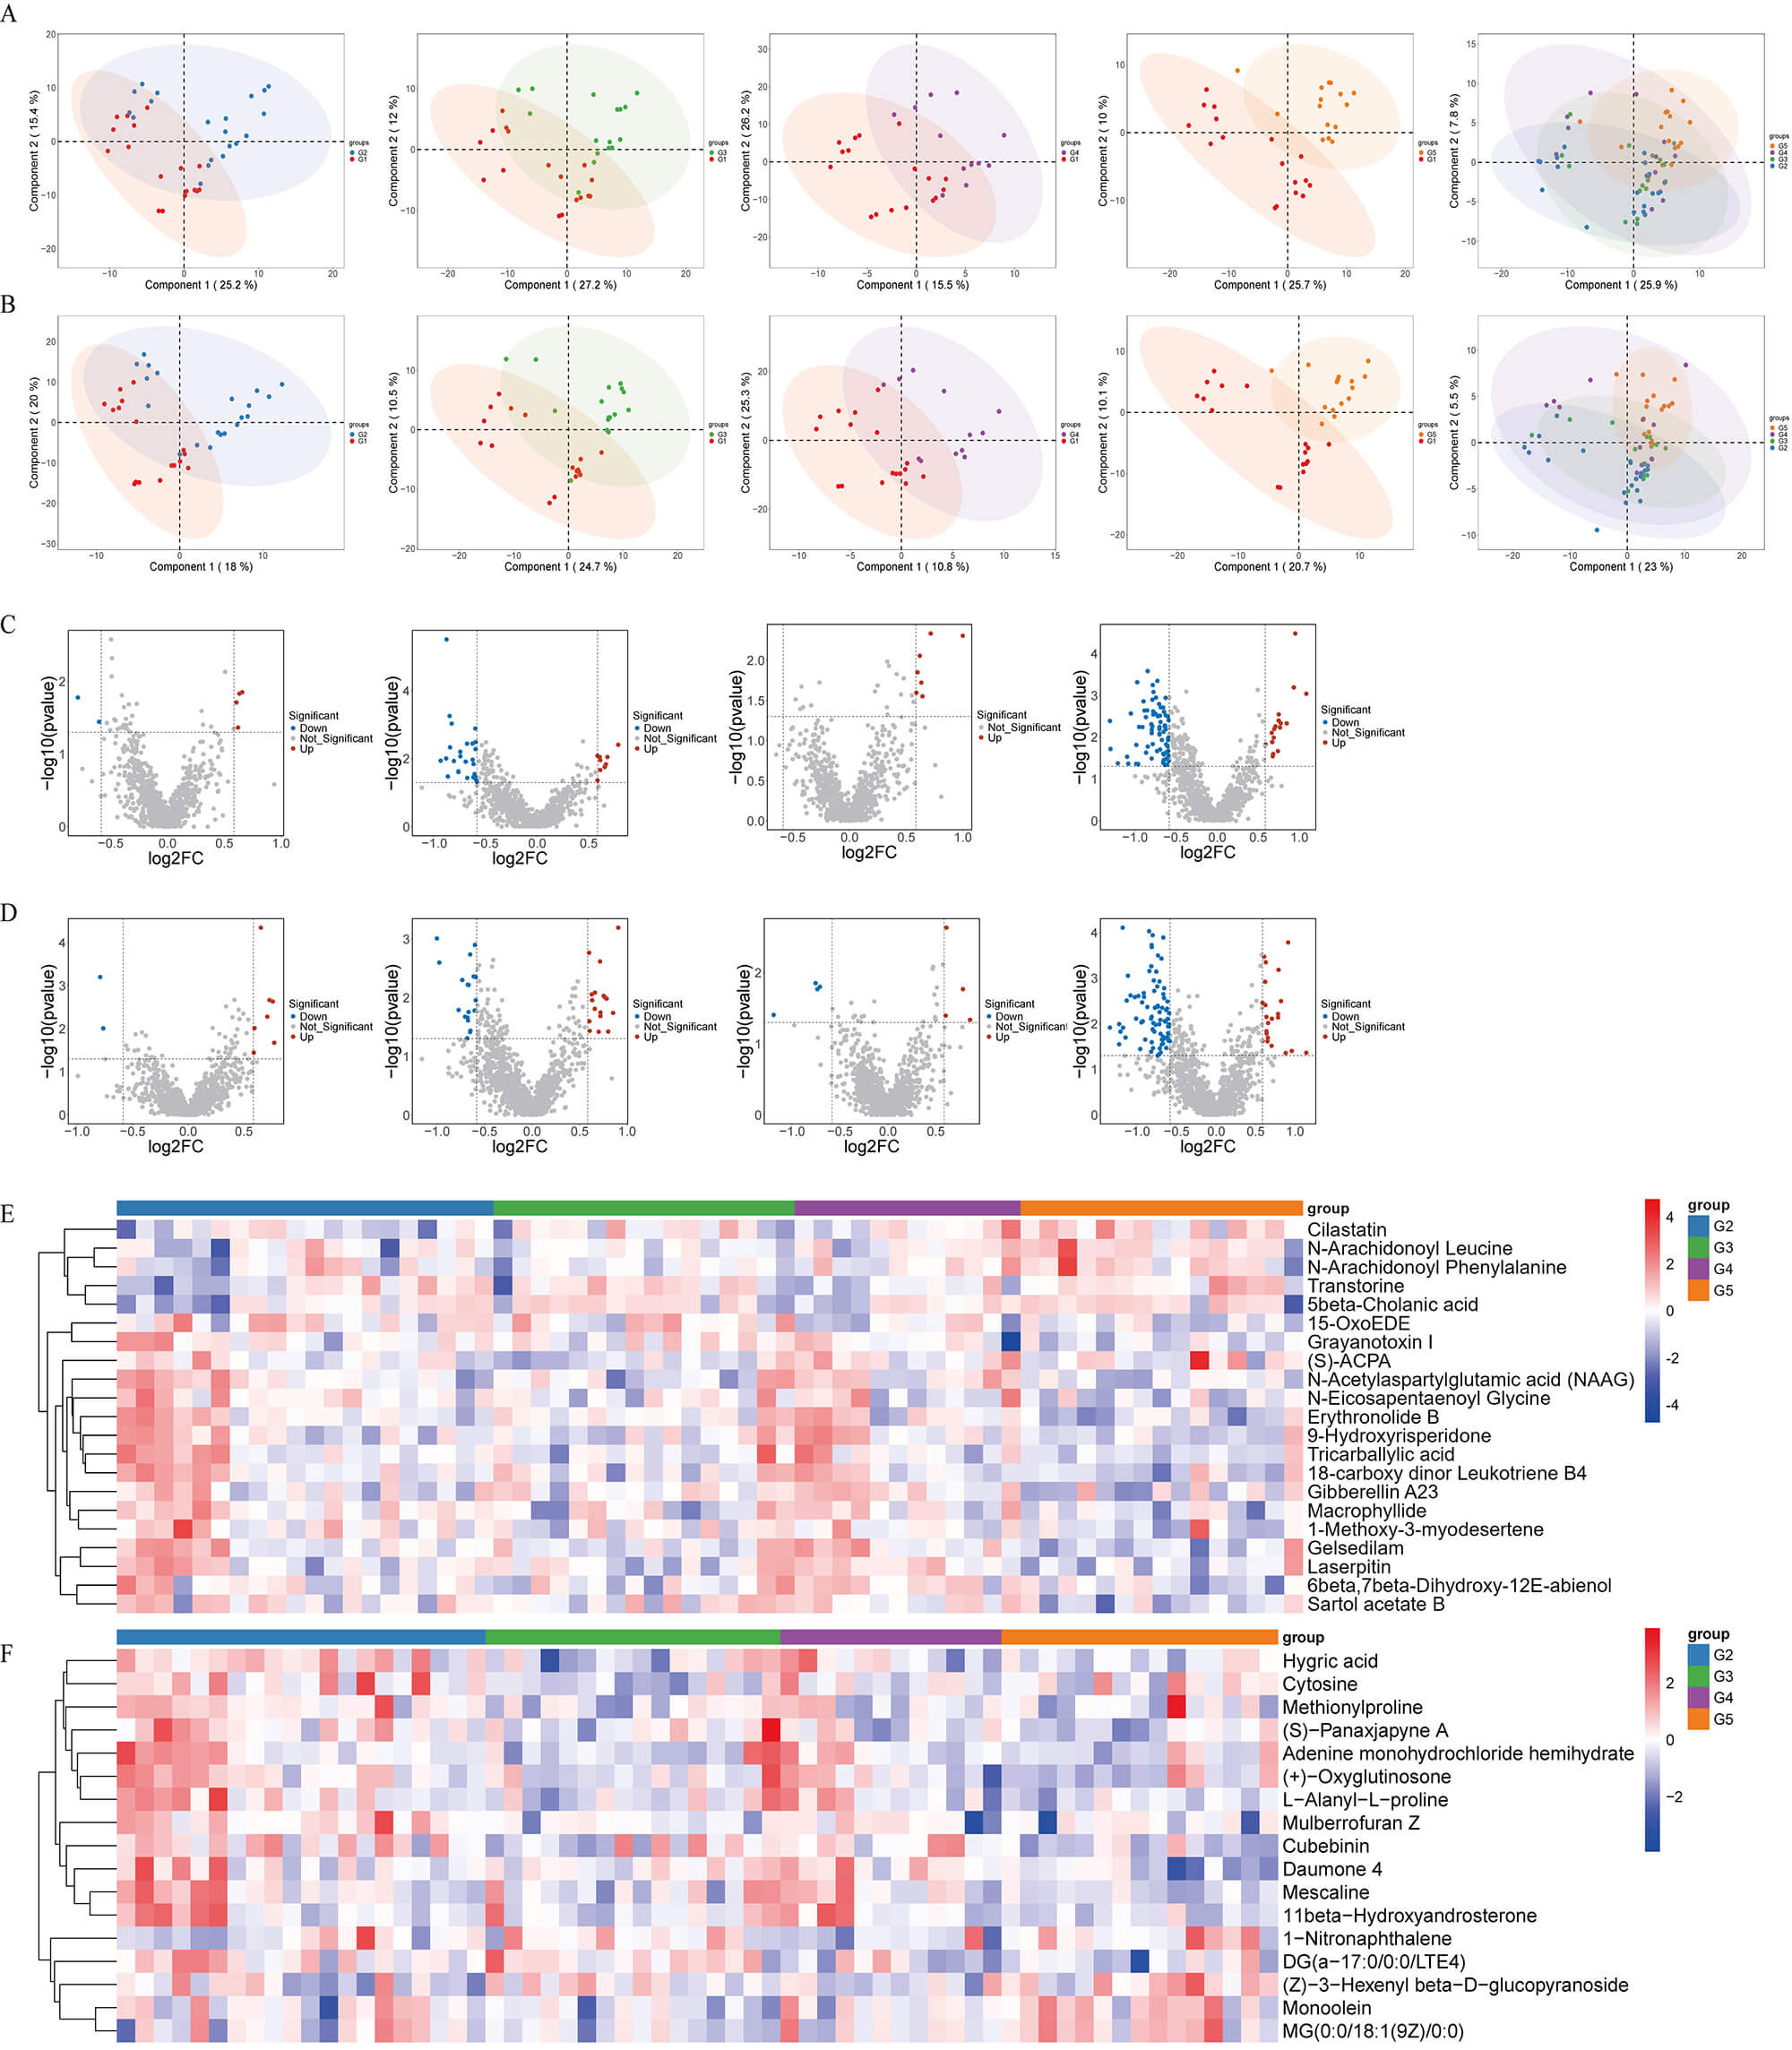 Fig. 5.
Tissue untargeted metabolomics analysis. (A,B) Partial least
squares discriminant analysis (PLS-DA) score plots of gastric tissue metabolites
under negative-ion (A) and positive-ion (B) modes. (C,D) Volcano plots showing
differential tissue metabolites in G2 vs G1, G3 vs G1, G4 vs G1, and G5 vs G1
comparisons. Red and blue points represent significantly upregulated and
downregulated metabolites, respectively (p
To investigate microbe–metabolite interactions during the transition from
non-atrophic to atrophic gastritis, we performed a Spearman correlation analysis
between LEfSe-identified differential genera and all differential metabolites in
the G3 vs G1 comparison (VS2), followed by FDR correction. Significant
associations (p
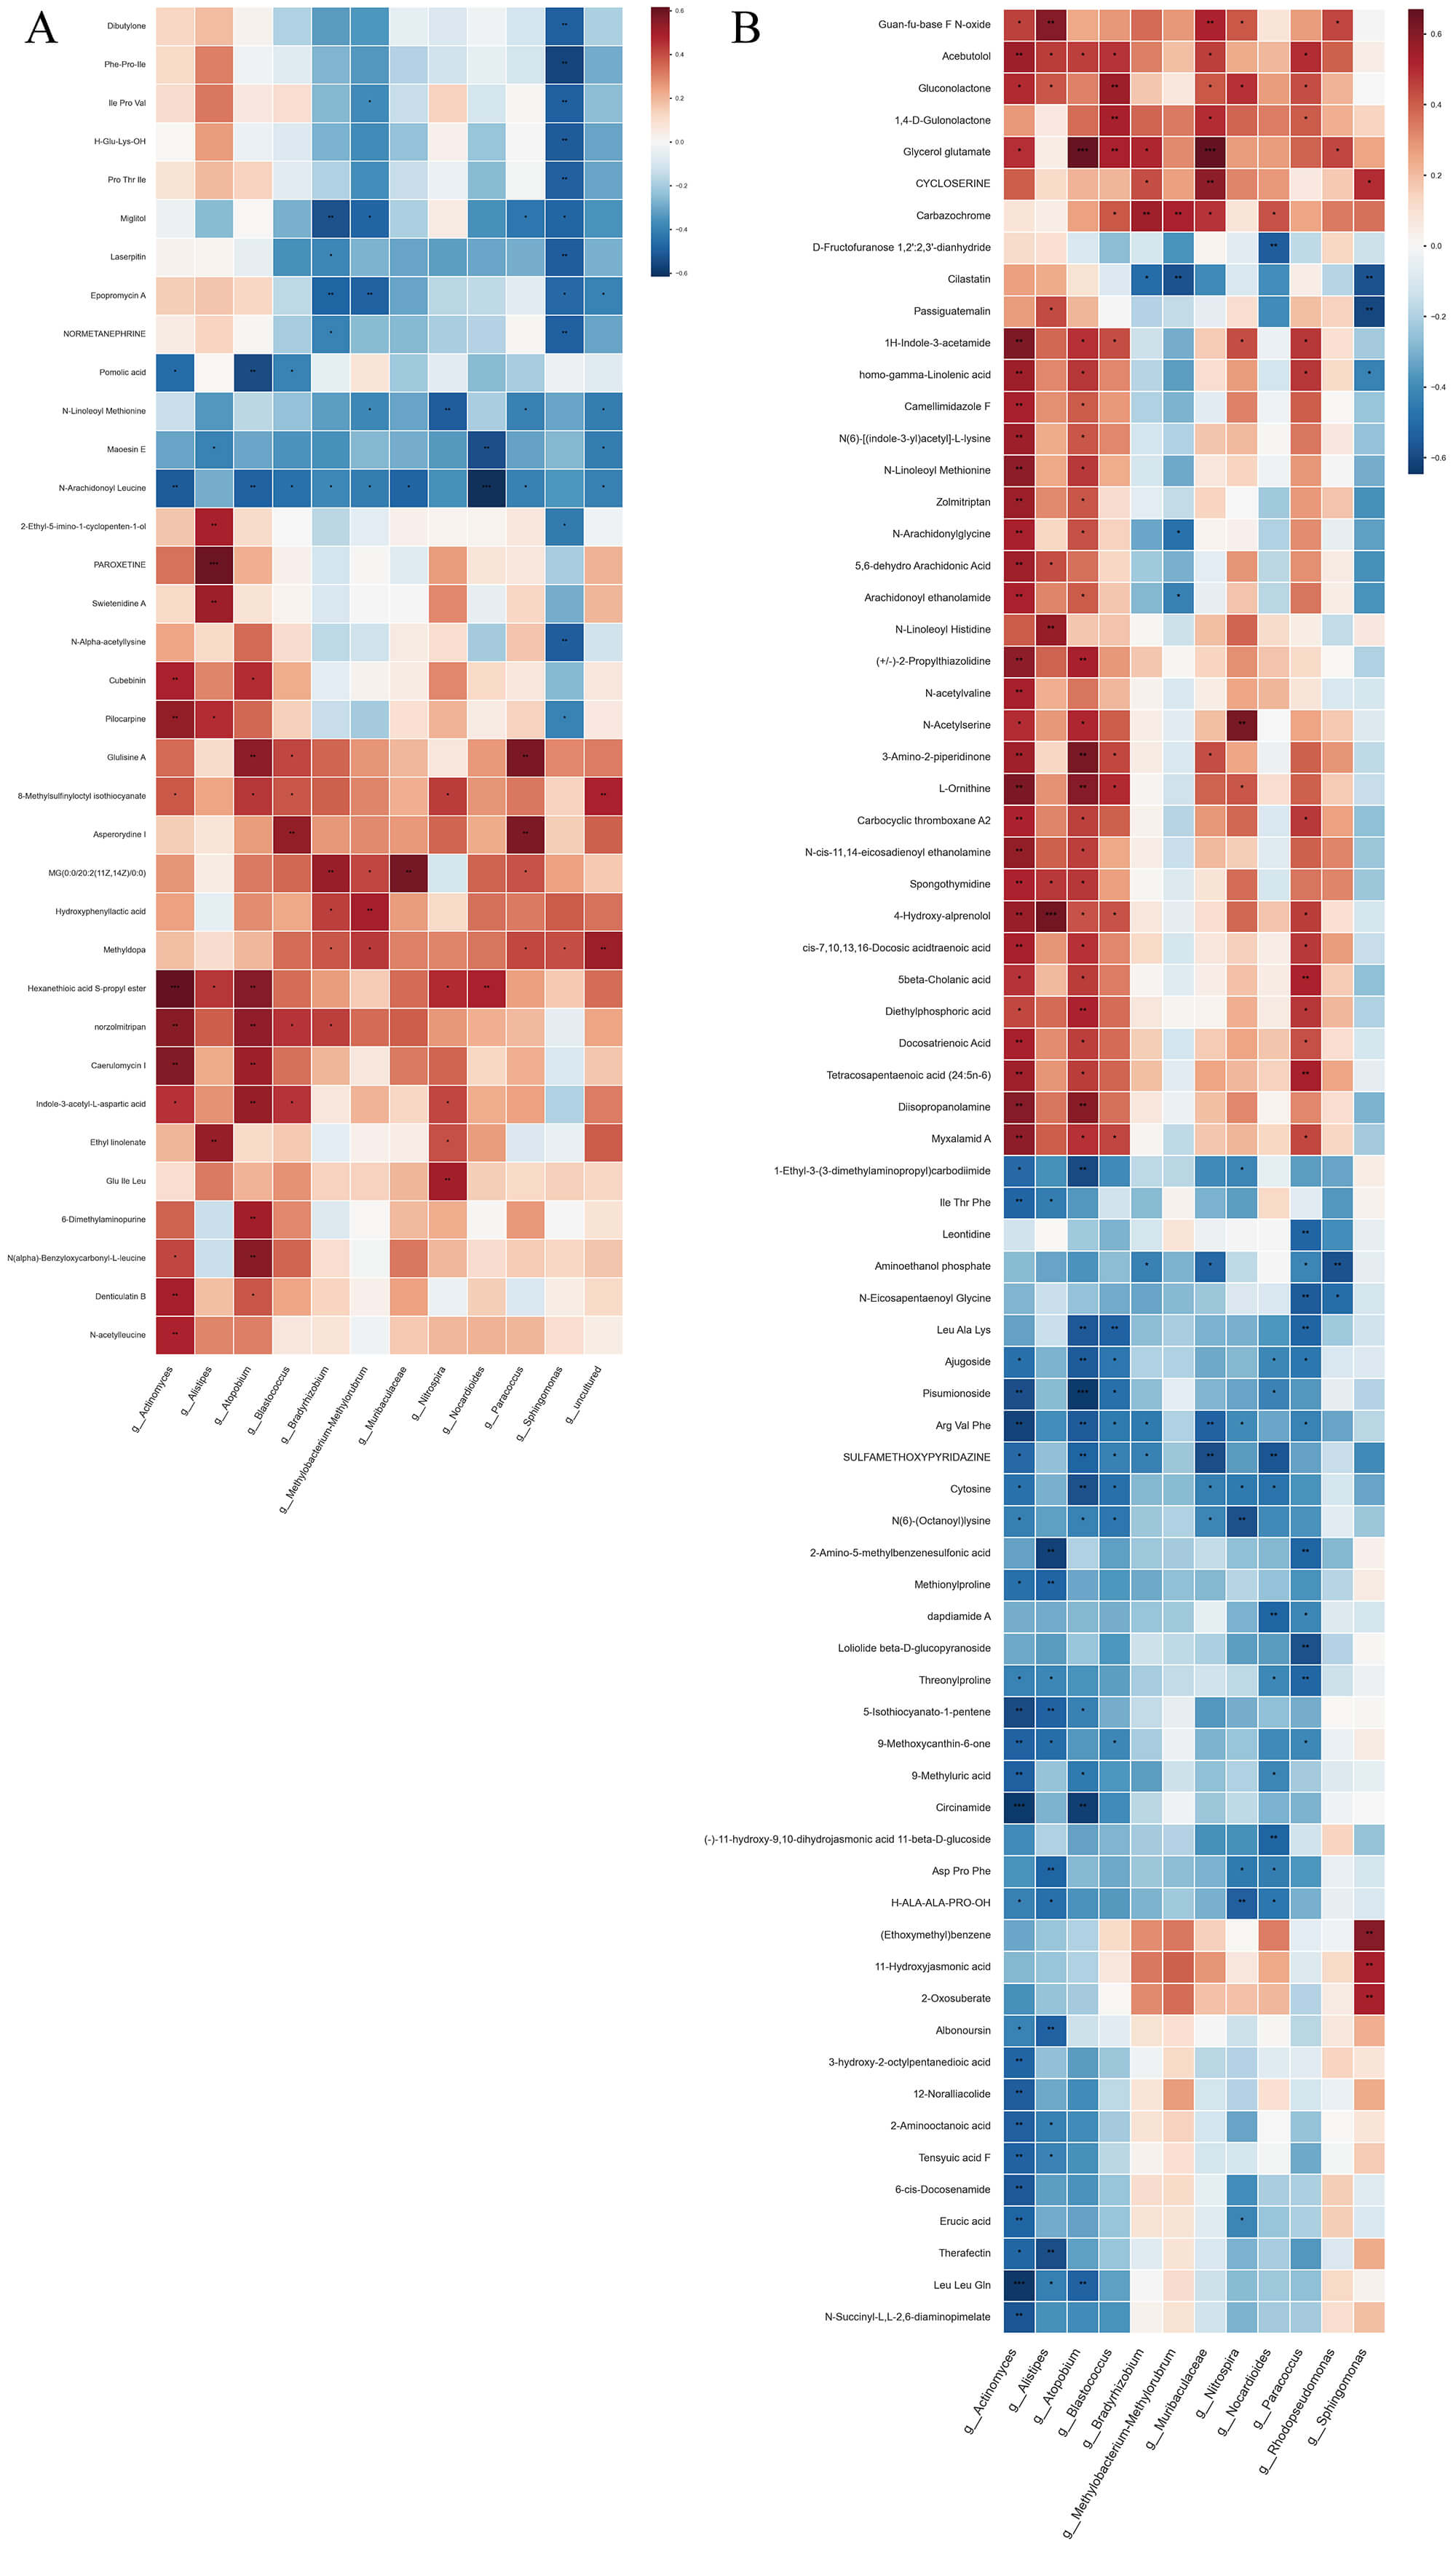 Fig. 6.
Integrated microbiota–metabolite correlation analysis between
groups G3 and G1. This figure presents a heatmap that visualizes the significant
correlations between differentially abundant microbial genera and differentially
abundant metabolites when comparing group G3 (A) to group G1 (B) (comparison set
VS2). Heatmap showing significant Spearman correlations (p
A striking interaction pattern emerged in the G3 group. Lipid-related metabolites—including multiple monoacylglycerols (MG18:3, MG18:2, MG20:2), long-chain fatty-acid derivatives (e.g., docosatrienoic acid, arachidonyl ethanolamide, N-arachidonylglycine), and N-acetylated amino-lipid compounds (N-acetylserine, N-acetylvaline)—showed strong positive correlations with several enriched genera such as Alistipes, Akkermansia, Actinomyces, and Bacteroides. These relationships indicate coordinated activation of lipid remodeling pathways at the microbial and metabolic levels.
Amino-acid–related metabolites (including Leu-Ala-Lys, Ile-Thr-Phe, Ala-Leu-Tyr, and threonylproline) also demonstrated significant correlations with the same set of G3-enriched taxa, suggesting enhanced proteolytic or nitrogen-utilization activities. In contrast, taxa such as Muribaculaceae and Nitrosphaera exhibited negative correlations with multiple fatty-acid derivatives, consistent with their reduced abundance in G3 and potential suppression of saccharolytic functions.
Together, these cross-omics correlations highlight coordinated alterations in lipid, fatty-acid, and amino-acid metabolic pathways during the G3 stage and provide hypothesis-generating evidence consistent with G3 as a key metabolic transition point in gastric lesion progression.
This study systematically delineates dynamic changes in the gut microbiota and
metabolites during gastric carcinogenesis, highlighting coordinated and
associated changes between specific bacterial taxa and perturbations in related
metabolic pathways. We confirm the gradual dysbiosis and metabolic remodeling
predicted by the Correa sequence, with microbial and metabolic alterations
emerging most prominently at the atrophic stage (G3). In the G1–G3 (vs2)
comparison, richness indices (Chao1, Observed OTUs) showed significant reductions
(p
We acknowledge that several clinical covariates may influence microbiome and metabolome variation, and have therefore expanded our analysis to better account for potential confounding. Platelet counts, systemic inflammatory markers, BMI, H. pylori infection status, smoking and alcohol consumption, and dietary salt intake were incorporated into Table 1 and examined for differences across groups. Although none of these variables fully explained the observed multi-omic patterns, their potential contributions—particularly inflammation-related indices—should be considered when interpreting the results. Given the modest sample size and cross-sectional design, residual confounding cannot be excluded, and future longitudinal studies with stratified or multivariable modeling will be needed to more precisely quantify the effects of these clinical factors on microbiome–metabolome interactions.
| Variable | G1 (n = 18) | G2 (n = 22) | G3 (n = 19) | G4 (n = 18) | G5 (n = 16) | p-value |
| Male:female | 6:12 | 14:8 | 10:9 | 10:8 | 12:4 | / |
| Age | 45 |
60 |
60 |
56.5 |
67.5 |
0.0006 |
| CRP (mg/L) | 1.36 |
1.3 |
0.9 |
0.88 |
4.25 |
0.4883 |
| RBC ( |
4.37 |
4.13 |
4.13 |
4.24 |
3.71 |
0.0104 |
| WBC ( |
5.14 |
4.94 |
4.55 |
4.92 |
5.26 |
0.3899 |
| NEUT (%) | 61.55 |
61.55 |
60.9 |
60.6 |
65.35 |
0.8217 |
| HGB (g) | 128 |
125.5 |
117 |
126.5 |
112 |
0.0192 |
| HCT (%) | 38.5 |
38 |
37 |
38 |
33.5 |
0.0544 |
| PLT ( |
204 |
154.5 |
146 |
179.5 |
204.5 |
0.0014 |
| ALT (U/L) | 22.5 |
19 |
16 |
18.5 |
14.5 |
0.3897 |
| AST (U/L) | 20 |
20 |
19 |
19.5 |
17 |
0.8311 |
| ALB (g/L) | 44.1 |
41.55 |
39.4 |
41.25 |
38.8 |
0.0057 |
| TBA (µmol/L) | 3.05 |
4.35 |
4 |
2.55 |
3.15 |
0.1913 |
| GGT (U/L) | 22.5 |
22 |
17 |
20 |
15.5 |
0.6758 |
| UA (µmol/L) | 276.5 |
321 |
306 |
295.5 |
291 |
0.6719 |
| BUN (mmol/L) | 5.42 |
5.03 |
4.99 |
4.83 |
4.58 |
0.8493 |
| Cr (µmol/L) | 72.25 |
83.45 |
84.4 |
74.65 |
82.6 |
0.3525 |
| FGB (mmol/L) | 4.72 |
4.84 |
4.76 |
4.8 |
4.7 |
0.988 |
| TT (s) | 17.85 |
17.7 |
18 |
18.2 |
17.3 |
0.0852 |
| APTT (s) | 27 |
27.15 |
28.4 |
26.7 |
25.55 |
0.4543 |
| PT (s) | 10.95 |
11.4 |
11.5 |
11.1 |
11.4 |
0.1803 |
| Fbg (g/L) | 2.56 |
2.61 |
2.46 |
2.51 |
3.23 |
0.0528 |
| INR | 0.94 |
0.97 |
0.98 |
0.94 |
0.98 |
0.1699 |
| D-D (µg/mL) | 0.38 |
0.41 |
0.31 |
0.35 |
0.86 |
0.0829 |
| USG | 1.02 |
1.02 |
1.02 |
1.02 |
1.01 |
0.0035 |
| BMI (kg/m2) | 22.6 |
23.1 |
23.4 |
22.9 |
23.8 |
0.428 |
| Current or former smokers, n (%) | 2 (11%) | 7 (32%) | 8 (42%) | 9 (50%) | 10 (63%) | 0.012 * |
| Current alcohol consumers, n (%) | 2 (11%) | 5 (23%) | 6 (32%) | 8 (44%) | 9 (56%) | 0.018 * |
| High-salt diet, n (%) | 1 (6%) | 6 (27%) | 8 (42%) | 7 (39%) | 9 (56%) | 0.021 * |
| #H. pylori positive, n (%) | 2 (11%) | 9 (41%) | 12 (63%) | 12 (63%) | 12 (75%) | - |
*Significant difference between groups (p
#H. pylori infection was assessed by 13C-urea breath test or histopathology of gastric biopsy during endoscopy. Data available for 83 of 93 participants (89.2%).
Beyond biological interpretation, the combined microbiota–metabolite signatures identified in this study have meaningful clinical translational potential. Such integrative markers could be particularly useful for screening individuals at high risk for gastric cancer—such as those with chronic gastritis, atrophic gastritis, or long-term H. pylori infection—by enabling non-invasive detection of early mucosal alterations before endoscopically visible lesions emerge. In addition, these signatures may serve as dynamic indicators for monitoring the evolution of precancerous lesions, providing a complementary tool to endoscopy for risk stratification and longitudinal surveillance. From a feasibility perspective, fecal sample collection is simple, low-cost, and well accepted by patients, and the workflow for 16S rRNA sequencing and standardized metabolomics is becoming increasingly accessible in clinical laboratories. As sequencing and mass spectrometry costs continue to decline, these combined markers could be incorporated into routine population-level screening programs or follow-up algorithms for high-risk cohorts. Thus, the translational potential of microbiota–metabolite profiling extends beyond mechanistic insights and may inform real-world strategies for early detection, disease monitoring, and precision prevention.
Microbiome analyses revealed a decline in
At the metabolomic level, both fecal and tissue profiles exhibited stage-wise
perturbations. Fecal data suggested reductions in anti-inflammatory SCFAs and
increases in pro-inflammatory or pro-carcinogenic metabolites (e.g., kynurenine
pathway intermediates, secondary bile acids) emerging already at G3. Tissue
profiles revealed broader reprogramming in GC, including energy, nucleotide, and
lipid metabolism, consistent with proliferative demands and immune evasion.
Importantly, all metabolomic analyses were corrected for multiple testing using
the Benjamini–Hochberg FDR procedure, and biological interpretations were based
primarily on metabolites passing the FDR
Correlative analyses linked depletion of SCFA producers to reduced mucosal immunity and altered signaling patterns that were associated with lesion advancement. Within the Correa framework, H. pylori-driven chronic inflammation likely perturbs gastric and intestinal communities, with metabolite shifts subsequently modulating local immunity and signaling to accelerate lesion advancement [31, 32].
Importantly, ROC analyses indicated that specific taxa (e.g., class
Actinobacteria, family Oscillospiraceae) and metabolite combinations (e.g.,
butyrate + kynurenine + secondary bile acids) achieved good discrimination among
controls, precancerous lesions, and GC (AUCs
The integrative correlation analysis of the G3 vs G1 comparison revealed biologically coherent microbe–metabolite modules that reflect functional remodeling during the early atrophic stage. The strong positive associations between Alistipes, Akkermansia, Actinomyces, and Bacteroides with lipid-related metabolites—including monoacylglycerols and arachidonic-acid derivatives—suggest enhanced lipid turnover, altered membrane remodeling, and possible activation of inflammation-linked lipid pathways in G3. The parallel enrichment of amino-acid metabolites and their correlations with G3-enriched taxa further imply increased proteolytic activity and nitrogen metabolism. Conversely, the negative associations observed for Muribaculaceae and Nitrosphaera with several lipid metabolites are consistent with the decline of saccharolytic functionalities reported in early atrophic gastritis. Although the PERMANOVA effect sizes were modest, which is common in microbiome studies, the coordinated shifts observed at G3 suggest that this stage may represent a potential transitional or acceleration point rather than a discrete inflection boundary.
This study has limitations. First, the sample size is modest; some findings did not remain significant after multiple-testing correction and require validation in larger cohorts. Second, the cross-sectional design precludes causal inference; longitudinal studies and mechanistic models are needed. In addition, although we incorporated available data on H. pylori infection and basic dietary habits into exploratory analyses, residual confounding cannot be fully excluded. Future large-scale longitudinal studies should incorporate comprehensive dietary assessment and H. pylori stratification to refine the microbiota–metabolome interaction models. Third, metabolite annotation is inherently limited; some features lack definitive pathway mapping. Moreover, because the present study is exploratory and cross-sectional with a modest sample size, advanced causal inference analyses such as co-abundance network modeling and mediation effect testing were not performed, and will be addressed in future longitudinal studies with expanded cohorts. Additionally, the functional roles of key microbial biomarkers identified by LEfSe (such as Bifidobacterium and Streptococcaceae) were not experimentally validated through in vitro assays or animal models, and future studies will incorporate bacterial culture supernatant experiments and gnotobiotic or microbiota-transplant models to strengthen causal inference. To overcome these limitations, future work will employ a longitudinal cohort design with repeated sampling across the Correa sequence to capture temporal microbial and metabolic dynamics. Integration of metagenomics, metatranscriptomics, and targeted metabolomics will enable higher-resolution functional mapping of microbial metabolism and host signaling.
In parallel, gnotobiotic mouse and antibiotic-treated models will be used to
verify causality between specific taxa (e.g., Actinobacteria, SCFA-producing
bacteria) and gastric mucosal inflammation or metabolic reprogramming through
immune and signaling pathways such as NF-
In summary, by integrating fecal and tissue untargeted metabolomics with 16S profiling, we chart a stage-resolved “microbiota–metabolite–host” interaction landscape across GC progression. Our results suggest that atrophy (G3) may represent a potential inflection stage, whereas erosion (G4) exhibits transitional features. Combined microbial and metabolic features show promise for early detection and stratified management, while offering mechanistic insights into metabolic dependencies that could inform precision prevention and therapy.
The datasets used and analyzed during the current study are available from the corresponding author on reasonable request.
JY and XS conceived and designed the research. BW and YL performed the experiments. YY, HZ, XZ and GW analyzed the results and data. JY and BW wrote, YL and XS revised the manuscript. All authors contributed to editorial changes in the manuscript. All authors read and approved the final manuscript. All authors have participated sufficiently in the work and agreed to be accountable for all aspects of the work.
This study was approved by the ethics committee of The People’s Hospital of Chizhou City (approved No. 2023-KY-17). We certify that the study was performed in accordance with the 1964 declaration of HELSINKI and later amendments. Written informed consent to participate in this study was provided by the patients or their families/legal guardian.
We thank Zhao Zhang and Yan Ma (Center of Human Microecology Engineering and Technology of Guangdong Province, Guangdong Longsee Biomedical Corporation, Guangzhou, China) for statistical consultation and technical support provided by the Longseek high-throughput zebrafish screening platform for drug and probiotic evaluation. Also we acknowledge Dr. Shihao Huang from Hainan University for language polishing.
This study was funded by 2023 Chizhou City major science and technology special project.
The authors declare no conflict of interest.
During the preparation of this work the authors used Deepseek-R1 in order to check spell and grammar. After using this tool, the authors reviewed and edited the content as needed and takes full responsibility for the content of the publication.
Supplementary material associated with this article can be found, in the online version, at https://doi.org/10.31083/FBL46553.
References
Publisher’s Note: IMR Press stays neutral with regard to jurisdictional claims in published maps and institutional affiliations.