


 , Yanhua Ma 1, Menglin Li 3, Xun Jiang 1,4, Qi Pan 1, Mingqun Deng 1,*
 , Lixin Guo 1,2,*
1 Department of Endocrinology, Beijing Hospital, National Center of Gerontology, Institute of Geriatric Medicine, Chinese Academy of Medical Sciences, 100730 Beijing, China
2 Peking University Fifth School of Clinical Medicine, 100730 Beijing, China
3 Department of Traditional Chinese Medicine, Beijing Hospital, National Center of Gerontology, Institute of Geriatric Medicine, Chinese Academy of Medical Science, 100730 Beijing, China
4 Graduate School of Peking Union Medical College, Chinese Academy of Medical Sciences, 100191 Beijing, China
Abstract
Emerging evidence indicates that Akkermansia muciniphila (A. muciniphila or AKK) regulates host glucose metabolism through multiple pathways. In this study, we examined the therapeutic effects of A. muciniphila on chronic sleep deprivation (CSD)-induced glucose dysregulation and the underlying mechanisms.
A modified multiplatform water environment method was used to generate a mouse model of CSD. The mice were divided into three groups: the control (CON) group (ad libitum sleep), the CSD group (subjected to sleep deprivation), and the CSD+AKK group (CSD mice were supplemented with A. muciniphila at 3 × 10⁸ CFU per mouse, three times per week). After an 8-week intervention, glucose metabolism was assessed. Serum concentrations of lipopolysaccharide (LPS), interleukin-6 (IL-6), interleukin-1β (IL-1β) and tumor necrosis factor α (TNF-α) were measured. The mRNA expression and protein expression of mucin 2 (MUC2) and zonula occludens-1 (ZO-1) in the colon tissue were analyzed. Goblet cells in colon tissues were quantified using Alcian Blue–Periodic Acid-Schiff (AB–PAS) staining. Additionally, changes in gut microbiome diversity and composition among groups were compared.
CSD induced significant glucose intolerance and insulin resistance, evidenced by increased area under the curve (AUC) of the oral glucose tolerance test (OGTT), homeostatic model assessment of insulin resistance (HOMA-IR), and fasting insulin levels compared to the CON group (all p < 0.05). This was accompanied by a marked impairment of the colonic mucosal barrier, characterized by a profound loss of goblet cells and downregulation of key barrier components, MUC2 and ZO-1, at both the mRNA and protein levels (all p < 0.05). Intervention with A. muciniphila significantly ameliorated CSD-induced glucose intolerance, insulin resistance and colonic barrier damage. Furthermore, CSD elevated serum levels of LPS, IL-6, TNF-α, and IL-1β (all p < 0.05), which were effectively mitigated by A. muciniphila intervention. 16S rDNA sequencing confirmed the successful colonization of A. muciniphila, as its absolute abundance was significantly greater in the CSD+AKK group than in the CSD group. In addition, A. muciniphila intervention affected the abundance of Burkholderiales bacterium, Lactococcus garvieae, and other bacterial strains in the intestine.
A. muciniphila supplementation effectively ameliorated CSD-induced glucose intolerance, reduced the serum levels of LPS and proinflammatory cytokines (IL-6, TNF-α, and IL-1β), and restored intestinal barrier integrity by upregulating MUC2 and ZO-1 expression in colon tissues.
Keywords
- glucose metabolism
- sleep deprivation
- Akkermansia muciniphila
- inflammation
- intestinal barrier functions
A growing body of clinical and epidemiological evidence suggests that chronic sleep deprivation (CSD) is strongly associated with an increased risk of metabolic disorders such as insulin resistance and type 2 diabetes mellitus (T2DM) [1, 2, 3], posing potential challenges to public health [4, 5]. While traditional research has focused on neurohormonal pathways [6, 7, 8], the precise mechanisms underlying CSD-induced glucose metabolic dysregulation remain incompletely elucidated, prompting exploration into novel pathological mediators.
Emerging insights point to gut microbiota dysbiosis as a critical intermediary in the metabolic disorder of sleep loss [9, 10]. Sleep disorders may alter both the composition of the intestinal flora and its microenvironment, which in turn may disrupt host metabolic homeostasis [9, 11, 12]. Notably, studies have demonstrated that sleep deprivation compromises intestinal barrier integrity [13, 14, 15], which may lead to increased systemic translocation of endotoxins (e.g., lipopolysaccharide, LPS) and subsequent activation of inflammatory pathways [16, 17, 18]. These inflammatory responses are known to interfere with insulin signaling, thereby promoting glucose intolerance [19, 20]. This cascade highlights the gut microbiome as a promising therapeutic target for mitigating sleep deprivation-related metabolic complications.
Among the various gut symbionts, Akkermansia muciniphila (A. muciniphila or AKK) has garnered significant attention because of its potential beneficial effects on metabolic health [21]. A. muciniphila is an anaerobic bacterium renowned for its ability to fortify the intestinal mucosal barrier, exert anti-inflammatory effects, and regulate host glucose metabolism [22]. Clinical observations revealed a marked reduction in A. muciniphila abundance in individuals with prediabetes and diabetes compared with healthy controls [23]. Furthermore, multiple studies have indicated an association between decreased A. muciniphila levels and the occurrence of sleep disorders [24, 25], suggesting its potential involvement in the sleep–metabolism axis. Mechanistically, A. muciniphila may enhance barrier function via extracellular vesicle secretion, reduce endotoxemia, and ameliorate insulin resistance [21, 22, 26]. These properties position A. muciniphila supplementation as a viable strategy to counteract metabolic disturbances.
In our prior investigation using a CSD mouse model (unpublished data), we observed a significant negative correlation between the abundance of A. muciniphila and glycemic parameters, indicating that it is a key modulator of CSD-induced glucose dysregulation. Building on this foundation and consistent with existing evidence on its barrier-preserving and metabolic-stabilizing functions, we hypothesize that A. muciniphila intervention could alleviate CSD-induced glucose intolerance and inflammatory activation. In this study, we therefore administered live A. muciniphila via oral gavage to CSD mice to evaluate its therapeutic effects on glucose metabolism and to preliminarily explore the underlying mechanisms, thereby addressing a critical knowledge gap in this evolving field.
Thirty male C57BL/6J mice (6 weeks old, weighing 20
We subjected the mice to CSD using a modified multiple-platform water environment method (Supplementary Fig. 1). CSD mice underwent 16 hours of daily sleep deprivation (17:00 to 9:00 the next day), with the remaining 8 hours (9:00–17:00) spent in standard cages for recovery, over an 8-week period [27, 28]. CON group mice were housed in identical cages without sleep restriction. The CSD experiment began at 8 weeks of age (designated as week 0) and lasted for 8 weeks. At week 8, oral glucose tolerance tests (OGTTs) and insulin tolerance tests (ITTs) were performed. After the metabolic assessments were completed, blood was collected via the retro-orbital venous plexus under 3% isoflurane anesthesia, followed by euthanasia via cervical dislocation. For the CSD+AKK group, A. muciniphila suspension (109 CFU/mL) was administered via oral gavage (0.3 mL per time) three times per week during the CSD period. The CON and CSD groups received equal volumes of sterile phosphate-buffered saline (PBS, pH 7.2–7.4) as a control (Fig. 1A). All animal husbandry and experimental procedures were approved by the Institutional Animal Care and Use Committee of Peking University Health Science Center (Animal protocol approval number: DLASBE0510).
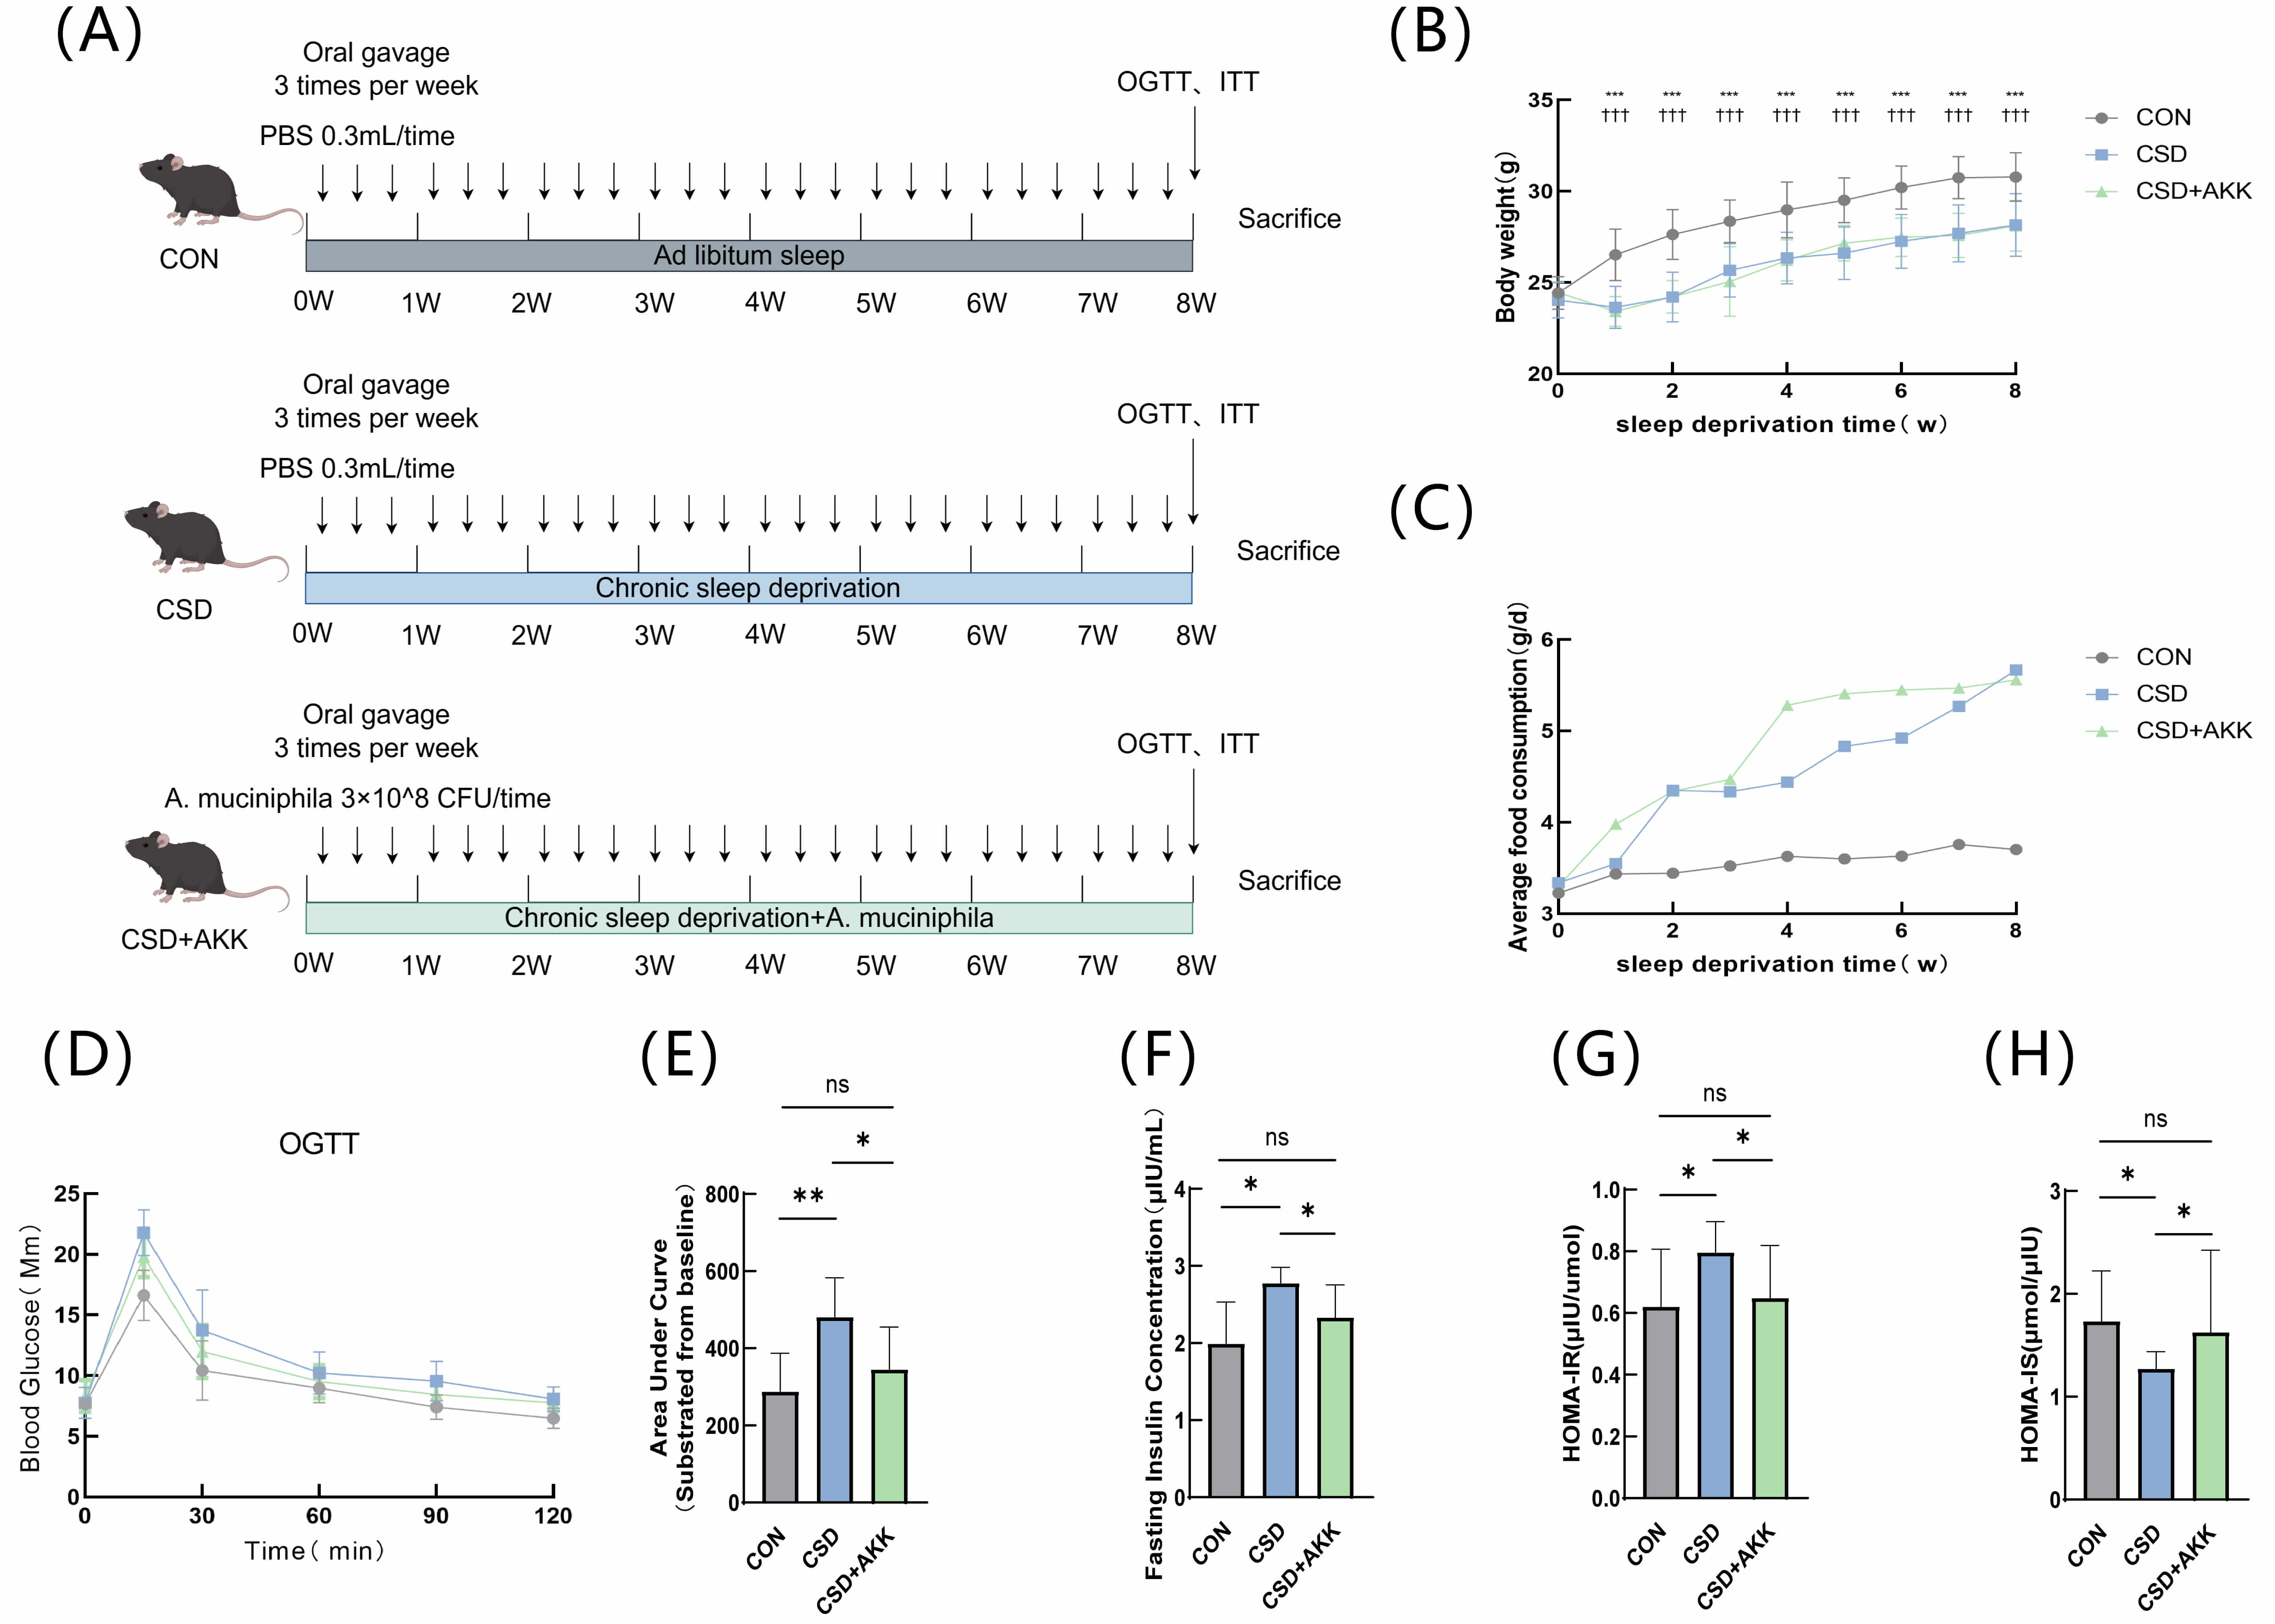 Fig. 1.
Effects of A. muciniphila on metabolic parameters
in vivo. (A) Overall experimental timeline. (B) Body weight changes (n
= 10, mean
After fasting overnight, the mice received an oral gavage of glucose solution (2 g/kg body weight). Blood glucose levels were measured from the tail vein immediately before (0 min) and at 15, 30, 60, 90, and 120 minutes after the administration.
The mice were placed in fresh bedding and fasted for 4 hours (water allowed), followed by intraperitoneal insulin injection (0.3 IU/kg body weight). Blood glucose was measured at 0, 15, 30, 60, 90, and 120 minutes using the same tail-tip blood sampling method (The detailed procedure for the emergency management of mouse hypoglycemia is described in Appendix A1).
Fasting serum insulin (INS) levels were quantified by enzyme-linked
immunosorbent assay (ELISA); HOMA-IR was calculated as (FBG
The tissue samples were homogenized in liquid nitrogen, followed by total RNA
extraction using RNAiso Plus (9109; Takara Biomedical Technology, Beijing,
China), chloroform phase separation, isopropanol precipitation, and 75% ethanol
washing. cDNA was reverse transcribed under standardized conditions using the
commercial kit (RR036A, Takara Biomedical Technology Co., Beijing, China).
RT-qPCR analysis was performed with SYBR Green (RR820A, Takara Biomedical
Technology Co., Beijing, China) chemistry with prevalidated primers. GAPDH was
used as the internal control and gene expression was quantified using the
The tissue samples were homogenized in liquid nitrogen and subsequently lysed in
RIPA buffer (AQ521; Aoqing Biotechnology, Beijing, China) with
protease/phosphatase inhibitors (AQ551/AQ552; Aoqing Biotechnology, Beijing,
China) for 30 minutes on ice. The protein concentration was quantified via a
bicinchoninic acid assay (WB6501; NCM Biotech, Suzhou, China), as detailed in
Appendix A2. The samples were subjected to sodium dodecyl sulfate–polyacrylamide
gel electrophoresis after which the proteins were transferred to activated PVDF
membranes (ISEQ00010; Merck Millipore, Darmstadt, Germany). The membranes were
blocked in 5% skim milk, incubated with primary antibody (detailed antibody
information is listed in Appendix A3) (4 °C overnight) and horseradish
peroxidase (HRP)-conjugated secondary antibody (room temperature, 1 hour), and
washed with TBST (137 Mm NaCl, 2.7 mM KCL, 25 mM Tris, 0.05% Tween-20) between
steps (5 minutes
After the mice were sacrificed, the colon tissues were collected and fixed in 4% paraformaldehyde for 24 h, followed by paraffin embedding and sectioning.
Following dewaxing and rehydration, the paraffin sections were subjected to hematoxylin staining for 5 minutes, differentiated in 1% hydrochloric acid ethanol until they turned pink, and then blued in running water until the nuclei appeared clear and bright blue under microscopic examination. The sections were subsequently stained with eosin for 5 minutes, dehydrated through a graded series of ethanol solutions and xylene, and finally mounted with neutral gum. Colon tissues from different groups were observed under an optical microscope. A pathological evaluation was performed on H&E-stained colon sections according to a published scoring system [29], with the total histopathological score derived from the sum of the epithelium and infiltration scores.
Paraffin-embedded sections were sequentially processed as follows: after dewaxing and rehydration, antigen retrieval was performed in citrate buffer (pH 6.0) using a microwave heating protocol (medium heat to boiling, maintained for 8 minutes, then medium–low heat for 7 minutes). After cooling, the sections were washed three times with PBS (pH 7.4). Endogenous peroxidase activity was then blocked by incubation in 3% hydrogen peroxide for 25 minutes at room temperature. Following a PBS wash, nonspecific binding was blocked with 3% bovine serum albumin for 30 minutes, prior to incubation with primary antibodies overnight at 4 °C. The sections were then incubated with an HRP-conjugated secondary antibody (ab205718/ab205719; Abcam, Cambridge, UK) for 50 minutes at room temperature, followed by diaminobenzidine development, hematoxylin counterstaining, dehydration, and mounting with neutral gum.
Paraffin-embedded sections were dewaxed, rehydrated, and processed for AB–PAS staining. The procedure involved sequential staining with Alcian Blue (8 min), periodic acid (15 min), and Schiff’s reagent (30 min in the dark), with a wash step after each staining step. After microscopic examination, the sections were dehydrated through an ethanol-butanol-xylene series and mounted in neutral gum. Quantitative analysis of goblet cells was carried out via ImageJ software.
We measured LPS, tumor necrosis factor-
A. muciniphila (purchased from American Type Culture Collection,
Catalog number: ATCC-BAA-835) was cultured anaerobically in CMC broth at 37
°C for 48 h (marked as P1). A 0.5 mL aliquot was transferred to fresh
medium for P2 expansion. After 48 h, the bacterial cells were pelleted by
centrifugation, resuspended in deoxygenated PBS, and adjusted to the target
concentration (1
Absolute and relative quantification approaches for gut microbial 16S rDNA
amplicon sequencing were integrated in this study. Absolute quantification was
achieved by spiking synthetic DNA standards into samples during PCR
amplification, enabling calibration curves to determine gene fragment copy
numbers at both the DNA (copies/ng DNA) and sample levels (copies/g or mL).
Relative quantification was performed following conventional amplicon sequencing
workflows. Experimental procedures included genomic DNA extraction with quality
control (gel electrophoresis validation), incorporation of spike-in standards for
normalization, high-fidelity PCR library preparation with indexed primers, and
Illumina sequencing. Bioinformatics analysis via QIIME2 involved adapter trimming
(cutadapt), denoising, amplicon sequence variant (ASV)/operational taxonomic unit
(OTU) generation, and taxonomic classification (rdp-classifier). Absolute
abundance was calculated using spike-in-derived equations, followed by cellular
abundance normalization (cell/g or mL). Community diversity was assessed through
Continuous data are presented as the mean
Mice were subjected to 8-week CSD with concurrent A. muciniphila
intervention to investigate subsequent changes in glucose metabolism (Fig. 1A).
Compared with those in the CON group, a marked decrease in body weight (p
Building upon the associations between metabolic health and gut barrier
function, we assessed the key components of the colonic mucosal barrier. Our
analyses revealed that CSD significantly impaired barrier integrity, an effect
that was consistently reversed by A. muciniphila intervention.
Specifically, CSD induced significant downregulation of the key barrier
components MUC2 and ZO-1 at both the mRNA and protein levels (all p
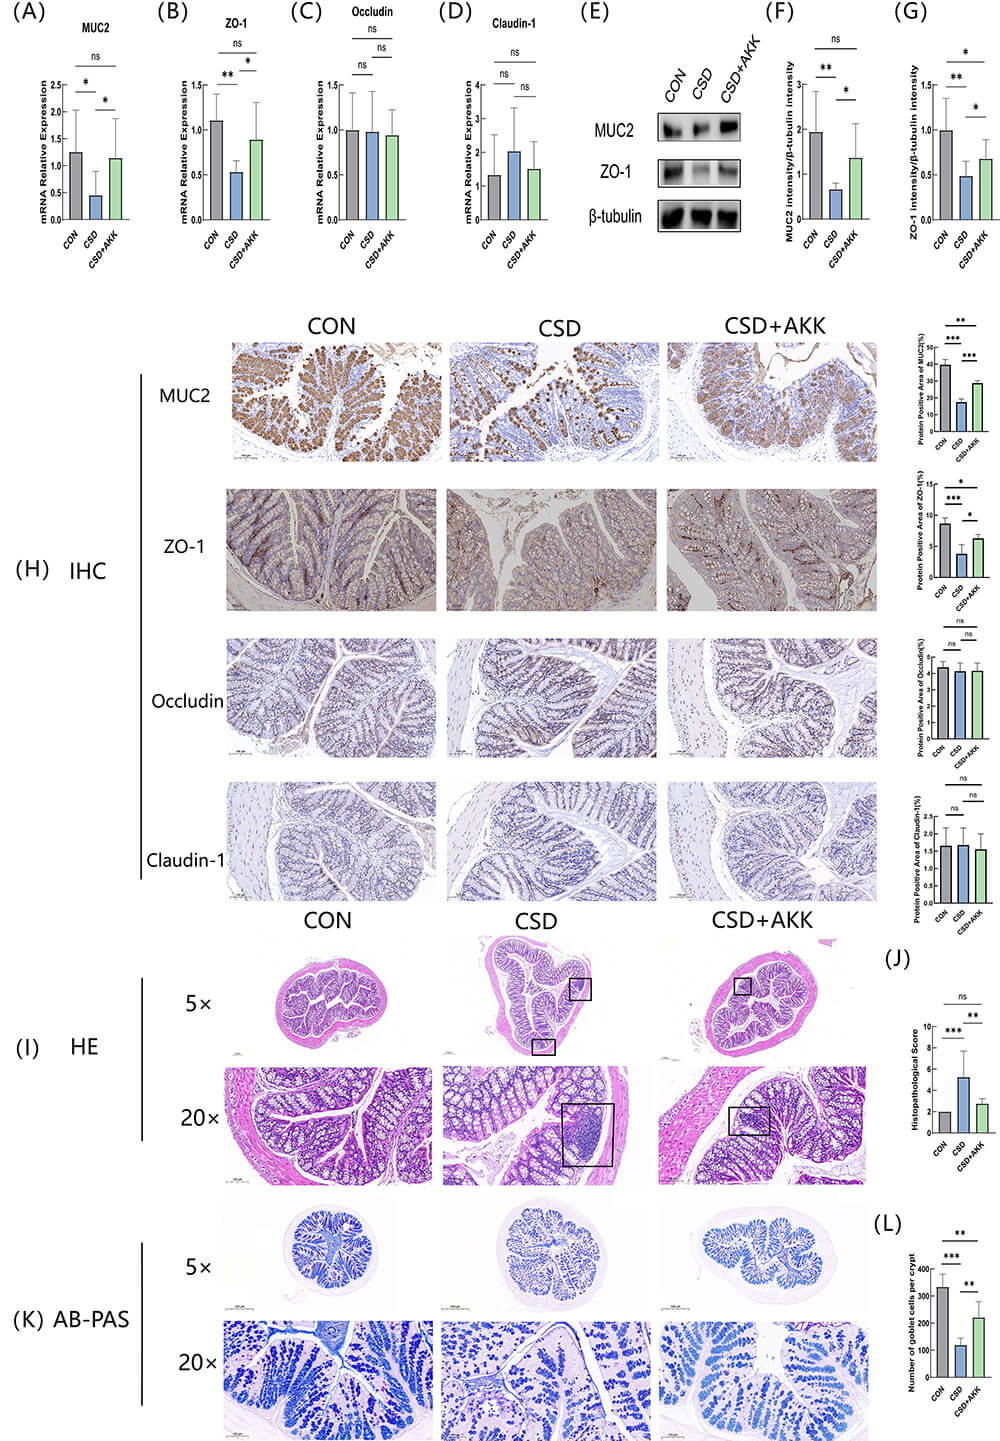 Fig. 2.
A. muciniphila restores colonic barrier integrity and
ameliorates histopathological injury in CSD mice. (A–D) Relative mRNA
expression of (A) MUC2, (B) TJP1 (encoding ZO-1), (C)
Ocln (encoding Occludin), and (D) Cldn1 (encoding Claudin-1) in colonic
tissues. (E) Representative Western blot images of ZO-1 and MUC2 expression.
(F,G) Quantification of (F) MUC2 and (G) ZO-1 protein levels normalized to those
of
This molecular-level disruption and recovery were further corroborated by
tissue-level examinations. Histological assessment revealed significant
CSD-induced inflammatory cell infiltration (assessed by histopathological score,
CON vs. CSD p
A compromised gut barrier often permits the translocation of microbial products,
triggering systemic inflammation. We therefore measured serum markers of
endotoxemia and inflammation. As hypothesized, the CSD group exhibited
significant increases in the levels of circulating LPS (p
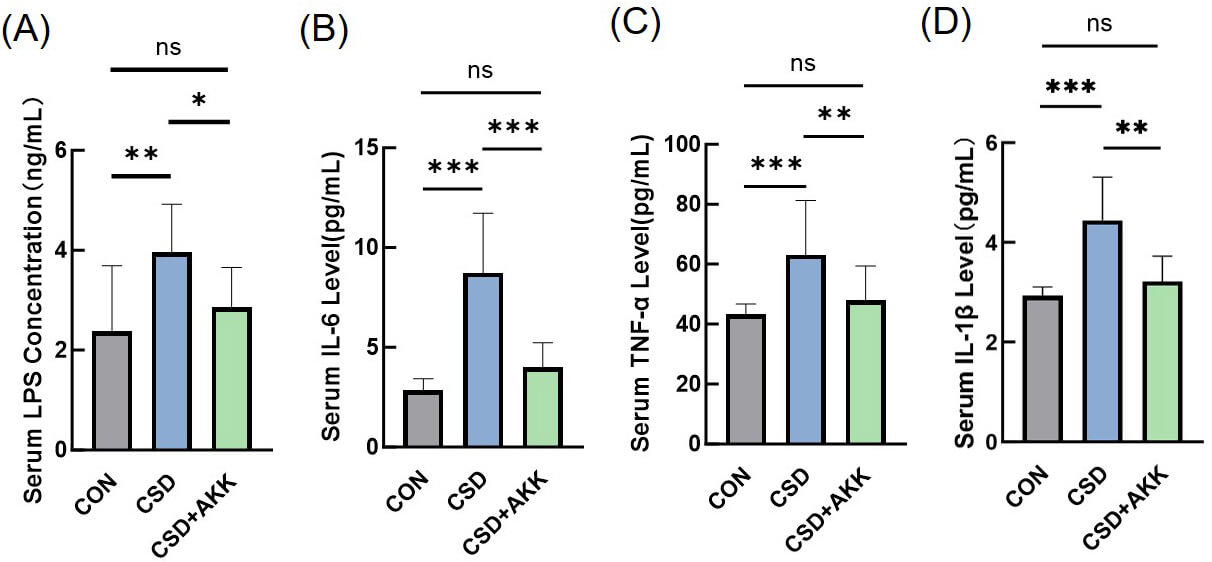 Fig. 3.
A. muciniphila attenuates CSD-induced systemic
inflammation and endotoxemia. Serum concentrations of (A) LPS, (B) IL-6, (C)
TNF-
Finally, we explored whether the protective effects of A. muciniphila were associated with broader changes in the gut microbial ecosystem. While alpha diversity indices remained unchanged across groups (Fig. 4A), PCoA revealed distinct microbial communities among the CON, CSD, and CSD+AKK groups (Fig. 4B,C), indicating a shift in microbial composition.
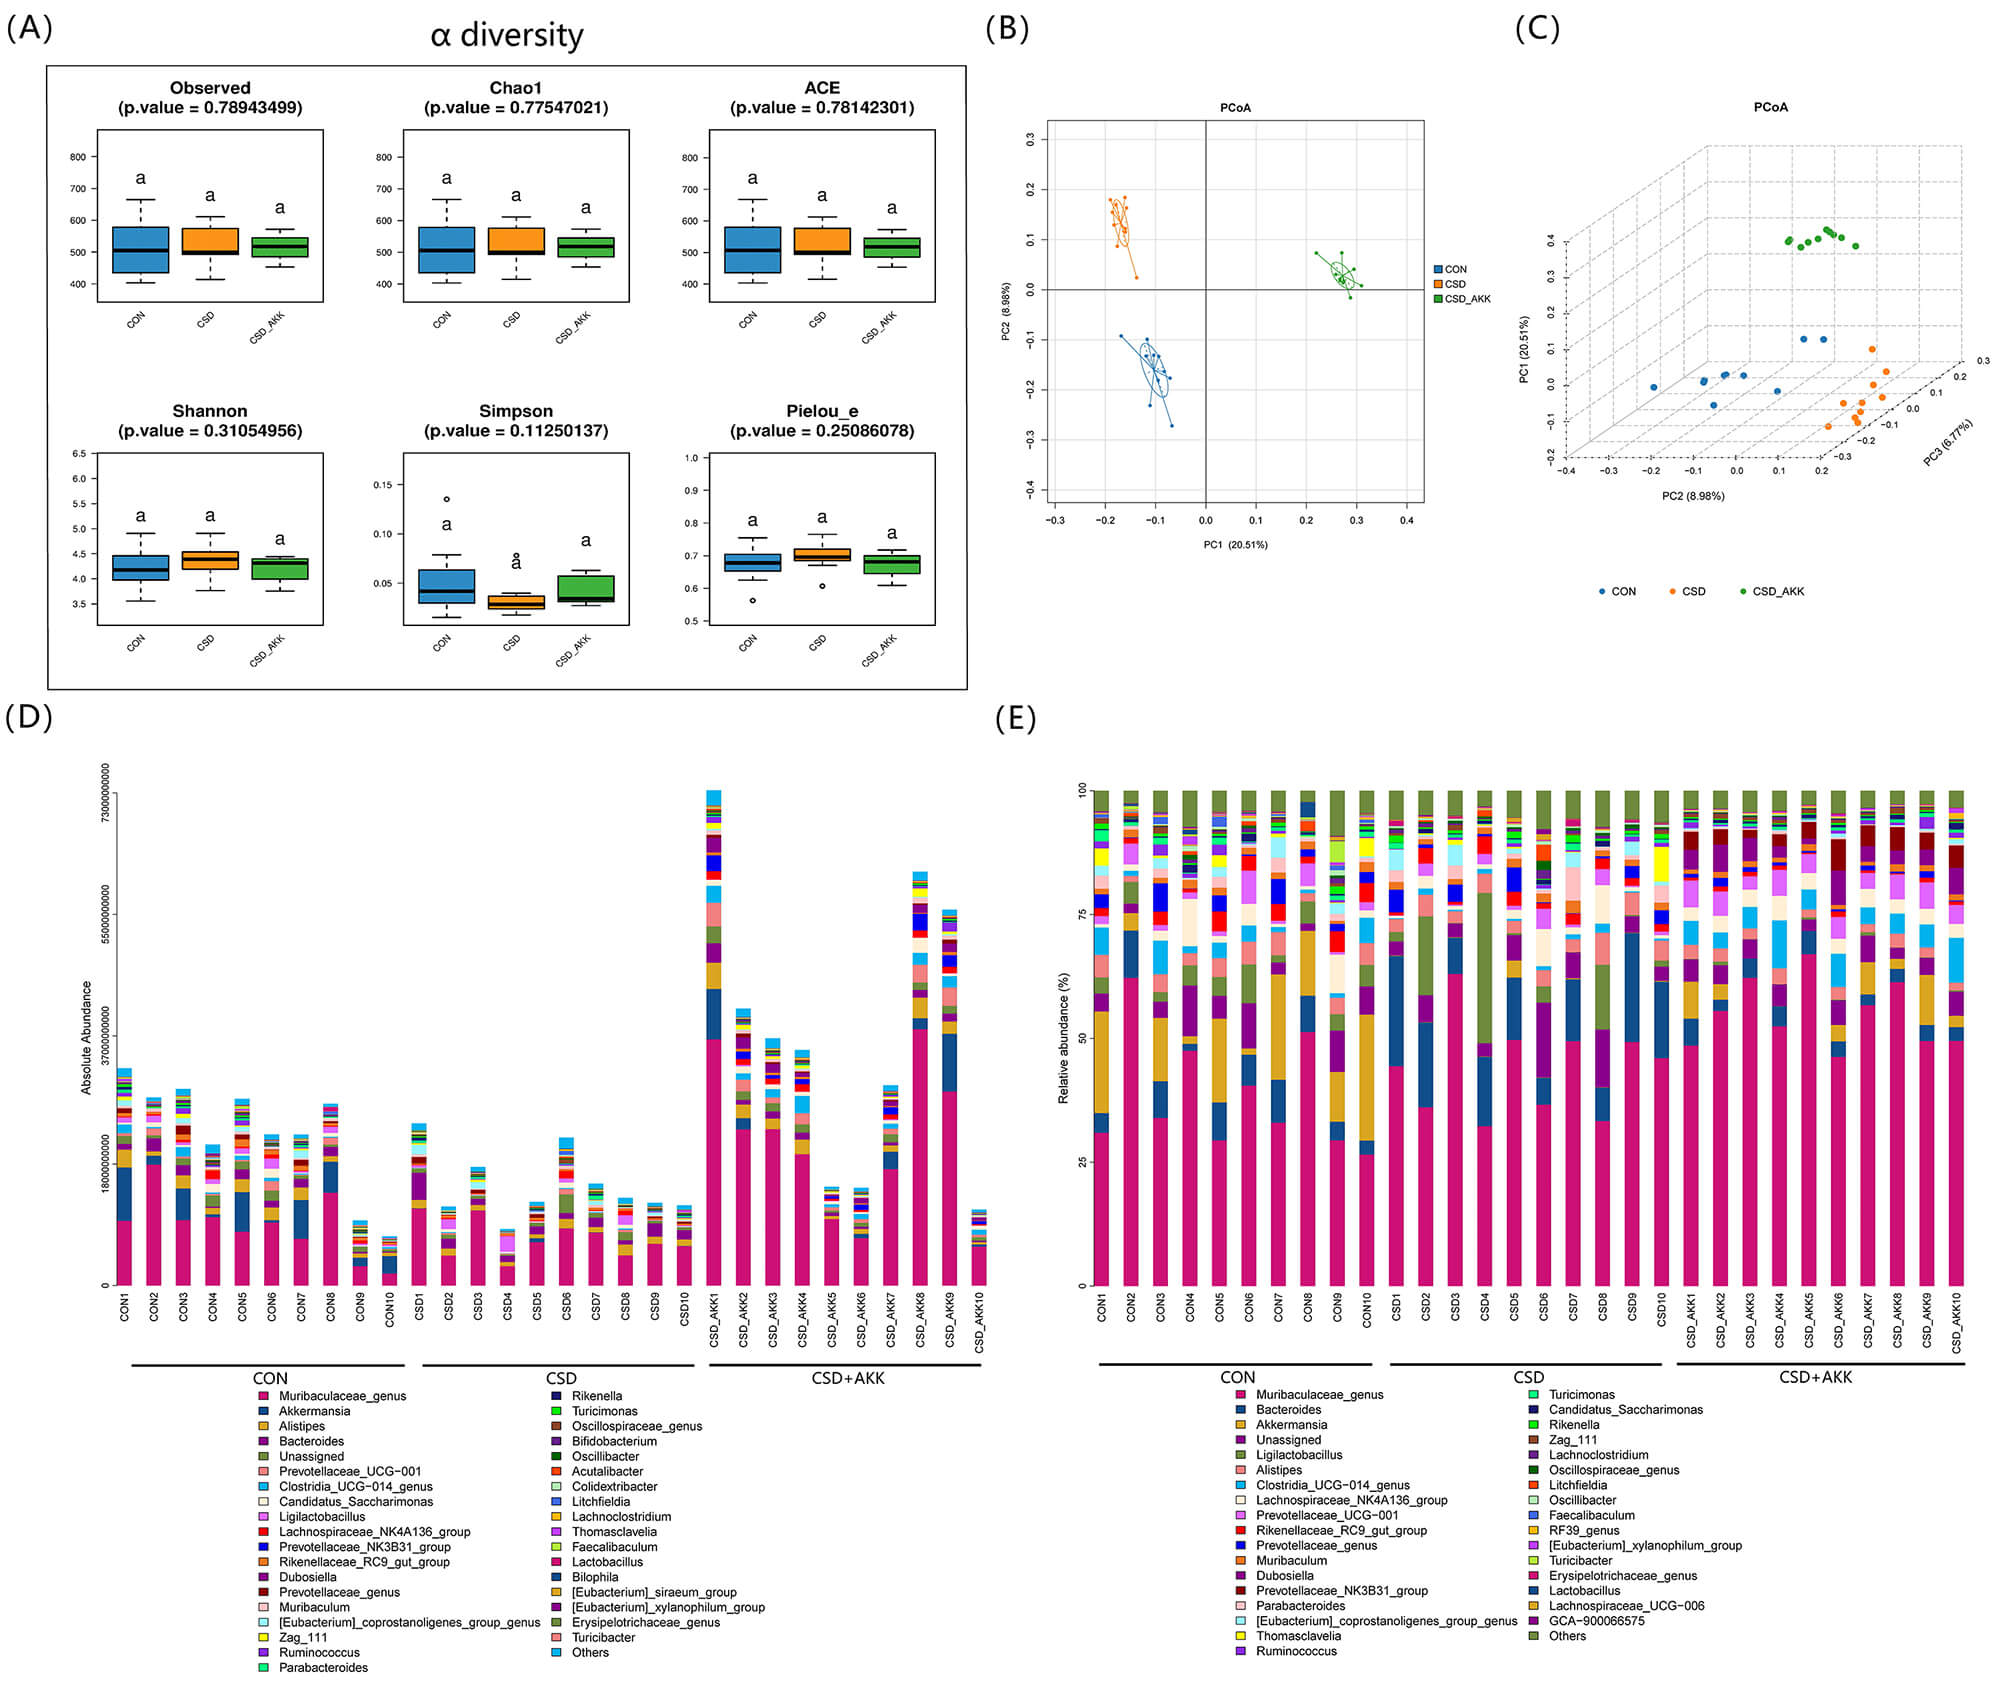 Fig. 4.
Effects of CSD and A. muciniphila intervention on gut
microbiota composition. (A)
Absolute and relative abundance analyses revealed specific taxonomic differences (Fig. 4D,E). The CSD+AKK group was characterized by enrichments of Dubosiella and Tyzzeralla at the genus level and of Adlercerutzia equolifaciens and Bacteroides vulgatus at the species level (Fig. 5). Notably, the absolute abundance of A. muciniphila itself was greater in the CSD+AKK group than in the CSD group, confirming successful colonization. Furthermore, the abundance of Lactococcus garvieae was significantly decreased after A. muciniphila supplementation (Fig. 6A).
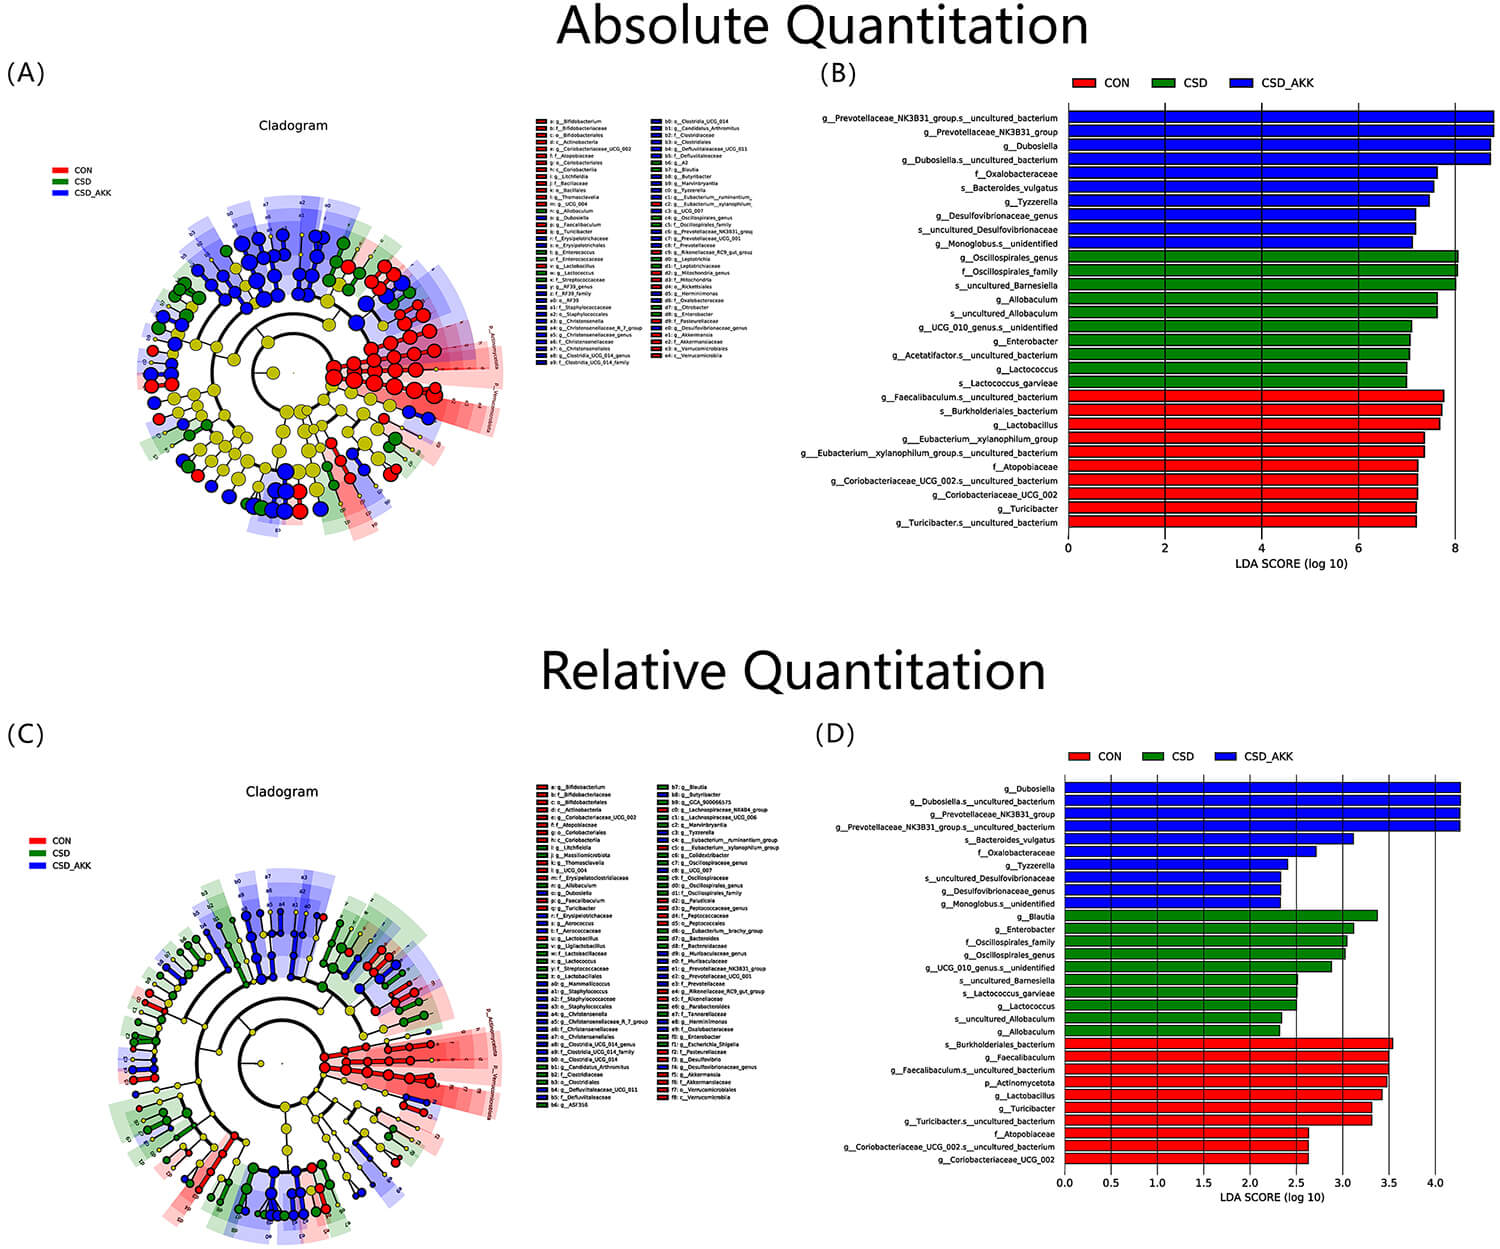 Fig. 5.
Differential microbial taxa identified by LEfSe analysis. (A) Cladogram from LEfSe based on absolute abundance data. (B) Histogram of LDA scores from absolute abundance data. (C) Cladogram from LEfSe based on relative abundance data. (D) Histogram of the LDA scores from the relative abundance data. Abbreviations: CON, control; CSD, chronic sleep deprivation; CSD+AKK, CSD with A. muciniphila intervention; LDA, linear discriminant analysis; LEfSe, linear discriminant analysis effect size. n = 10 per group.
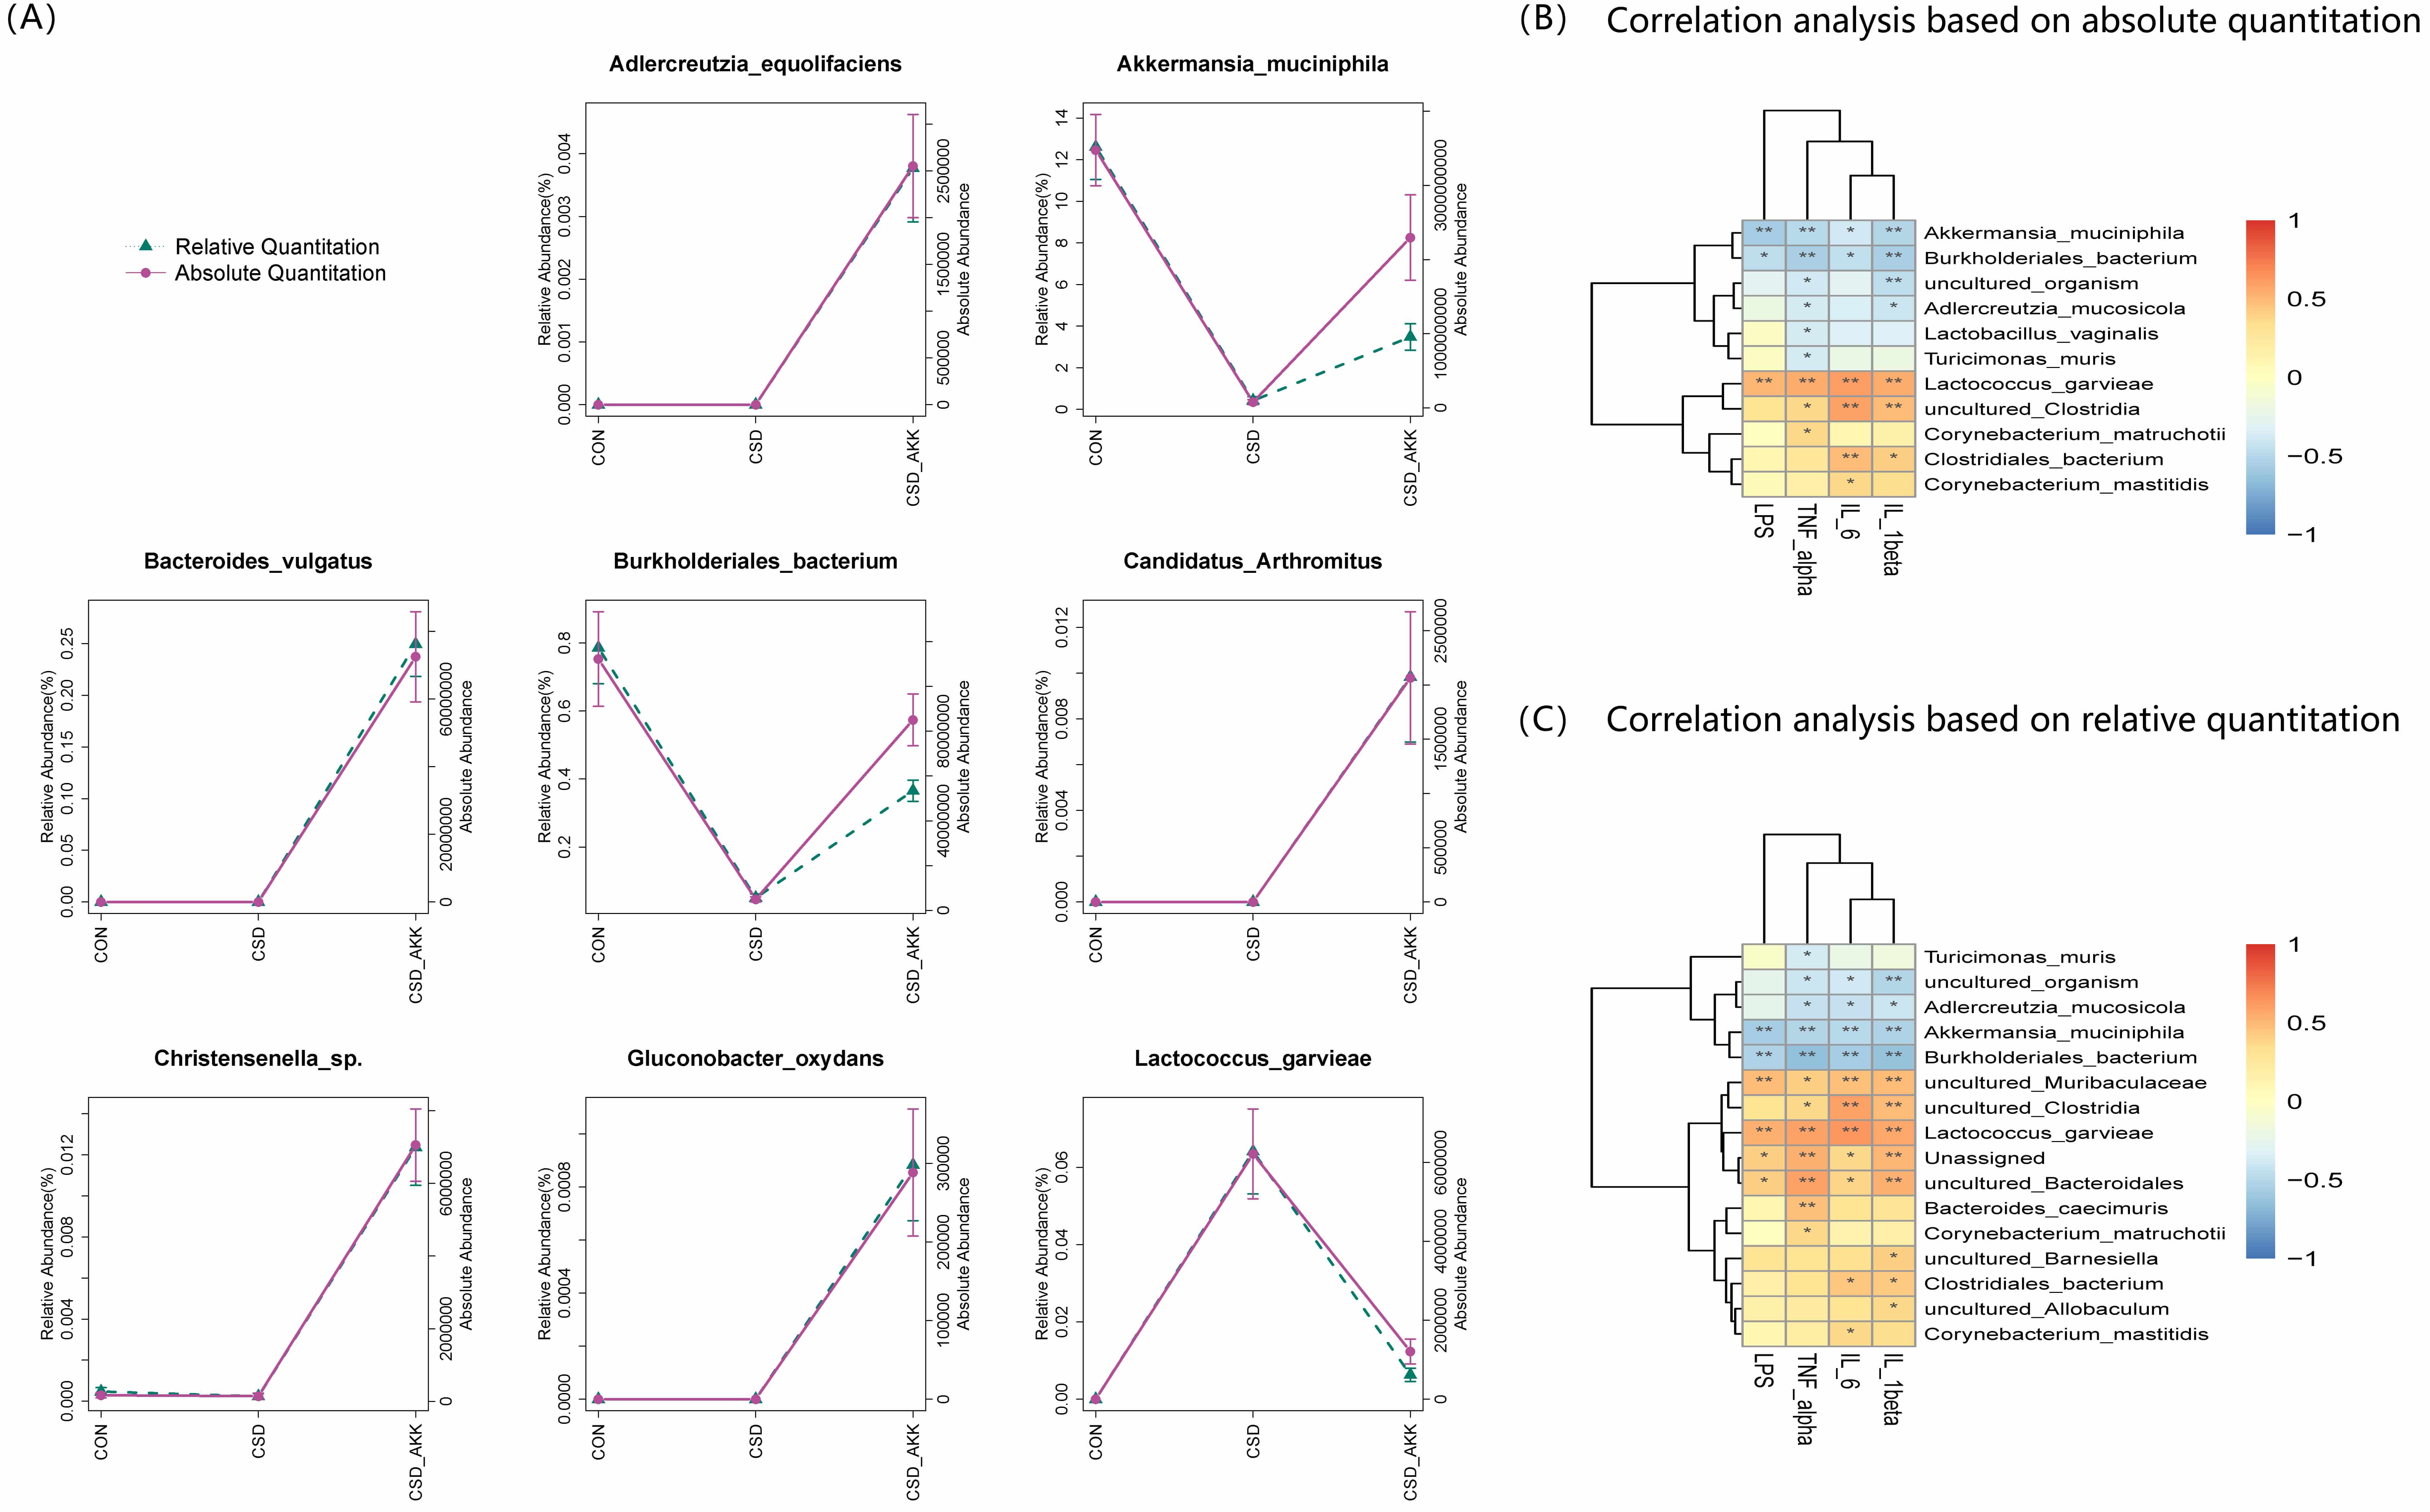 Fig. 6.
Species-level microbial alterations and their correlation with
systemic inflammation. (A) Differential bacterial species at the species level,
showing only taxa whose abundance significantly changed according to both
absolute and relative abundance analyses. (B) Correlation heatmap for the
absolute abundance of differential species and serum levels of LPS and
inflammatory cytokines. (C) Correlation heatmap for the relative abundance of
differential species and serum levels of LPS and inflammatory cytokines. The data
in (A) are presented as the mean
Most importantly, correlation analysis revealed a direct link between these
microbial changes and the phenotype of CSD mice treated with A.
muciniphila. The absolute abundance of A. muciniphila was strongly and
negatively correlated with serum levels of LPS, IL-6, IL-1
CSD has emerged as a pervasive environmental trigger for glucose metabolism disorders [30, 31]. Consequently, identifying strategies to counteract CSD-induced metabolic abnormalities has become a focus of research. Given the established links between the gut microbiota, sleep, and glucose homeostasis, targeting the gut microbial ecosystem represents a promising therapeutic method. In this study, we demonstrate that supplementation with A. muciniphila effectively ameliorates CSD-induced glucose intolerance. The protective effects appear to involve intestinal barrier repair, with a consequent reduction in systemic inflammation.
On the basis of previous studies, A. muciniphila appears to be a bacterial strain particularly susceptible to environmental factors. Its abundance often decreases under various pathological conditions, including diabetes [32, 33], hypertension [34], obesity [35], stress [36], anxiety [37], and sleep deprivation [24]. Consistent with prior findings [24, 25, 38, 39], our data confirm that CSD significantly depletes this beneficial symbiont. From the perspective of the local microenvironment for bacterial colonization, intestinal epithelial inflammation and oxidative stress are likely significant factors influencing the abundance of A. muciniphila [12, 24]. With respect to systemic factors, sleep deprivation could disrupt the rhythmic secretion of hypothalamic–pituitary–adrenal (HPA)–axis-related hormones [40, 41] and melatonin [42, 43, 44], which may consequently impact the colonization of A. muciniphila [13, 45]. Furthermore, relevant research has indicated that the abundance of A. muciniphila fluctuates with a certain circadian rhythmic fluctuation in vivo [46]. Sleep deprivation-induced disruption of circadian rhythms [47] and alterations in dietary patterns [46, 48, 49, 50] could be other important factors influencing changes in A. muciniphila abundance.
Furthermore, a compromised intestinal mucosal barrier is likely a key mediator
linking CSD to systemic inflammation activation and glucose intolerance. Multiple
studies have indicated that CSD can lead to intestinal mucosal barrier damage
[13, 51, 52]. Potential mechanisms underlying CSD-induced intestinal mucosal
injury include inappropriate activation of intestinal inflammation [13, 51],
increased oxidative stress [52], and alterations in circadian rhythm regulators
[53]. However, the aforementioned conclusions are primarily based on
observational findings; they have not been mechanistically proven to establish
causality, nor have they been validated in large-scale clinical studies. In a
recent investigation, Zhang et al. [54] demonstrated by using a
hypoxia-inducible factor 1-alpha (HIF-1
A compromised intestinal barrier, a key consequence of CSD, facilitates the
translocation of gut-derived endotoxins such as LPS into circulation [55].
Although we did not directly quantify LPS levels within the colonic tissue, the
coincidence of structural barrier defects (loss of MUC2 and ZO-1) and functional
systemic endotoxemia (elevated serum LPS) strongly supports the “leaky gut”
hypothesis in our model. This interpretation is consistent with the concept of
“metabolic endotoxemia” established by Cani et al. [17], in which
serum LPS is widely accepted as a surrogate marker for intestinal permeability
and bacterial translocation. Consequently, the elevated proinflammatory cytokines
observed in the serum likely originate from this gut-derived LPS triggering
toll-like receptor 4 (TLR4) signaling, leading to the release of proinflammatory
cytokines including TNF-
On the basis of existing research, A. muciniphila may modulate the host inflammatory factors through the following mechanisms: by degrading mucins while stimulating their production, thereby expanding the mucus layer [57]; by secreting extracellular vesicles that activate AMP-activated protein kinase (AMPK) in intestinal epithelial cells to increase tight junction protein expression [22]; and by producing anti-inflammatory metabolites that dampen immune activation [58]. The results presented here demonstrate the efficacy of A. muciniphila in restoring the expression of key barrier proteins, preventing goblet cell depletion in the colons, and mitigating systemic inflammation of CSD mice. Our study thus identifies A. muciniphila not only as a promising probiotic therapeutic but also as a key node in the complex pathophysiology linking sleep, the gut microbiota, and glucose metabolism.
Notably, we administered the intervention to mice via oral gavage of live A. muciniphila. Although this method has been widely used in previous studies and has been confirmed to effectively increase the colonization of A. muciniphila in the gut [58, 59, 60], how the bacteria survive the harsh gastric environment and successfully colonize the intestine remains incompletely understood. We speculate that repeated gavage and the dilution of gastric juice by the gavage vehicle (PBS, pH 7.2–7.4) may partially protect A. muciniphila, allowing a fraction of the bacteria to transit through the highly acidic stomach. On the other hand, it should be noted that the ameliorative effect of A. muciniphila on CSD-induced glucose metabolic abnormalities may not completely depend on successful colonization. A. muciniphila-derived proteins and extracellular vesicles [22, 26] could also play a role in this process, although this study does not confirm whether these A. muciniphila-derived proteins or extracellular vesicles contributed to the observed effects.
As research on the metabolic regulatory mechanisms of A. muciniphila has advanced [61], its potential for clinical application has attracted increasing attention. A randomized controlled trial conducted by Depommier et al. [21] in overweight/obese volunteers demonstrated that A. muciniphila supplementation effectively improved insulin resistance and hyperinsulinemia and reduced total cholesterol and serum LPS levels. Another clinical study in overweight/obese individuals with T2DM revealed that the efficacy of A. muciniphila in reducing body weight and improving glucose metabolism was largely depended on the baseline abundance in the gut, with metabolic benefits observed only in those with low baseline A. muciniphila levels [62]. However, whether A. muciniphila confers metabolic benefits in humans under conditions of sleep disorder remains unclear, as no related clinical studies have been conducted. Some clinical reports suggest that probiotic supplementation may moderately improve sleep disturbances and related complications [63, 64], however, the efficacy and safety of probiotic supplementation require further validation in large-scale trials. This study lays a preliminary groundwork for future research in this area.
This study has several limitations. First, the multiplatform water environment
limits the use of metabolic cage systems for comprehensive energy expenditure
measurements (e.g., VO₂ and VCO₂), thereby restricting our metabolic profiling to
body weight and food intake. Second, although IL-6 is a known mediator of insulin
resistance [65, 66], our study did not investigate its downstream signaling
pathways, such as the upregulation of suppressor of cytokine signaling 3
(SOCS-3), the phosphorylation status of insulin receptor
This study provides a theoretical foundation for development of A. muciniphila-based interventions against CSD-induced metabolic dysregulation. Future investigations should aim to elucidate the precise underlying mechanisms of A. muciniphila, integrating multiomics approaches such as metagenomics, metabolomics (including short-chain fatty acids), and lipidomics to comprehensively explore its interactions with host metabolism. Furthermore, direct assessments of gut barrier function, oxidative stress, and detailed lipid metabolic profiles are warranted to elucidate the proposed pathways. Finally, clinical studies are essential to validate these findings in human populations and to explore the therapeutic potential of A. muciniphila for sleep-related metabolic disorders.
In conclusion, A. muciniphila intervention can effectively improve
glucose intolerance induced by CSD. It can also significantly ameliorate the
increase in serum endotoxin LPS and the increase in serum levels of the
inflammatory factors IL-6, TNF-
CSD, chronic sleep deprivation; CON, control; PBS, phosphate-buffered saline; OGTT, oral glucose tolerance test; HOMA-IR, homeostatic model Assessment of Insulin Resistance; HOMA-IS, homeostasis model assessment of insulin sensitivity; LPS, lipopolysaccharide; IL-6, interleukin 6; IL-1
The data used and analyzed during the current study are available from the corresponding author upon reasonable request.
ZXW was responsible for most of the experiments, study design, data analysis, visualization, and original draft writing. MQD was involved in the study design, analysis of microbiome data, original draft writing and funding acquisition. MLL was involved in the animal experiments, original draft writing and data analysis. YHM and XJ helped with the animal experiments and original draft writing. LXG and QP contributed to the study design, funding acquisition, and manuscript revision, and supervised the project. LXG was the lead contact of the study. All authors contributed to editorial changes in the manuscript. All authors read and approved the final manuscript. All authors have participated sufficiently in the work and agreed to be accountable for all aspects of the work.
The animal protocol is in accordance with the current legislative regulations and is also in accordance with the NIH guidelines for the care and use of laboratory animals and was approved by the Institutional Animal Care and Use Committee of Peking University Health Science Center (animal protocol approval number: DLASBE0510).
We thank Fei Xiao from the National Center of Gerontology (Beijing, China) for providing technical support for this study.
This work was supported by the National High Level Hospital Clinical Research Funding (BJ-2022-145), the National Natural Science Foundation of China (82200928), and the China Endocrinology and Metabolism Young Scientific Talent Research Project (2021-N-03).
The authors declare no conflict of interest.
Supplementary material associated with this article can be found, in the online version, at https://doi.org/10.31083/FBL45680.
(1) Purpose
This protocol outlines the immediate and postprocedural actions required to manage unexpected hypoglycemia (blood glucose
(2) Early Warning Signs of Hypoglycemia
Monitor the mice closely for the following signs, which may precede severe hypoglycemia:
(3) Immediate Emergency Procedure
If a mouse exhibits severe hypoglycemia or any of the above signs, terminate the ITT immediately and take the following steps:
Step 1: Immediate Glucose Administration
Step 2: Supportive Care and Monitoring
Step 3: Confirm Recovery
Step 4: Postrecovery Observation
(4) Preventive Measures for Future ITTs
To prevent recurrence, consider the following adjustments for subsequent experiments:
(5) Documentation
(6) Incidence (Hypoglycemia or Death) Rate: 0% (a total of 30 mice)
(1) Bovine Serum Albumin (BSA) Standard Preparation:
The BSA stock solution was serially diluted using a dissolution medium identical in composition to that of the test samples (lysis buffer was used in this experiment) according to a predefined concentration gradient scheme, with concentrations set at 1, 0.5, 0.25, 0.125, 0.0625, 0.03125, and 0 mg/mL (marked as concentrations A–G).
(2) BCA Working Solution Preparation:
The required volume of color-developing reagent was calculated using the following formula: total reagent volume = (number of standards + number of test samples + 4)
(3) Quantitative Detection:
A total of 25 µL of each gradient BSA standard (concentrations A–G) and 2–10
| Reagents | Manufacturer | Catalog number | Dilution info |
| HRP-conjugated goat anti-rabbit/mouse IgG (H+L) | Abcam, Cambridge, UK | ab205718*/ab205719* | 1:50,000 (WB/IHC) |
| Zonula Occludens-1 (ZO-1) monoclonal antibody | Abcam, Cambridge, UK | ab276131* | IHC: 1:500 |
| WB: 1:1000 | |||
| Occludin monoclonal antibody | Proteintech Group, Inc/Immunoway Biotechnology Co., Ltd. Suzhou, China | 66378-1-Ig (IHC)/YM8316 (WB) | IHC: 1:500 |
| WB: 1:5000 | |||
| Claudin 1 monoclonal antibody | Proteintech Group, Inc/Immunoway Biotechnology Co., Ltd. Suzhou, China | 28674-1-AP (IHC)/YM8199 (WB) | IHC: 1:2000 |
| WB: 1:1000 | |||
| Mucin2 (MUC2) monoclonal antibody | Abcam, Cambridge, UK | ab272692* | IHC: 1:2000 |
| WB: 1:1000 | |||
| LPS ELISA kit | Biorigin (Beijing, China) Inc. | BN53434 | |
| TNF- | CLOUD-CLONE CORP., Katy, TX, USA | MEA133Mu/MEA563Mu/ MEA079Gu | |
| Insulin ELISA kit | CLOUD-CLONE CORP., Katy, TX, USA | CEA448Mu | |
| RNAiso Plus | Takara Bio Inc., Kusatsu, Shiga, Japan | 9109 | |
| TB Green Premix Ex Taq II (Tli RNaseH Plus) (2X Conc.) | Takara Bio Inc., Kusatsu, Shiga, Japan | RR820A | |
| 5X PrimeScript RT Master Mix | Takara Bio Inc., Kusatsu, Shiga, Japan | RR036A |
*An asterisk (*) indicates that the antibody was used for both IHC and WB.
After orbital blood was collected from the mice, the samples were centrifuged at 3500 rpm for 20 minutes at 4 °C. The supernatant was then collected, aliquoted, and stored. All serum samples were analyzed without dilution.
(1) Serum TNF-
The lyophilized standard was reconstituted with 0.5 mL of standard diluent and incubated at room temperature for 10 minutes to generate a 1000 pg/mL stock solution. A series of twofold serial dilutions were then prepared in EP tubes to obtain standard concentrations of 1000, 500, 250, 125, 62.5, 31.25, and 15.6 pg/mL, with the diluent serving as the blank control (0 pg/mL). Next, 100 µL of each standard, blank, or test sample was added to the microplate wells. The plate was covered and incubated at 37 °C for 60 minutes. After incubation, the liquid was discarded, and the plate was gently tapped dry. No washing was performed at this stage. Detection Solution A (biotinylated anti-TNF-
(2) Serum IL-6 Detection
The lyophilized standard was reconstituted in 1 mL of standard diluent and incubated for 10 minutes at room temperature to yield a 1000 pg/mL stock solution. A set of seven standard concentrations (500, 250, 125, 62.5, 31.25, 15.6, and 7.8 pg/mL) was prepared via serial dilution in EP tubes, using the diluent as a blank control (0 pg/mL). A volume of 100 µL of each diluted standard or test sample was added to the microplate wells. The plate was covered and incubated at 37 °C for 1 hour. After incubation, the liquid was discarded and the plate was gently tapped dry. No washing step was performed at this stage. Next, 100 µL of freshly prepared Working Solution A (biotinylated anti-IL-6 antibody) was added to each well. The plate was covered and incubated at 37 °C for 1 hour. Following incubation, the solution was aspirated, and each well was washed with 350 µL of Wash Buffer, which was left to soak for 2 minutes before removal. This washing procedure was repeated three times. Afterward, 100 µL of freshly prepared Working Solution B (HRP-conjugated avidin) was added to each well. The plate was covered and incubated at 37 °C for 30 minutes. After the solution was discarded, the plate was washed five times as described above. For color development, 90 µL of TMB Substrate Solution was added to each well, followed by incubation in the dark at 37 °C for 10–20 minutes. The reaction was stopped by adding 50 µL of Stop Solution per well. The optical density at 450 nm was measured immediately, and the IL-6 concentrations in the samples were calculated on the basis of the standard curve derived from the OD values of the standards.
(3) Serum LPS Detection
First, 50 µL of test samples, serially diluted standards, and blank controls (standard diluents) were added to the designated microplate wells. This was followed by the addition of 50 µL of HRP-conjugated antigen solution to each well. After sealing, the plate was incubated at 37 °C for 60 minutes. Following incubation, the liquid was discarded, and each well was washed with 300 µL of Wash Buffer, which was left to stand for 60 seconds before complete aspiration. The plate was then thoroughly tapped dry. This washing procedure was repeated for a total of five cycles. For color development, 90 µL of TMB Substrate Solution was added to each well, and the plate was incubated at 37 °C in the dark for 15 minutes. The reaction was terminated by the addition of 50 µL of Stop Solution per well, and the optical density at 450 nm was measured immediately using a microplate reader.
(4) Serum IL-1
The lyophilized standard was reconstituted with 1 mL of standard diluent and incubated at room temperature for 10 minutes to generate a 1000 pg/mL stock solution. A series of twofold serial dilutions were prepared in six EP tubes to obtain standard concentrations of 1000, 500, 250, 125, 62.5, 31.25, and 15.6 pg/mL, with the standard diluent serving as the blank control (0 pg/mL). Afterward, 25 µL of the standards, test samples, or diluent (blank) was added to the microplate wells. The plate was covered and incubated at 37 °C for 1 hour. After incubation, the liquid was discarded, and the plate was gently tapped dry without washing. Next, 25 µL of freshly prepared Working Solution A (biotinylated anti-IL-1
(5) Insulin Measurement
The lyophilized standard was reconstituted with 0.5 mL of diluent and incubated at room temperature for 10 minutes to obtain an initial concentration of 500 pg/mL; a standard curve was then prepared via threefold serial dilutions to generate concentrations of 500, 166.67, 55.56, 18.52, and 6.17 pg/mL, using the diluent as the blank control (0 pg/mL). Subsequently, 50 µL of each standard or test sample was added to the microplate wells, followed by the addition of 50 µL of Working Solution A (biotinylated antigen solution), after which the plate was covered and incubated at 37 °C in the dark for 1 hour. Following incubation, the liquid was aspirated, and the wells were washed three times with 350 µL of Wash Buffer per well, which was allowed to stand for 1–2 minutes. After the wells were washed, 100 µL of working solution B (HRP-conjugated avidin) was added to each well and the plate was incubated at 37 °C for 30 minutes. The plate was then washed three more times, and 90 µL of TMB Substrate Solution was dispensed per well for color development in the dark at 37 °C for 10–20 minutes. The reaction was terminated by the addition of 50 µL of Stop Solution per well, and the optical density at 450 nm was measured immediately using a microplate reader. The insulin concentrations of the samples were ultimately determined on the basis of the standard curve fitted from the standard concentrations and their corresponding OD values.
References
Publisher’s Note: IMR Press stays neutral with regard to jurisdictional claims in published maps and institutional affiliations.