


 , Chutong Zhao 1, Jiyun Zhao 2, Yuhan Ma 2, Shunjin Zhang 3, Yujie Liu 1, Yuan Wang 1, Sijia Liu 1,*
 , Yunyan Zhang 1,*
1 Department of Gynecological Radiotherapy, Harbin Medical University Cancer Hospital, 150081 Harbin, Heilongjiang, China
2 School of Life Science and Technology, Computational Biology Research Center, Harbin Institute of Technology, 150001 Harbin, Heilongjiang, China
3 Obstetrics and Gynecology Ward II, The Second Affiliated Hospital of Harbin Medical University, 150086 Harbin, Heilongjiang, China
Abstract
Cervical cancer remains a major cause of cancer-related death among women worldwide. Despite advances in treatment, prognosis remains poor for many patients due to tumor heterogeneity. DNA methylation, an epigenetic modification, is known to influence tumor development, but its role in defining molecular subtypes and prognostic stratification in cervical cancer remains inadequately understood.
We analyzed DNA methylation profiles from 287 cervical cancer samples obtained from the UCSC Xena database. Univariate and multivariate Cox regression analyses were applied to identify prognostic CpG sites, as these models allow evaluation of individual and combined effects of methylation sites on patient survival. Consensus clustering was performed to define robust molecular subtypes based on methylation patterns, providing insights into tumor heterogeneity. Differentially methylated regions were identified using the Quantitative Differentially Methylated Regions (QDMR) software, an entropy-based tool validated for detecting subtype-specific methylation markers. A Bayesian classifier was constructed and validated in training and test cohorts to evaluate the predictive accuracy of these markers for subtype classification. Additionally, immune cell infiltration was estimated using computational algorithms to assess tumor microenvironment differences, and chemosensitivity was predicted to explore potential clinical implications of the methylation subtypes.
Four distinct methylation-based subtypes differed in methylation patterns, histological types, clinical stages, and metastatic status. A total of 501 subtype-specific methylation sites were identified. The Bayesian classifier demonstrated strong predictive performance, with an area under the receiver operating characteristic (ROC) curve (AUC) of 0.824 based on 10-fold cross-validation, indicating high classification accuracy and robustness. The immune microenvironment composition varied markedly among subtypes. Notably, Cluster 1 had elevated infiltration of central memory CD8+ and effector memory CD4+ T cells, whereas Cluster 4 exhibited reduced immune activation and the lowest immune checkpoint expression. These findings indicate subtype-specific differences in potential responsiveness to immunotherapy.
These DNA methylation-driven subtypes highlight the heterogeneity of cervical cancer and offer new insights for personalized therapy.
Keywords
- cervical cancer
- DNA methylation
- prognosis
- cluster analysis
Among women, cervical cancer is a frequently diagnosed malignant tumor with worldwide prevalence and impact [1, 2]. As human papillomavirus (HPV) vaccination becomes more prevalent, a downward trend in cervical cancer incidence has been observed globally [3]. However, cervical cancer still represents a large proportion of cancer-related morbidity and mortality in women [4]. Due to the clinical and molecular complexity, traditional treatment approaches have struggled to meet the need for personalized diagnosis and therapy. In-depth investigation of tumor heterogeneity, development of precision medicine, and application of molecular subtyping aim to optimize diagnosis, guide treatment decisions, and improve patient prognosis.
Currently, cervical cancer classification primarily relies on histological type and the clinical staging system established by the International Federation of Gynecology and Obstetrics (FIGO). Histological typing categorizes cervical cancer into squamous cell carcinoma, adenocarcinoma, and other types based on the morphological characteristics of tumor cells [5, 6]. FIGO staging assesses disease progression by considering tumor size, extent of local invasion, and distant metastasis. These classical methods provide a framework for patient stratification, disease diagnosis, and treatment planning in clinical practice, but they have limitations. They do not fully capture tumor biology or explain variations in treatment response among patients at the same stage. Therefore, there is an urgent need to develop a molecular-level staging system that can more accurately guide clinical treatment and predict patient prognosis.
DNA methylation, an epigenetic modification predominantly occurring at CpG sites, regulates gene expression, embryonic development, and cellular differentiation within the genome [7, 8]. In cervical cancer, aberrant DNA methylation is closely associated with tumor cell growth, invasion, and metastasis through the silencing of tumor suppressor genes or activation of oncogenes [9, 10]. In recent years, numerous studies have shown that specific differentially methylated sites may serve as biomarkers for the early detection and prognostic assessment of cervical cancer [11]. For example, promoter hypermethylation of the P16 gene has often been observed in the early stages of cervical cancer and shows potential as a biomarker for early screening [12]. In addition, promoter methylation of the RASSF1A gene is common in cervical cancer, and its hypermethylation is regarded as one of the molecular events in tumor initiation and is associated with cervical carcinogenesis [13]. However, despite these advances, comprehensive identification of DNA methylation-based molecular subgroups is still needed to improve prognosis prediction and guide personalized treatment strategies in cervical cancer.
In this study, we aimed to identify DNA methylation-based prognostic subgroups of cervical cancer and to explore their potential clinical significance. Using DNA methylation profiles from the UCSC Xena database, we systematically screened prognostic methylation sites and applied consensus clustering to classify patients into distinct molecular subtypes. We then developed a predictive model to validate the robustness of the classification and comprehensively assessed the subtypes in relation to immune characteristics, drug sensitivity, and pathological features. Our findings offer new insights into the epigenetic heterogeneity of cervical cancer and its potential implications for precision therapy.
Methylation data from 312 cervical cancer samples, generated using the Illumina
Infinium HumanMethylation450 BeadChip array, were obtained from the UCSC Xena
database (https://xenabrowser.net/datapages/). The
RNA-Seq transcriptome datasets from 309 cervical cancer samples were also obtained from the UCSC Xena database and preprocessed. Finally, 287 samples with complete gene expression profiles and clinical data were selected for further analysis. This cohort was randomly divided into training and testing sets at a 60:40 ratio.
For external validation, the GSE44001 dataset was obtained from the Gene Expression Omnibus (GEO) database (https://www.ncbi.nlm.nih.gov/geo/). Preprocessing included KNN imputation for missing values, removal of low-expression and low-variance genes, log2 transformation of expression values, and Z-score standardization.
In this study, Cox proportional hazards regression models were used to identify classification characteristics associated with cervical cancer outcomes. Initially, univariate Cox models were applied, incorporating the methylation level of each CpG site together with age, clinical stage, ethnicity, Tumor-Node-Metastasis (TNM) stage, and histological type, to identify risk factors for survival outcomes. CpG sites with statistical significance in the univariate Cox analysis were subsequently entered into a multivariate Cox model, with clinical stage and pathologic M and N stages as covariates to control for potential confounding. All these covariates were statistically significant in the univariate model. Finally, CpGs that remained statistically significant in the multivariate model were retained as subsequent categorical features.
Model construction was performed using the ‘coxph’ function from the survival package (version 3.8.3) in R (version 4.4.2; R Foundation for Statistical Computing, Vienna, Austria). For each CpG site, the multivariate Cox model was defined as follows:
h(t,x)i = h0(t)exp(
Here, methy_i is the methylation level at the CpG site in the sample; M, N, and
stage denote the M stage, N stage, and clinical stage, respectively. The terms
Methylation-based subtypes of cervical cancer were identified using consensus clustering analysis with the ConsensusClusterPlus package (version 1.70.0) in R. The algorithm generated sub-datasets from the original methylation data matrix through random sampling. Each random sample contained 80% of the cases and all feature variables. Each sub-dataset was clustered using the Partitioning Around Medoids algorithm, with the number of clusters (k) set from 2 to 10. The procedure was repeated 100 times. Pairwise consistency between samples was calculated as the proportion of times two samples clustered together across all iterations. These values were compiled into a consensus matrix to quantify clustering stability.
For each k, a delta area plot was generated to assess the incremental increase in the area under the cumulative distribution function (CDF) curve between adjacent k values. When the delta value declined and reached a stable plateau, increasing the number of clusters was considered to have minimal impact on clustering performance.
The consensus matrix heatmap displayed clustering consistency between samples through color intensity, with higher intensity indicating greater stability. For interpretation, DNA methylation clusters were annotated with histological type, TNM stage, clinical stage, race, and age. Heatmaps were created using the pheatmap package (version 1.0.13) in R. The optimal number of cervical cancer molecular subtypes was determined by integrating information from the delta area plot and consensus matrix heatmap. This approach ensured robust and reproducible clustering while minimizing the impact of random variation from single clustering runs.
Survival analysis was performed using the survival package in R. Overall
survival among different clusters was visualized with Kaplan-Meier curves. The
log-rank test was applied to assess the statistical significance of survival
differences between clusters. A p-value
In this study, we employed the Quantitative Differentially Methylated Regions (QDMR) tool (version v1.0; Group of Computational Epigenetic Research, College of Bioinformatics Science and Technology, Harbin Medical University, Harbin, China) identify distinct DNA methylation sites in cervical cancer subgroups. The QDMR quantitative approach was applied to genome-wide methylation profiles to detect differentially methylated regions (DMRs) by adjusting Shannon entropy. This method enabled the identification of specific hypermethylated or hypomethylated sites in cervical cancer clusters [14].
To explore the biological roles of the genes corresponding to the differential CpGs in different methylation clusters, we first mapped the CpGs to their associated genes using the R annotated package “IlluminaHumanMethylationEPICanno.ilm10b4.hg19” (version 0.6.0). When a site corresponded to multiple genes, we retained only the first gene name. After that, the corresponding sets of unique genes in each cluster were extracted separately. Subsequently, we performed functional enrichment analyses, including Gene Ontology (GO) and Kyoto Encyclopedia of Genes and Genomes (KEGG), on the genes in each cluster using the “clusterProfiler” package (version 4.14.6). Enrichment results was considered significant when the Benjamini-Hochberg adjusted q-value was below 0.05. For visualization, we retained only pathways with more than one enriched gene and presented the results as bar plots using the ggplot2 package (version 3.5.2).
A Bayesian model was constructed using the training set data and applied to classify samples in the test dataset. External validation was conducted with the GSE44001 dataset from GEO database [15]. The clustering approach from the training phase was applied to assign category labels to all samples in the external validation cohort. The pROC package (version 1.19.0.1) in R was used to perform the receiver operating characteristic (ROC) curve analysis.
To examine variations in the immune microenvironment among methylation-based clusters, multiple algorithms were applied for a comprehensive assessment. First, immune cell infiltration levels were evaluated using the CIBERSORT method, which generated a matrix of 22 immune cell subsets, including B cells, T cells, and macrophages. The relative proportions of these 22 immune cell types were estimated across different clusters. Second, the single-sample Gene Set Enrichment Analysis (ssGSEA) algorithm was applied to quantify immune enrichment scores for 28 immune cell types, including subpopulations with immunosuppressive or cytotoxic functions. Third, the ESTIMATE package (version 1.0.13) in R was used to calculate Immune Score, Stromal Score, and Tumor Purity across clusters. Finally, differences in the expression of immune checkpoint genes (Cytotoxic T-Lymphocyte-Associated Protein 4, CTLA-4; Programmed Death 1, PD-1; Programmed Death Ligand 1, PD-L1; Programmed Death Ligand 2, PD-L2) among the methylation clusters were analyzed. To compare variations in immune function indices across the four groups, the Kruskal-Wallis test was performed for all statistical analyses.
A total of 2013 immune-related genes were obtained from the publicly available ImmPort portal (https://www.immport.org/home). Afterwards, the intersections were taken with genes corresponding to differentially methylated CpGs, and 23 differentially methylated immune genes were finally screened out. The average methylation level of each gene was calculated for each sample. The “ggplot2” package in R was then used to generate violin plots for comparing methylation differences among gene clusters.
Three commonly used chemotherapeutic agents—Cisplatin, Paclitaxel, and Docetaxel—were selected for drug sensitivity analysis. The oncoPredict package (version 1.2) in R was used to estimate the half-maximal inhibitory concentration (IC50) for each agent across patient groups [16]. The IC50 represents the concentration at which a drug achieves 50% of its maximal inhibitory effect and serve as a standard measure of drug efficacy. Independent t-tests were then performed to assess differences in drug sensitivity among the molecular clusters.
We downloaded 142 cervical cancer pathology images from The Cancer Genome Atlas (TCGA) through the GDC data portal (https://portal.gdc.cancer.gov/) [17]. The images were preprocessed using Python (version 3.9.7; Python Software Foundation, Wilmington, DE, USA) in PyCharm Professional Edition (version 2024.3.3; JetBrains s.r.o., Prague, Czech Republic), and converted to PNG format. Pathology feature extraction was then performed using CellProfiler (version 4.2.8; Broad Institute of MIT and Harvard, Cambridge, MA, USA) [18]. Automatic image segmentation was carried out with the “IdentifyPrimaryObjects” and “IdentifySecondaryObjects” modules to delineate nuclei and cytoplasmic regions. Six analytical modules—IdentifyPrimaryObjects, IdentifySecondaryObjects, MeasureObjectSizeShape, MeasureTexture, MeasureObjectIntensity and MeasureObjectIntensityDistribution—were applied to extract quantitative cellular features, including size, shape, texture, and intensity. The software generated corresponding measurements for each identified cell. In addition, we compared the distribution of tumor-infiltrating lymphocytes (TILs) among the four methylation clusters [19]. TILs were classified into four types based on morphological characteristics: “Brisk Band-like”, “Brisk Diffuse”, “Non-Brisk Focal”, and “Non-Brisk Multifocal”.
Molecular subtypes related to prognosis in cervical cancer were identified through unsupervised clustering of DNA methylation data from the UCSC Xena database. Prior to clustering, preprocessing steps included removing missing values, imputing data with the KNN method, excluding CpG sites on sex chromosomes or overlapping with single nucleotide polymorphisms (SNPs), performing quality control, normalizing data, and extracting CpG sites located in promoter regions. The dataset was then randomly divided into training and test cohorts in a 60:40 ratio.
Univariate Cox proportional hazards regression was performed for each CpG site
in the training cohort of 168 tumor samples, incorporating both CpG methylation
levels and relevant clinical variables. In total, 13,945 CpG loci showed
statistically significant associations (p
Next, consensus clustering was performed using the
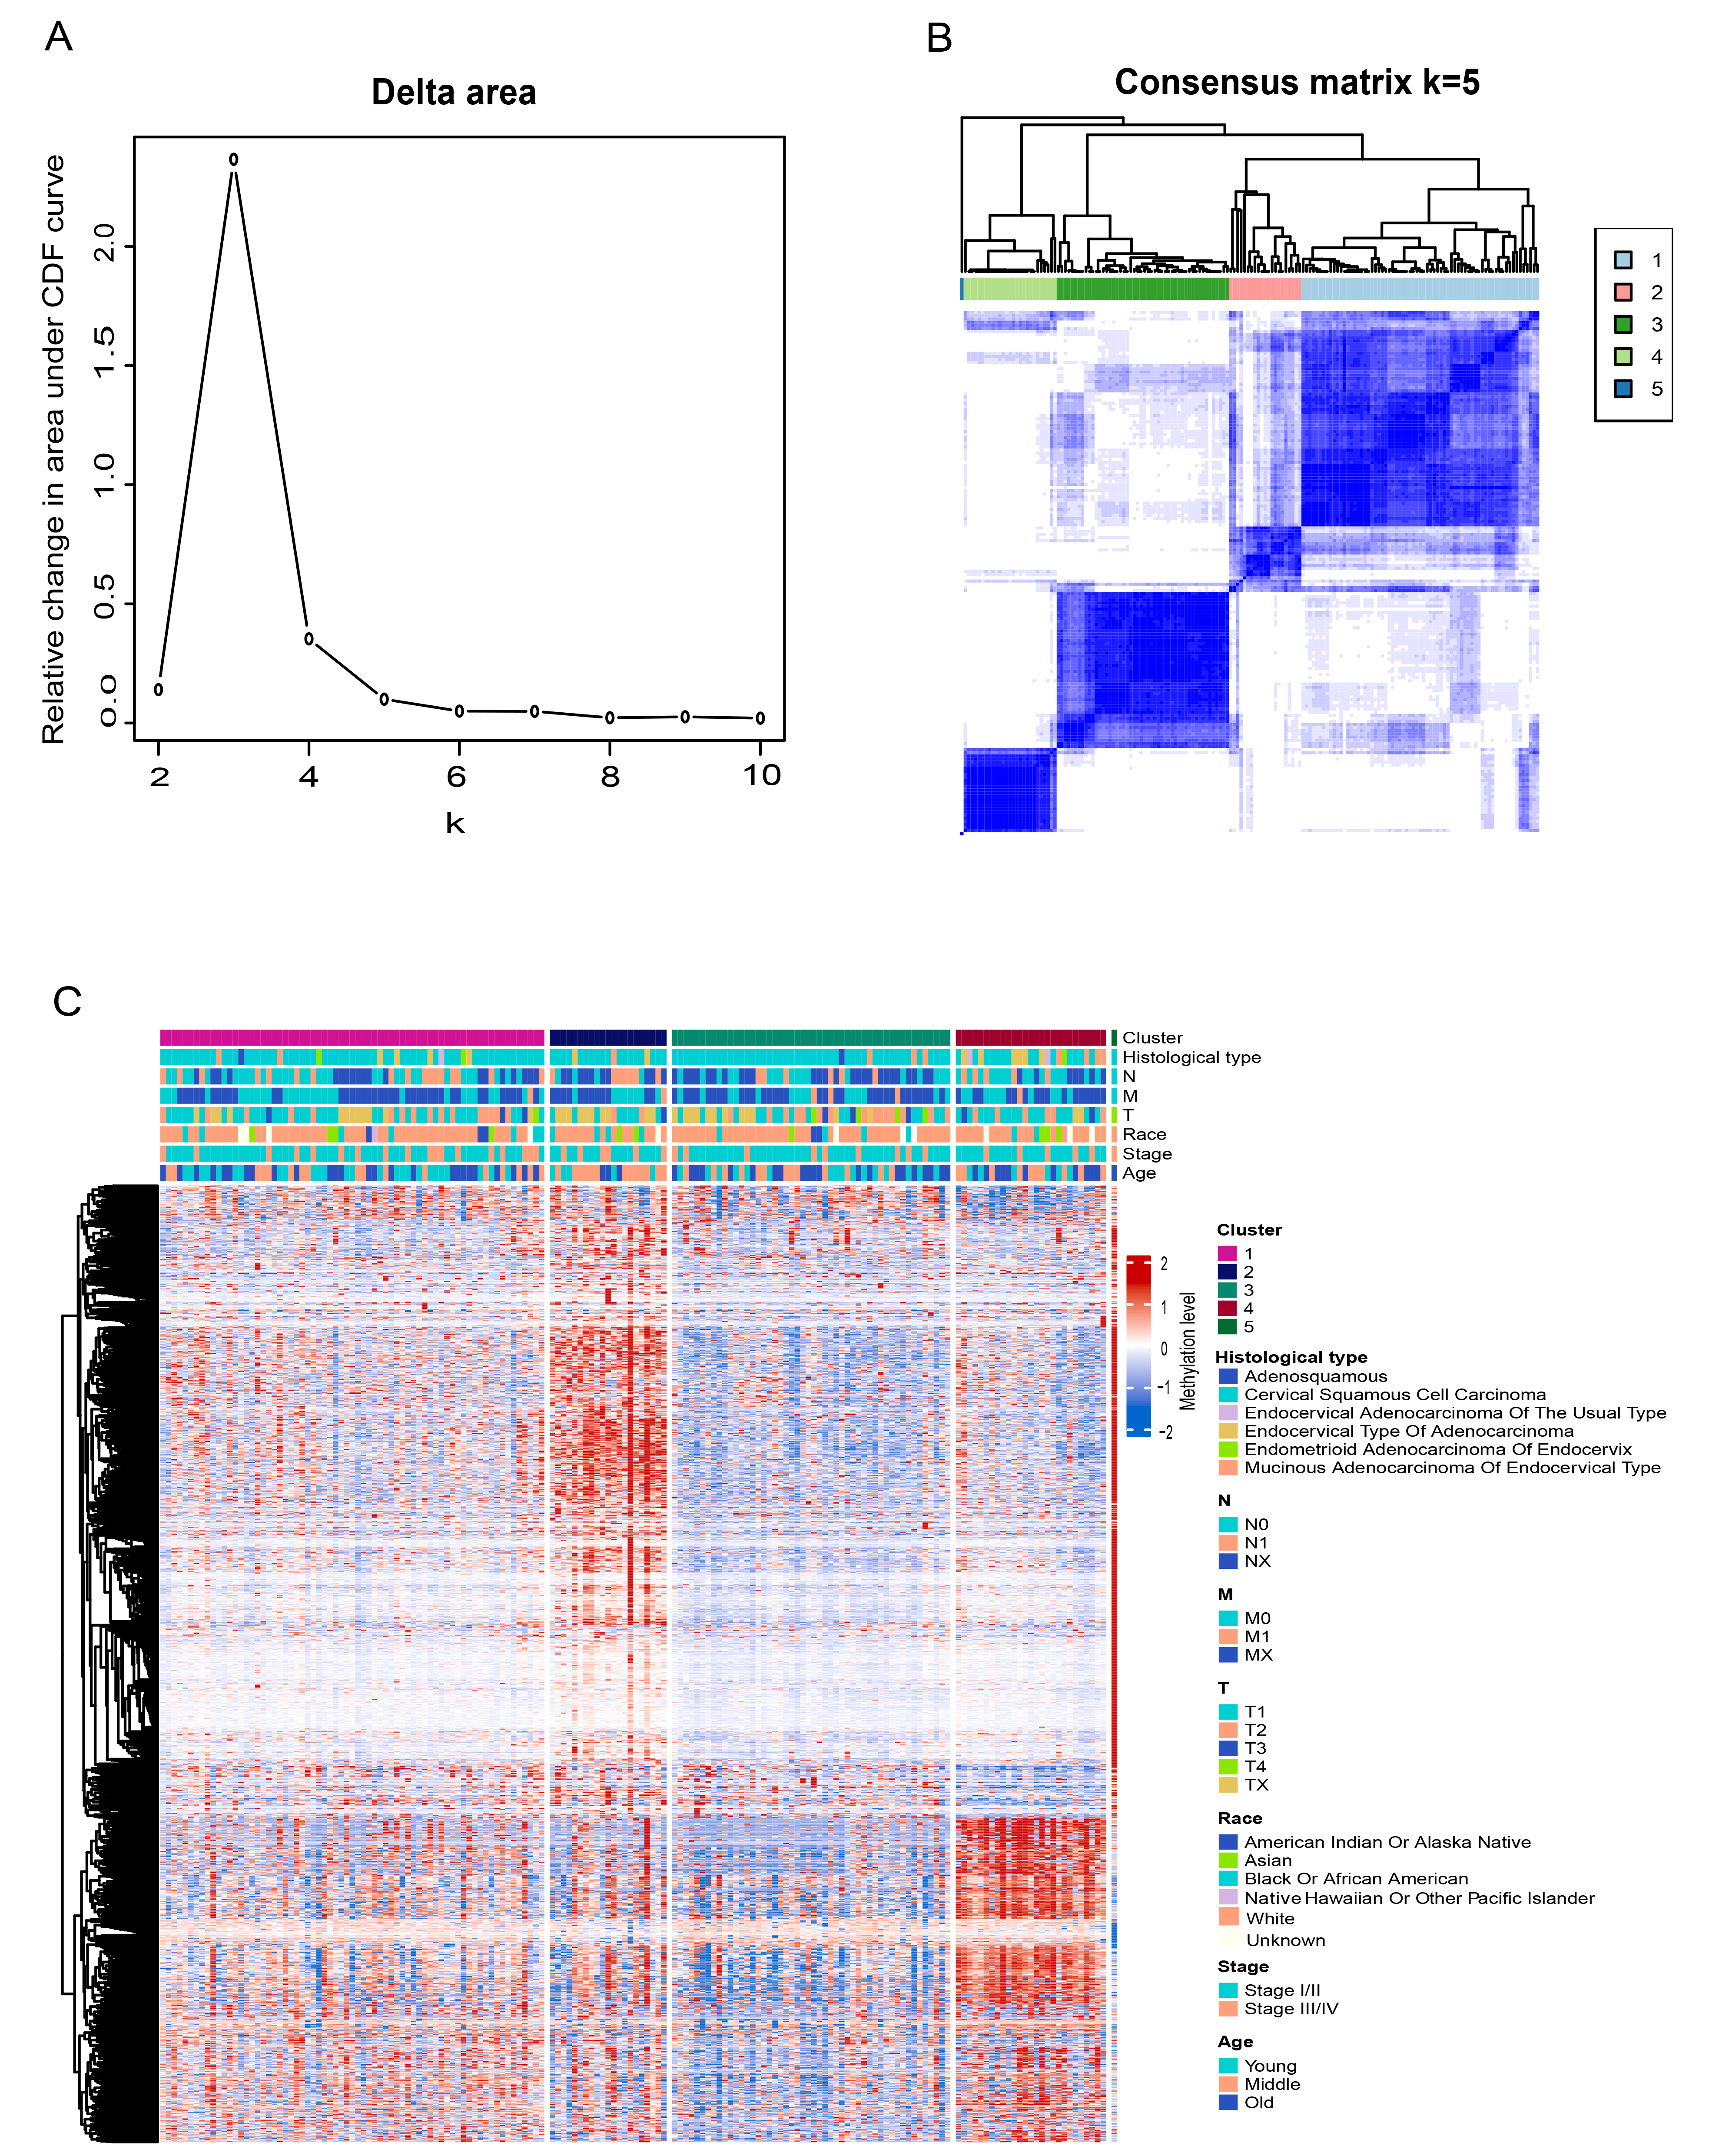 Fig. 1.
Selection of the optimal cluster number and consensus clustering results for DNA methylation. (A) Delta area plot showing the relative change in the area under the cumulative distribution function (CDF) curve for each cluster number k. (B) Consensus matrix heatmap at k = 5. (C) Heatmap of DNA methylation clusters annotated with histological type, Tumor-Node-Metastasis (TNM) stage, clinical stage, race, and age.
To further explore prognostic heterogeneity, we conducted a comparative survival analysis among the four remaining clusters. Kaplan-Meier curves revealed significant differences in overall survival among the clusters (Fig. 2A). Pairwise log-rank tests indicated that Cluster 1 had significantly better survival than Cluster 2 (p = 0.027) and Cluster 3 (p = 0.045). Cluster 4 also exhibited significantly better survival than Cluster 2 (p = 0.027) and Cluster 3 (p = 0.047). The remaining pairwise comparisons were not statistically significant.
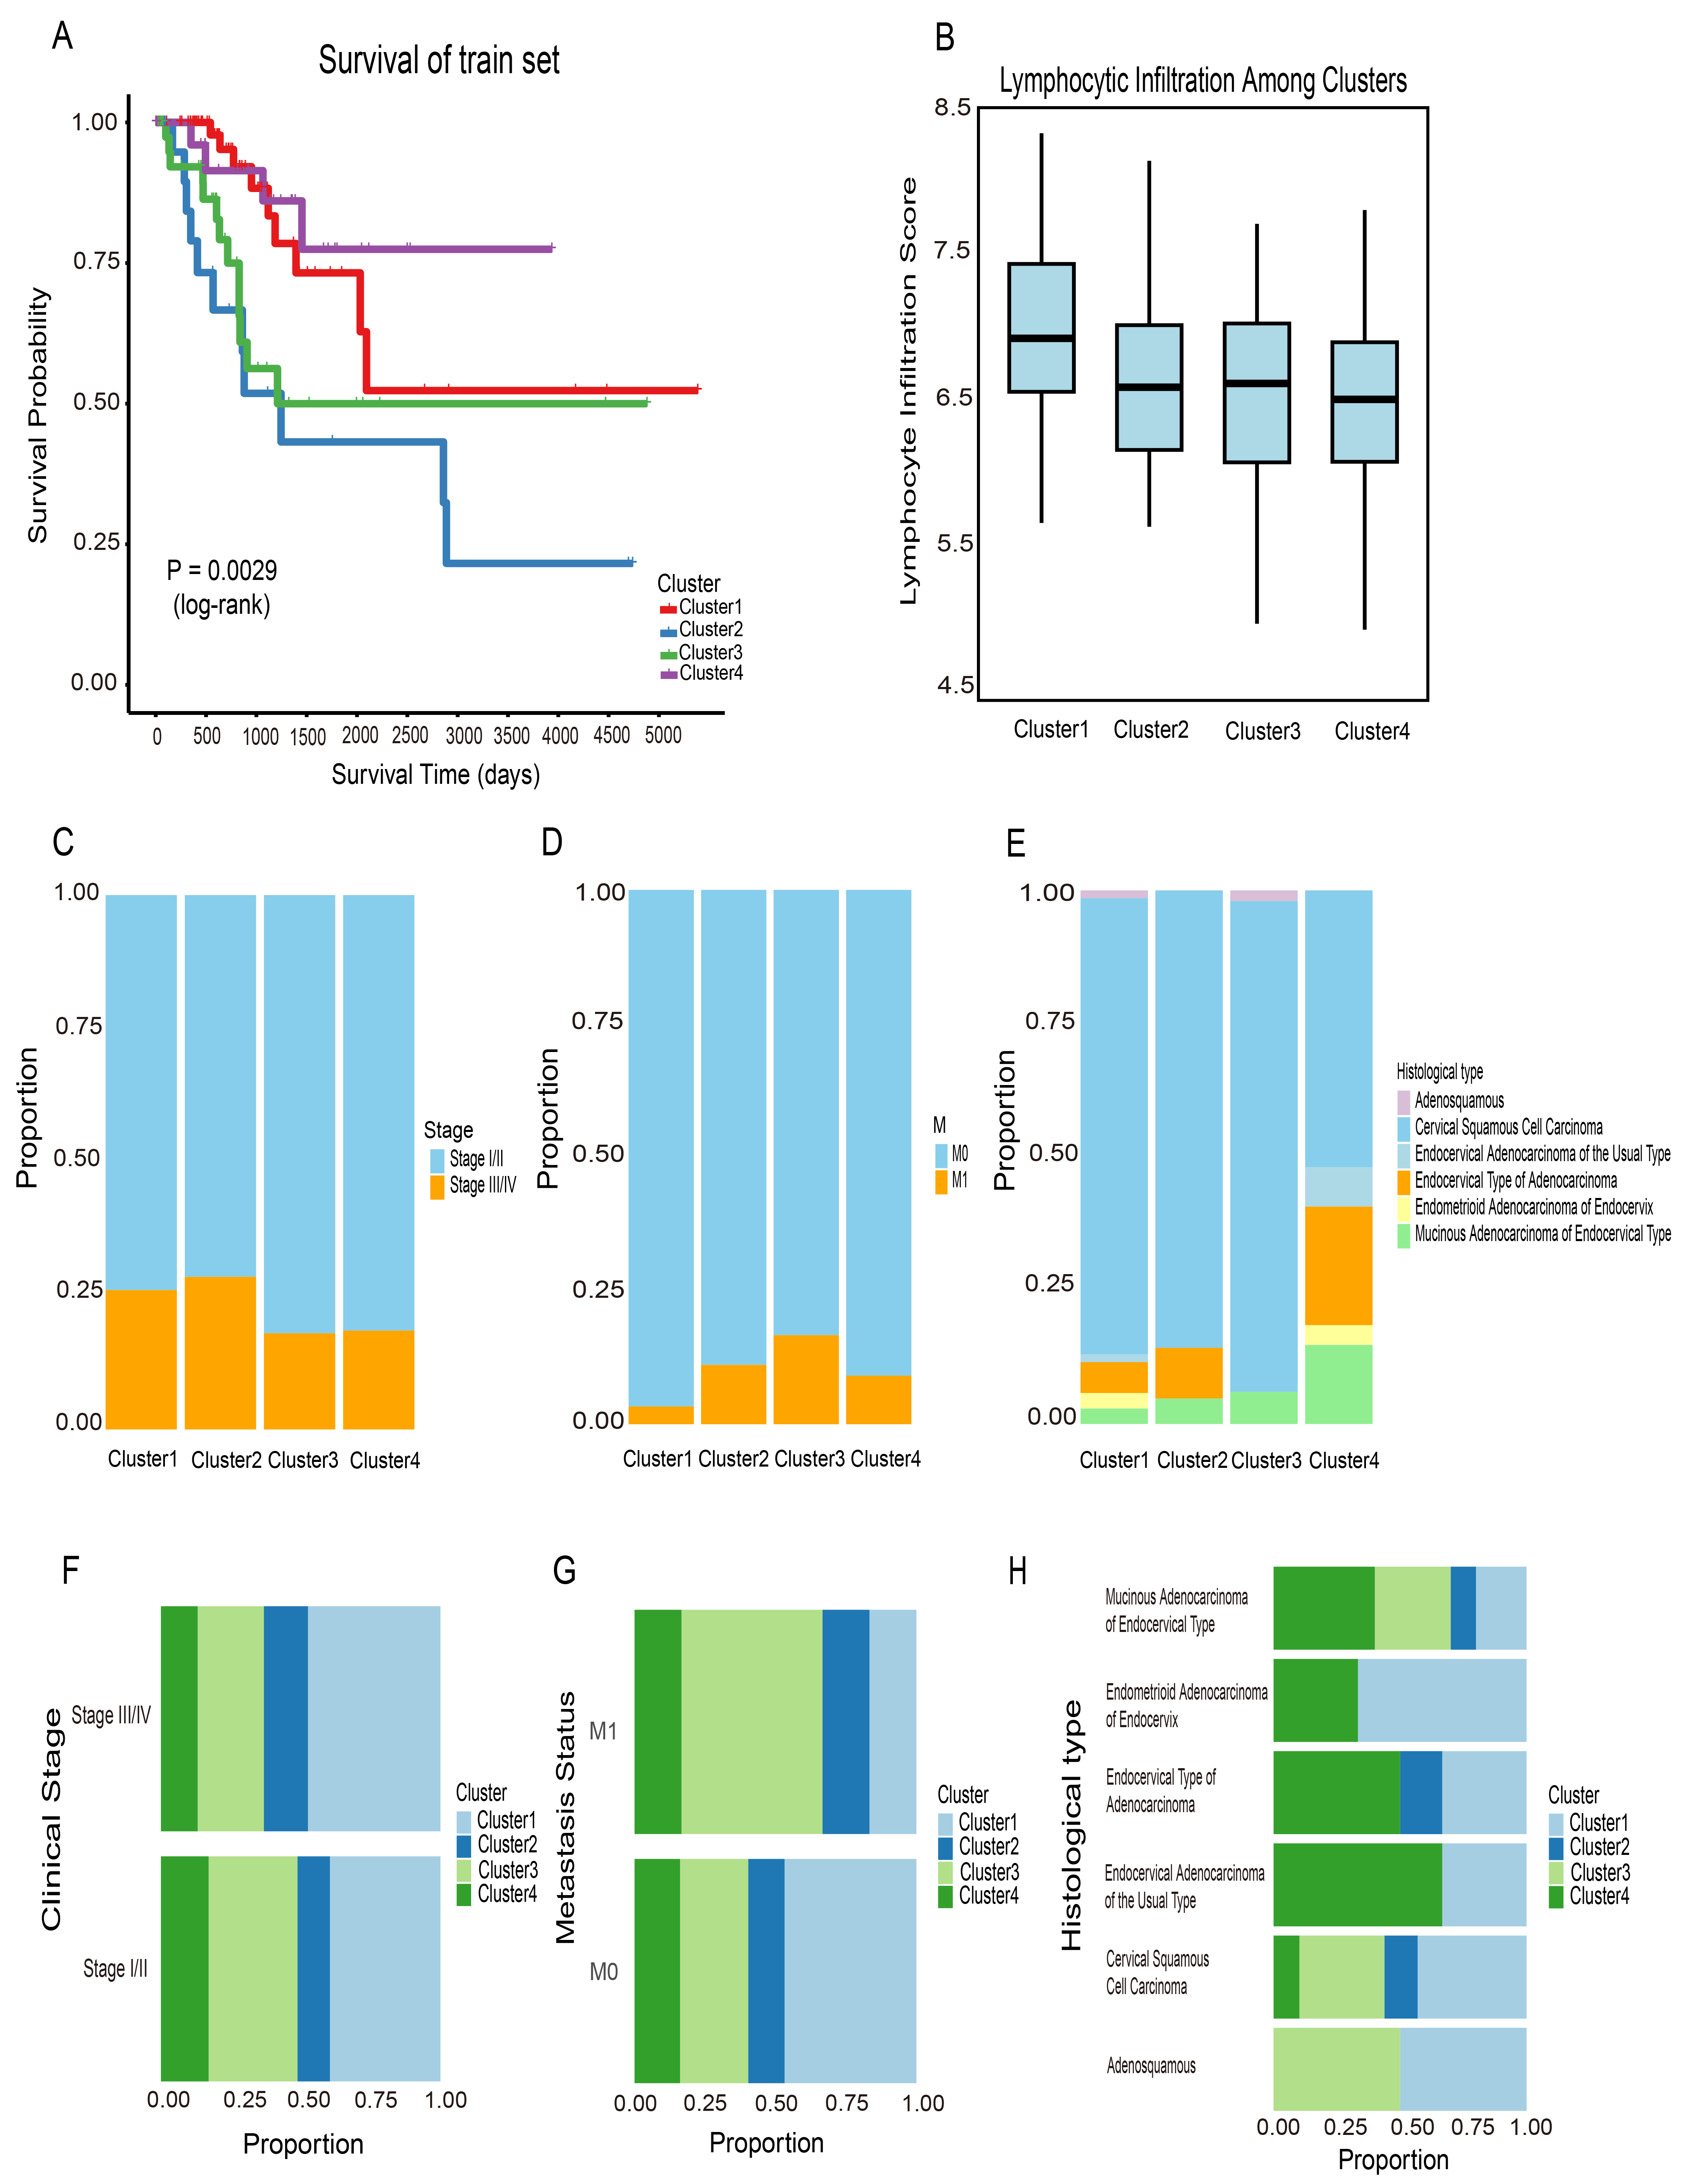 Fig. 2.
Survival and clinical/immune characteristics of DNA methylation-defined clusters. (A) Kaplan-Meier survival curves for the four clusters in the training cohort, with statistical significance assessed using the log-rank test. (B) Distribution of lymphocyte infiltration scores across clusters. (C–E) Distribution of clinical stage, metastasis status, and histologic type within clusters. (F–H) Alternative views of panels (C–E) to facilitate cluster-wise comparisons.
Differences in clinical stage, metastases status, and histologic type among cervical cancer patients are associated with substantial variations in incidence, survival, and treatment response. Identical DNA methylation subgroups included patients at different clinical stages (Fig. 2C), suggesting that methylation patterns may be independent of disease stage. Similar patterns have been reported in colon adenocarcinoma, where methylation-based molecular subtypes did not fully align with clinical stages, supporting the view that methylation profiling can offer stage-independent insights into tumor heterogeneity [20]. The same was true for metastatic status, histologic type (Fig. 2D,E). Thus, DNA methylation profiling may serve as a reliable biomarker for cervical cancer, independent of clinical stage. Patients within the same clinical stage exhibited distinct DNA methylation profiles (Fig. 2F). For example, the four methylation-based clusters showed heterogeneous methylation profiles despite sharing the same stage. Similar patterns were also observed for metastasis status and histological subtypes (Fig. 2G,H). These findings suggest that DNA methylation status offers a more refined molecular classification of cervical cancer and provides deeper insight into its underlying heterogeneity.
Lymphocyte infiltration into the tumor microenvironment is generally regarded as a favorable prognostic indicator in cancer patients [21]. CTL expression profiles are often used as indirect markers of lymphocytic infiltration, with higher expression levels linked to improved survival [21]. In this study, lymphocyte infiltration scores were calculated for each sample in the training dataset. Cluster 1 showed the highest immune infiltration among all subgroups (Fig. 2B). This finding suggests a relatively better prognosis for this cluster. In the analysis of metastasis among the four clusters, Cluster 1 had the fewest metastatic samples (Fig. 2D). This result was consistent with its higher lymphocyte infiltration level.
To characterize hypermethylated and hypomethylated CpG loci within specific DNA
methylation subgroups of cervical cancer, we employed QDMR software, a
quantitative analysis tool. A total of 1842 CpG sites from the 4 subgroups were
analyzed to identify subgroup-specific CpGs. For each subgroup, the average DNA
methylation level across the 1842 CpG sites was calculated for each sample,
generating a dataset with dimensions of 1842
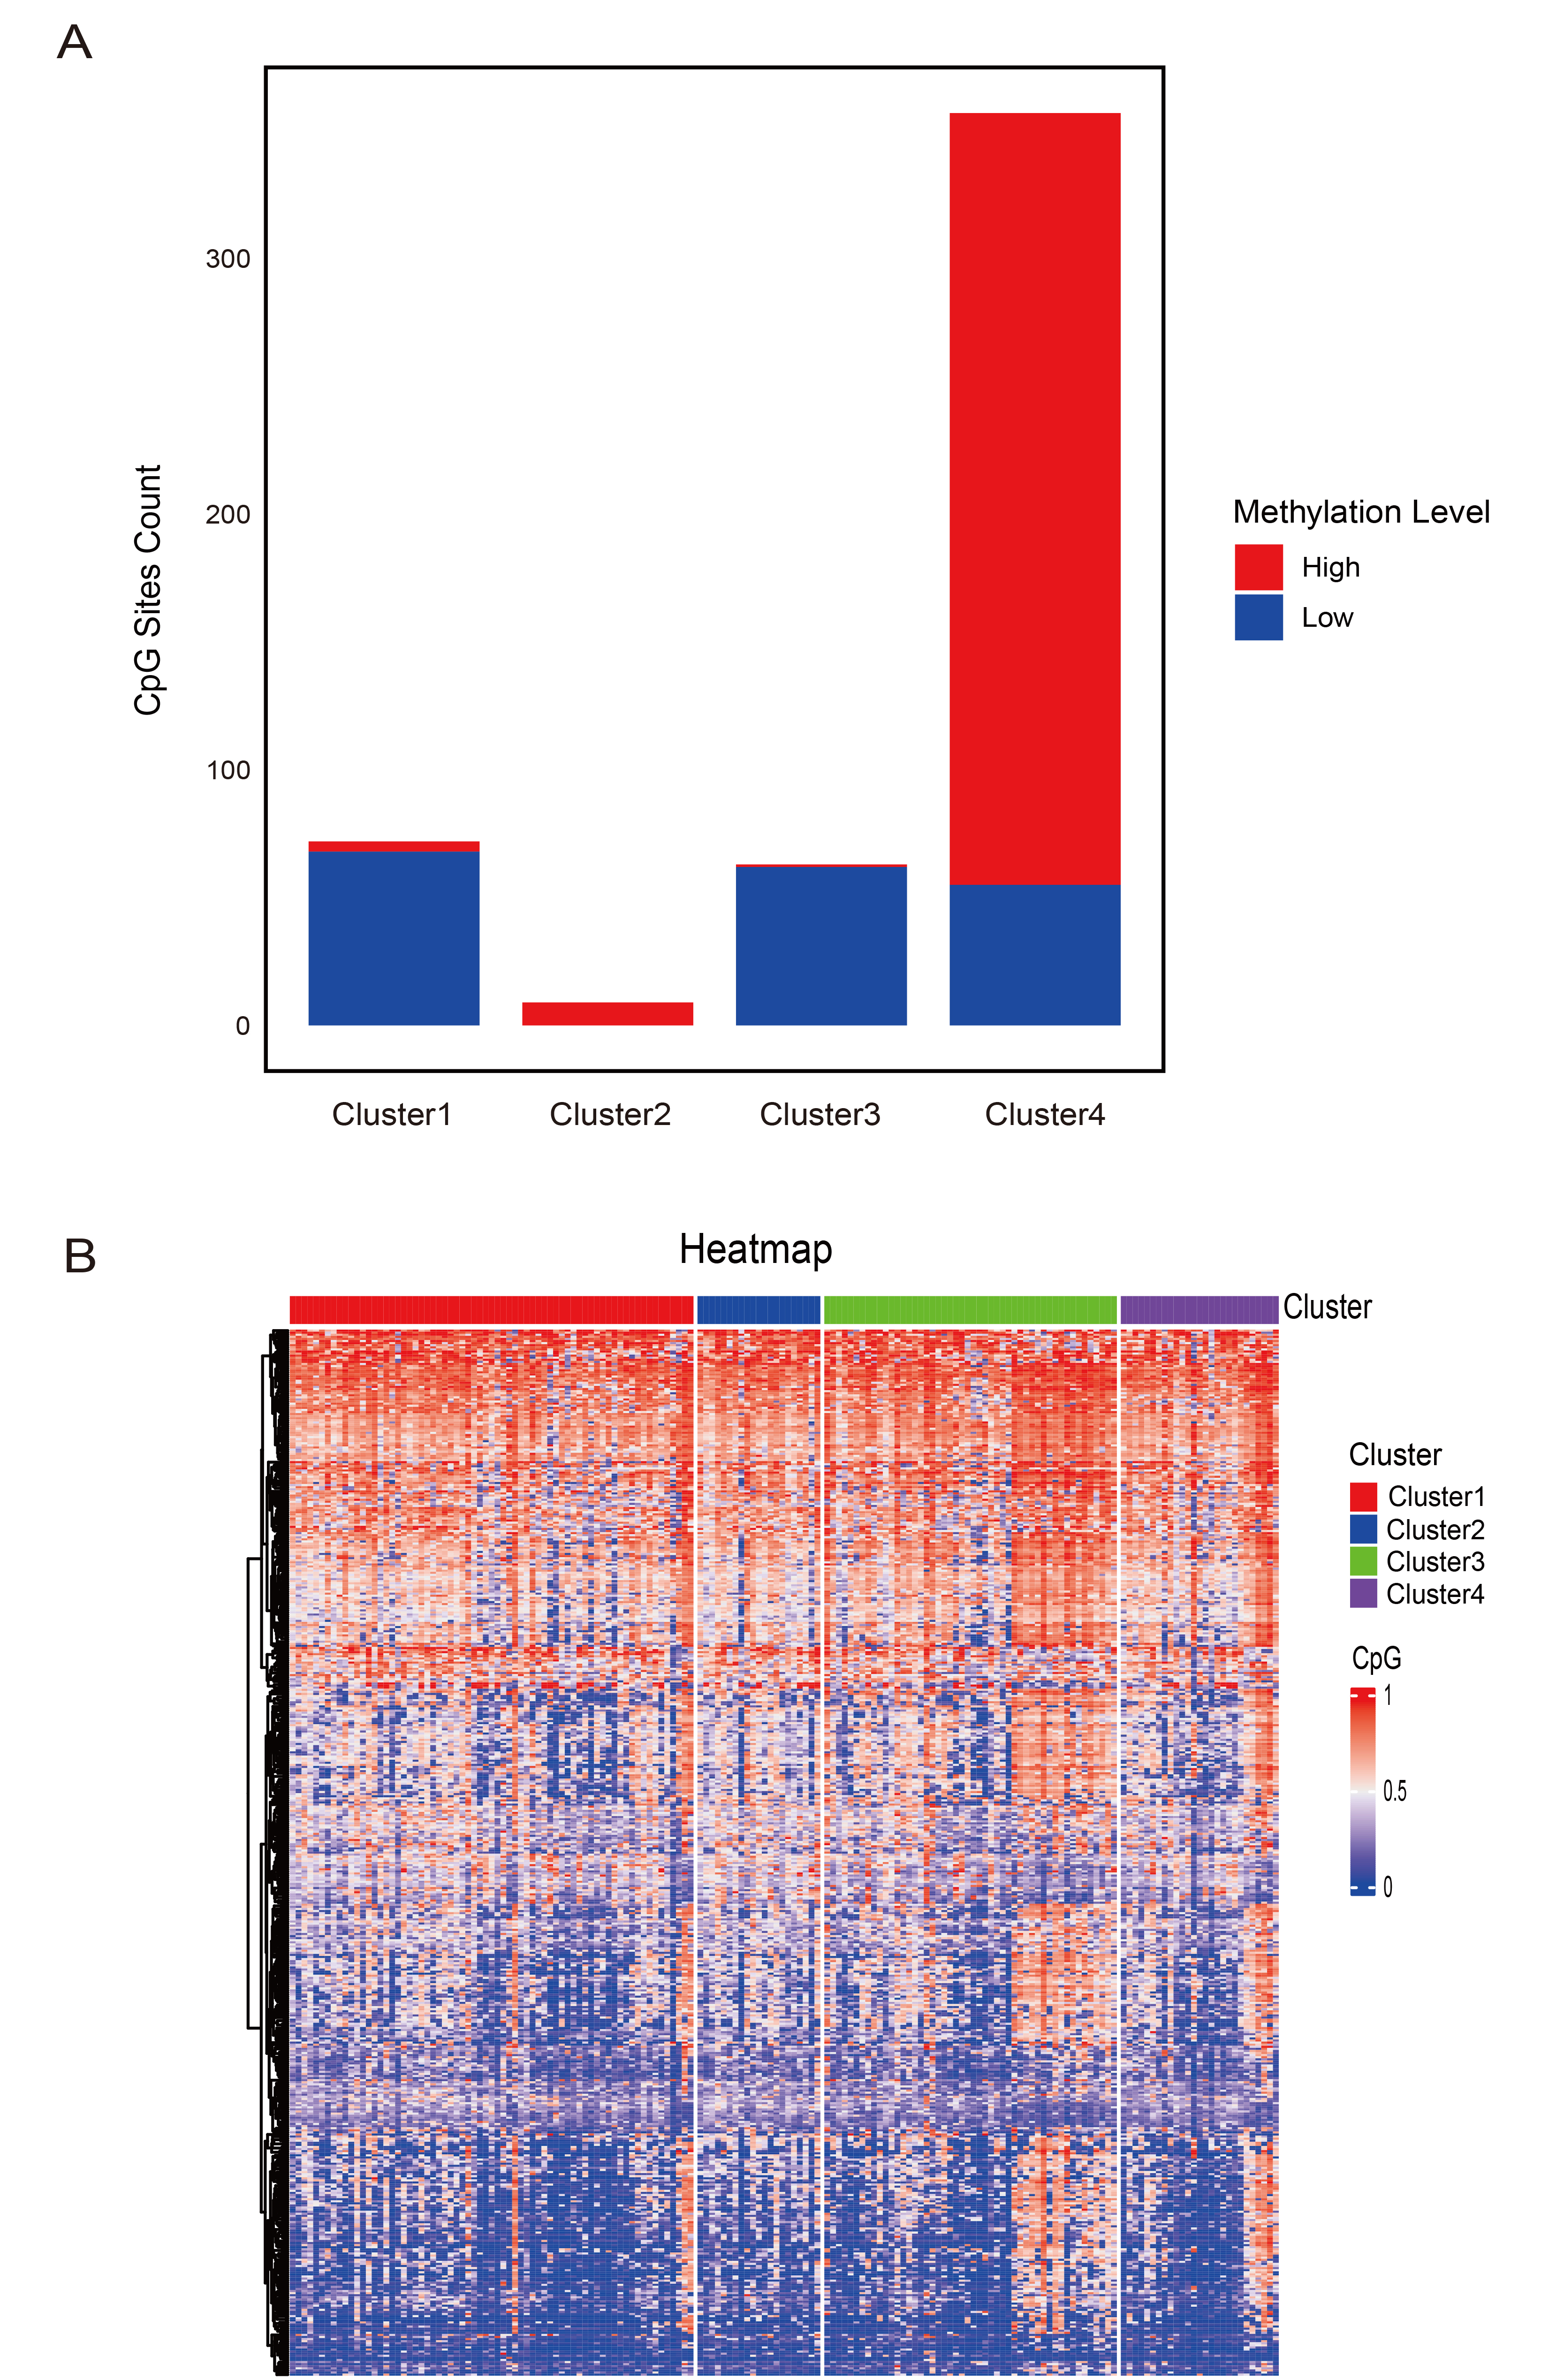 Fig. 3.
Specific hyper- and hypomethylated CpG sites in DNA methylation clusters. (A) Selected CpG sites for each prognostic DNA methylation subtype. (B) Heatmap showing the methylation patterns of selected CpG sites across the four identified DNA methylation clusters.
| Cluster | Number of specific CpGs |
| Cluster 1 | 72 |
| Cluster 2 | 9 |
| Cluster 3 | 63 |
| Cluster 4 | 357 |
Notably, several well-established biomarkers in cervical cancer research were among the differentially methylated genes identified by QDMR. For instance, promoter hypermethylation of paired box 1 (PAX1) and SRY-box transcription factor 1 (SOX1) has been reported to have high sensitivity and specificity for detecting CIN3+ lesions and cervical cancer [22]. The presence of these widely recognized methylation markers in our analysis supports the biological relevance of our subtype classification and highlights its potential utility in cervical cancer diagnosis and prognosis.
We performed enrichment analysis on genes associated with the specific CpG sites identified in each DNA methylation cluster. The analysis revealed that genes unique to Cluster 1 were predominantly involved in toxin metabolism and RNA catabolism (Supplementary Fig. 1a). In Cluster 2, genes were primarily associated with cellular movement and transport (Supplementary Fig. 1b). Cluster 3 was characterized by genes involved in diverse metabolic processes (Supplementary Fig. 1c). Genes in Cluster 4 were largely associated with muscle-related processes and with the development and regulation of the nervous system (Supplementary Fig. 1d). These results indicate that distinct DNA methylation subgroups correspond to different biological functions.
To assess the discriminatory power of the identified CpG sites for each DNA methylation cluster, we constructed a Bayesian model using the training set and evaluated its performance via 10-fold cross-validation, with 501 specific CpGs as features. As shown in Fig. 4A, the area under the ROC curve (AUC) reached 0.824, demonstrating good discriminative ability. The classification performance of the Bayesian model is summarized in the confusion matrix in Table 2, where columns denote predicted cluster labels and rows represent actual cluster assignments. Bold values indicate the number of instances in which predicted clusters matched the actual clusters.
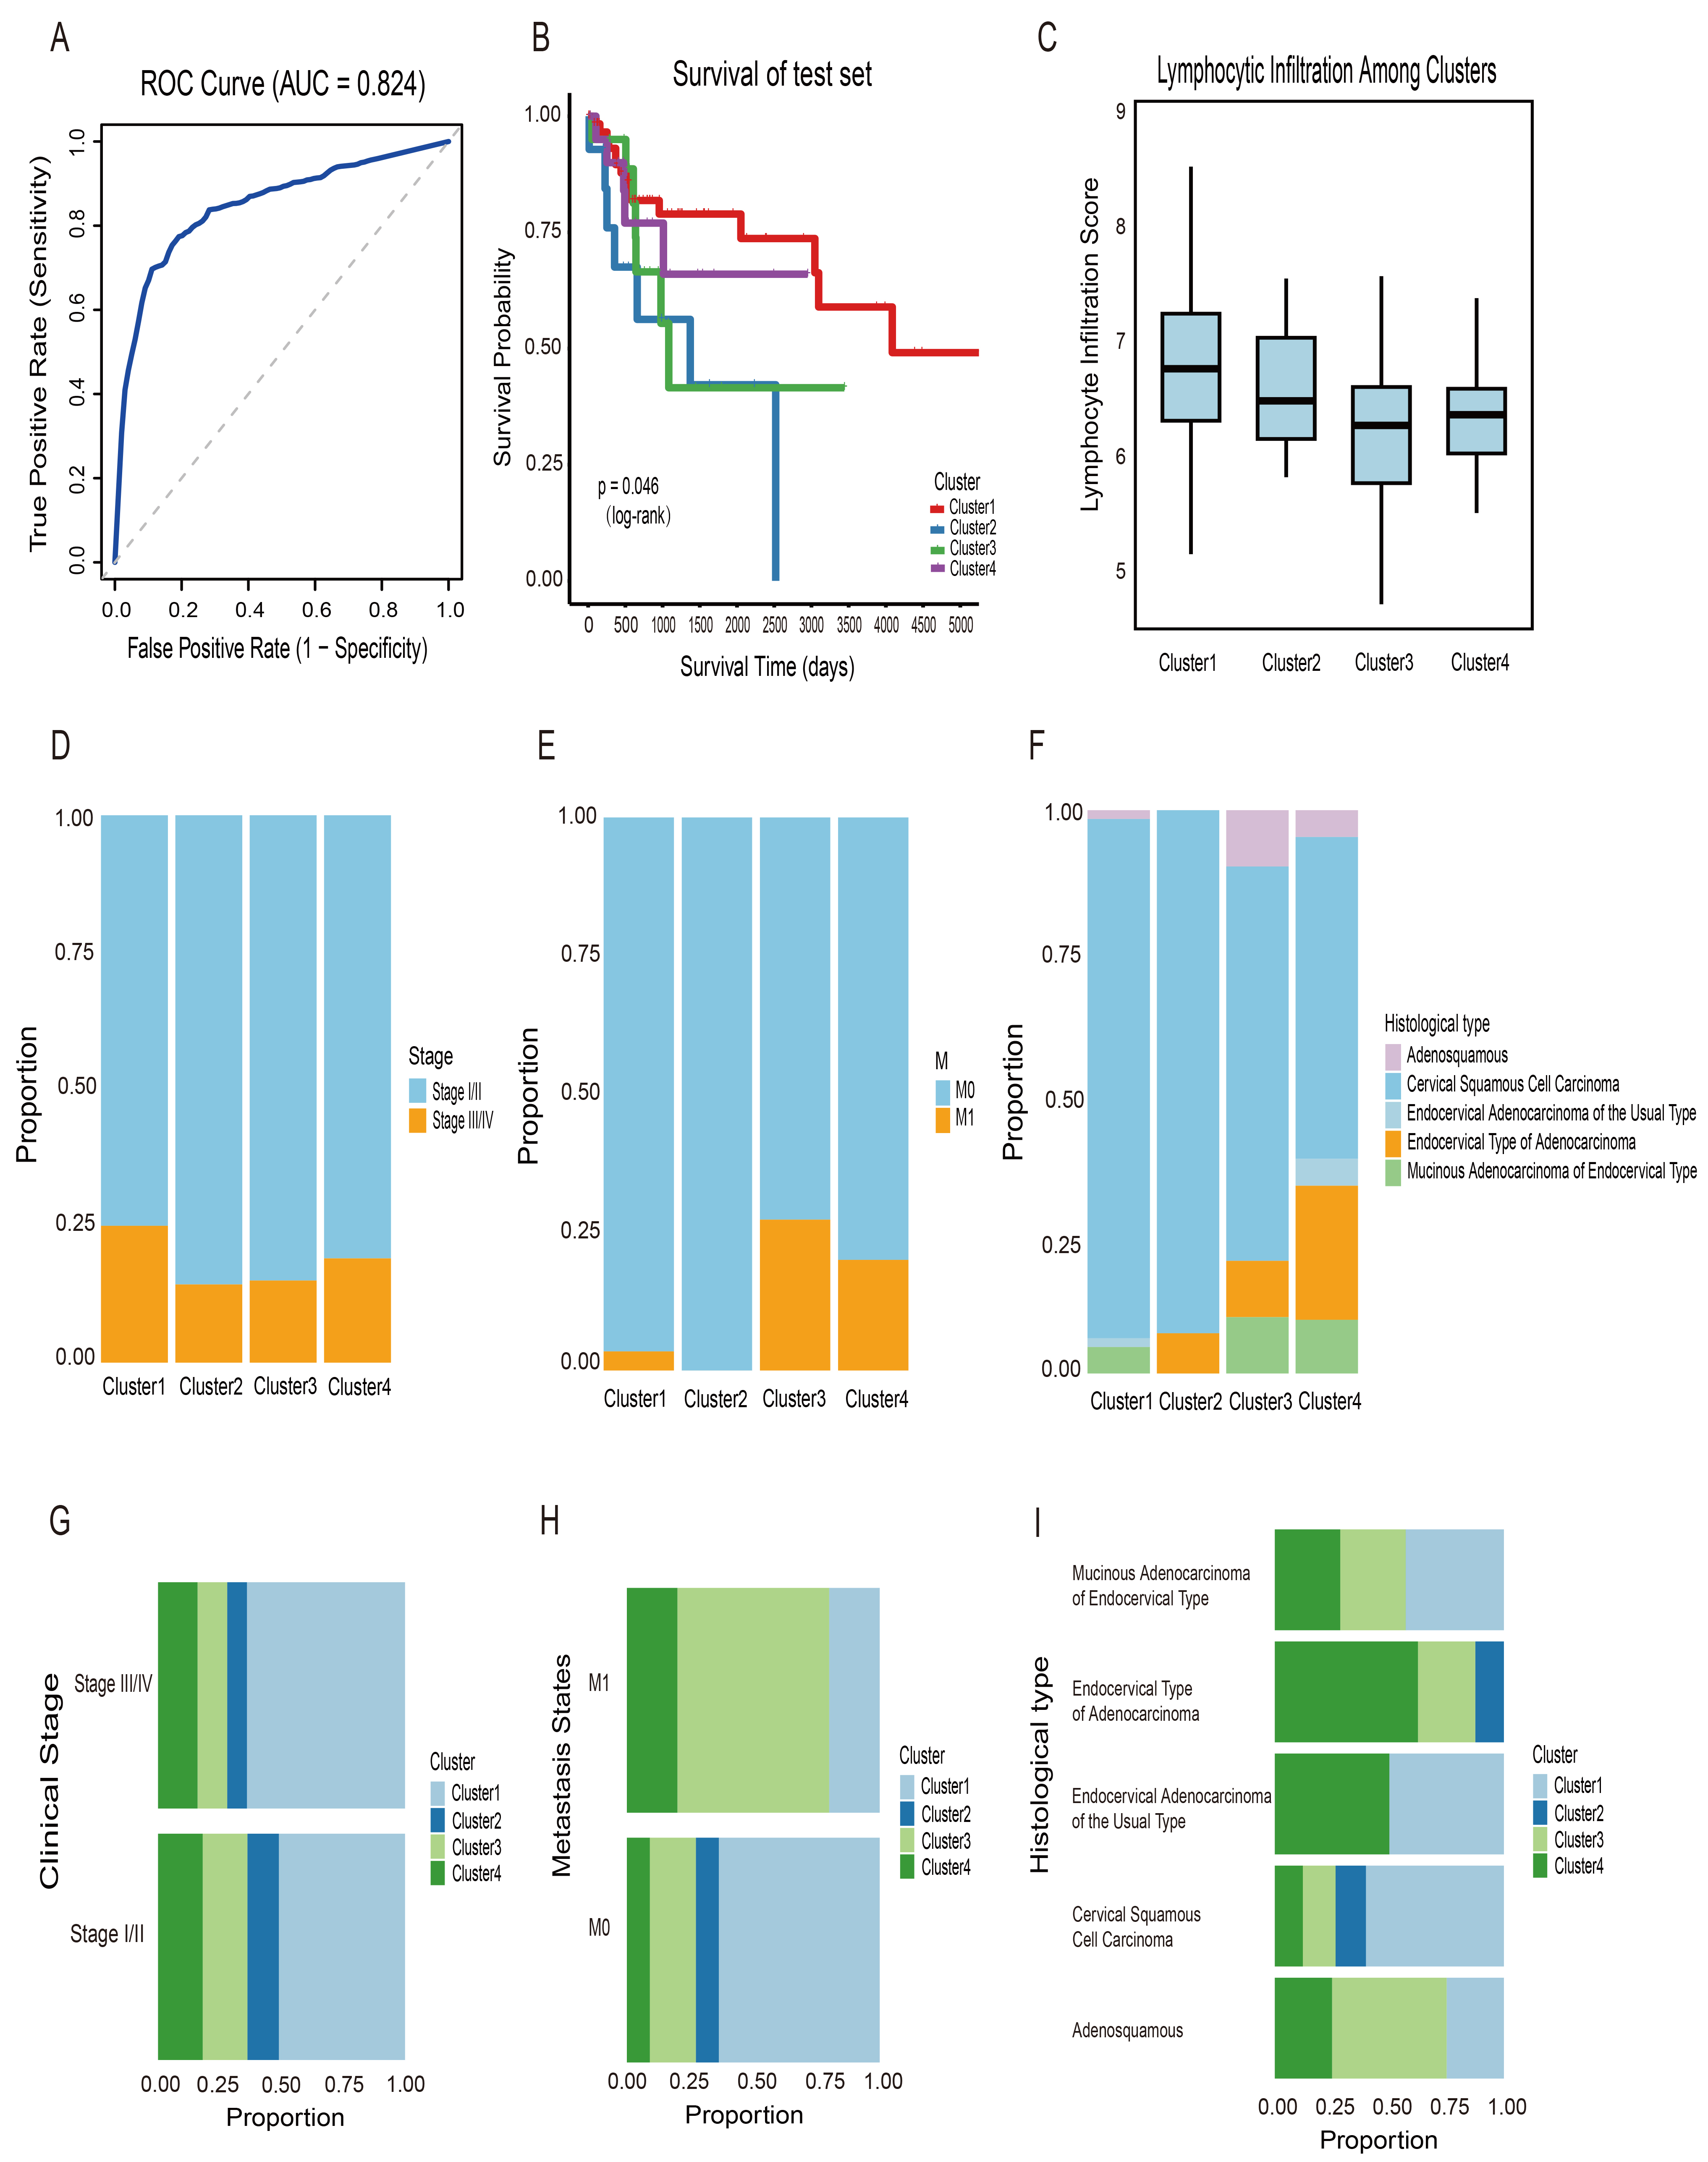 Fig. 4.
Prognostic model performance and predictive outcomes. (A) Receiver operating characteristic (ROC) curve showing the model’s discriminative ability (area under the ROC curve (AUC) = 0.824). (B) Kaplan-Meier survival curves for the four clusters predicted by the model in the test cohort. (C) Lymphocyte infiltration scores across the four clusters in the test cohort. (D–F) Clinical stage, metastasis, and histological type distribution in each DNA methylation cluster. (G–I) Alternative views of panels (D–F) to facilitate cluster-wise comparisons.
| Predicted Cluster 1 | Predicted Cluster 2 | Predicted Cluster 3 | Predicted Cluster 4 | |
| Actual Cluster 1 | 21 | 0 | 0 | 0 |
| Actual Cluster 2 | 9 | 21 | 0 | 2 |
| Actual Cluster 3 | 0 | 14 | 11 | 0 |
| Actual Cluster 4 | 0 | 0 | 10 | 0 |
Note: Bold values indicate the number of instances in which predicted clusters matched the actual clusters.
We then applied this predictive model to classify samples in the test cohort. Each sample was assigned to a cluster corresponding to the subgroups defined in the training set. Survival analysis showed that the predicted clusters had distinct and statistically significant differences in overall survival (Fig. 4B). These findings indicate that the specific CpG sites identified in this study could serve as potential biomarkers for cervical cancer. Clinical characteristics in the test set were assessed using the same approach as in the training set. Lymphocytic infiltration was also evaluated using the same methodology, revealing highly similar patterns between the training and test cohorts (Fig. 4C). As in the training set, Cluster 1 was the predominant subgroup among both early-stage (I/II) and advanced-stage (III/IV) patients. Among patients with metastasis, Cluster 3 was the most frequent subgroup. In contrast, Cluster 1 consistently predominated among patients without metastasis (Fig. 4D–I). For histological types, all four clusters included a high proportion of squamous cell carcinoma. These findings further demonstrate the reliable predictive performance of the model and the robustness of its identified features.
The inherent limitations of cervical cancer survival data from TCGA may reduce the generalizability of our findings. Therefore, an externally validated dataset comprising 300 cervical cancer samples from GEO (accession number GSE44001) was introduced. Differentially methylated sites identified by QDMR software were first mapped to genes. The mapped genes were then intersected with genes in the GEO dataset, and the overlapping genes were used for further analysis. The external validation cohort was classified using the clustering strategy applied to the training dataset. After cluster assignment, survival analysis was performed for the four identified groups to evaluate potential prognostic differences. Survival analysis revealed significant differences among the four clusters (p = 0.035, Supplementary Fig. 2).
These results indicate that genes mapped from methylation sites can effectively distinguish molecular subtypes with different prognoses at the transcriptome level. This finding demonstrates that the typing system developed in this study has cross-histological stability. It also suggests a potential functional association between DNA methylation patterns and gene expression, which may collectively influence tumor prognosis.
The tumor microenvironment (TME) influences immune responses and affects outcomes of cancer therapy. Next, we examined differences in immune cell infiltration among four clusters. Immune cell abundance in the clusters was assesses using the CYBERSORT algorithm, revealing relatively high proportions of B cells, macrophages, and dendritic cells in each cluster (Fig. 5A). These findings suggested that B cells, macrophages, and dendritic cells could serve as potential therapeutic targets for cervical cancer.
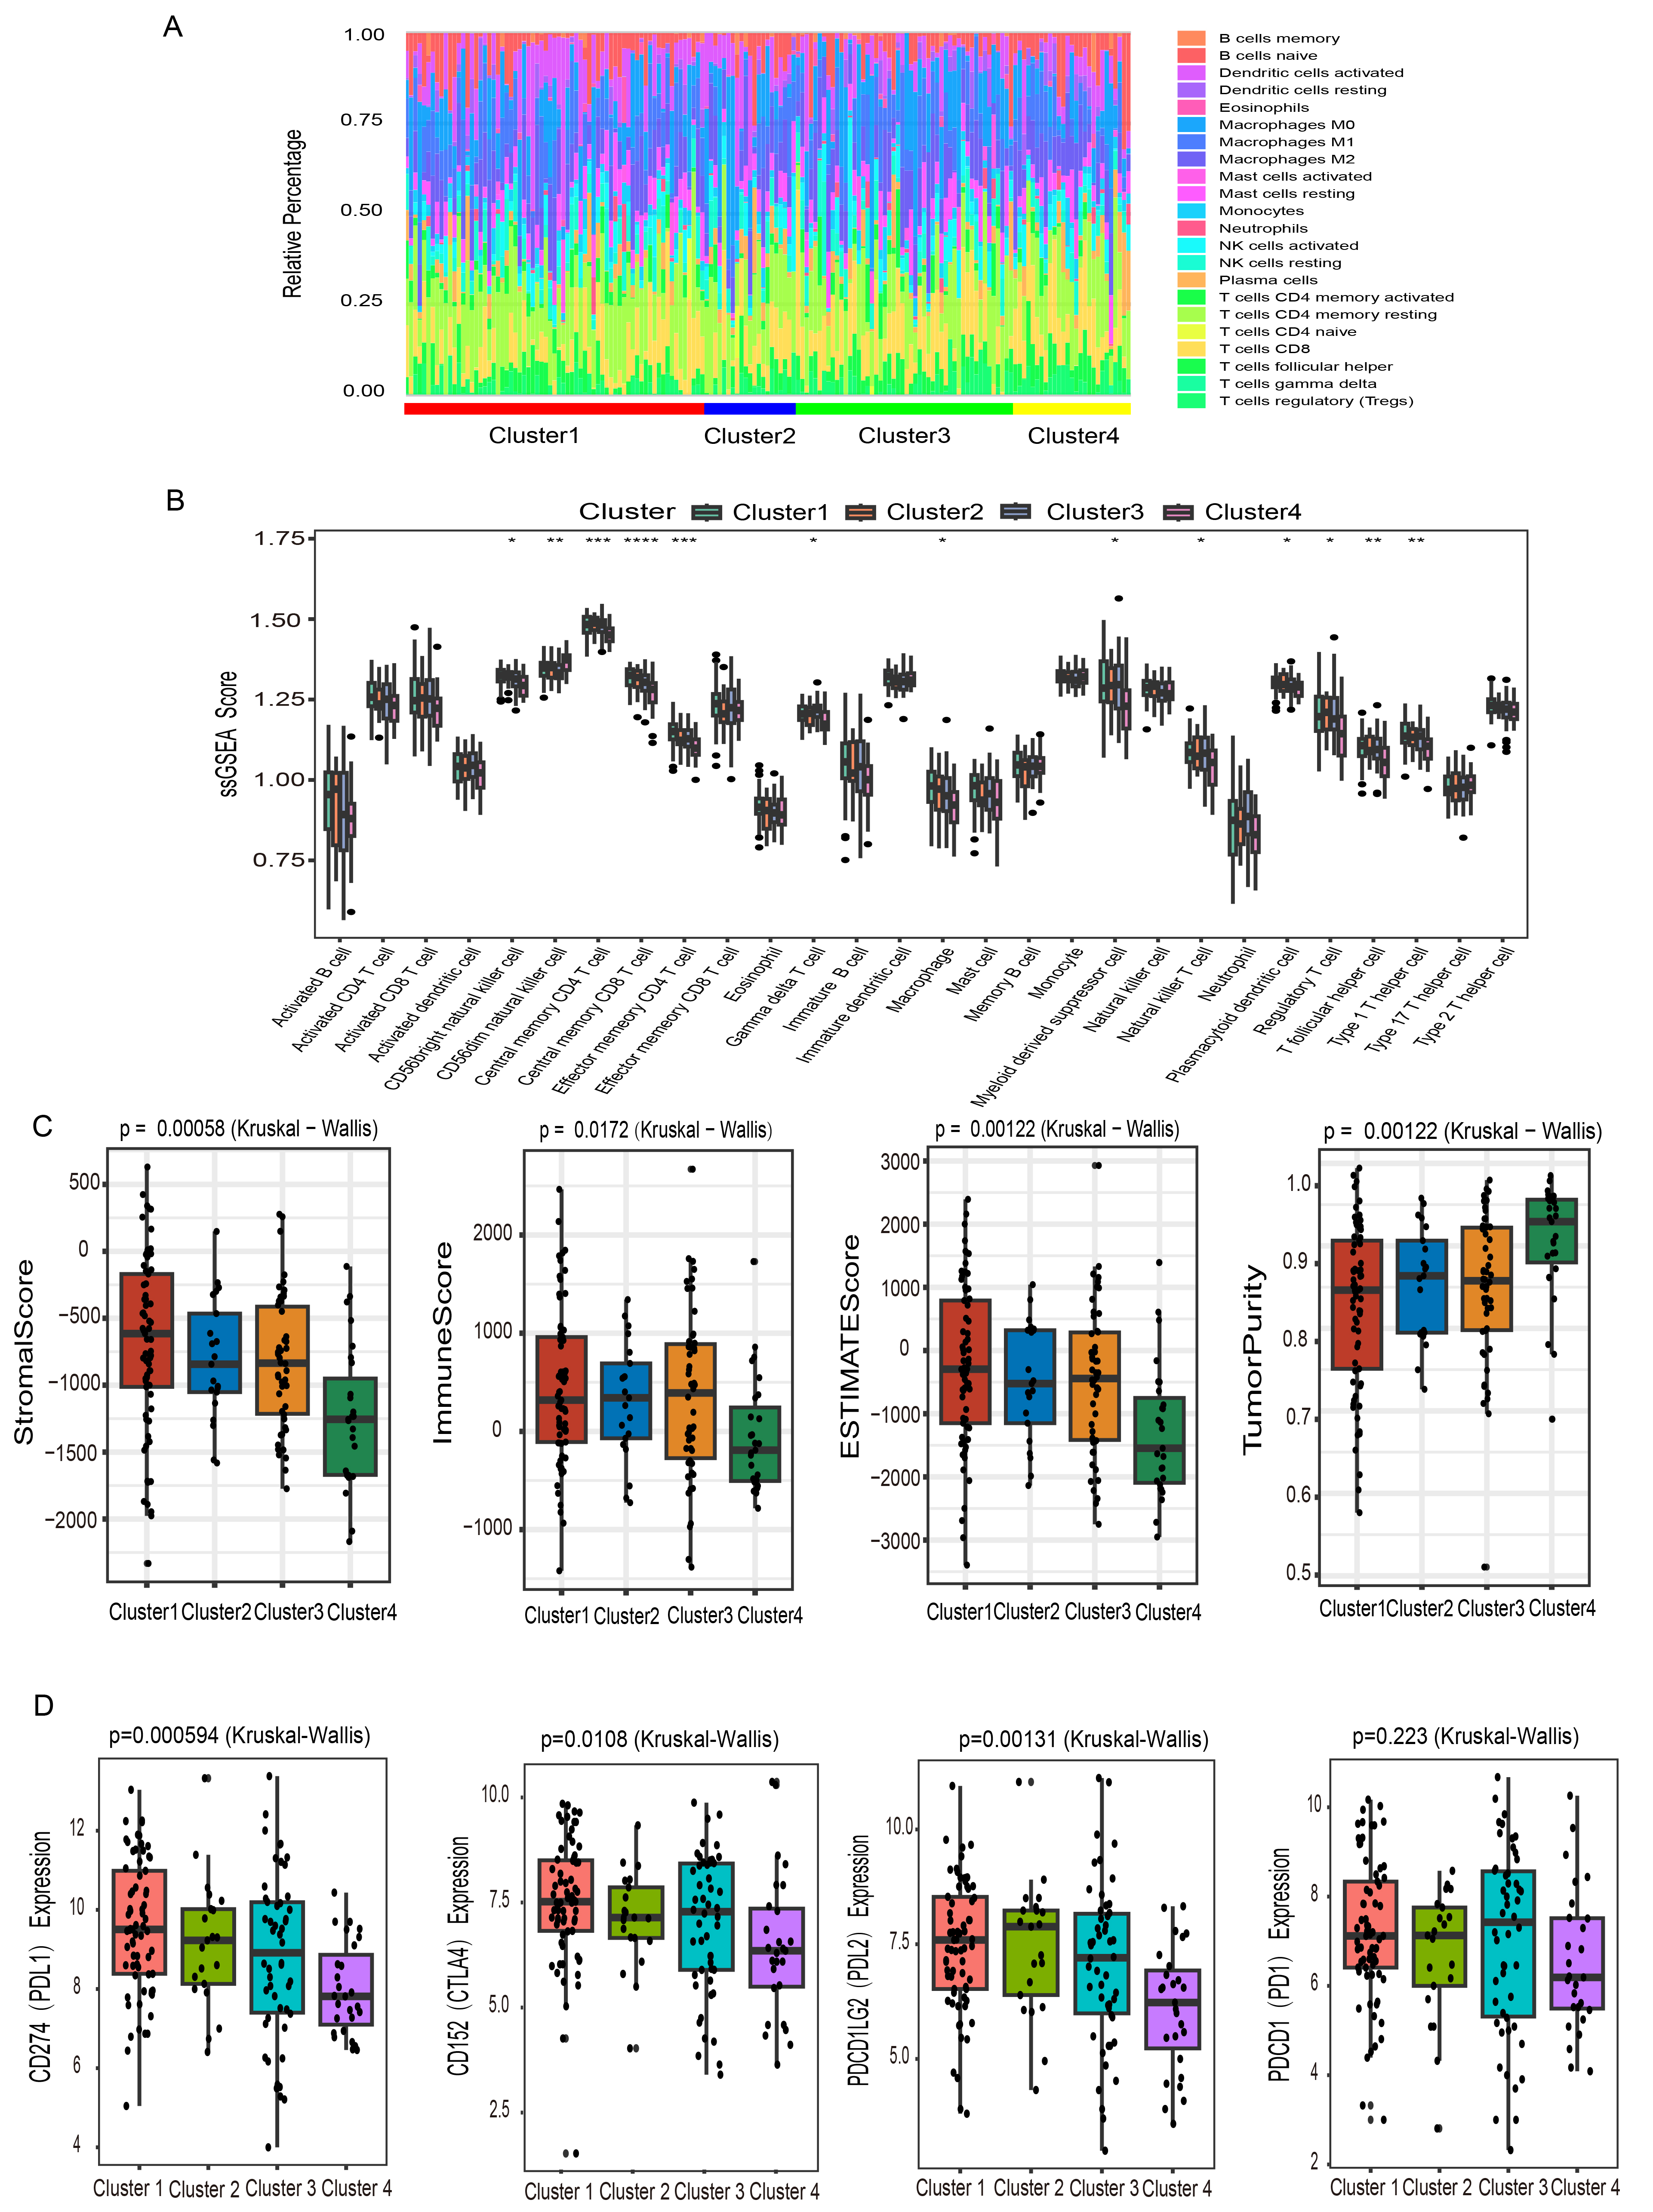 Fig. 5.
Immune characteristics of cervical cancer subtypes. (A) A
stacked bar chart displayed the relative proportions of tumor-infiltrating immune
cell populations within each cluster. (B) Infiltration levels of 28 immune cell
subtypes across the four clusters were quantified through ssGSEA. (C) Immune
score, stromal score, estimate score, and tumor purity of the 4 clusters were
assessed by the ESTIMATE algorithm. (D) Differential expression patterns of
immune checkpoint molecules Programmed Death 1 (PD-1), Programmed Death Ligand 1
(PD-L1), Programmed Death Ligand 2 (PD-L2), and Cytotoxic T-Lymphocyte-Associated
Protein 4 (CTLA-4) were compared among the four clusters. Statistical
significance was indicated by asterisks: *p
The infiltration profiles of 28 immune cell types were evaluated across clusters
using the ssGSEA algorithm (Fig. 5B). Cluster 1 exhibited increased infiltration
of central memory CD8+ T cells and effector memory CD4+ T cells. This pattern
indicated potentially enhanced responsiveness to immune checkpoint inhibitor
therapy in these patients. Cluster 2 showed higher levels of central memory CD4+
T cells, eosinophils, and natural killer (NK) cells, along with reduced
infiltration of effector memory CD8+ T cells and dendritic cells. These results
suggested a distinct immune landscape. Cluster 3 was enriched in
In recent years, immune checkpoint inhibition has become a standard strategy in many cancer therapies. We examined the expression levels of several immune checkpoint genes, including PDCD1 (PD-1), CD274 (PD-L1), PDCD1LG2 (PD-L2), and CD152 (CTLA-4). Cluster 1 showed markedly higher expression of immune checkpoint genes, including PD-L1 and CTLA-4. In contrast, Cluster 4 exhibited the lowest expression of PD-1, PD-L1, PD-L2, and CTLA-4 (Fig. 5D). The pronounced upregulation of these immune checkpoint genes in Cluster 1 indicates that patients in this subgroup could potentially benefit from immune checkpoint blockade therapy.
Differentially methylated sites identified by QDMR software were first mapped to genes. The resulting gene set was then intersected with 2013 immune-associated genes obtained from the ImmPort database, yielding 23 differentially methylated immune-related genes. The DNA methylation profiles of these differential genes were compared across the four clusters. The analysis revealed that the DNA methylation levels of most immune genes differed among the clusters (Fig. 6). Notably, most differential immune genes in Cluster 4 exhibited high DNA methylation levels. This pattern could suppress the expression of these genes, potentially impairing immune cell function and activity, and may contribute to tumor immune escape. In contrast, most specific immune genes in Cluster 3 displayed relatively low DNA methylation levels, suggesting increased gene expression activity. This may support the maintenance of normal immune function. These findings provide a more detailed understanding of how epigenetic alterations influence immune dynamics in the tumor microenvironment and may guide future research on tumor immunity.
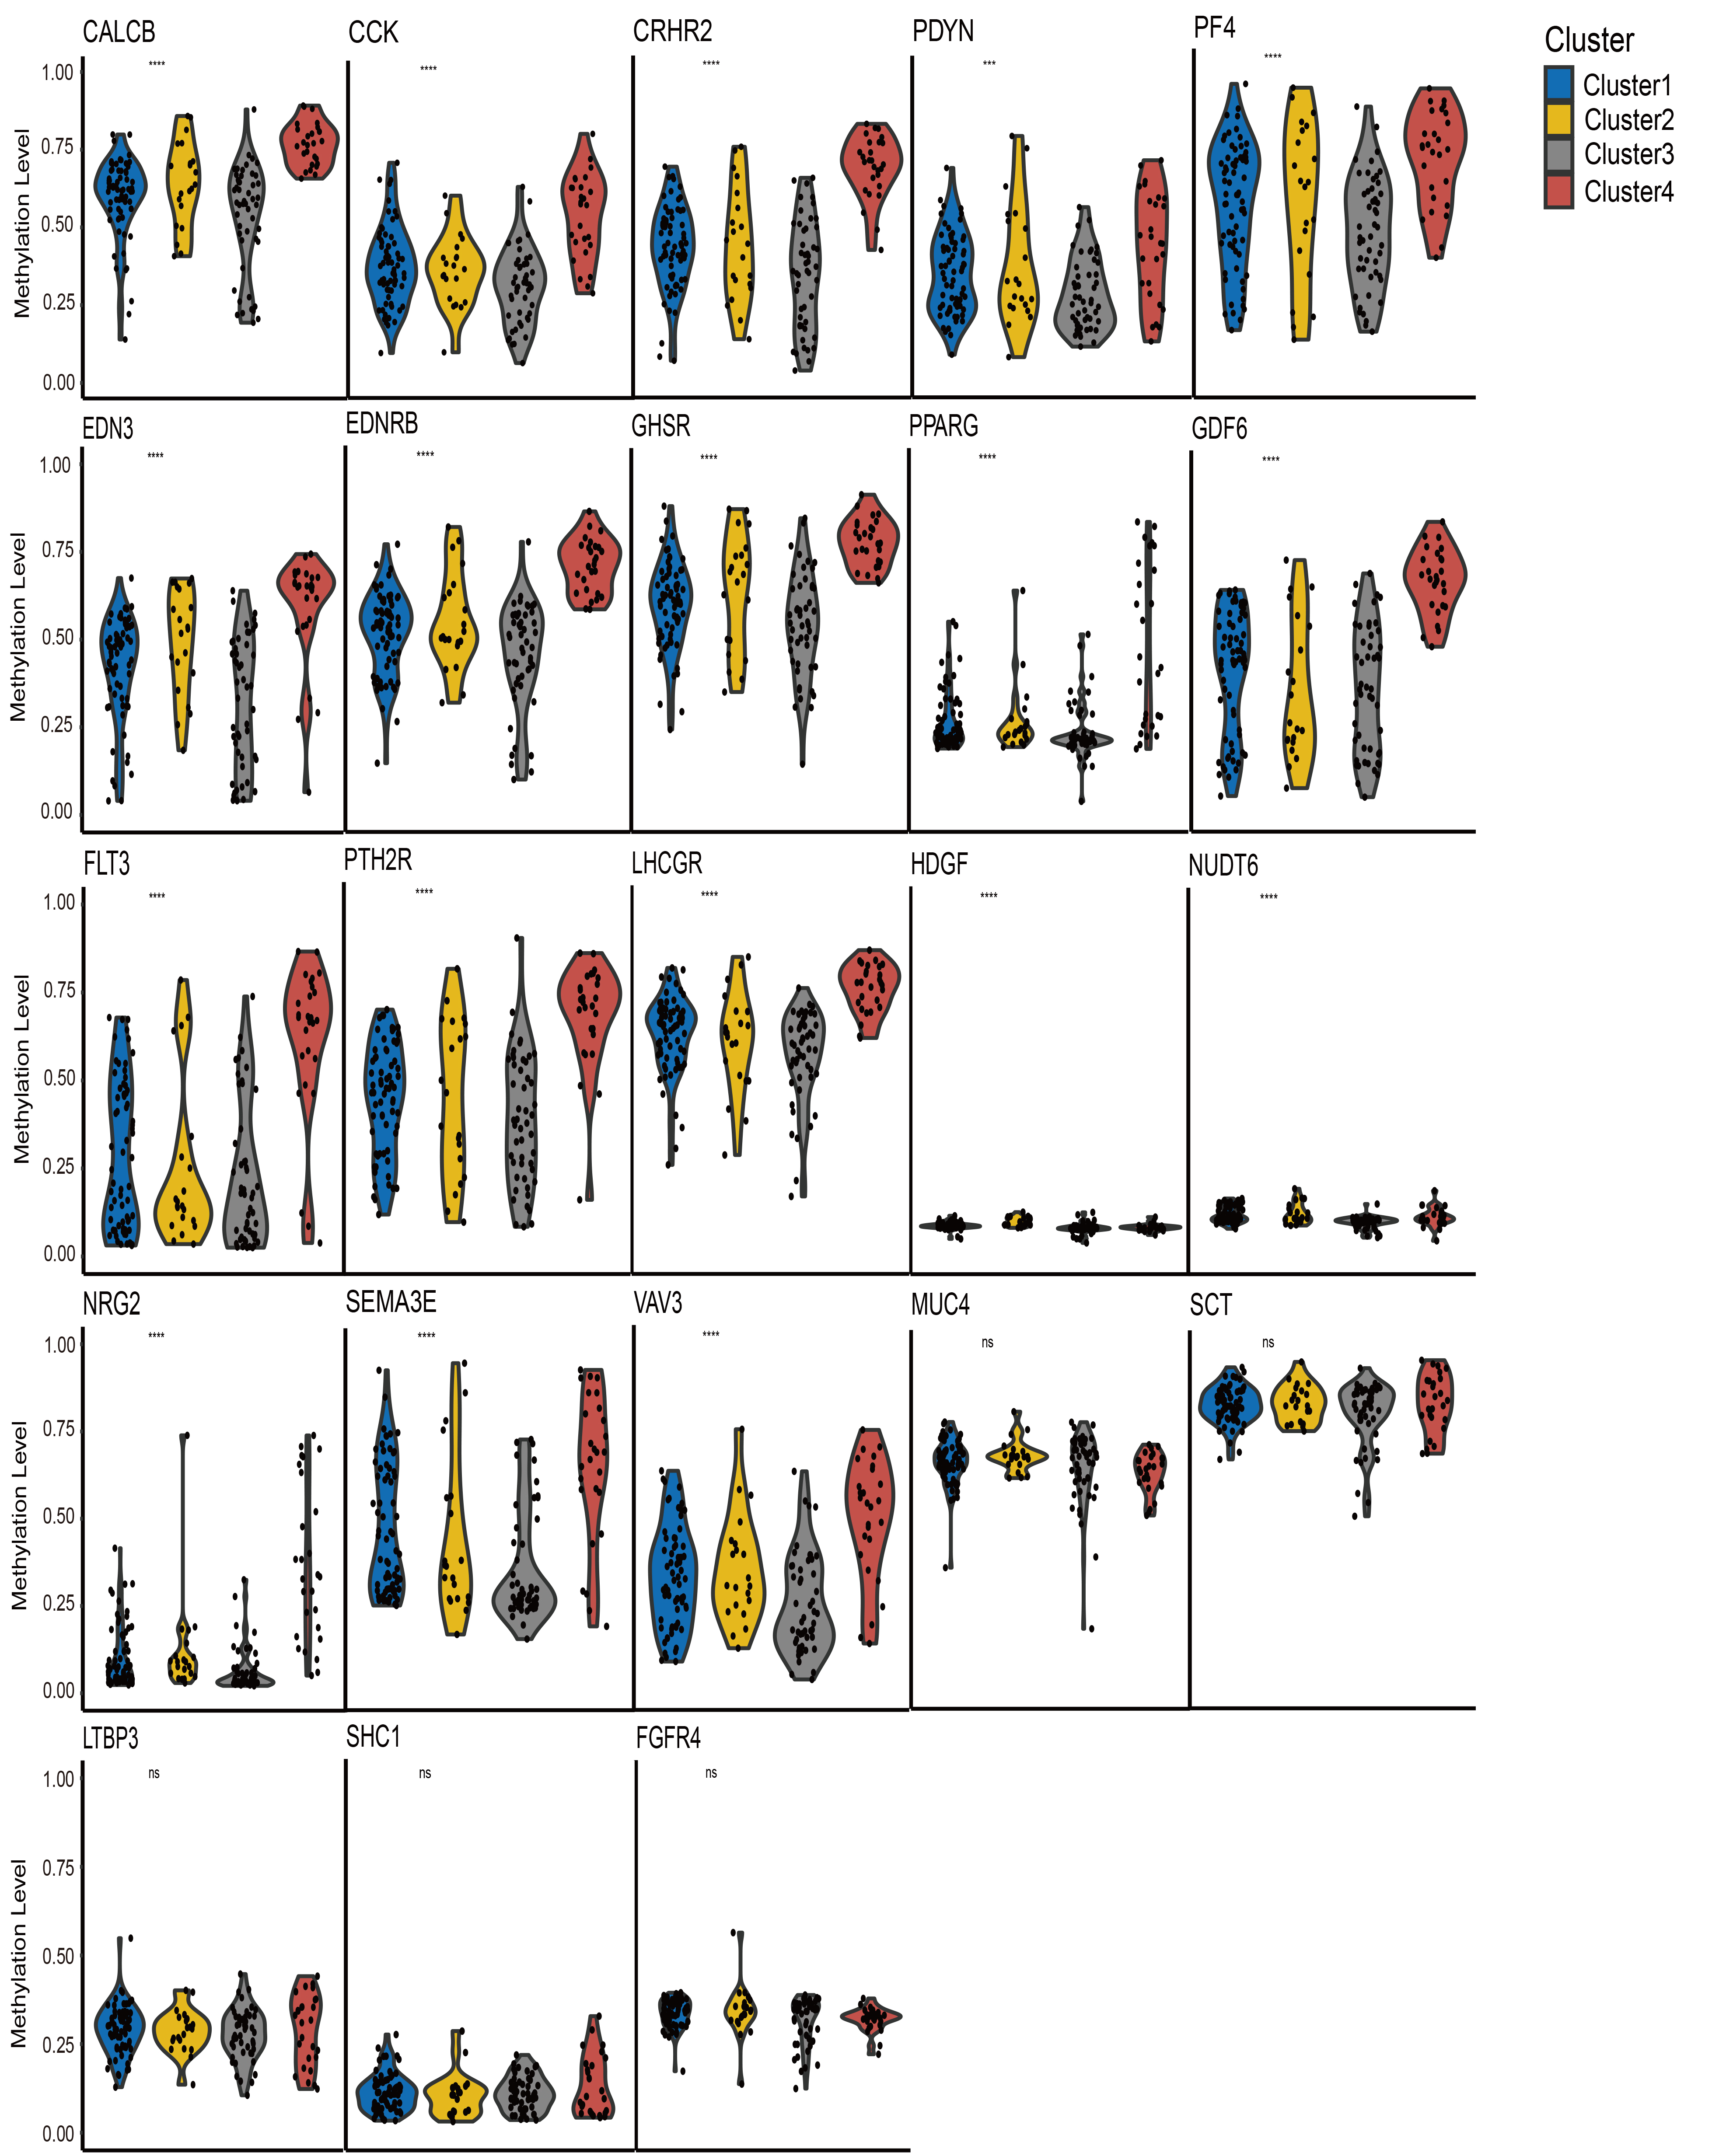 Fig. 6.
Comparison of immune gene–specific DNA methylation profiles
among the four identified clusters. Statistical significance was indicated by
asterisks and “ns”: ***p
Chemotherapy remains a cornerstone in the treatment of cervical cancer. To assess potential differences in drug response among molecular subgroups, we used the ‘oncoPredict’ R package to estimate the sensitivity of the four DNA methylation clusters to three commonly used chemotherapeutic agents. As shown in Fig. 7A, Cluster 4 exhibited relatively high predicted drug sensitivity values for three agents: cisplatin (p = 0.0132), paclitaxel (p = 0.0144), and docetaxel (p = 0.0135). In general, higher predicted sensitivity values indicate better responsiveness to chemotherapeutic agents, suggesting that patients in Cluster 4 may respond more favorably to these treatments. In terms of IC50 levels (Fig. 7B), docetaxel showed the lowest IC50 values in all clusters. A lower IC50 value indicates that a lower drug concentration is required to achieve 50% inhibition of tumor cell growth, reflecting better chemosensitivity. Accordingly, docetaxel showed the greatest predicted chemosensitivity among the three drugs.
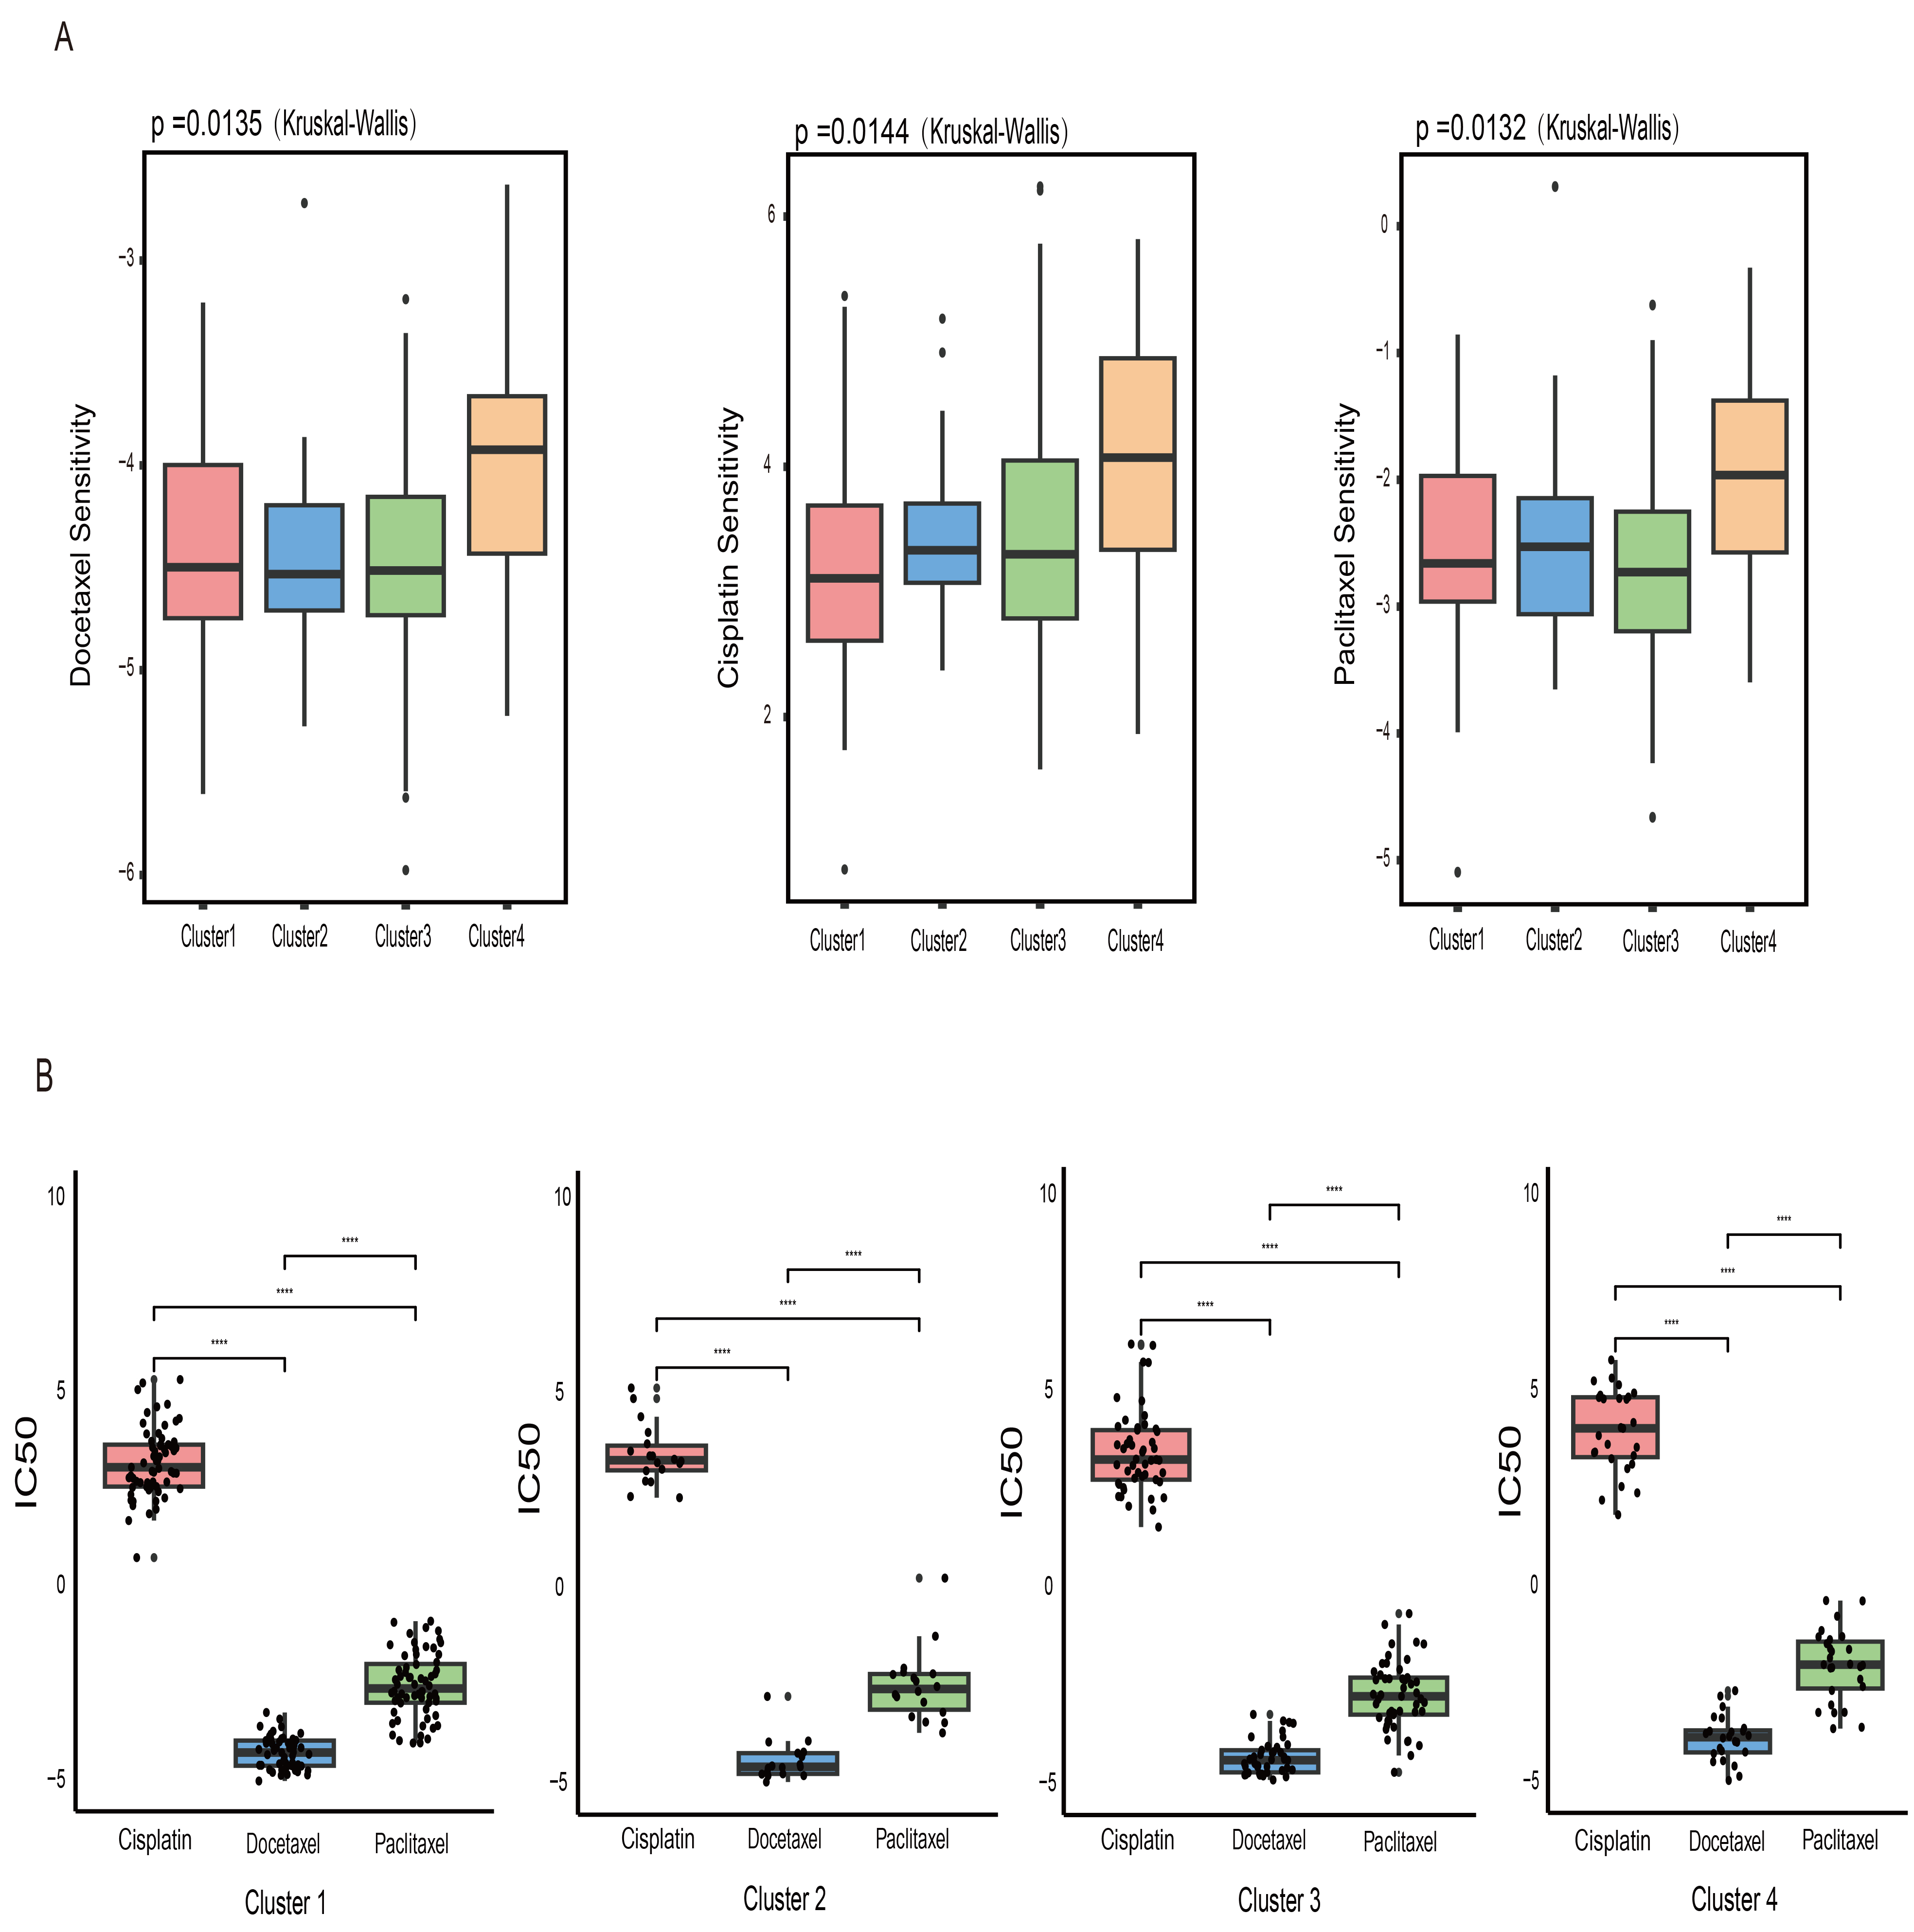 Fig. 7.
Drug sensitivity across clusters. (A) Box plot illustrating
differences in predicted drug sensitivity to three chemotherapeutic agents
(cisplatin, docetaxel, and paclitaxel) among clusters. (B) Half-maximal
inhibitory concentration (IC50) values of three chemotherapeutic drugs in four
clusters are shown. **** denotes statistically significant differences (p
Given that variations in the immune microenvironment across clusters could be reflected in pathology images, we used “CellProfiler” software to extract features from preprocessed cervical cancer pathology section images. A total of 385 image-based metrics were obtained for further analysis. The Kruskal-Wallis test identified significant differences in several image features among the four clusters. Specifically, in the four features of nucleus area, length of the transverse axis of the nucleus, maximum intensity of hematoxylin staining in the nucleus, and the proportion of staining material in the cytoplasm, Cluster 4 exhibited higher numerical features compared with the other clusters (Fig. 8A). These findings indicated that cells in Cluster 4 exhibited heterogeneity and increased proliferative activity, suggesting that the tumor tissue cells corresponding to this cluster had a higher degree of malignancy, and their biological behaviors might be more invasive.
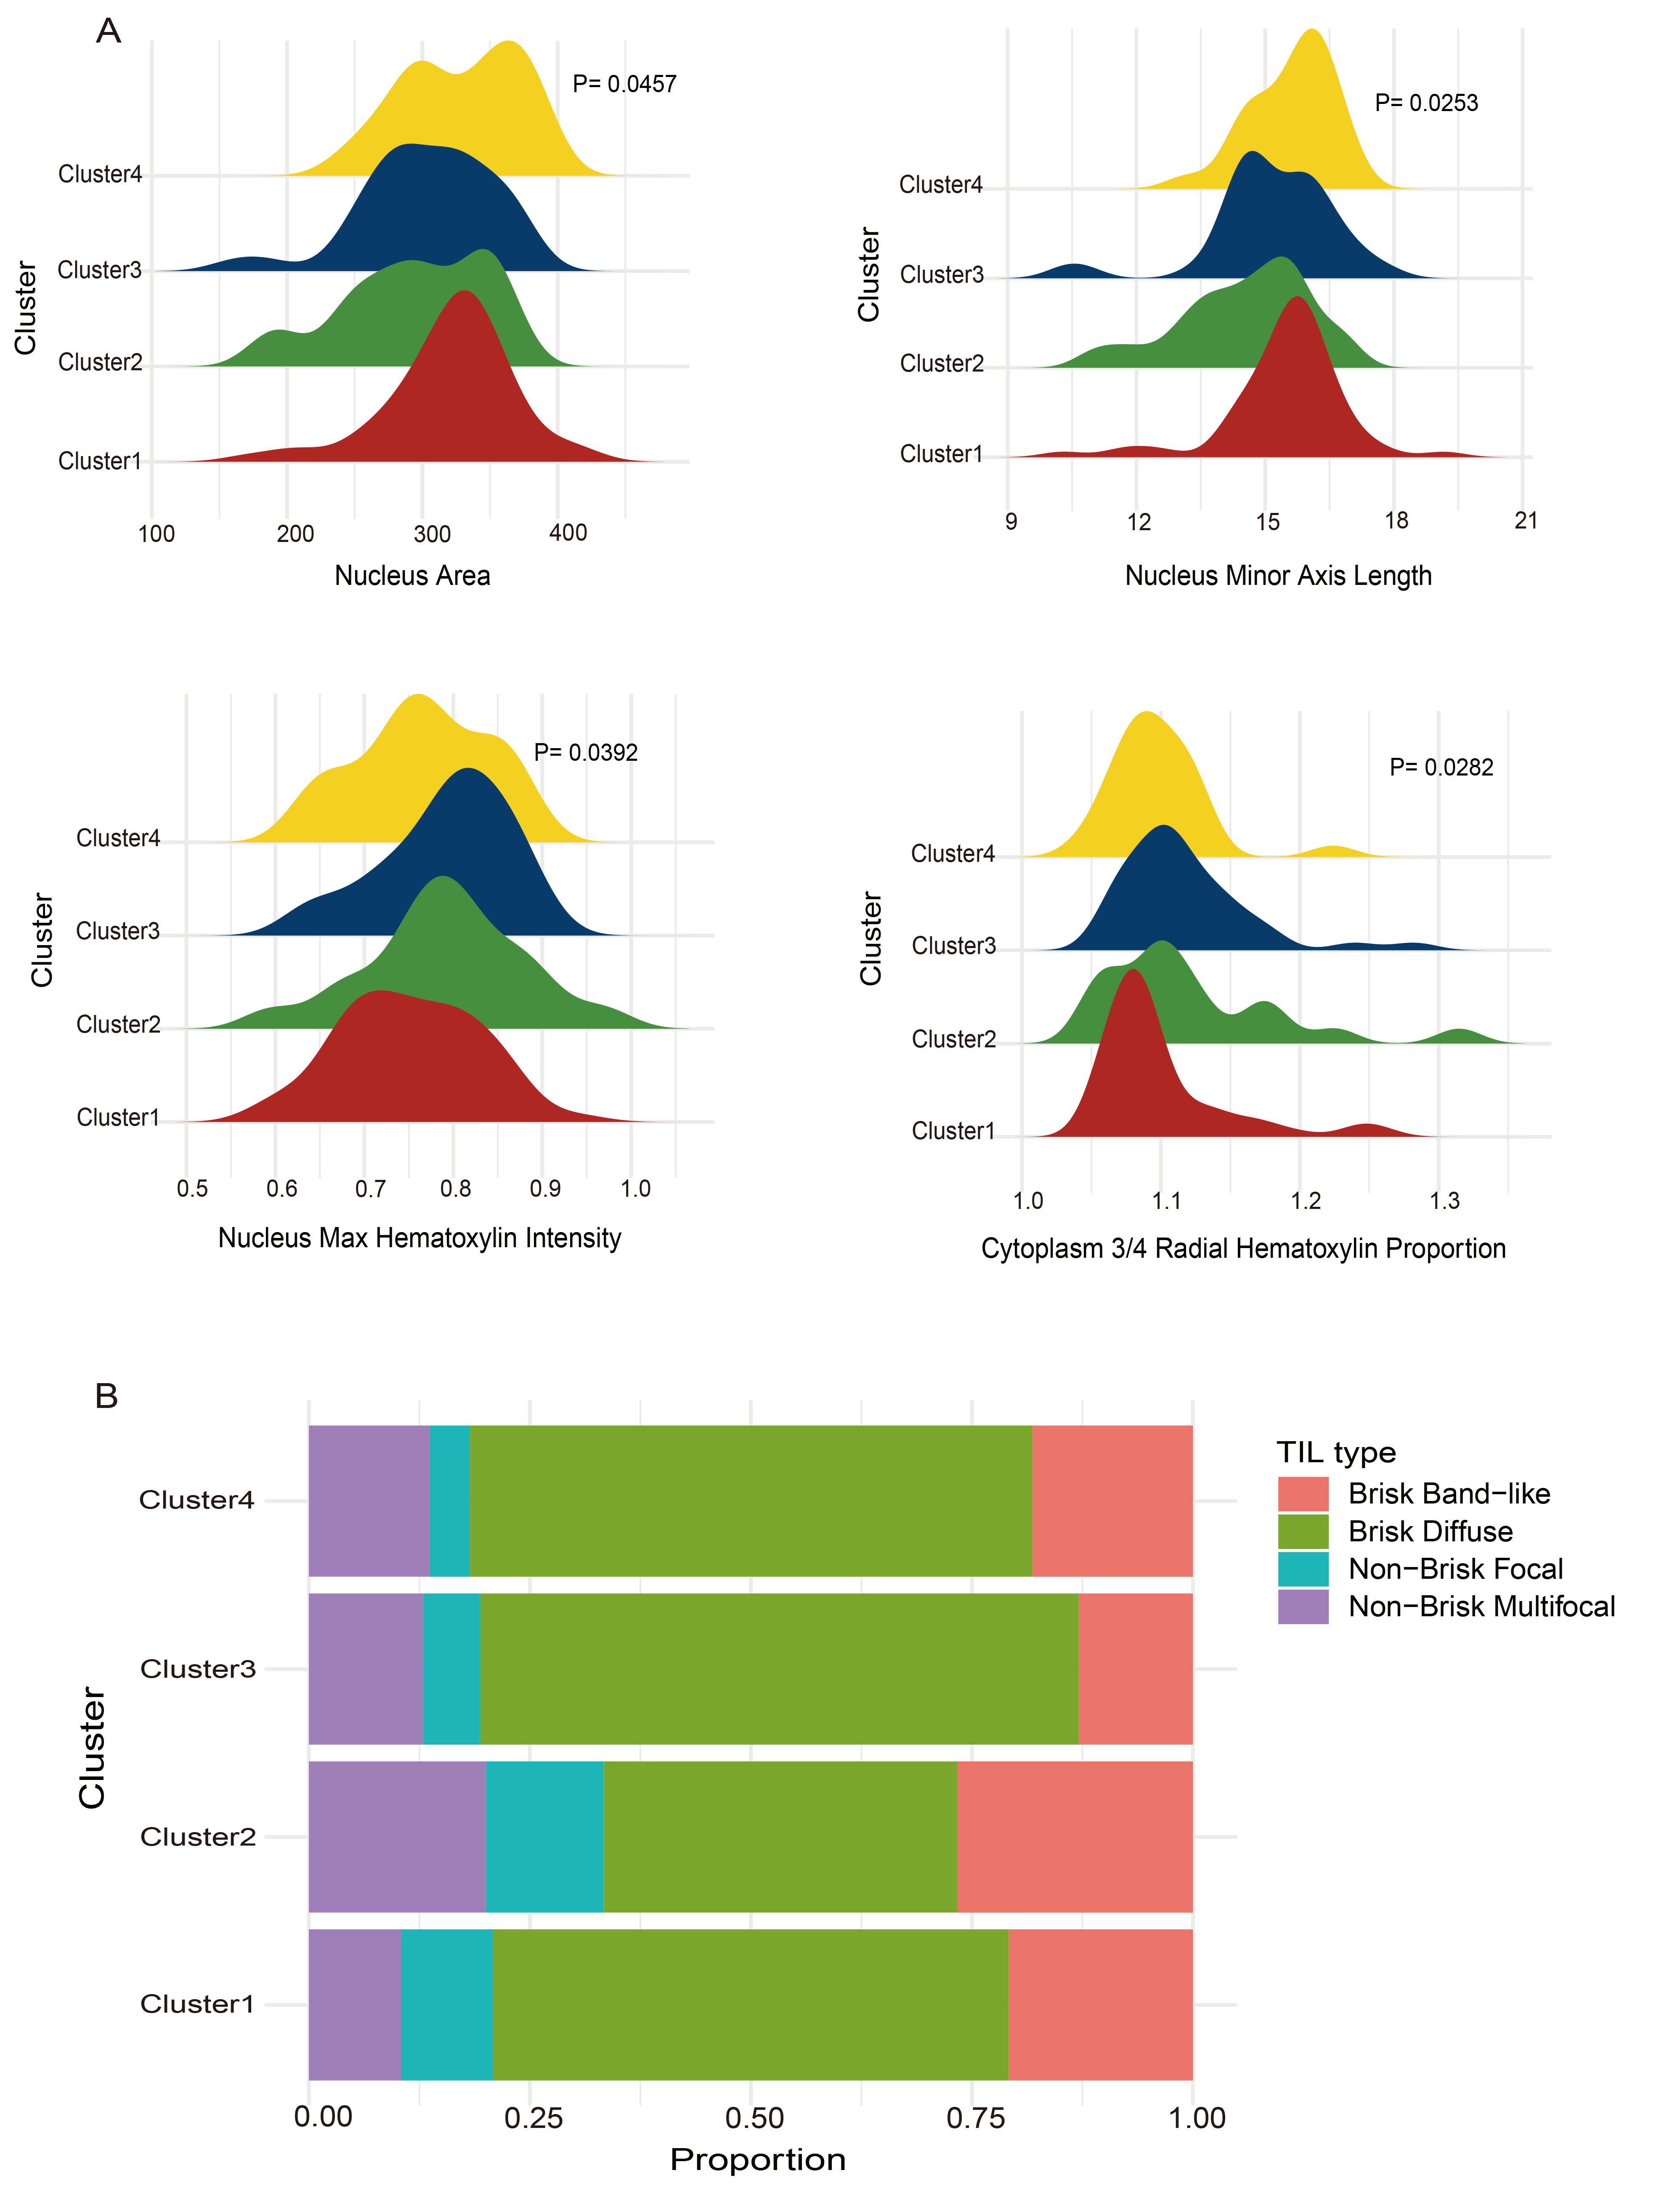 Fig. 8.
Differences in pathological features between subtypes. (A) Comparisons among the four clusters in nucleus area, length of the transverse axis of the nucleus, maximum intensity of hematoxylin staining in the nucleus, and staining material in the cytoplasm. (B) Variations in the types of tumor-infiltrating lymphocytes (TILs) among the four clusters.
In addition, the distribution of TILs in pathology images was used to assess lymphocyte localization and the strength of immune response. Fig. 8B shows variations in the composition of TIL types among clusters. In all four clusters, TILs were predominantly of the “Brisk Diffuse” type, consistent with previous descriptions in cervical cancer [19], which supports the reliability of our results. Taken together, these observations indicate that the molecular differences among subpopulations were also reflected in the spatial organization and morphological characteristics of cells. This provides morphological evidence for understanding the heterogeneity of the immune microenvironment in cervical cancer and its potential role in tumor progression.
Among female malignancies, cervical cancer ranked fourth in both incidence and mortality. According to global data, cervical cancer was the most commonly diagnosed cancer in women in 28 countries or regions, as well as the primary cause of cancer-related deaths in 42 countries or regions [23]. In recent years, cervical cancer still accounts for a substantial number of cases and deaths among women, despite the decline in morbidity and mortality due to the popularization of the HPV vaccine and advances in screening methods [24, 25]. Therefore, more sensitive molecular diagnostic markers are urgently needed to improve prognosis and increase survival rates in patients with cervical cancer.
DNA methylation is an epigenetic modification that regulates gene expression and other cellular processes [26]. In cervical cancer, it is considered one of the molecular alterations that often occur in the early stages [27]. DNA hypermethylation, mainly occurring in CpG islands within promoter regions of tumor suppressor genes, leads to functional gene silencing. In contrast, hypomethylation, typically found in repetitive genomic sequences, can disrupt cell cycle regulation and promote tumor progression [26, 28].
Whole-genome bisulfite sequencing (WGBS) is the gold standard for DNA methylation analysis [29]. However, due to its high cost and analytical complexity, DNA methylation microarrays, such as the Infinium HumanMethylation450 BeadChip, have become a practical alternative [30, 31]. In this study, we downloaded cervical cancer 450K methylation data from the TCGA database for subsequent analysis. First, we screened CpGs located in promoter regions and associated with prognosis for consensus clustering analysis, and four prognostic subgroups of cervical cancer were finally identified. The four subgroups showed significant differences in methylation levels and clinical features. Notably, these differences persisted even among patients with the same clinical stage or metastatic status. This finding highlights the molecular heterogeneity of cervical cancer and underscores the need for more refined molecular classification. The screened sites were subsequently analyzed using the QDMR method. Finally, 501 distinct hyper- and hypomethylated CpG sites were identified, mapping to 443 genes. These genes may serve as potential biomarkers for cervical cancer and as targets for precision therapy.
During tumor development, immune cells in the tumor microenvironment contribute to both tumor progression and regulation [32]. Therefore, we further investigated the relationship between the four methylation clusters and immune cell infiltration levels. The infiltration levels of central memory CD8+ T cells and effector memory CD4+ T cells were higher in Cluster 1 than in other subtypes. This finding suggests a more active immune status in Cluster 1. Given the therapeutic effects of immune checkpoint inhibitors in cervical cancer, we examined the expression profiles of immune checkpoint genes across the four subtypes. Notably, Cluster 1 showed higher expression levels of PD-L1 and CTLA-4 compared with the other groups. This difference may be related to promoter hypomethylation of these immune checkpoint genes. Cluster 4 had the lowest expression levels of PD-1, PD-L1, PD-L2, and CTLA-4. The immunologically active phenotype of Cluster 1 may make these patients more responsive to immune checkpoint blockade therapies. In addition, we compared pathologic features among the four subtypes. The subtypes differed significantly in features such as nucleus area and nucleus transverse axis length. These findings further support a correlation between molecular subtypes and pathologic features.
Despite these meaningful findings, several limitations should be acknowledged. First, the univariate and multivariate analyses did not apply multiple testing corrections (e.g., false discovery rate, FDR). However, the results were largely consistent with known biological mechanisms, indicating that the conclusions remain informative. Second, although specific CpG sites and their corresponding genes were identified as potential biomarkers, their clinical utility has not yet been validated. This study relied exclusively on public DNA methylation and transcriptomic datasets, without independent cohort validation or experimental confirmation. The functional characteristics of the identified methylation subtypes were inferred through multi-omics analyses, including gene expression profiling and immune landscape evaluation. However, further experimental studies—such as methylation-specific PCR (MSP), quantitative RT-PCR, or immunohistochemistry (IHC) using well-annotated cervical cancer tissue samples—are needed to validate these findings and assess their translational potential. Incorporating these validation steps in future will strengthen the clinical applicability of the identified CpGs and provide a more robust basis for individualized therapy and prognostic stratification.
In conclusion, this study used bioinformatics approaches to analyze cervical cancer methylation data from the TCGA database, identifying four distinct molecular subgroups with different prognostic outcomes. These subgroups showed distinct patterns in immune cell infiltration, pathological characteristics, and clinical parameters, underscoring the molecular and immunological heterogeneity of cervical cancer. The identified CpGs and corresponding genes may serve as biomarkers for precision therapy and as potential targets for developing personalized treatment strategies. Overall, our findings indicate that DNA methylation-based molecular subgroups capture cervical cancer heterogeneity and help address the gap in understanding its molecular and immunological diversity.
Although this study relied on retrospective public datasets and requires further experimental validation, its findings provide a basis for improved prognostic stratification and more precise, individualized treatment planning. Future research focusing on functional characterization and clinical validation of the identified CpGs and genes will enhance their translational potential.
TCGA, The Cancer Genome Atlas; FIGO, International Federation of Gynecology and Obstetrics; KNN, The K-nearest Neighbors; GEO, Gene Expression Omnibus; QDMR, Quantitative Differentially Methylated Regions; DMRs, Differentially Methylated Regions; GO, Gene Ontology; KEGG, Kyoto Encyclopedia of Genes and Genomes; BP, Biological Process; MF, Molecular Function; CC, Cellular Component; ROC, Receiver Operating Characteristic; IC50, Half-maximum Inhibitory Concentration; TILs, Tumor-Infiltrating Lymphocytes; SNPs, Single Nucleotide Polymorphisms; CDF, Cumulative Distribution Function; CTL, Cytotoxic T lymphocytes; AUC, The Area Under the Curve; TME, The Tumor Microenvironment; ssGSEA, single-sample Gene Set Enrichment Analysis; WGBS, Whole-Genome Bisulfite Sequencing; HPV, Human Papillomavirus; TNM, Tumor-Node-Metastasis; CTLA-4, Cytotoxic T-Lymphocyte-Associated Protein 4; PD-1, Programmed Death 1; PD-L1, Programmed Death Ligand 1; PD-L2, Programmed Death Ligand 2; PAX1, paired box 1; SOX1, SRY-box transcription factor 1; NK, Natural Killer (Cells); NKT, Natural Killer T (Cells); FDR, False Discovery Rate.
The data generated in this study are described in the supplementary information and are available from the corresponding author upon reasonable request. DNA methylation and RNA-Seq transcriptome data of cervical cancer were obtained from the UCSC Xena database (https://xenabrowser.net/datapages/). For external validation, the independent dataset GSE44001 was downloaded from the Gene Expression Omnibus (GEO) database. All data reported in this paper will also be shared by the lead contact upon request.
YZhao, CZ, JZ, SL, and YZhang designed the study; YZhao, CZ, and JZ performed bioinformatics analyses; YZhao, SZ, YL, YW, and YM helped with the tables and figures; YZhao, CZ, SL, and YZhang periodically discussed; YZhao wrote the paper; SL and YZhang supervised the study. All authors contributed to editorial changes in the manuscript. All authors read and approved the final manuscript. All authors have participated sufficiently in the work and agreed to be accountable for all aspects of the work.
Ethical approval was obtained from the original studies that generated the publicly available TCGA and GEO datasets. Therefore, no additional ethics approval or informed consent was required for this study.
Not applicable.
This study was supported by the National Natural Science Foundation of China (No. 82271880, 82303691) and the “Nn10 Program” of the Harbin Medical University Cancer Hospital (Nn102024-03).
The authors declare no conflict of interest.
During the preparation of this work, the authors used ChatGPT in order to check spelling and grammar. After using this tool, the authors reviewed and edited the content as needed and take full responsibility for the content of the publication.
Supplementary material associated with this article can be found, in the online version, at https://doi.org/10.31083/FBL45025.
References
Publisher’s Note: IMR Press stays neutral with regard to jurisdictional claims in published maps and institutional affiliations.