


 , Xu Han 1, Haiyin An 1, Jialiang Fan 1, Junyi Li 1, Ting Xiao 1, Lin Feng 1, Shujun Cheng 1,*
1 State Key Laboratory of Molecular Oncology, Department of Etiology and Carcinogenesis, National Cancer Center/National Clinical Research Center for Cancer/Cancer Hospital, Chinese Academy of Medical Sciences and Peking Union Medical College, 100020 Beijing, China
Abstract
Esophageal squamous cell carcinoma (ESCC) develops through a multistage process in which normal epithelium transitions into intraepithelial neoplasia and ultimately into invasive carcinoma. Elucidating the molecular changes and functional roles of key genes during this progression is critical for understanding the mechanisms underlying this malignant transformation.
Transcriptomic profiles of 12 normal esophageal tissues, 5 intraepithelial neoplasia tissues, and 7 ESCC tissues were analyzed via microarray. Stage-specific transcriptomic changes were systematically compared to delineate the phenotypic evolution that occurs during carcinogenesis, with a particular focus on identifying pivotal genes that regulate the precancerous-to-malignant transition. The candidate gene LINC01605 was further examined via the following approaches: (1) bioinformatics-based characterization of its tumor-associated functions using Genotype-Tissue Expression Project (GTEx) normal tissue and The Cancer Genome Atlas Program (TCGA) ESCC transcriptome; (2) functional validation in ESCC cell lines in which the gene was silenced or overexpressed in vitro; and (3) mechanistic exploration of RNA-binding partners via streptavidin bead-based RNA pull-down assays.
Multistage transcriptomic analysis revealed the progressive acquisition of cancer hallmarks during ESCC development. The transition from precancerous lesions to invasive carcinoma was characterized by epithelial dedifferentiation, extracellular matrix remodeling, and angiogenesis. LINC01605, which is a long noncoding RNA (lncRNA), was downregulated during this transition. GTEx revealed that LINC01605 was specifically expressed in the squamous epithelium of the esophagus and that its expression was negatively correlated with histological grade in the TCGA-ESCC dataset. Samples with high LINC01605 expression and those with low LINC01605 expression in the TCGA dataset exhibited significant functional differences in epithelial cell differentiation, proliferation, and migration, as well as in the extracellular matrix. Knocking down LINC01605 increased proliferation and migration in both the normal immortalized esophageal epithelial cell line NE3 and the ESCC cell line KYSE180. Conversely, the overexpression of LINC01605 isoforms suppressed these malignant phenotypes. RNA pull-down revealed potential interactions between LINC01605 and aurora kinase B (AURKB), which are components of the chromosomal passenger complex (CPC), suggesting its involvement in regulating the cell cycle.
LINC01605 functions as a tumor suppressor in ESCC by maintaining squamous cell differentiation and inhibiting proliferation and migration. LINC01605 downregulation facilitates malignant transformation during esophageal carcinogenesis.
Keywords
- esophageal squamous cell carcinoma
- LINC01605
- RNA, long noncoding
- anaplasia
- carcinogenesis
According to GLOBOCAN 2022 data, 510,000 new cases of esophageal cancer are diagnosed annually worldwide, with 43.8% diagnoses occurring in China. Esophageal squamous cell carcinoma (ESCC) represents the predominant histological subtype of esophageal cancer, accounting for approximately 85% of all esophageal malignancies worldwide and 95.5% of cases in China [1]. The current first-line therapy for treating advanced ESCC involves programmed cell death protein-1 (PD-1) inhibitors combined with chemotherapy; however, long-term survival rates remain suboptimal, with a median overall survival time of 15.3 months and a 3-year survival rate of only 25.6% [2]. Early detection and intervention remain critical for improving patient outcomes. Elucidating the molecular changes that occur during ESCC progression, particularly identifying key drivers of the transition from nonmalignant precancerous lesions to invasive carcinoma, is essential for developing early intervention strategies and discovering novel therapeutic targets.
Over the past decade, large-scale genomic sequencing studies of ESCC have been conducted worldwide. Early sequencing efforts focused primarily on comparative genomic analyses involving tumor tissues and adjacent normal tissues and identified high-frequency somatic changes in genes such as TP53, CDKN2A, FAT1, NOTCH1, PIK3CA, KMT2D, and NFE2L2 as drivers of esophageal squamous carcinogenesis [3]. The progression from normal esophageal epithelium to ESCC occurs over decades, and esophageal squamous intraepithelial neoplasia (EIN) has been recognized as the established precursor lesion [4]. Liu et al. [5] and Chen et al. [6] demonstrated substantial genomic similarities between EIN and ESCC via comparative sequencing analyses that included single nucleotide variants (SNVs) and copy number variations (CNVs). Their studies revealed that clonal mutations that are prevalent in ESCC tissues are already abundant in EIN tissues, indicating that esophageal carcinogenesis initiates as a heterogeneous clonal evolution process that begins in the early precancerous stage. Subsequent multistage analyses by Chang et al. [7] revealed that dynamic clonal shifts occur during malignant progression, notably a transition from NOTCH1-mutant dominant clones to TP53-mutant dominant populations. Their work identified biallelic TP53 inactivation as the earliest event that drives the formation of premalignant lesions, whereas later stages of carcinogenesis were driven by the accumulation of CNVs and Apolipoprotein B mRNA Editing Catalytic Polypeptide-like (APOBEC)-associated mutagenesis following TP53 mutation. However, the key factor that leads to the transformation of EIN into ESCC remains unclear.
Recent technological advances over the past three years have enabled the
performance of multiple transcriptomic studies to investigate multistage
esophageal squamous carcinogenesis. Chen et al. [8] used spatial
transcriptomic profiling to demonstrate that abnormal epithelial cell
interactions in the basal layer of precancerous lesions promote esophageal
tumorigenesis by coordinating epithelial‒mesenchymal transition (EMT) and the
acquisition of hyperproliferative phenotypes. These interactions are mediated by
the TP53-TP63/
Notably, these studies identified functionally relevant genes that exhibit aberrant expression patterns during esophageal carcinogenesis. Epithelial-specific dysregulation of deltex E3 ubiquitin ligase 3L (DTX3L), along with stromal overexpression of bone marrow stromal cell antigen 2 (BST2) [10], has been mechanistically associated with malignant transformation. However, emerging evidence highlights that ESCC development represents a highly heterogeneous evolutionary process that involves the dynamic interplay between subclones of epithelial cells and microenvironmental components and that this interplay begins in the precancerous stage. While numerous genomic and transcriptomic aberrations have been identified, the critical determinants that enable high-grade intraepithelial neoplasia to cross the malignant threshold, particularly the master regulators that orchestrate this phenotypic transition, remain incompletely characterized.
A total of 29 prospectively collected tissue samples from 12
treatment-naïve ESCC patients and dysplastic patients were analyzed in this
study. The cohort included five dysplastic lesions with matched incisional margin
tissues and distal normal mucosa that were obtained via endoscopic resection
procedures and seven paired ESCC tumor and normal tissue samples at the Cancer
Hospital of Chinese Academy of Medical Sciences (Beijing, China). All the samples
were immediately preserved in RNAlater™ Stabilization Solution
(Cat#AM7021, Thermo Fisher Scientific, Waltham, MA, USA) for
Total RNA isolation was performed with the RNeasy Micro Kit (Cat#74104, Qiagen,
Germantown, MD, USA) following the manufacturer’s protocols for processing frozen
tissues. RNA quantity and quality were systematically assessed using
dual-platform validation: concentration measurements were performed with a
NanoDrop2000 spectrophotometer (Thermo Fisher Scientific, Waltham, MA, USA), and
integrity evaluation was performed with the Agilent 2100 Bioanalyzer System
(Agilent Technologies, Santa Clara, CA, USA). All the RNA samples met stringent
quality control criteria (total yield
The data used for the analyses described in this manuscript were obtained from
the Genotype-Tissue Expression Project (GTEx) Portal on 09/15/2023 and the
log2(FPKM+0.001)-transformed transcriptome data of pancancer cohorts in the The
Cancer Genome Atlas Program (TCGA) and normal tissues of normal tissues in the
GTEx project, which were uniformly processed by the UCSC Toil RNA-seq Recompute
Compendium without computational batch effect adjustment, were downloaded from
UCSC Xena. Differential gene expression analysis was performed using the
gtools R package (Version3.8.1) to identify statistically significant
changes in transcription patterns. Pathway enrichment and tumor biology
characterization were conducted with the gene set variation analysis
(GSVA) package. Functional annotation of the gene ontology (GO) terms
was systematically explored using the clusterProfiler R package (Version
2.99.2). The corresponding GO terms of cancer hallmarks were found in the
literature [11]. Pairwise comparative analyses between the normal (N), dysplastic
(D), and tumor (T) groups were performed using two-tailed Student’s t
tests. To ensure biological relevance while maintaining analytical rigor, we
established stringent differential expression criteria: genes with a p
value
ESCC cell lines used in this study were originally sourced from the Japanese Collection of Research Bioresources (JCRB Bank, Osaka, Japan). The Immortalized esophageal epithelial cell lines NE2 and NE3 were a generous gift from Prof. Tong Tong (State Key Laboratory of Molecular Oncology, National Cancer Center/National Clinical Research Center for Cancer/Cancer Hospital, Beijing, China). All cellular materials have been preserved and routinely maintained in our laboratory’s cell culture facility according to standard protocols. All the cell lines that were used in this study were confirmed by STR profiling and tested negative for mycoplasma. The ESCC cell lines were cultured in RPMI-1640 medium (Gibco, # C11875500CP, Thermo Fisher Scientific, Waltham, MA, USA) supplemented with 10% heat-inactivated fetal bovine serum (FBS; Life Technologies, Grand Island, NY, USA) in 5% CO2 at 37 °C. Immortalized esophageal epithelial cell lines (NE2 and NE3) were maintained in a 1:1 mixture of defined Keratinocyte-SFM (dKSFM; Gibco, #17005-042, Thermo Fisher Scientific, Waltham, MA, USA) and Epithelial Cell Medium (Epife; Gibco, #A10008-01, Thermo Fisher Scientific, Waltham, MA, USA), and optimal growth conditions for promoting normal epithelial phenotypes were maintained.
The 5′ and 3′ ends of cDNA were experimentally resolved using the SMARTer® RACE 5′/3′ Kit (Cat# 634859, Takara Bio, Mountain View, CA, USA) following standardized protocols. In brief, total RNA from NE3 cells was treated with RNase-free DNase I (Cat#2270A, Takara Bio, Mountain View, CA, USA) to eliminate genomic DNA contamination. Then, 3′ RACE-ready cDNA was synthesized from 1 µg of RNA using 3′-CDS Primer A. Next, 5′ RACE-ready cDNA was generated with the 5′-CDS Primer and SMARTer II A Oligo. Gene-specific RACE primers were designed on the basis of the NCBI reference sequence (NR_121620.2) and microarray probe alignment; the primers were designed to have an optimal Tm, and secondary structure formation was avoided. The Advantage® GC 2 PCR Kit (Cat#639119, Takara Bio, Mountain View, CA, USA) was used to address challenges related to the template GC content (65–75%). Then, amplified bands were separated by 1.5% agarose gel electrophoresis, extracted from the gels (Qiagen Gel Extraction Kit), cloned, inserted into the pEASY®-T1 Cloning Vector (Cat#CT101-01, TransGen Biotech, Beijing, China), and subjected to bidirectional Sanger sequencing (10+ clones per band).
The transcript-specific primers were designed on the basis of 5′/3′ RACE-defined terminal sequences of full-length LINC01605 transcripts. The EcoRI and XhoI restriction site sequences were added to the 5′ ends of the forward primer and reverse primer, respectively. The full-length LINC01605 transcript sequence without the poly A tail was amplified from cell-derived cDNA by Polymerase Chain Reaction (PCR), and then, it was cloned and inserted into the EcoRI/XhoI sites of the mammalian expression vectors pcDNA3.1(+) and pcDNA3.1(–) (Cat#V790-20 and Cat#V795-20, Invitrogen, Carlsbad, CA, USA) to generate the pcDNA3.1(+)-LINC01605 vector and pcDNA3.1(–)-LINC01605.
LINC01605-specific siRNA and scrambled negative control siRNA were purchased from Invitrogen (Carlsbad, CA, USA). The LINC01605 plasmid was constructed as described above. Cells were seeded in 6-well plates in antibiotic-free medium, and after 24 hrs of incubation, the cells had reached 50% (siRNA) or 80% (plasmid) confluence. Transfection complexes containing 100 nM siRNA or 2 µg of plasmid and Lipofectamine™ 3000 (L3000001, Thermo Fisher Scientific, Waltham, MA, USA) were prepared in Opti-MEM® (Gibco, #31985070, Thermo Fisher Scientific, Waltham, MA, USA) at a 1:2 (v/v) lipid:nucleic acid ratio. The complexes were then added dropwise to the cells, the cells were incubated for 6 hrs, and then, the medium was replaced with complete medium. The knockdown/overexpression efficiency was assessed 48 hrs posttransfection via quantitative real-time PCR (qRT‒PCR) with TaqMan™ assays, and gene expression was normalized to GAPDH expression. Functional assays were conducted between 24 and 72 hrs posttransfection.
Cell proliferation rates were measured with the Cell Counting Kit-8 (CCK-8) assay
or the xCELLigence Real-Time Cell Analyzer (RTCA)-MP (Acea Biosciences/Roche
Applied Science, San Diego, CA, USA) system. KYSE180 and KYSE30 cells were
transfected with the pCDNA3.1(+)-LINC01605 plasmid or control plasmid,
and KYSE180 and NE3 cells were transfected with LINC01605-targeting siRNA or
negative control siRNA. After 24 hrs, the cells were seeded in 96-well plates at
a concentration of 2000 cells/100 µL of culture medium per well. For assays
involving the xCELLigence Real-Time Cell Analyzer (RTCA)-MP system, the machine
automatically measures electrical impedance every 15 min to determine cell
proliferation in real time. At the end of the experiment, the proliferation rate
determined by measuring the electrical impedance was plotted as a cell index
After being transfected with the LINC01605 plasmid or
LINC01605-targeting siRNA for 48 hrs, the cells were resuspended in serum-free
medium and added to the upper chamber of a Transwell plate with 6.5 mm-diameter
chambers and an 8.0-µm pore size (Cat#3422, Corning, Corning, NY,
USA). For KYSE180 cells, 3~4
Total RNA was extracted from the ESCC cell lines and esophageal epithelial tissues with the TRIzol reagent (Cat# 15596018CN, Invitrogen, Carlsbad, CA, USA). Two micrograms of RNA were reverse transcribed into cDNA with random primers and M-MLV reverse transcriptase (Cat#M1701, Promega, Madison, WI, USA) according to the manufacturer’s instructions. qRT‒PCR was conducted with the SYBR Premix Ex TaqTM II (Tli RNase H Plus) kit (Cat#RR820A, TaKaRa, Kyoto, Japan) and an Applied Biosystems V7000 instrument (Thermo Fisher Scientific, Waltham, MA, USA). GAPDH was used as an internal reference for normalization. The PCR conditions were as follows: 30 s at 95 °C for preincubation and then 5 s at 95 °C and 31 s at 60 °C for 40 amplification cycles. The primers that were used were as follows:
LINC01605 forward: AAGCAGAAGACCCTCCTCAAAG.
LINC01605 reverse: GATCCAAGCACAGTCCCAGAA.
GAPDH forward: GAGAAGGCTGGGGCTCATTT.
GAPDH reverse: AGTGATGGCATGGACTGTGG.
An RNA pull-down assay was performed as previously described [12]. The
pCDNA3.1(+)-LINC01605 and pcDNA3.1(–)-LINC01605 plasmids were
linearized with the restriction enzymes corresponding to the sequences that were
added to the 3′ end of the template DNA for vector cloning to conduct the
in vitro transcription of LINC01605 and its antisense sequence.
In vitro transcription was conducted using the MEGAscript T7 Kit
(Cat#AM1333, Ambion, Austin, TX, USA). Total RNA was labeled with biotin-16-UTP
(Cat#AM8452, Ambion, Austin, TX, USA) during transcription and purified with the
MEGAclear Kit (Cat#AM1908, Ambion, Austin, TX, USA) according to the
manufacturer’s instructions. Five micrograms of biotinylated RNA were heated to
95 °C for 2 min, cooled on ice for 3 min, and then incubated at room
temperature for 30 min. RNA were mixed with 500 µg of
precleared NE3 cell extracts in binding buffer (10 mM HEPES pH
7.0, 50 mM KCl, 10% glycerol, 1 mM EDTA,
1 mM DTT, 0.5% Triton X-100) supplemented with tRNA (0.1
µg/µL), heparin (0.5 µg/µL) and RNasin (1 unit), and
then, the mixtures were incubated at room temperature for 30 min. Fifty
microliters of washed streptavidin agarose beads (Cat#SA10004, Invitrogen,
Carlsbad, CA, USA) were added to each binding reaction, and the reactions were
further incubated at room temperature for 15 min. The beads were
washed five times with binding buffer and boiled in 1
KYSE30 cells were transfected with the pCDNA3.1(+)-LINC01605
recombinant plasmid or pCDNA3.1(+)-NC plasmid. 24 hrs after transfection, the
cells were incubated in serum-free RPMI-1640 medium for 24 hrs to induce cell
cycle arrest at the G0/G1 phase in order to synchronize the cell cycle. After the
cells were serum starved, the medium was replaced with complete medium
supplemented with 10% fetal bovine serum (FBS; Gibco, Thermo Fisher Scientific,
Waltham, MA, USA) and cultured for an additional 24 hrs to allow proliferation to
resume. The cells were digested with trypsin, washed twice with ice-cold
phosphate-buffered saline (PBS; 1000
Unless otherwise specified, all comparative tests in this study were performed
using unpaired t-tests implemented in GraphPad Prism 7.0 (San Diego, CA, USA). A
threshold of p
We performed expression microarray profiling of 29 clinical samples, including 7 ESCC tissue (T) and paired adjacent normal tissue (N) samples from 7 patients with advanced ESCC and 5 severe dysplasia tissue (D), 5 dysplastic margin tissue (Q), and 5 paired normal tissue (N) samples from 5 patients with dysplasia. A total of 18,681 probes corresponding to 13,453 genes positively recognized their targets across the cohort.
Guided by Hanahan and Weinberg’s seminal framework of cancer hallmarks [13], we performed GSVA [14] to map hallmark activation patterns (Fig. 1A). Transcriptomic profiling revealed that despite the lack of malignant transformation, severe dysplasia tissue samples already exhibited activation of four core oncogenic hallmarks: replicative immortality, sustained proliferative signaling, evasion of growth suppression and genome instability and mutation. Notably, these precancerous lesions maintained near-normal expression patterns of genes related to energy metabolism reprogramming, apoptosis resistance, and angiogenesis activation. Hallmarks of advanced malignancy, including tissue invasion/metastasis, tumor-promoting inflammation, and immune evasion, demonstrated progressive activation from dysplasia to carcinoma. While incipient activation trends were observed in the dysplasia tissues samples, the magnitudes of these trends remained orders of magnitude below the levels observed in carcinomas. These findings are consistent with the results of previous multiomics studies, establishing that in early stages of esophageal carcinogenesis, epithelial-intrinsic alterations are prioritized, whereas progression to invasive carcinoma requires microenvironmental reprogramming and interactions with the microenvironment.
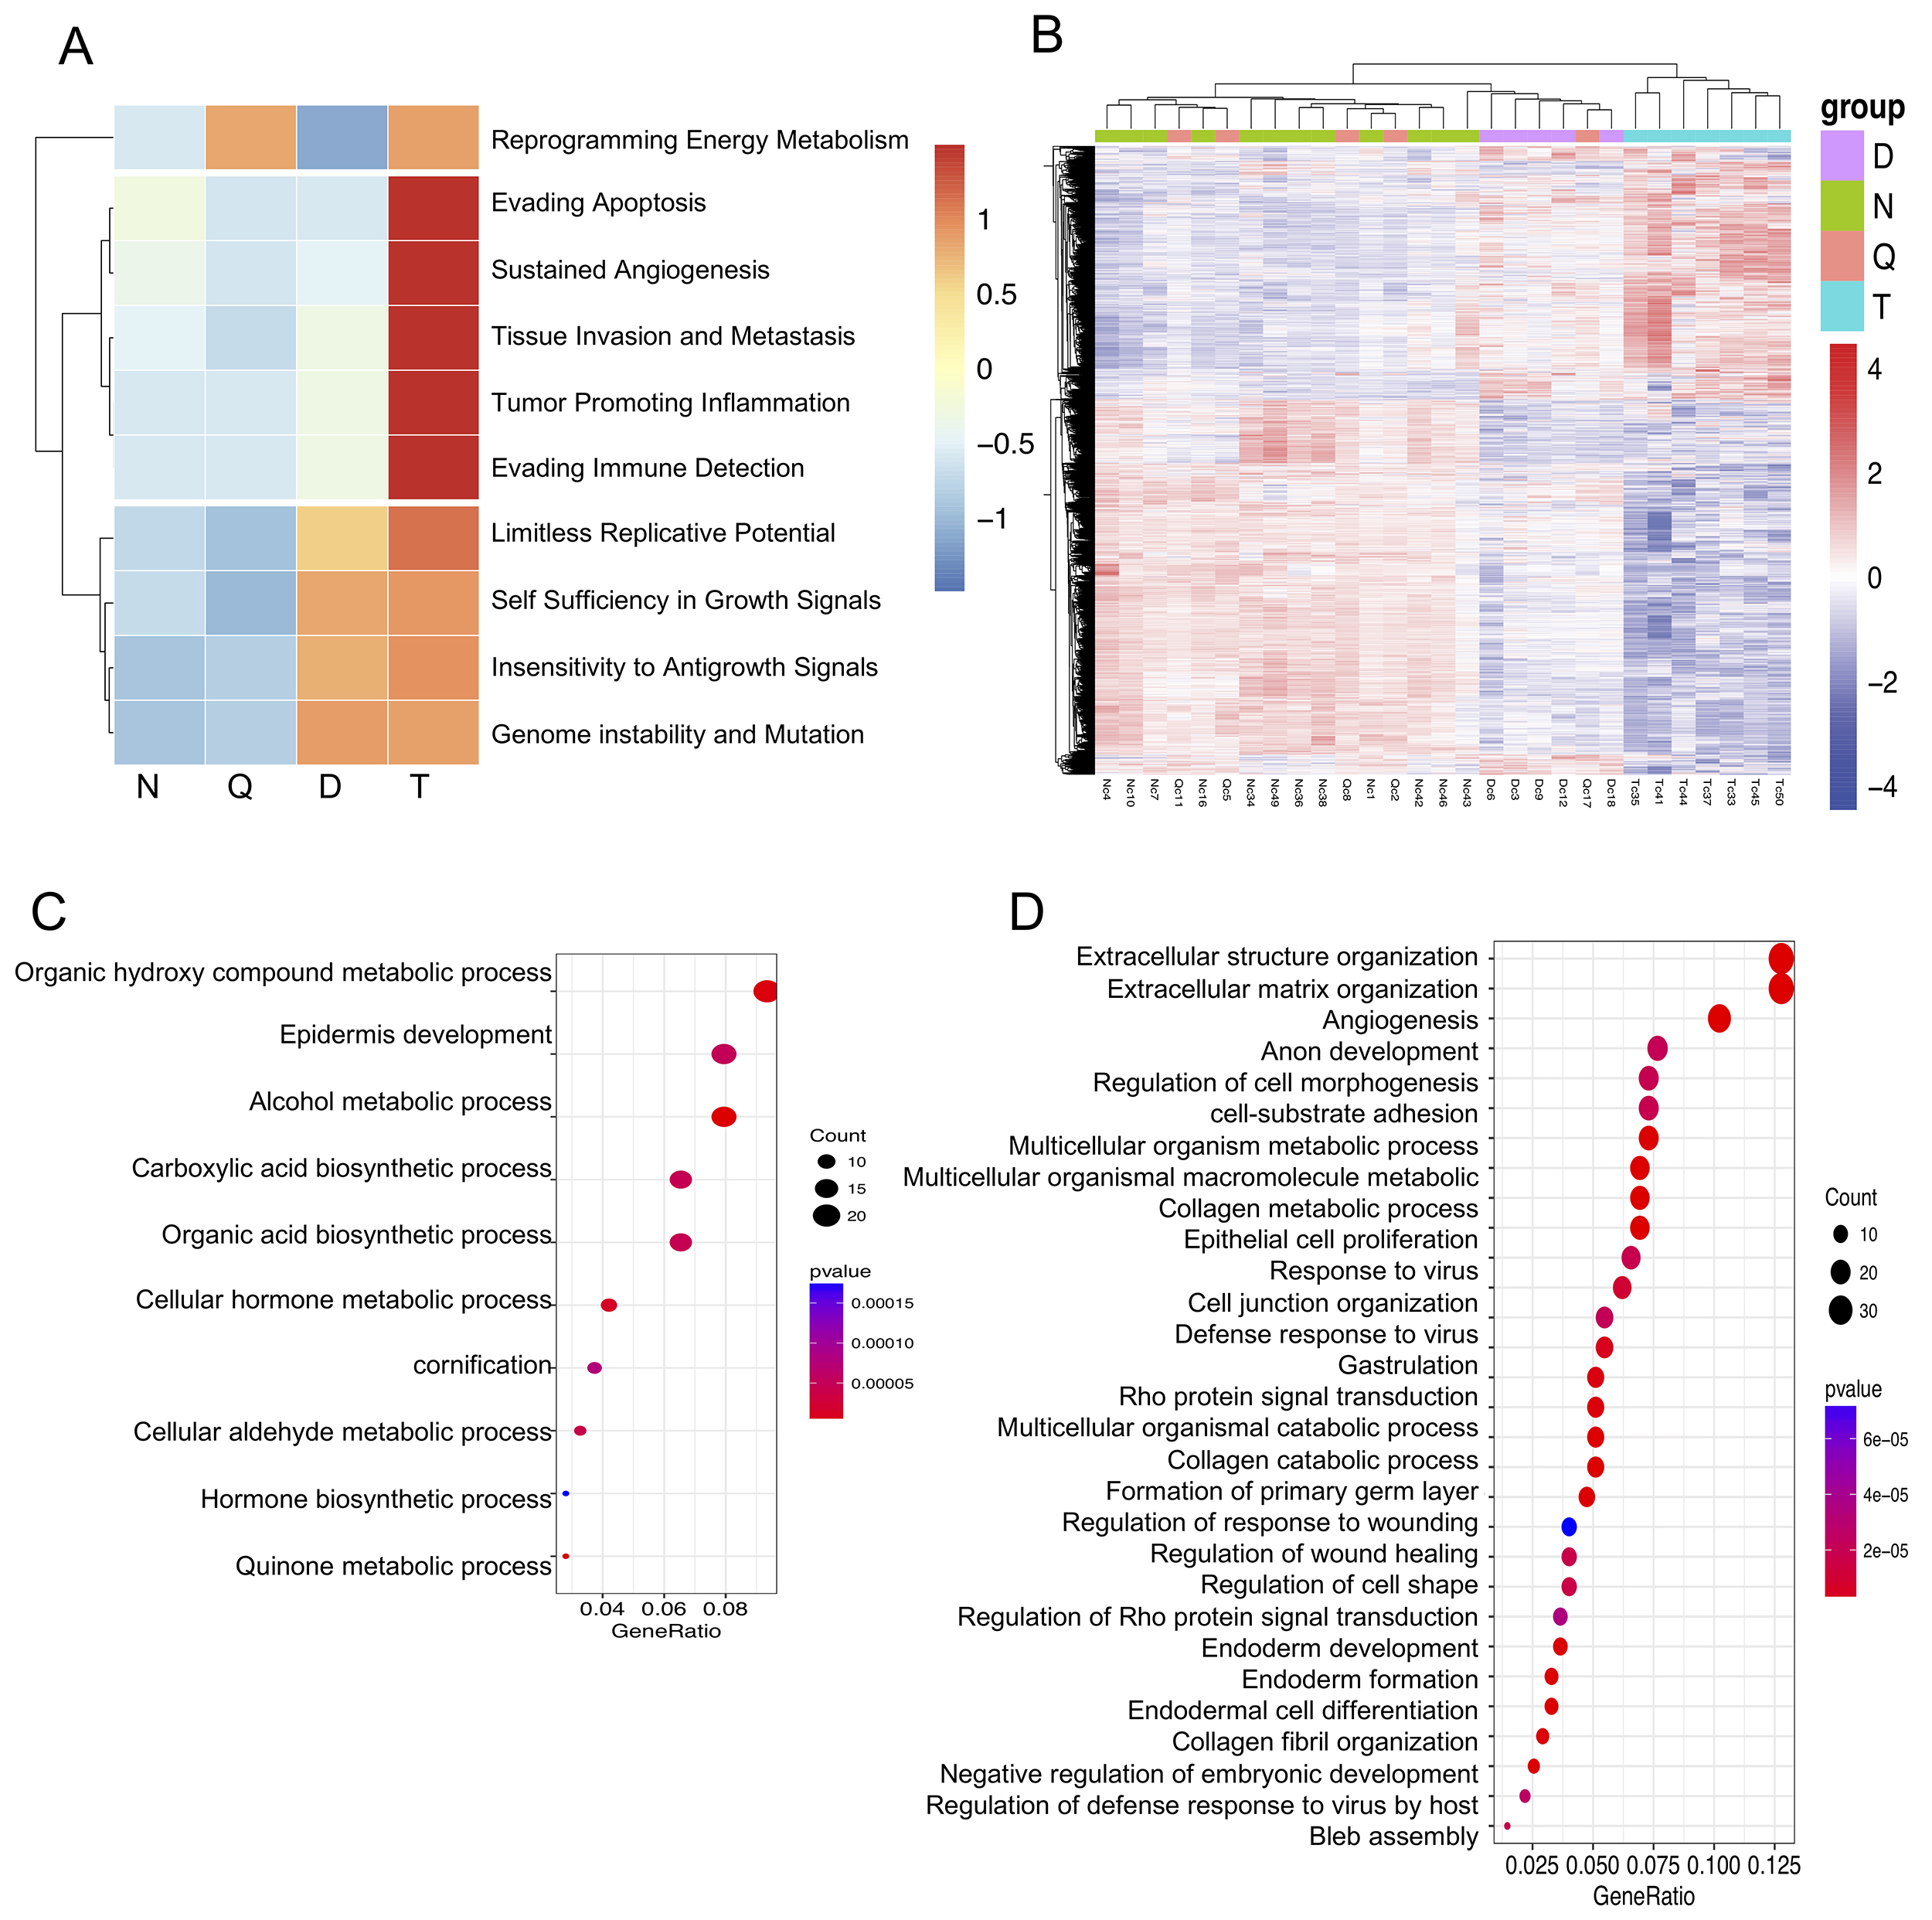 Fig. 1.
Differentially expressed genes and transcriptomic features of each stage of esophagus carcinogenesis. (A) Heatmap showing the hallmark scores of each group of tissues. (B) Heatmap showing the changes in the expression of 2345 dysregulated genes between each pair of the N, D, and T groups. (C) Functional enrichment analysis of genes that were downregulated in specific tumor stages relative to their expression in high-grade dysplasia and normal tissues. (D) Functional enrichment analysis of genes that were upregulated in specific tumor stages relative to their expression in high-grade dysplasia and normal tissues. N, normal tissues; Q, dysplastic margin tissues; D, severe dysplasia tissues; T, esophageal squamous cell carcinoma tissues.
To identify the molecular determinants of the precancerous-to-invasive carcinoma
transition, we performed pairwise t tests to compare gene expression
profiles among normal, severe dysplasia, and ESCC tissue samples (n = 29). This
analysis revealed 2345 differentially expressed genes (DEGs) with significant
intergroup differences in expression (p
Previous multi-stage studies on esophageal carcinogenesis and our chip-array
data consistently indicated that dedifferentiation and ECM remodeling critically
drives esophageal cancer development. Concurrently, long noncoding RNA
(lncRNA)—noted for high tissue specificity and roles in tissue cell
differentiation—suggested a potential link to this process [15]. Thus, we
investigated whether the 567 genes dynamically unchanged from normal to
precancerous stages but altered during the precancerous-to-cancerous transition
included lncRNAs. We found that there were 30 lncRNAs with significantly altered
expression during the progression from precancerous lesions to cancer along with
protein-coding mRNAs. Among these, LINC01605 ranked among the top 5 most
differentially expressed lncRNAs (p
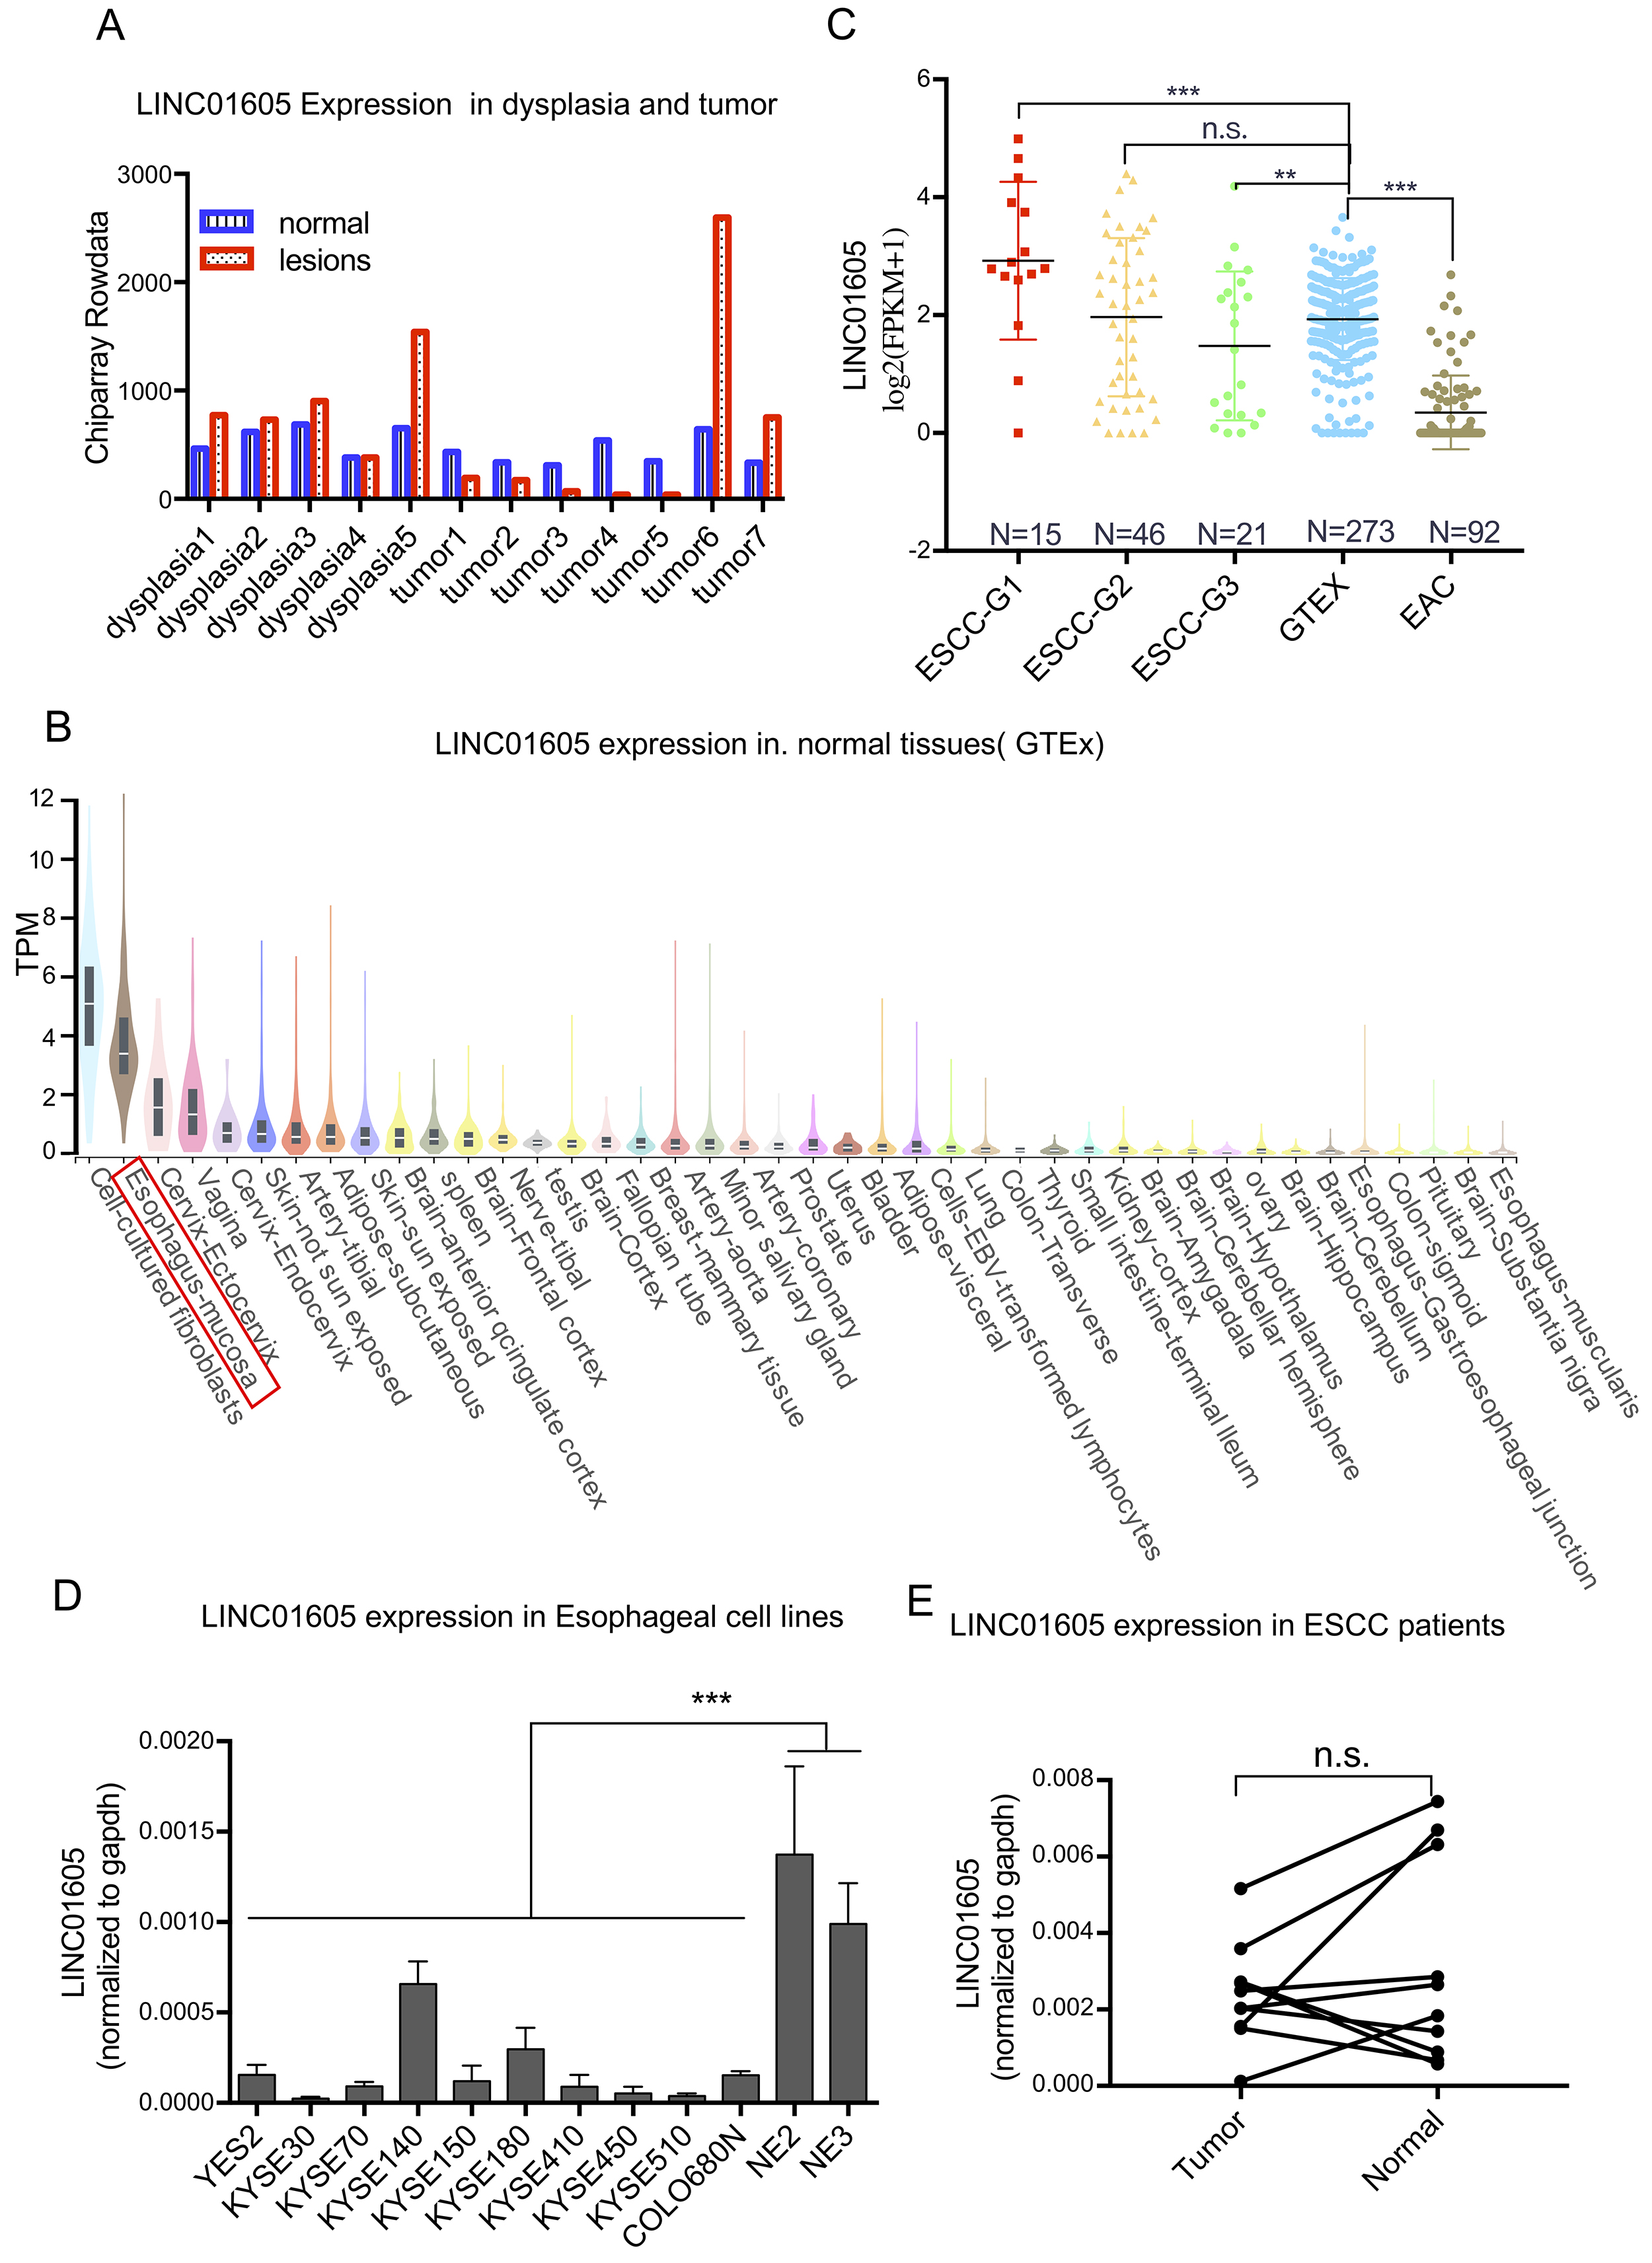 Fig. 2.
Expression of LINC01605 in esophageal tissues and cell lines.
(A) Expression level of LINC01605 in lesions and paired normal tissues from 5
patients with dysplasia and 7 patients with ESCC as detected by microarrays. (B)
The expression levels of LINC01605 across diverse normal tissues in the GTEx
database with the top 40 highest-expressing tissue types showed. The red box
marked the squamous epithelium of the esophageal mucosa (C). Expression levels of
LINC01605 in histological grade 1, 2, and 3 ESCC samples from the TCGA dataset;
normal esophageal squamous epithelium samples from the GTEx dataset; and
esophageal adenocarcinoma samples from the TCGA dataset. (D) Expression level of
LINC01605 in 10 ESCC cell lines and 2 immortalized esophageal epithelial cell
lines as determined by qRT-PCR. (E) Expression level of LINC01605 in 10 pairs of
ESCC and adjacent normal tissues as determined by qPCR. ESCC-G1/2/3: histological
grades of 1, 2, and 3, respectively, ESCC samples from the TCGA dataset; GTEx:
normal esophageal squamous epithelium from the GTEx dataset; EAC: esophageal
adenocarcinoma from the TCGA dataset. ** p
To confirm the differential expression of LINC01605 between normal and
neoplastic squamous epithelial tissues, we performed qRT-PCR analysis on 10 ESCC
cell lines and 2 immortalized normal esophageal squamous cell lines. Compared
with all 10 ESCC lines, the immortalized normal cells lines exhibited
significantly greater LINC01605 expression (p
As previously reported, the dedifferentiation process plays a key role in the
carcinogenesis of esophageal squamous epithelium. We investigated which phenotype
of ESCC cells was affected by LINC01605, which is a gene that is related
to the differentiation of the esophageal epithelium. We analyzed the
differentially expressed genes in samples with the top 25% and bottom 25% of
LINC01605 expression levels in the TCGA-ESCC transcriptome dataset. Genes with
significantly greater expression (p
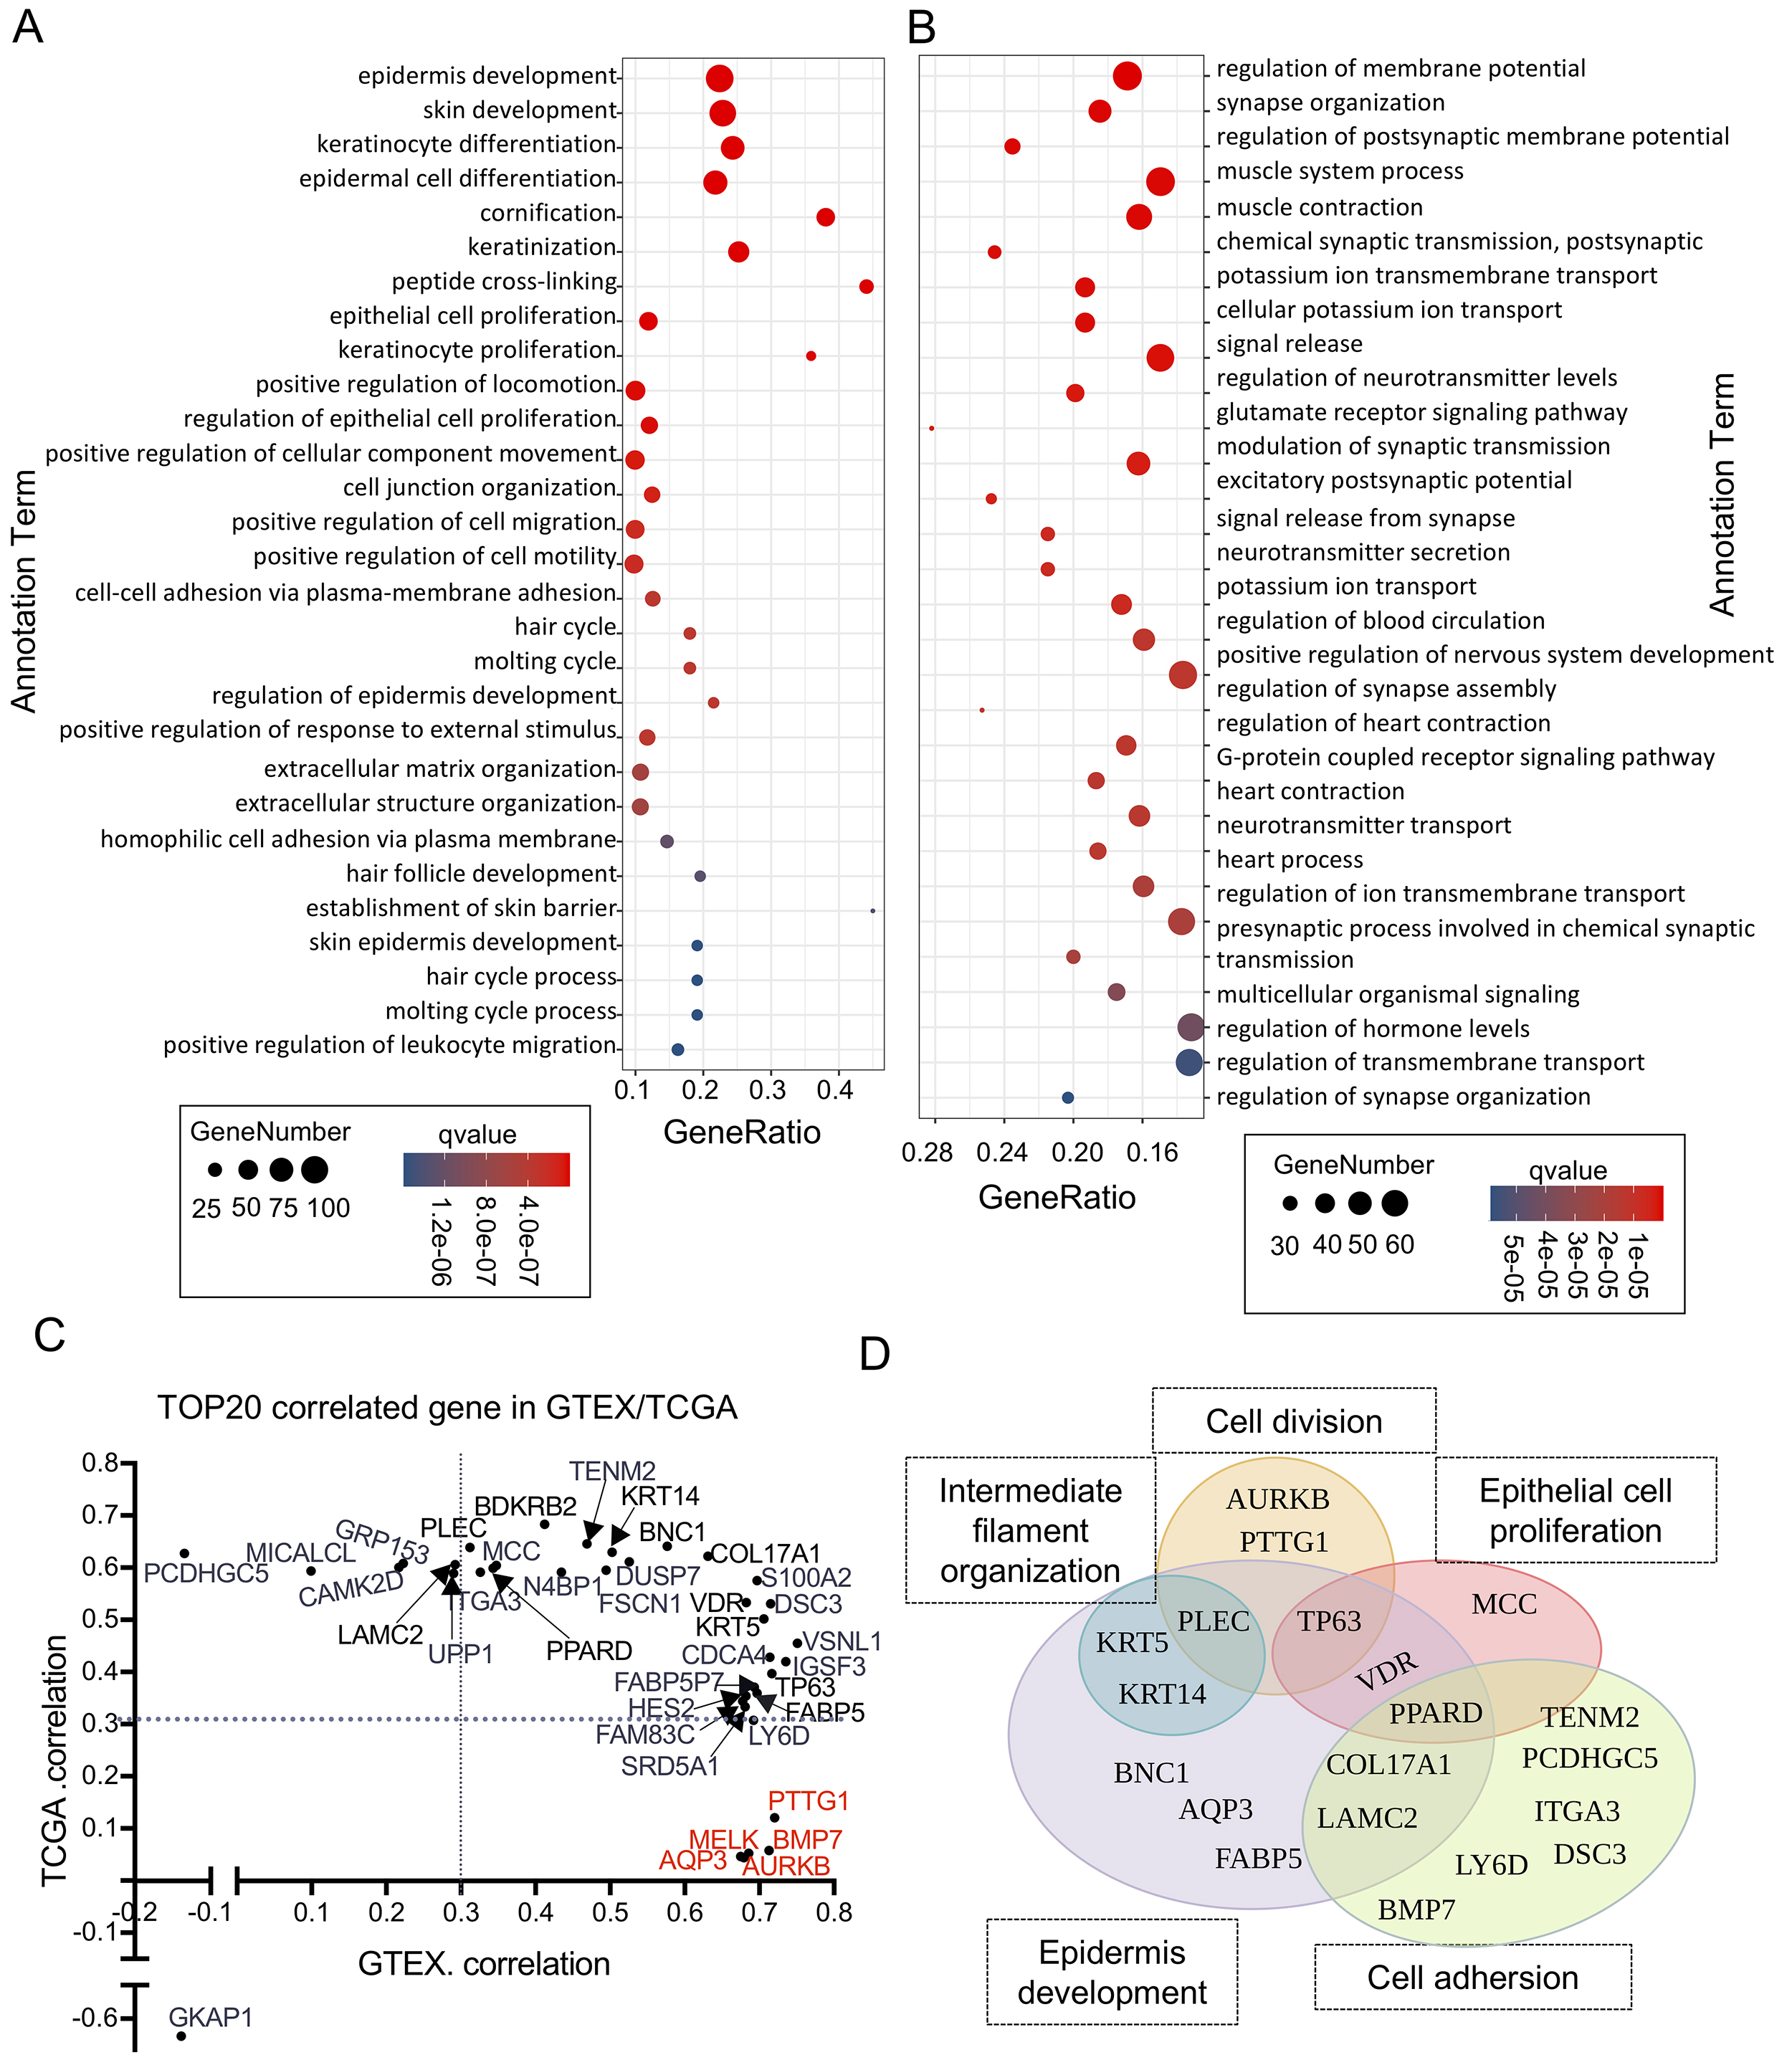 Fig. 3.
The functions of LINC01605 are explained by covariant genes and coexpressed genes. (A) Representative GO biological process (BP) terms of the genes whose expression was lower in samples with low LINC01605 expression. (B) Representative GO BP terms of the genes whose expression was higher in samples with low LINC01605 expression. (C) The top 20 genes related to the expression of LINC01605 in the GTEx or TCGA datasets. The X-axis represents the Pearson correlation coefficient with LINC01605 in the GTEx dataset, and the Y-axis represents the Pearson correlation coefficient with LINC01605 in the TCGA dataset. Red represents the genes with no difference in expression levels between tissues with high and low LINC01605 expression. The points indicated by the arrow corresponds to the location of the genes. (D) The functions of the top 20 genes related to LINC01605 in the GTEx or TCGA dataset. GO, gene ontology.
To characterize the potential function of LINC01605 more accurately
using genes that encode functional proteins, we identified the top 20 genes whose
expression showed the strongest correlation with the expression of LINC01605 in
the GTEx dataset and the TCGA dataset. While most of the identified genes had
distinct expression levels in ESCC tissues with high LINC01605 expression
compared with ESCC tissues with low LINC01605 expression, we identified a group
of genes, including MELK, PTTG1, aurora kinase B (AURKB), BMP7, and
AQP3, whose expression remained unchanged in ESCC tissues with high LINC01605
expression compared with ESCC tissues with low LINC01605 expression (Fig. 3C).
Notably, three of these genes (MELK, PTTG1, and AURKB) were functionally
associated with cell cycle regulation, and their expression was strongly
correlated with LINC01605 expression exclusively in normal epithelium. These
findings suggest that LINC01605 plays context-dependent roles, operating through
divergent pathways in normal versus malignant squamous epithelial cells states.
In fact, Cross-dataset analysis revealed that the TOP20 genes most strongly
correlated (Pearson
To investigate the phenotypic impact of LINC01605, we performed experiments with
the NE3 and KYSE180 cell lines. The NE3 cell line is a normal immortalized
esophageal epithelial cell line exhibiting physiologically high LINC01605
expression. This makes this cell line ideal for modeling LINC01605 loss
during carcinogenesis and avoiding biologically incongruent
overexpression. Among esophageal cell lines, KYSE180 cells
exhibit moderate LINC01605 expression, allowing the confirmation of both loss-
and gain-of-function phenotypes within the same neoplastic context. We
transiently knocked down LINC01605 expression in NE3 cells with relatively high
endogenous LINC01605 expression and in KYSE180 cells with moderate endogenous
LINC01605 expression. Two independent siRNAs (si-1006 and si-1349) efficiently
silenced LINC01605 expression in both cell lines (Supplementary Fig. 1A,B). The knockdown of LINC01605 increased the proliferation rates of both NE3 and
KYSE180 cells, as shown by CCK-8 assays or real-time monitoring of growth.
Real-time monitoring data from the xCELLigence Real-Time Cell Analyzer [19, 20] revealed distinct separation of the growth curves between the two knockdown
KYSE180 cell lines and the control KYSE180 cell line, demonstrating consistent
suppression of proliferative capacity throughout the observation period (Fig. 4A,
Supplementary Fig. 2). The Mann‒Whitney U test was performed to analyze
the ODs in the NE3 cells between the si-1006/si-1349 and si-NC groups at each
time point. Significant differences (p
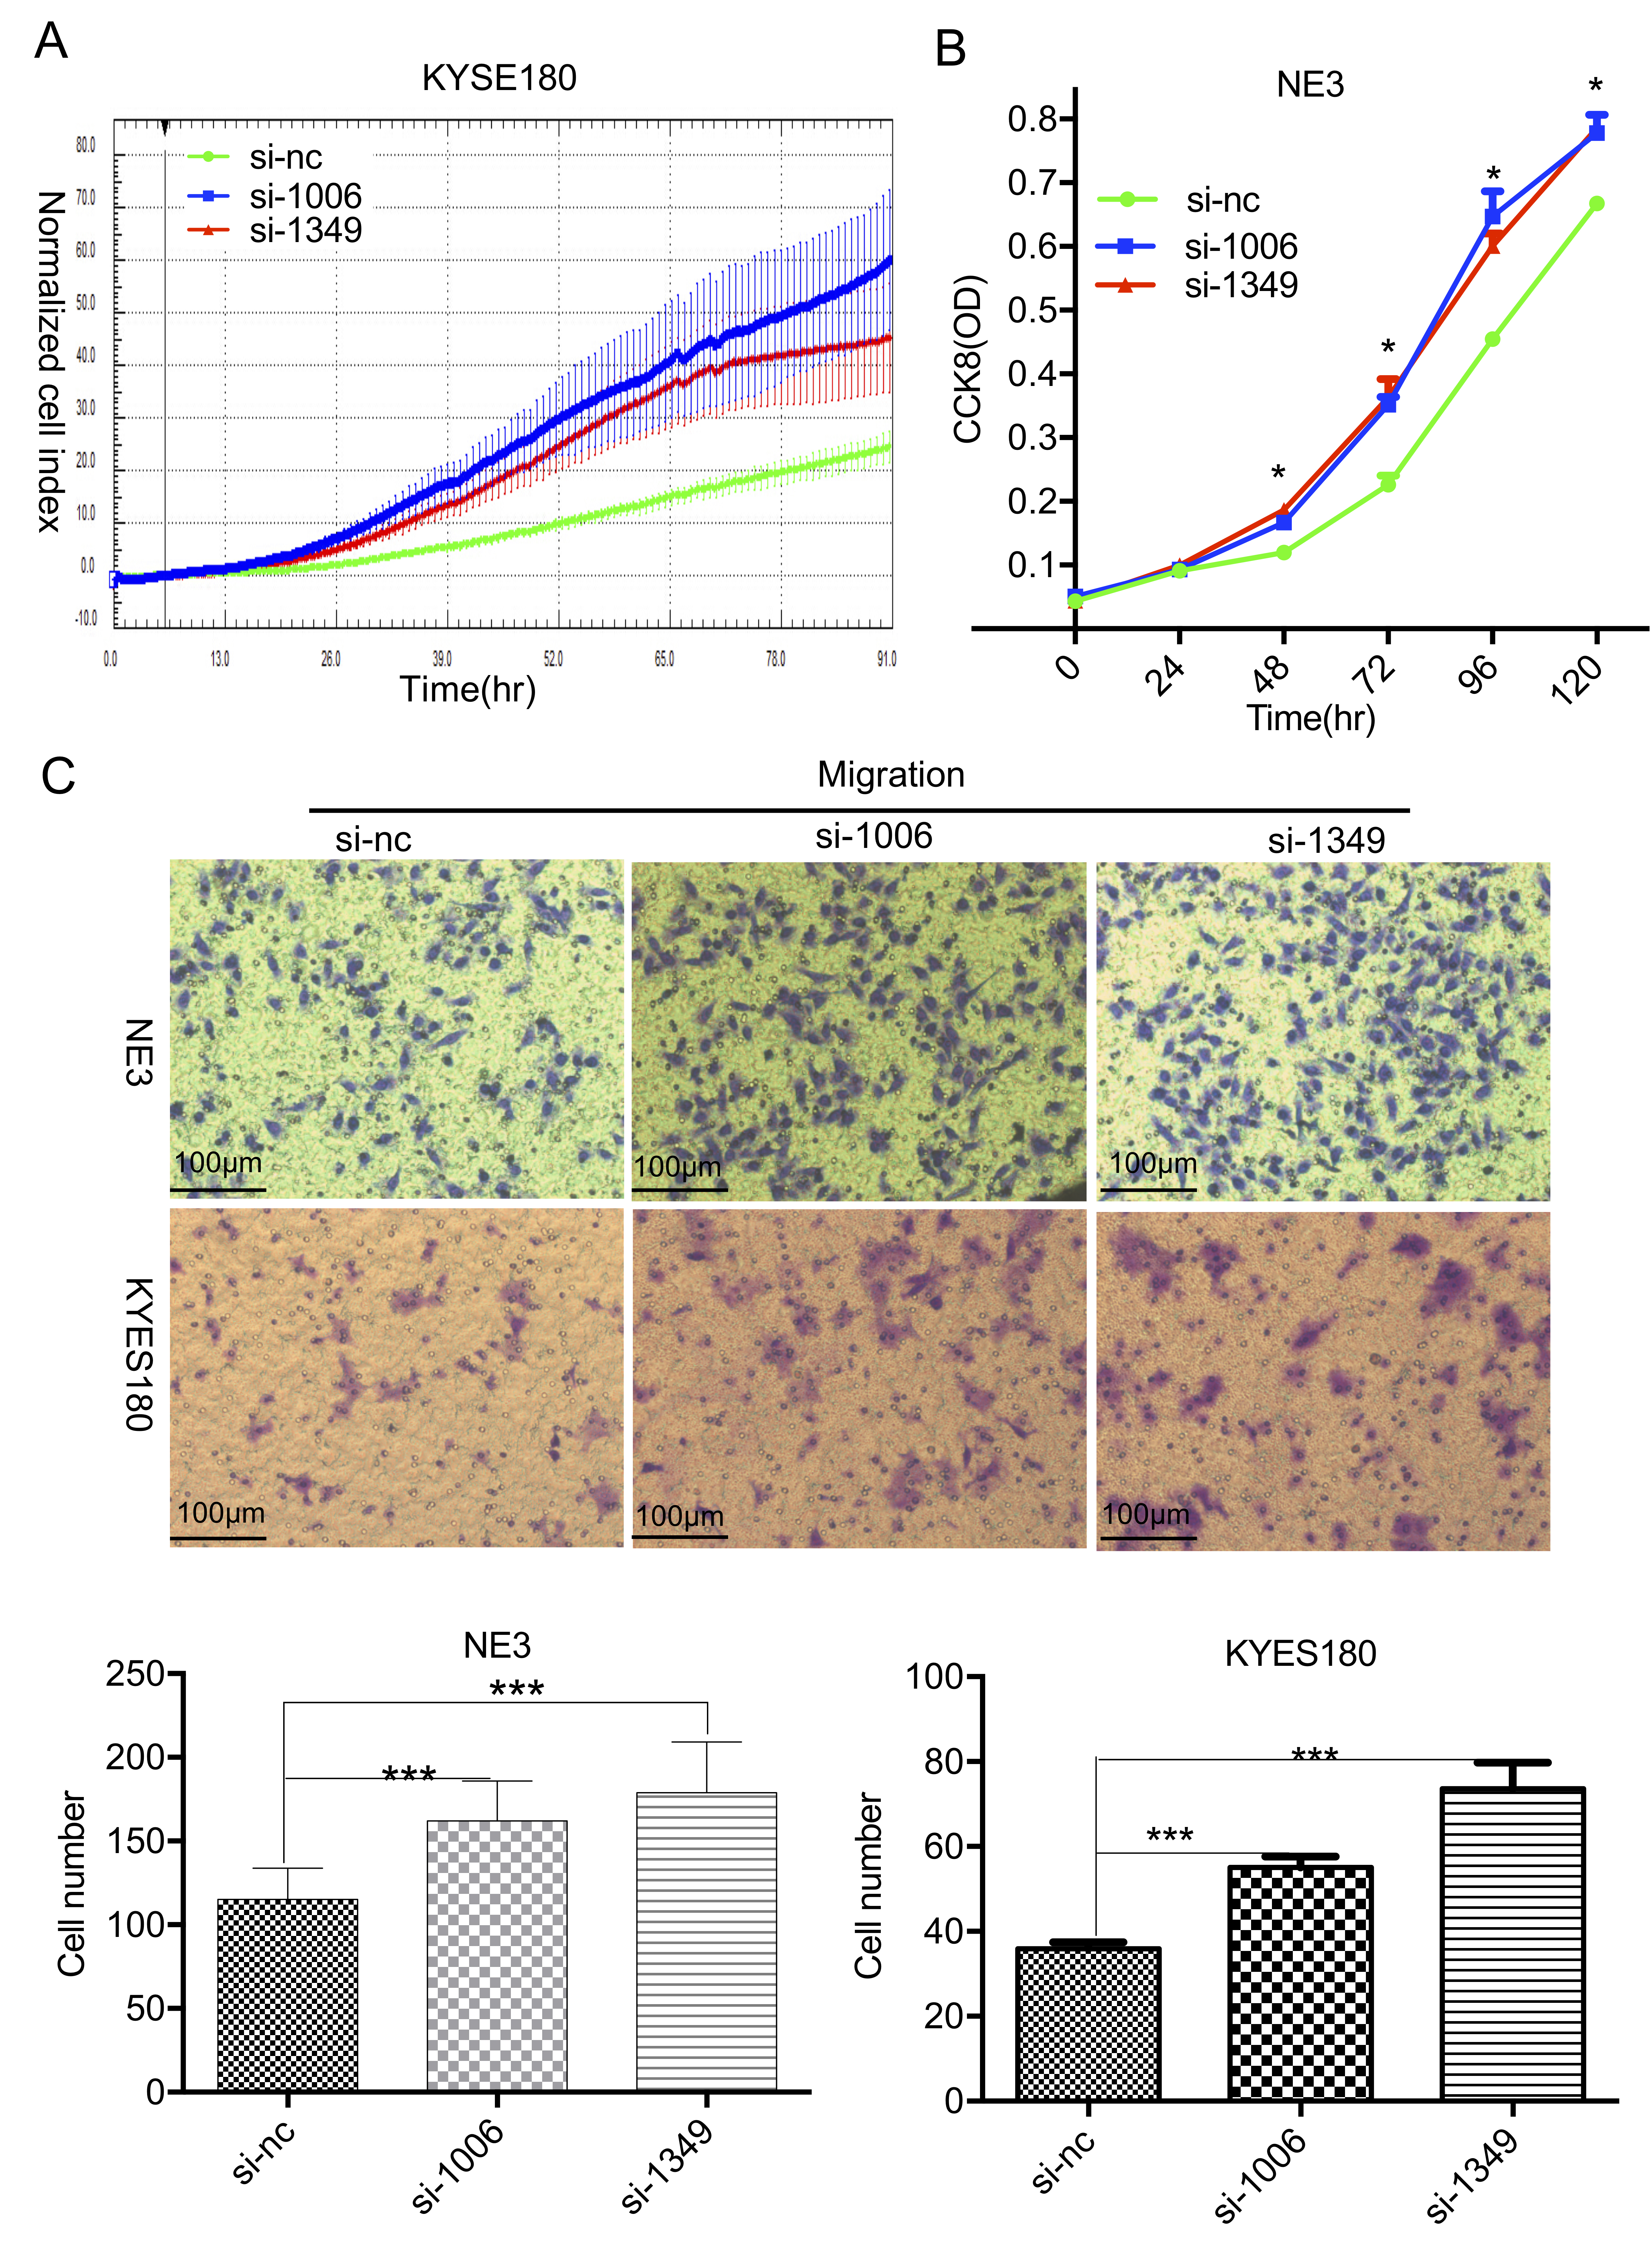 Fig. 4.
LINC01605 knockdown promotes the proliferation and migration of
KYSE180 and NE3 cells. (A) Growth curve showing cell proliferation after
LINC01605 was knocked down in KYSE180 cells. (B) Growth curve showing cell
proliferation after LINC01605 was knocked down in NE3 cells. (C) Transwell
migration assay showing cell migration after LINC01605 was knocked down in
KYSE180 and NE3 cells. Top, representative illustration of migrated cells. Scale
bar = 100 µm; bottom, the number of cells that migrated to the lower
chamber. si-1006 and si-1349: two distinct siRNAs targeting LINC01065; si-NC:
negative control. * p
We also attempted to overexpress LINC01605. Although the transcripts of
LINC01605 were recorded in Refseq, database mining in LNCpedia [21] revealed
We constructed overexpression vectors for the longest and shortest LINC01605
transcripts that were identified above and transfected them into KYSE180 cells
with moderate endogenous LINC01605 expression and into KYSE30 cells with low
endogenous expression; the latter cell type provided a null background system for
clean observation of functional restoration following LINC01605 overexpression.
Both isoforms were successfully overexpressed in the target cells
(Supplementary Fig. 1C,D). Functional characterization demonstrated
conserved tumor-suppressive effects across isoforms. CCK-8 assays revealed a
significant reduction (p
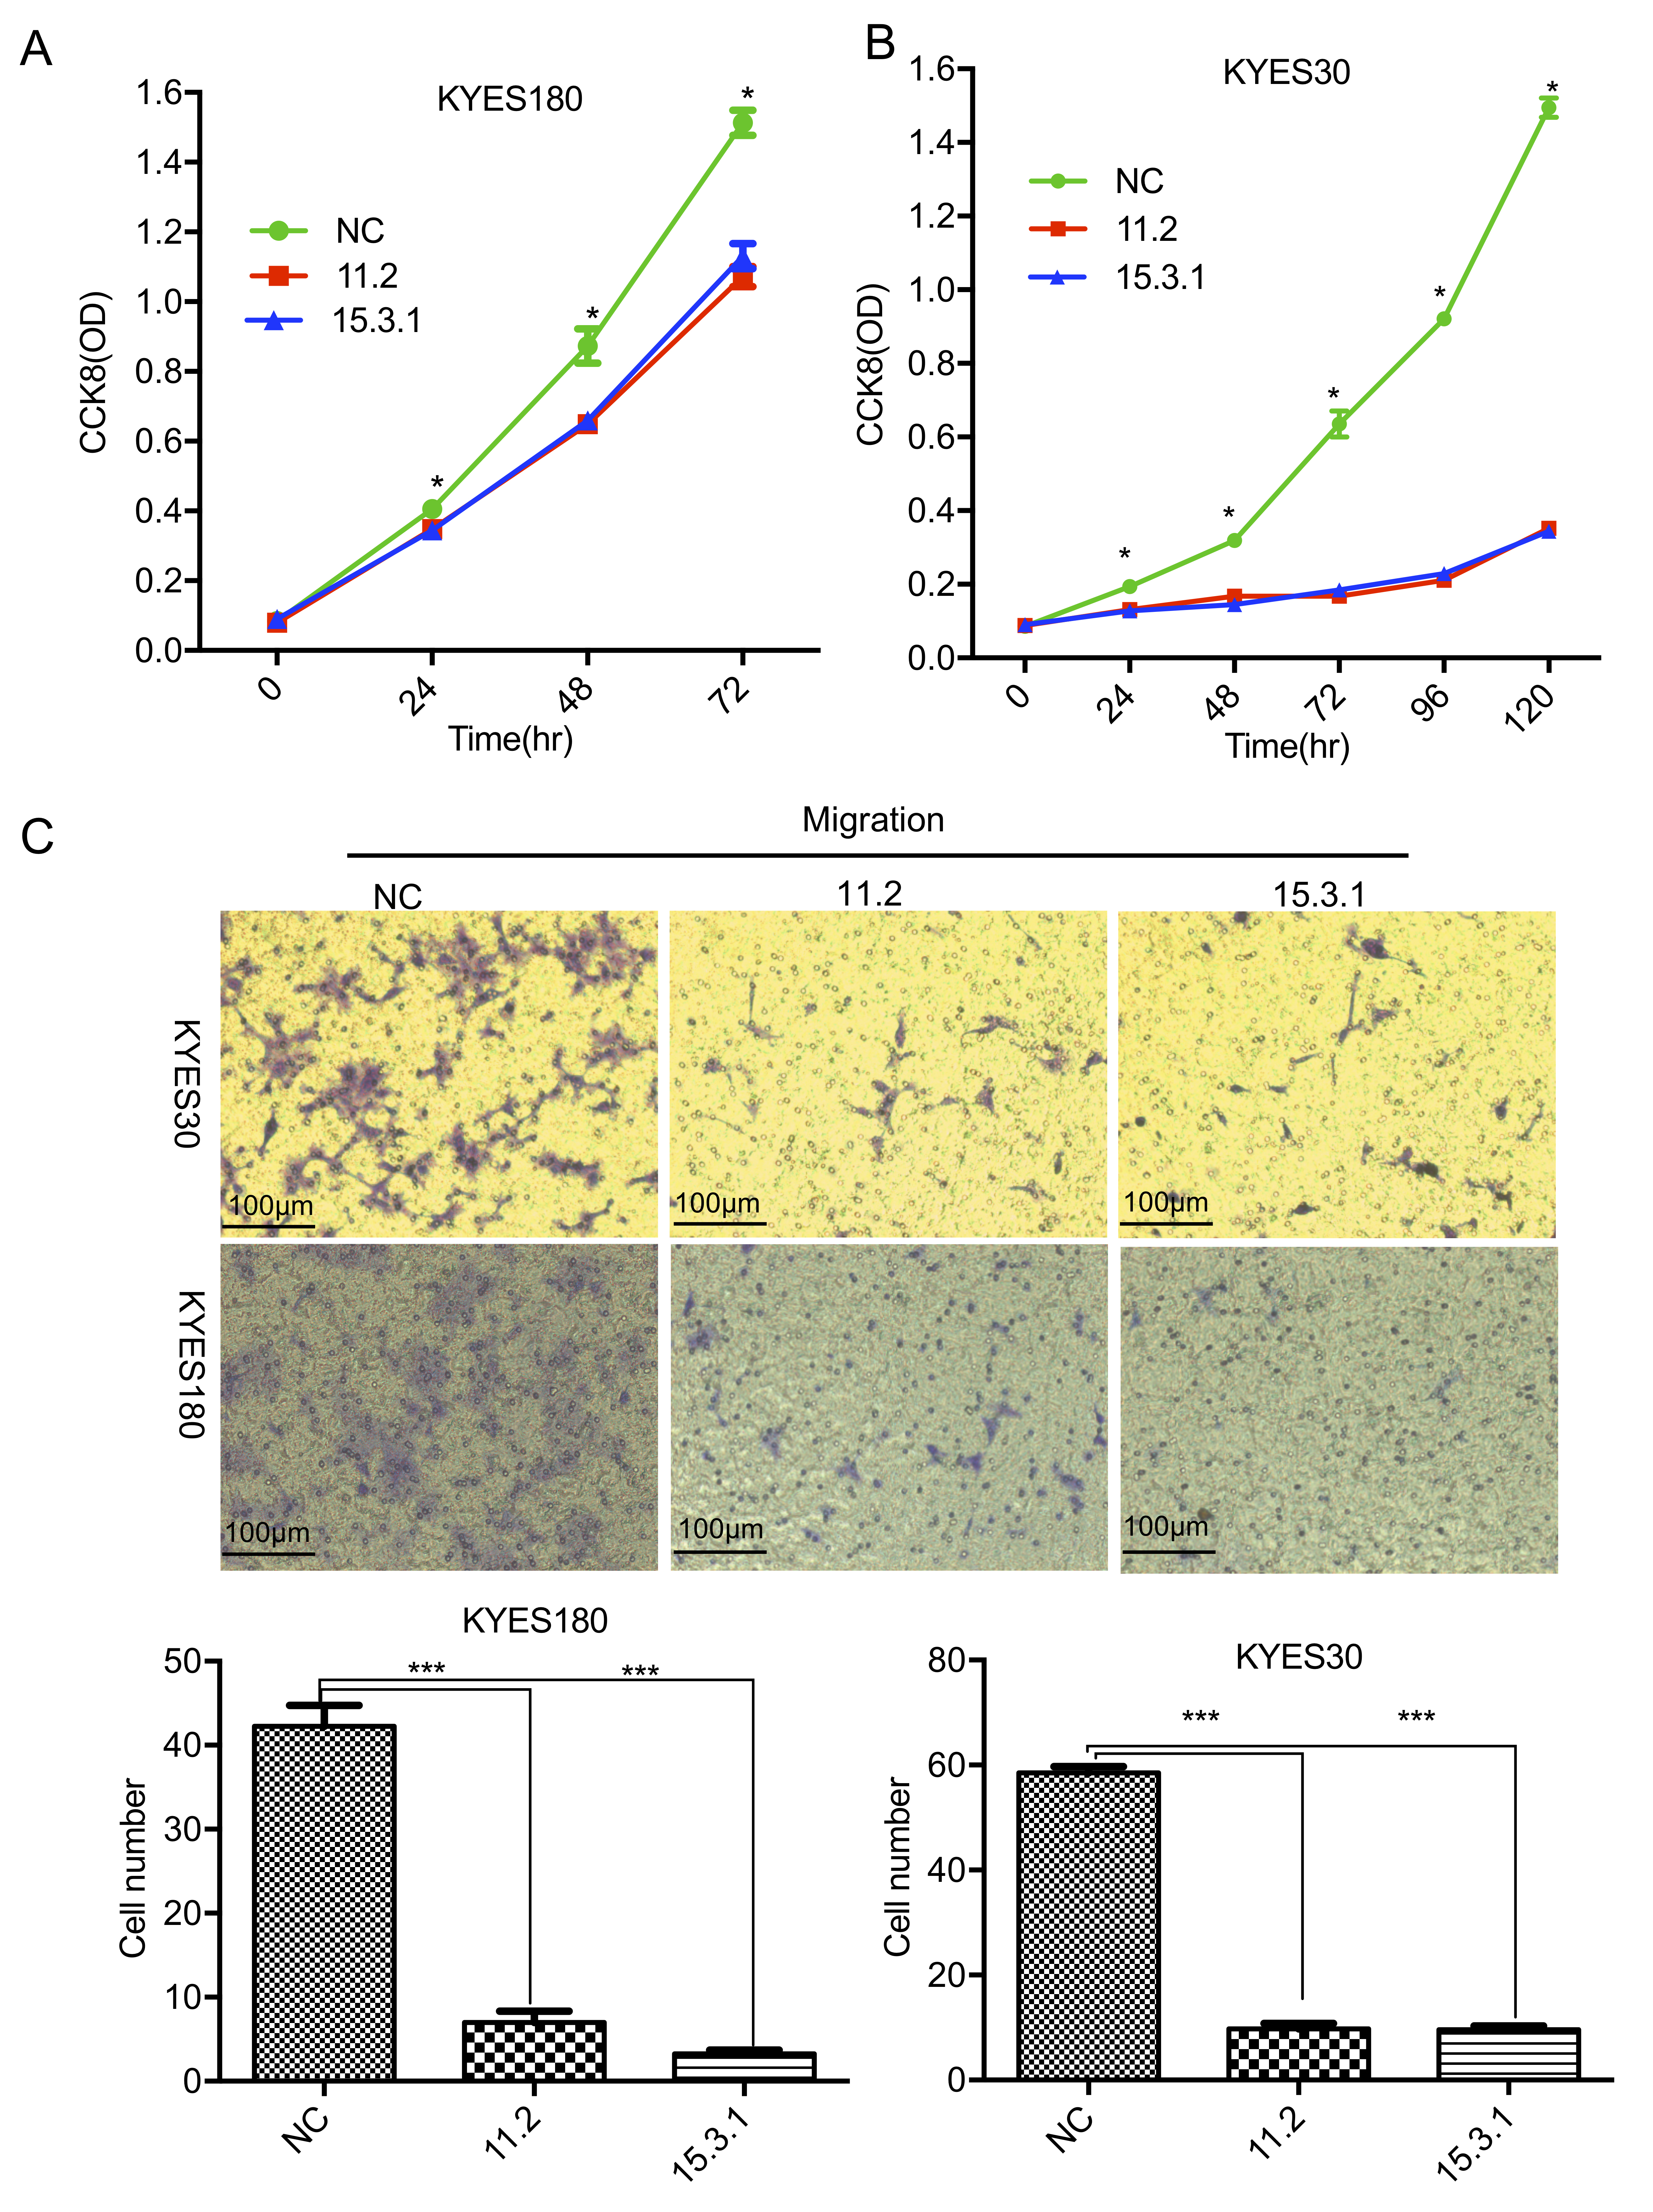 Fig. 5.
The overexpression of LINC01605 suppressed the proliferation and
migration of KYSE180 and KYSE30 cells in vitro. (A) Growth curve
showing cell proliferation after LINC01605 was overexpressed in KYSE180 cells.
(B) Growth curve showing cell proliferation after LINC01605 was overexpressed in
KYSE30 cells. (C) Transwell migration assay showing cell migration after
LINC01605 was overexpressed in KYSE180 and KYSE30 cells. Top, representative
illustration of migrated cells. Scale bar = 100 µm; bottom, the number of
cells that migrated to the lower chamber. 11.2 and 15.3.1: Plasmids carrying
LINC01065 transcripts 11.2 and 15.3.1; NC: empty plasmid. * p
RNA‒protein interactions represent a key mechanism by which lncRNAs regulate cellular processes. To identify functional partners of LINC01605, we performed RNA pull-down assays in NE3 cell lysates, using the two isoforms transcribed in vitro, with antisense strands and no RNA systems used as negative controls. Two distinct protein bands within the 30–40 kDa range were selectively enriched by both isoforms compared with antisense controls and noRNA controls by two independent pull down assays (Fig. 6A, Supplementary Fig. 5). Mass spectrometry analysis of these differential bands revealed that heterogeneous nuclear ribonucleoprotein C (HNRNPC) was the predominant interactor, with the highest scores and sequence coverage across all the proteins identified. Repeat RNA pull-down assays followed by Western blot analysis confirmed significant enrichment of HNRNPC at the expected molecular weight position (35–40 kDa) (Fig. 6B). HNRNPC, which is a known RNA-binding protein that is involved in transcriptional regulation and alternative polyadenylation [22], may mediate the posttranscriptional processing of LINC01605. We interrogated the starBase database for protein-lncRNA interactions, leveraging its comprehensive catalog of lincRNA interactomes derived from high-throughput CLIP-seq assays targeting established RNA-binding proteins [23]. LINC01605 was found to bind HNRNPC in multiple clip-seq experiments (Supplementary Table 1). These findings confirm our RNA pull-down data and establish the potential relevance of the HNRNPC-LINC01605 interaction in vivo.
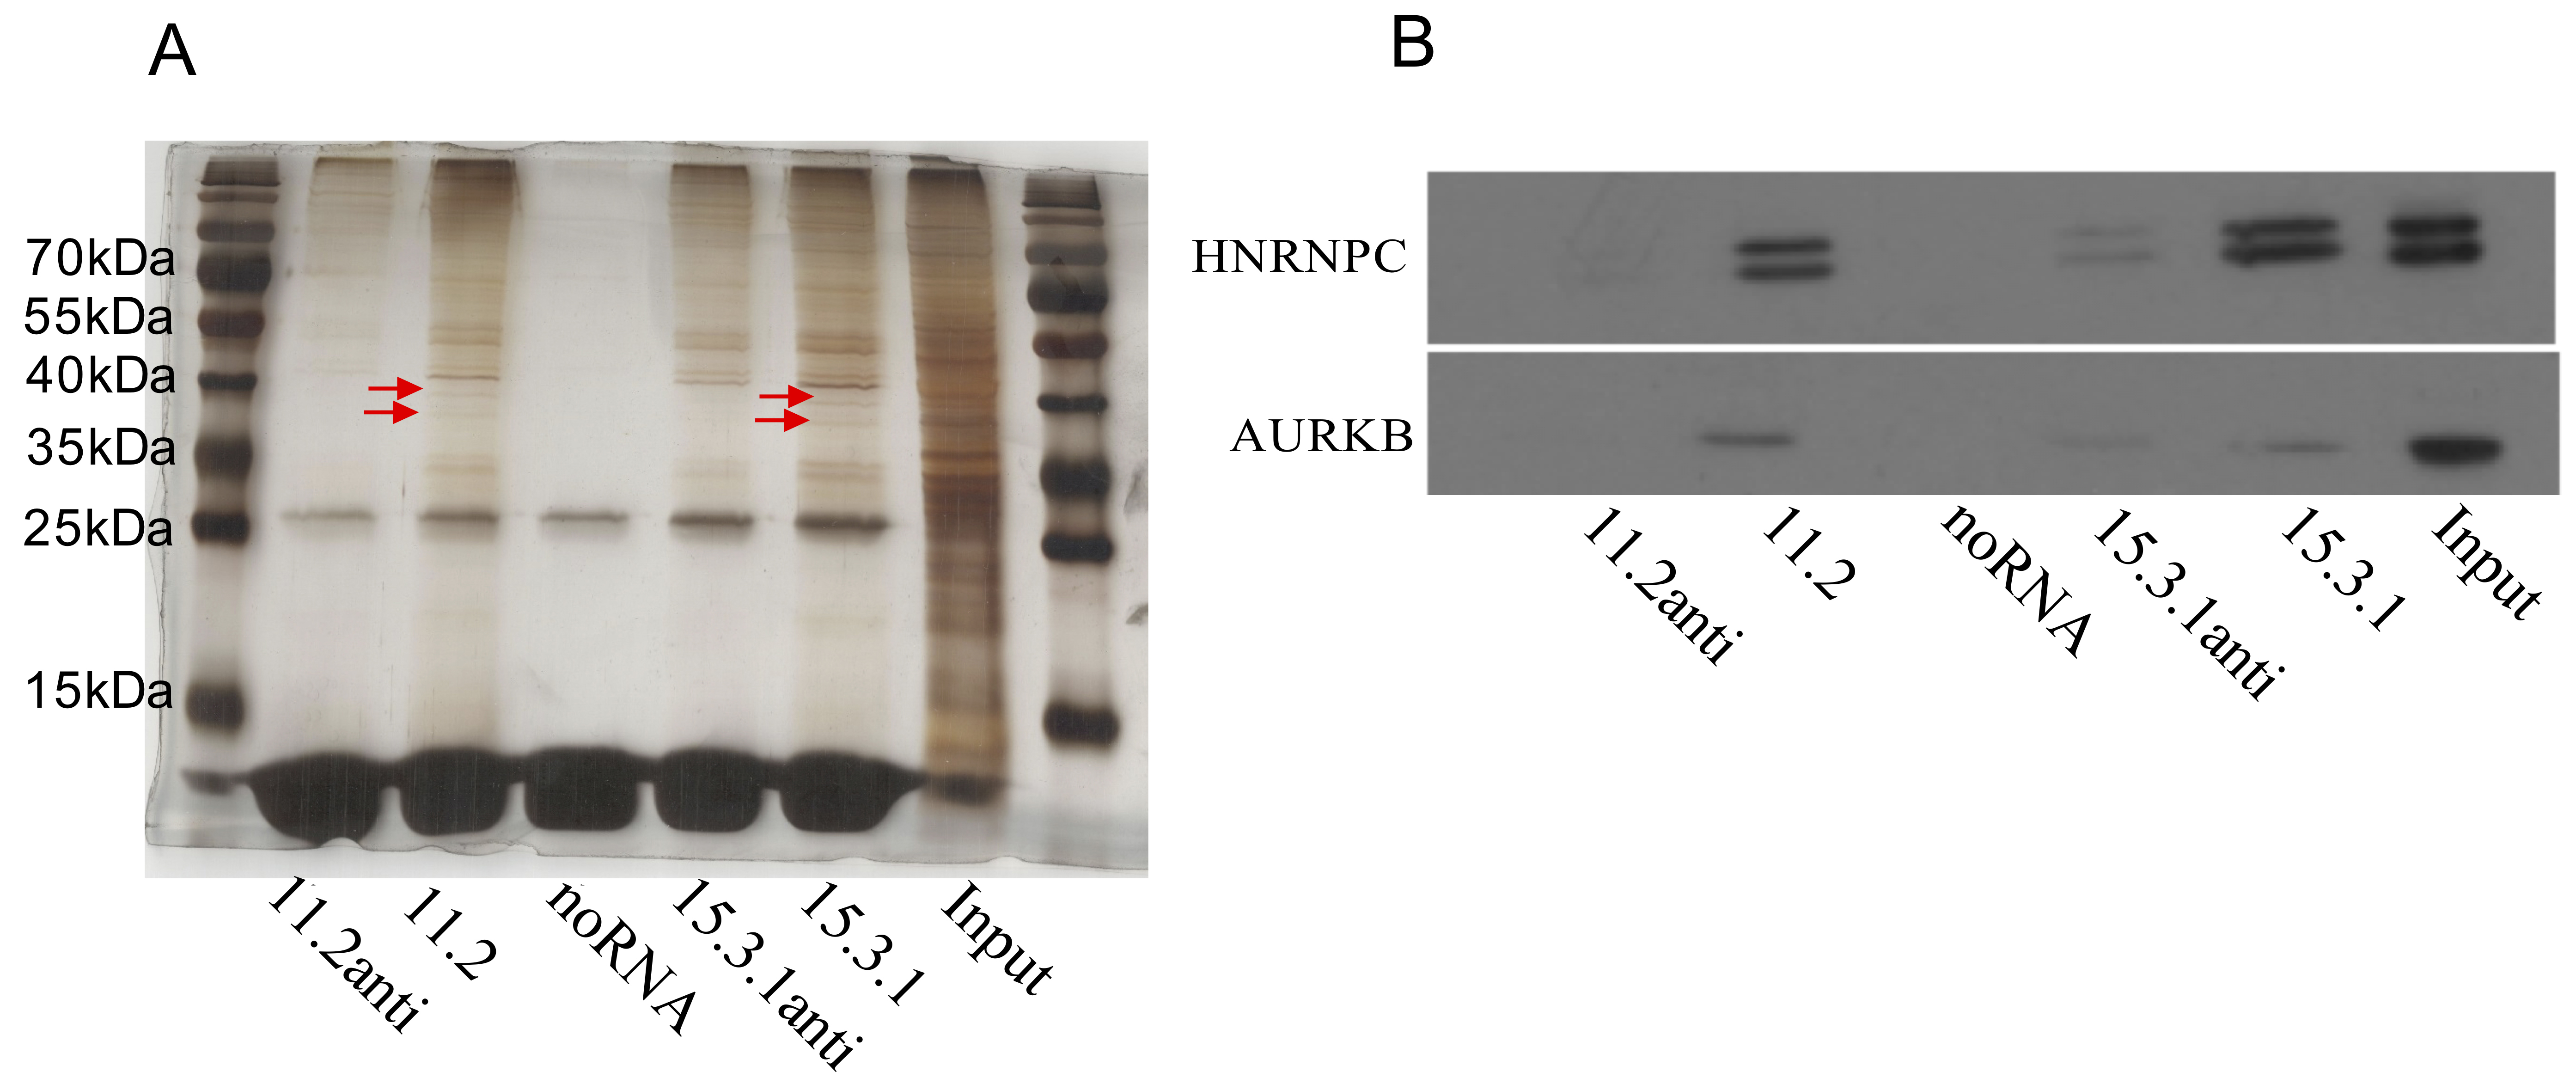 Fig. 6.
In vitro RNA pull down assays indicated LINC01605 RNA interacts with HNRNPC, AURKB. (A) Image of a silver-stained gel showing bands relative to the protein that specifically binds LINC01605 compared with its antisense RNA; the red arrows indicate the positions of the distinctive bands relative to the control. (B) Western blot of RNA pull-down products showing that HNRNPC and AURKB interact with LINC01605 in esophageal cells. HNRNPC, heterogeneous nuclear ribonucleoprotein C; AURKB, aurora kinase B.
In addition to HNPNPC, AURKB was shown to be pulled down by 11.2 and 15.3.1
relative to the antisense control and no RNA control after strict selection of
the MS results with Score
Multiomics analyses that integrate premalignant lesions provide critical temporal resolution for distinguishing progressive molecular changes that occur during carcinogenesis, surpassing conventional normal-tumor comparisons that conflate cumulative changes. Our multistage transcriptomic dissection of esophageal squamous carcinogenesis elucidates the stepwise acquisition of oncogenic hallmarks. Comparative analysis of high-grade dysplasia versus invasive carcinoma revealed stage-specific molecular reprogramming: progressive downregulation of esophageal morphogenesis regulators alongside coordinated upregulation of regulators of extracellular matrix remodeling, cell adhesion and angiogenesis. These findings are consistent with those of multiomics studies demonstrating that early-stage pathogenesis is driven by epithelial-intrinsic changes followed by late-stage microenvironmental crosstalk activation as critical transition nodes.
In this study, we revealed that LINC01605, which is an esophagus-specific long noncoding RNA, is significantly downregulated in poorly differentiated ESCC through multistage lesion comparative analysis. We systematically elucidated for the first time that LINC01605 participates in the dedifferentiation process during esophageal squamous epithelial carcinogenesis. Bioinformatics analysis revealed a significant correlation between LINC01605 expression levels and pathological differentiation grade in ESCC. Experimental validation using ESCC cell lines and immortalized esophageal mucosal cell lines consistently demonstrated reduced LINC01605 expression in malignant cells. Comparative analysis of high- and low-LINC01605 expression groups in the TCGA-ESCC datasets revealed significant enrichment of coexpressed genes in biological processes that are related to esophageal epithelial development and keratinocyte differentiation. Importantly, while previous studies have established the crucial role of dedifferentiation in esophageal carcinogenesis, our work further examined the specific regulatory effects of LINC01605 on maintaining squamous epithelial cell phenotypes. Through gain-of-function and loss-of-function experiments in three cell lines with distinct LINC01605 expression levels, we demonstrated that this gene significantly inhibits the proliferation and migration of esophageal squamous carcinoma cells. These phenotypic observations are consistent with the results of bioinformatics analyses showing distinct biological process activation in ESCC samples with different LINC01605 expression levels, particularly in epithelial cell proliferation and migration. Furthermore, we revealed that LINC01605 overexpression induces tumor cell cycle arrest at the G0 phase, which is a phenomenon that resembles terminal differentiation phenotypes in normal squamous epithelial cells.
However, the limited availability of clinical samples restricted our initial expression profiling to a relatively small sample size, which may have introduced potential bias in detecting subtle changes in gene expression. While this limitation is partially mitigated by the observed consistency with multistage transcriptomic datasets that faithfully recapitulate stepwise changes that occur during esophageal squamous carcinogenesis, the limited cohort size remains a methodological constraint. Although we identified LINC01605 as a critical regulator of esophageal dedifferentiation processes during carcinogenesis, its expression patterns lack sufficient diagnostic specificity, and thus, it cannot serve as a reliable biomarker for detecting malignant transformation in precancerous lesions.
Notably, in contrast to our findings, single-study reports have documented the oncogenic properties of LINC01605 across various malignancies, including clear cell renal carcinoma [29], pancreatic adenocarcinoma [30], cervical cancer [31], ovarian cancer [32], triple-negative breast cancer [33], colorectal carcinoma [34], laryngeal squamous cell carcinoma [35], and nasopharyngeal carcinoma [36]. This tissue-specific differences in function may occur due to several mechanistic considerations. Primarily, our study revealed that LINC01605 expression is highly tissue-specific and restricted to the esophageal squamous epithelium, with negligible LINC01605 expression detected in other epithelial tissues. Genes whose expression demonstrates such pronounced tissue specificity frequently play pivotal roles in organismal pathophysiology and disease progression, likely governed by distinct tissue-specific regulatory networks that may result in divergent functional outcomes across different malignancies [37]. Second, our systematic analysis revealed that LINC01605 participated in multiple cellular activities through diverse upstream/downstream regulatory networks. The protein-coding genes that interact with LINC01605 demonstrate substantial functional heterogeneity, which is consistent with previous reports that described various mechanistic roles across cancer types. The mechanisms by which LINC01605 functions in various cancer types are also very diverse. LINC01605 has been reported to participate in metabolic regulation in pancreatic adenocarcinoma [31], clear cell renal carcinoma [29], and triple-negative breast cancer [33]; act as a competitive endogenous RNA (ceRNA) of some microRNAs in cervical [31] and nasopharyngeal carcinomas [36]; mediate Spectrin Beta, Non-Erythrocytic 2 (SPTBN2) methylation by binding to methyltransferase like 3 (MELLT3) in colorectal carcinoma [34]; and play a role as a mutp53 downstream effector gene in ovarian cancer [32]. This cancer type-specific mechanistic diversity may collectively account for the functional differences observed between ESCC and other tumor types. Finally, LINC01605 exhibits extensive alternative splicing complexity. Currently, genomic databases (Ref-RNA and Ensembl) document more than 100 distinct LINC01605 transcripts and splicing variants; this molecular diversity that has not been systematically addressed in previous functional studies. Notably, previous studies have not comprehensively characterized these transcript-specific isoforms and their potential biological implications. The function and tumor regulatory mechanism of LINC01605 still require more in-depth research. In particular, no reports have been published on the role of LINC01605 in esophageal squamous cell carcinoma thus far.
In this study, through the integrated application of in vitro RNA pull-down assays coupled with mass spectrometry and Western blotting validation, we identified LINC01605 interacted with the RNA-binding protein HNRNPC and the cell cycle regulator AURKB. This gives some clue on potential functional partners of LINC01605.
Given the established role of HNRNPC in RNA biogenesis, we hypothesize that HNRNPC may be a potential regulator of LINC01605 transcription, although the potential involvement of this protein in LINC01605 downregulation in ESCC requires further investigation. AURKB, owing to the facts that its expression correlates with that of LINC01605 and that it interacts with LINC1605, may have an upstream or downstream regulatory relationship with LINC10605 during esophageal cancer transformation. AURKB is crucial for ensuring the correct separation of chromosomes, the activation of mitotic spindle test points, and the successful completion of cytokinesis. AURKB has been suggested to be a key oncogene in many other malignant tumors, and its high expression is often associated with disease progression and poor prognosis [38]. Two previous studies demonstrated that AURKB expression was elevated at the transcription level in ESCC [39, 40]. Inhibition of AURKB by kinase inhibitors suppresses the growth of ESCC cells and leads to cell cycle arrest in the G2/M phase [41], suggesting that AURKB plays an oncogenic role in ESCC. However, no in-depth research has been conducted to elucidate the specific mechanism by which AURKB participates in esophageal carcinogenesis. Our findings indicate that the interaction between LINC01605 and AURKB potentially represents one way in which LINC01605 functions, but how the LINC10605-AURKB interaction participates in the regulation of esophageal cancer transformation is still unclear.
Concurrently, several unresolved questions persist. RNA pull-down assays, conducted in vitro under non-physiological conditions, have inherent limitations: they cannot distinguish direct RNA-protein binding from indirect interactions mediated by co-factors, nor confirm whether such interactions persist in cellular contexts. Therefore, orthogonal validation using in vivo techniques—such as RIP (RNA Immunoprecipitation) or CLIP-seq (Cross-Linking Immunoprecipitation Sequencing)—is essential to verify the physiological relevance of interactions between LINC01605 and HNRNPC and AURKB. The expression levels of LINC01605 and AURKB were correlated exclusively in normal esophageal tissues and not in neoplastic tissues. While AURKB was shown to primarily regulate G2/M phase progression in previous reports, LINC01605 overexpression induced arrest in the G0/G1 phase in KYSE30 cells. These suggest that LINC01605 and AURKB may function in a cell context-dependent or cell cycle phases-dependent way, awaiting further exploration with in situ technologies. Moreover, RNA pull-down data only confirmed the binding of AURKB but revealed no migration/differentiation-related partners, while transcriptomic analyses revealed that genes whose expression was correlated with LINC01605 expression in normal vs. tumor tissues exhibited divergent functional enrichment. This finding suggests that LINC01605 operates within a complex regulatory network in which AURKB represents only one of several effectors. We may have not yet elucidated the central regulatory mechanism that regulate the multifaceted roles of LINC01605, particularly how its diverse molecular interactions converge to drive phenotypic outcomes. While this study confirms LINC01605’s tumor-suppressive role, its molecular mechanisms require further investigation. Ongoing multi-omics and functional studies will address this gap.
Our systematic analysis delineates the stepwise acquisition of canonical cancer hallmarks during esophageal squamous carcinogenesis. LINC01605 expression is downregulated during dedifferentiation-associated malignant progression in ESCC, which modulates multiple dedifferentiation-associated phenotypes and promotes cell proliferation and migration. The physical interaction between LINC01605 and AURKB is one potential mechanism underlying the cell cycle-regulatory functions of LINC01605 in esophageal epithelial transformation.
The datasets used and analyzed during the current study are available from the corresponding authors on reasonable request.
SC and XC were responsible for experimental design. XC were responsible for experimental procedures, data analysis, and figures/charts preparation. XH conducted sample collection and chip array detection. XC drafted the initial manuscript and participated in revisions. LF, TX participated in experimental design and manuscript polishing. HA, JF and JL assisted in figure/chart preparation and manuscript revisions. All authors contributed to editorial changes in the manuscript. All authors read and approved the final manuscript. All authors have participated sufficiently in the work and agreed to be accountable for all aspects of the work.
This study was performed in accordance with the Declaration of Helsinki and was approved by the Ethics Committee of National Cancer Center/Cancer Hospital, Chinese Academy of Medical Sciences and Peking Union Medical College (Ethic Approval Number: 23/532-4275;12-71/605), and all of the patients and their guardians provided signed informed consent.
We gratefully acknowledge the assistance and instruction from professor Tong Tong and Dan Li of State Key Laboratory of Molecular Oncology, National Cancer Center/National Clinical Research Center for Cancer/Cancer Hospital.
This work was supported by the National Natural Science Foundation of China (82372718), the National Key R&D Program of China (2023YFC3503205) and the Chinese Academy of Medical Sciences Innovation Fund for Medical Sciences (No. 2023-I2M-2-004).
The authors declare no conflict of interest.
Supplementary material associated with this article can be found, in the online version, at https://doi.org/10.31083/FBL42805.
References
Publisher’s Note: IMR Press stays neutral with regard to jurisdictional claims in published maps and institutional affiliations.