


 , Wei Chen 1,2, Weibin Huang 1,2, Haoling Cheng 1,2,3,*
1 Department of Neurology, The First Affiliated Hospital, Fujian Medical University, 350005 Fuzhou, Fujian, China
2 Department of Neurology, National Regional Medical Center, Binhai Campus of The First Affiliated Hospital, Fujian Medical University, 350212 Fuzhou, Fujian, China
3 Fujian Institute of Neurology, The First Affiliated Hospital, Fujian Medical University, 350005 Fuzhou, Fujian, China
Abstract
Glioblastoma (GBM) is an extremely aggressive brain tumor, marked by restricted therapeutic possibilities and a generally unfavorable prognosis. GBM’s complexity and heterogeneity necessitate comprehensive genetic and immunological profiling to enhance therapeutic strategies.
The study integrated The Cancer Genome Atlas (TCGA) and Integrative Epidemiology Unit Open Genome-Wide Association Studies (IEU OpenGWAS) data to identify genetic factors influencing GBM using expression quantitative trait loci (eQTL) and genome-wide association studies (GWAS). Mendelian randomization (MR) analysis revealed 250 GBM-associated genes. A GBM risk prediction model was built using Least Absolute Shrinkage and Selection Operator (LASSO) and Cox regression. The research examined immune infiltration, drug response, and mutation profiles to characterize GBM molecular features. Functional enrichment and in vitro experiments validated key findings.
The analysis uncovered significant genetic associations with GBM, emphasizing key genes such as follistatin-like 1 (FSTL1), FXYD domain-containing ion transport regulator 5 (FXYD5), Ras-related protein (RRAS), and ring finger protein 216 pseudogene 1 (RNF216P1). The risk model effectively categorized patients into low-risk and high-risk groups, showing significantly worse survival outcomes in the high-risk group. Immune profiling revealed differential infiltration of cancer-associated fibroblasts (CAFs), macrophages, and T cells, which correlated with the expression levels of the genes that were identified. Patients at high risk showed increased sensitivity to chemotherapeutic drugs such as dasatinib and lapatinib, while those at low risk were more responsive to elesclomol and lisitinib. Notably, key genes such as DCMP Deaminase (DCTD) and RRAS were found to regulate ferroptosis, underscoring their potential as therapeutic targets for GBM treatment.
This study deepens the understanding of GBM by pinpointing critical genetic markers and elucidating their influence on the tumor immune microenvironment (TME) as well as treatment response. The risk model developed in this study holds promise for enhancing prognostic accuracy and facilitating the personalization of GBM therapy.
Keywords
- GBM
- TME
- DCTD
- RRAS
- ferroptosis
- prognostic
Glioblastoma (GBM) ranks among the most malignant and deadly types of primary brain tumors [1, 2, 3, 4]. Although treatments like surgical removal, chemotherapy, and radiation therapy are currently available, their therapeutic efficacy remains limited [5]. The high level of heterogeneity and the complex molecular mechanisms associated with GBM present substantial challenges to research and treatment [6]. In recent years, driven by advancements in bioinformatics approaches and sequencing technologies, researchers have initiated investigations into the GBM utilizing expression quantitative trait loci (eQTL) analysis and genome-wide association study (GWAS) [7, 8, 9]. These studies offer novel insights into the identification of key genes associated with GBM and elucidate their functions in tumor initiation, progression, and therapeutic intervention.
In recent years, the understanding of tumor immune dynamics has continued to advance [10]. GBM is distinguished by density of effective tumor-infiltrating CD8+ T lymphocytes within the tumor immune microenvironment (TME), alongside a concomitant rise in immunosuppressive cell populations [11, 12, 13, 14, 15]. These findings underscore the “cold tumor” characteristics of GBM and highlight that immune activation constitutes a promising strategy for GBM treatment. Specifically, targeting distinct immune cell populations to counteract the immunosuppressive TME is increasingly acknowledged as a critical approach to enhancing GBM therapeutic outcomes [16, 17].
This study integrates data from The Cancer Genome Atlas (TCGA) and Integrative Epidemiology Unit Open Genome-Wide Association Studies (IEU OpenGWAS) project to explore the genetic factors influencing GBM, focusing on the identification of eQTLs and genetic variants associated with risk of GBM. Through Mendelian randomization (MR) analysis, we identify 250 genes significantly associated with GBM, many of which have potential implications for treatment. This work deepens our understanding of GBM biology and lays the groundwork for developing targeted genetic and immune-based therapies. Through this integrative approach, we aim to improve prognostic accuracy and identify novel therapeutic targets, particularly those involved in immune modulation and ferroptosis regulation. Our findings could significantly impact the development of personalized treatment regimens for GBM, contributing to more effective clinical management.
The dataset comprises a total of 176 GBM samples, categorized into 5
non-cancerous adjacent tissues and 171 tumor tissues, along with their respective
clinical details from TCGA. Additionally, we obtained 59 GBM samples with matched
clinical data from the Gene Expression Omnibus (GEO) repository (accession number
GSE4421, https://www.ncbi.nlm.nih.gov/geo/), which were also subjected to
normalization procedures. eQTL data encompassing 19,942 genes (refer to
Supplementary Table 1), where significant single nucleotide
polymorphisms (SNPs) were identified based on a significance threshold of
p
To guarantee the reliability of the MR analysis, potential instrumental
variables (IVs) were chosen using a significance criterion of p
In the MR analysis, the core assumptions were carefully considered: the relevance of the IVs to the exposure, their independence from confounding factors, and the exclusion of direct effects on the outcome. The Wald ratio method was employed to obtain unconfounded MR estimates for each SNP. To further assess the robustness of the findings and account for potential pleiotropy, meta-analysis of the individual estimates was conducted using multiple methods. These methods allow for the assessment of causality while minimizing bias from pleiotropic effects and ensuring the reliability of the MR estimates.
Functional enrichment of differentially expressed gene modules between
TCGA-derived high- and low-risk groups was performed using Gene Ontology (GO,
https://geneontology.org/) and Kyoto Encyclopedia of Genes and Genomes (KEGG,
https://www.kegg.jp/kegg/) analyses via the clusterProfiler (v4.10.0,
https://www.bioconductor.org/packages/release/bioc/html/clusterProfiler.html)
package in R. GO terms were identified with the enrichGO function (q
Expression data of intersecting genes were extracted from TCGA and combined with
clinical data. The coxph function to select candidate genes significantly
affecting GBM patient prognosis. LASSO regression analysis was then performed
using the “glmnet” and “survminer” packages (v4.1-8, v0.4.9) in R language
(v4.3.2) with the glmnet and cv.glmnet functions. Multivariate Cox regression
analysis determined the final prognostic genes (p
All configured with the same parameter settings from a unified configuration file. The ssGSEA scores for each pathway were calculated using the gsva function and subsequently normalized via the normalize function.
GBM samples from TCGA with higher scores indicating stronger immune escape capability and poorer immunotherapy efficacy. Since the TIDE database (http://tide.dfci.harvard.edu/) does not include a specific category for GBM, the tumor type was designated as “Other” and the prior immunotherapy type was specified as “None”. Prior to uploading to the TIDE database, the TCGA GBM expression data were log2-transformed. The chi-square test was utilized to assess differences in immunotherapy response rates between these two groups.
The “pRRophetic” R package (v0.5) was employed to forecast sensitivity to
chemotherapy drugs, and a correlation analysis was carried out between the drug
sensitivity data and the riskScore, applying a filter with a significance
threshold of p
RSL3, ferrostatin-1, deferoxamine, JKE-1674, and atezolizumab (HY-100218C, HY-100579, HY-B1625R, HY-138153, HY-P9904) were purchased from MedChemExpress (Shanghai, China). The siRNAs and shRNA plasmids for DCTD and RRAS were constructed by Shanghai Genechem (China). Antibodies against RRAS (27457-1-AP), SLC7A11 (26864-1-AP), DCTD (68357-1-Ig), ACSL4 (22401-1-AP), GAPDH (10494-1-AP), and GPX4 (30388-1-AP) were obtained from Proteintech (Wuhan, China). All the primary antibodies were diluted at a ratio of 1:1000. Specifically, the sequence for both si-RRAS1 and sh-RRAS1 is 5′-ACACGAAGATCTGCAGTGTGGAT-3′, while the sequence for si-RRAS2 and sh-RRAS2 is 5′-AGACGAAGATCTGCAGTGTGGAC-3′. Additionally, the sequences for si-DCTD1 and sh-DCTD1 are 5′-GGAUCUUCUGCUUCCAAUA-3′, and those for si-DCTD2 and sh-DCTD2 are 5′-CCAAGACAGAUCCUGUUAU-3′.
Human glioblastoma cell lines U-87MG, A172, and TG-905 (ATCC, Shanghai, China) were cultured in a CO2 incubator (TCI-80, Panasonic Healthcare Holdings Co., Ltd, Ora, Japan) at 37 °C and monitored every 8 or 24 h as required. Cells were subcultured at 80–95% confluence. All disposable materials were UV-sterilized in a laminar flow cabinet (Jiesen, Xuzhou, Jiangsu, China), and procedures were performed with sterile gloves. After trypsin digestion, cells were suspended in complete growth medium, centrifuged, and resuspended in fresh medium for continued culture. During cell culture, we regularly add mycoplasma scavengers to the medium to avoid mycoplasma contamination.
Cells were cultured in 6-well plates to reach 70–80% confluence. The medium was replaced with serum-free opti-MEM before transfection. Transfection was performed using Lipofectamine 3000 (L3000015, Thermo Fisher Scientific, Shanghai, China) according to the manufacturer’s instructions, with either plasmid DNA or siRNA. This complex was then added dropwise to the cells in the 6-well plates. For siRNA transfection, a similar procedure was followed, but with siRNA molecules instead of plasmids. The cells were exposed to the transfection complexes for a 6-hour period at 37 °C. Following this incubation, the existing medium was substituted with new complete medium supplemented with 10% fetal bovine serum (FBS), aiming to promote cell recovery. Post-transfection, cells were incubated for 48 hours under standard culture conditions before being used for further experimentation, such as RNA/protein extraction, phenotypic analysis, or functional assays. All cell lines were validated by short tandem repeat (STR) profiling and tested negative for mycoplasma.
Protein extracts were prepared by lysing cells in cold lysis buffer with protease and phosphatase inhibitors, followed by centrifugation to obtain the soluble protein fraction. Protein concentrations were determined using a BCA assay (E-BC-K318-M, Elabscience Biotechnology Inc., Wuhan, Hubei, China), and samples were mixed with sodium dodecyl sulfate (SDS) buffer and denatured by heating. Proteins were separated by sodium dodecyl sulfate - polyacrylamide gel electrophoresis (SDS-PAGE) using a 10% resolving gel.
Cells (5000–10,000 per well) were seeded in 96‑well plates. On day 1, the medium was replaced with 100 µL 3-(4,5-Dimethylthiazol-2-yl)-2,5-diphenyltetrazolium bromide (MTT) solution (5 mg/mL in PBS) and incubated for 2–4 h at 37 °C. The solution was aspirated, and 100 µL dimethyl sulfoxide (DMSO) was added to dissolve formazan crystals. Absorbance was measured at 490 nm using a microplate reader. This procedure was repeated daily for 4 days to monitor proliferation. Optical density (OD) values were plotted with GraphPad Prism to determine cell viability.
Cells (500/well) were seeded in 6‑well plates and cultured for 1–2 weeks, with
medium changes every 3–4 days. Colonies (
A scratch was created in confluent monolayers using a sterile pipette tip. Cells were rinsed with PBS to remove debris and cultured in serum‑free medium. Wound areas were imaged at 0, 24, and 48 h to assess closure.
Matrigel‑coated Transwell inserts were seeded with 2
Cell viability was evaluated using the CellTiter-Glo 3D assay by measuring luminescence after treatment with ferroptosis inducers and inhibitors. Lipid peroxidation was assessed using the BODIPY C11 probe, with the ratio of oxidized to reduced fluorescence indicating peroxidation levels. Glioblastoma cells were treated for 24–72 hours. Luminescence and fluorescence were measured using microplate readers. Higher luminescence indicates higher viability, while a higher oxidized/reduced fluorescence ratio indicates greater lipid peroxidation.
Regarding the animal housing environment, experimental animals are housed in a
dedicated animal facility with stringent environmental controls. This facility
complies with the CV grade standard. The indoor temperature is consistently
maintained at 22
For normally distributed variables, an independent Student’s t-test was used to assess statistical significance, whereas the Mann-Whitney U test (also known as the Wilcoxon rank-sum test) was used for non-normally distributed data.
We analyzed eQTL data from blood samples for 19,942 genes to explore
associations with GBM. After filtering, 15,306 eQTLs and 52,674 SNPs were
selected for MR analysis. Cross-referencing with GBM GWAS data identified 49,823
SNPs with F-statistics
| Exposure | Outcome | Method | Number of snps (nsnp) | Odds ratio (OR) | p-value |
| LASP1 | GBM | IVW | 3 | 0.234285521 | 0.030196333 |
| TMEM176A | GBM | IVW | 10 | 1.337120107 | 0.030242543 |
| ABCB4 | GBM | IVW | 4 | 2.362778825 | 0.017639507 |
| PIGQ | GBM | IVW | 5 | 0.642623723 | 0.048735022 |
| REV3L | GBM | IVW | 3 | 4.954818981 | 0.007054886 |
| CENPQ | GBM | IVW | 5 | 0.653119937 | 0.038074344 |
| HDAC7 | GBM | IVW | 5 | 2.858542543 | 0.030569944 |
| TM7SF3 | GBM | IVW | 3 | 0.546623119 | 0.041128099 |
| PPP2R5A | GBM | IVW | 14 | 1.315265079 | 0.031130963 |
| PIGB | GBM | IVW | 8 | 0.560676847 | 0.041232804 |
| SNX13 | GBM | IVW | 3 | 3.967132214 | 0.023836261 |
| CPSF1 | GBM | IVW | 5 | 0.625207929 | 0.006158371 |
| TRNT1 | GBM | IVW | 3 | 0.708537439 | 0.016643474 |
| MKRN2 | GBM | IVW | 3 | 1.610090257 | 0.017161702 |
| FDFT1 | GBM | IVW | 9 | 1.445814007 | 0.00687006 |
| COL5A3 | GBM | IVW | 4 | 0.446703397 | 0.017351648 |
| COL19A1 | GBM | IVW | 4 | 3.661688936 | 0.018964318 |
| EPDR1 | GBM | IVW | 9 | 1.493968694 | 0.011220874 |
| CEACAM6 | GBM | IVW | 9 | 2.764615335 | 0.00069327 |
| OGFOD1 | GBM | IVW | 3 | 2.004872837 | 0.006251935 |
| TXNDC16 | GBM | IVW | 3 | 3.833823698 | 0.009449636 |
| CRLS1 | GBM | IVW | 5 | 0.662801005 | 0.016040426 |
| TRMT6 | GBM | IVW | 3 | 3.27534107 | 0.006371904 |
| FXYD5 | GBM | IVW | 5 | 1.361637017 | 0.049959839 |
| PABPC4 | GBM | IVW | 4 | 0.374235054 | 0.004109722 |
| PUS7 | GBM | IVW | 6 | 0.635717639 | 0.008094332 |
| MYO9B | GBM | IVW | 7 | 0.489387655 | 0.03466818 |
| SNAP29 | GBM | IVW | 5 | 0.76659918 | 0.04563895 |
| LGALS2 | GBM | IVW | 13 | 1.32099983 | 0.023503911 |
| TFIP11 | GBM | IVW | 3 | 1.929815065 | 0.024781061 |
| GCAT | GBM | IVW | 12 | 0.761115891 | 0.04356418 |
| FBXO7 | GBM | IVW | 12 | 0.564907555 | 0.031886199 |
| POLR3H | GBM | IVW | 3 | 0.170032614 | 0.010041668 |
| ZBED4 | GBM | IVW | 3 | 0.545431815 | 0.039022602 |
| CTSG | GBM | IVW | 20 | 1.276717345 | 0.044523109 |
| PLEK2 | GBM | IVW | 18 | 1.49929334 | 0.04379283 |
| CEP128 | GBM | IVW | 5 | 1.537916949 | 0.019734395 |
| BIRC7 | GBM | IVW | 4 | 1.524109089 | 0.030433948 |
| TNNC2 | GBM | IVW | 10 | 1.550413319 | 0.024564826 |
| USP14 | GBM | IVW | 4 | 0.544539562 | 0.033811078 |
| LPIN2 | GBM | IVW | 10 | 0.73788175 | 0.032064161 |
| MTHFSD | GBM | IVW | 3 | 0.384793667 | 0.035959678 |
| VPS18 | GBM | IVW | 3 | 13.11672381 | 0.049516287 |
| DHDH | GBM | IVW | 4 | 1.941378323 | 0.040460769 |
| STX10 | GBM | IVW | 4 | 2.245125015 | 0.043323833 |
| VRK3 | GBM | IVW | 3 | 0.676133917 | 0.037010888 |
| STX1A | GBM | IVW | 3 | 4.670459921 | 0.001098323 |
| CEP41 | GBM | IVW | 3 | 0.419640125 | 0.033896749 |
| GLIS3 | GBM | IVW | 3 | 2.167903033 | 0.045779531 |
| ANKRD26 | GBM | IVW | 3 | 1.525797177 | 0.043027895 |
eQTL, expression quantitative trait loci; GWAS, genome-wide association study; MR, Mendelian randomization; GBM, glioblastoma; IVW, inverse-variance weighted.
To further screen for GBM-related genes, a differential analysis was conducted on mRNA data derived from TCGA cancerous tissues and adjacent normal tissues. Using a false discovery rate (FDR) threshold of less than 0.05 and a logFC value greater than 0.585 as screening criteria, a total of 9942 differentially expressed genes were identified (Supplementary Table 8). Heatmap and volcano plot analyses revealed significant differences in gene expression between the two groups, with fewer upregulated genes observed in the tumor group compared to the adjacent normal group (Fig. 1A,B). By intersecting the risk gene sets obtained from both TCGA and MR analyses, we identified 50 genes that were significantly associated with GBM. Among these, 39 genes were classified as high-risk genes for GBM, while 11 genes were identified as protective genes for GBM (Fig. 1C,D, Supplementary Table 9).
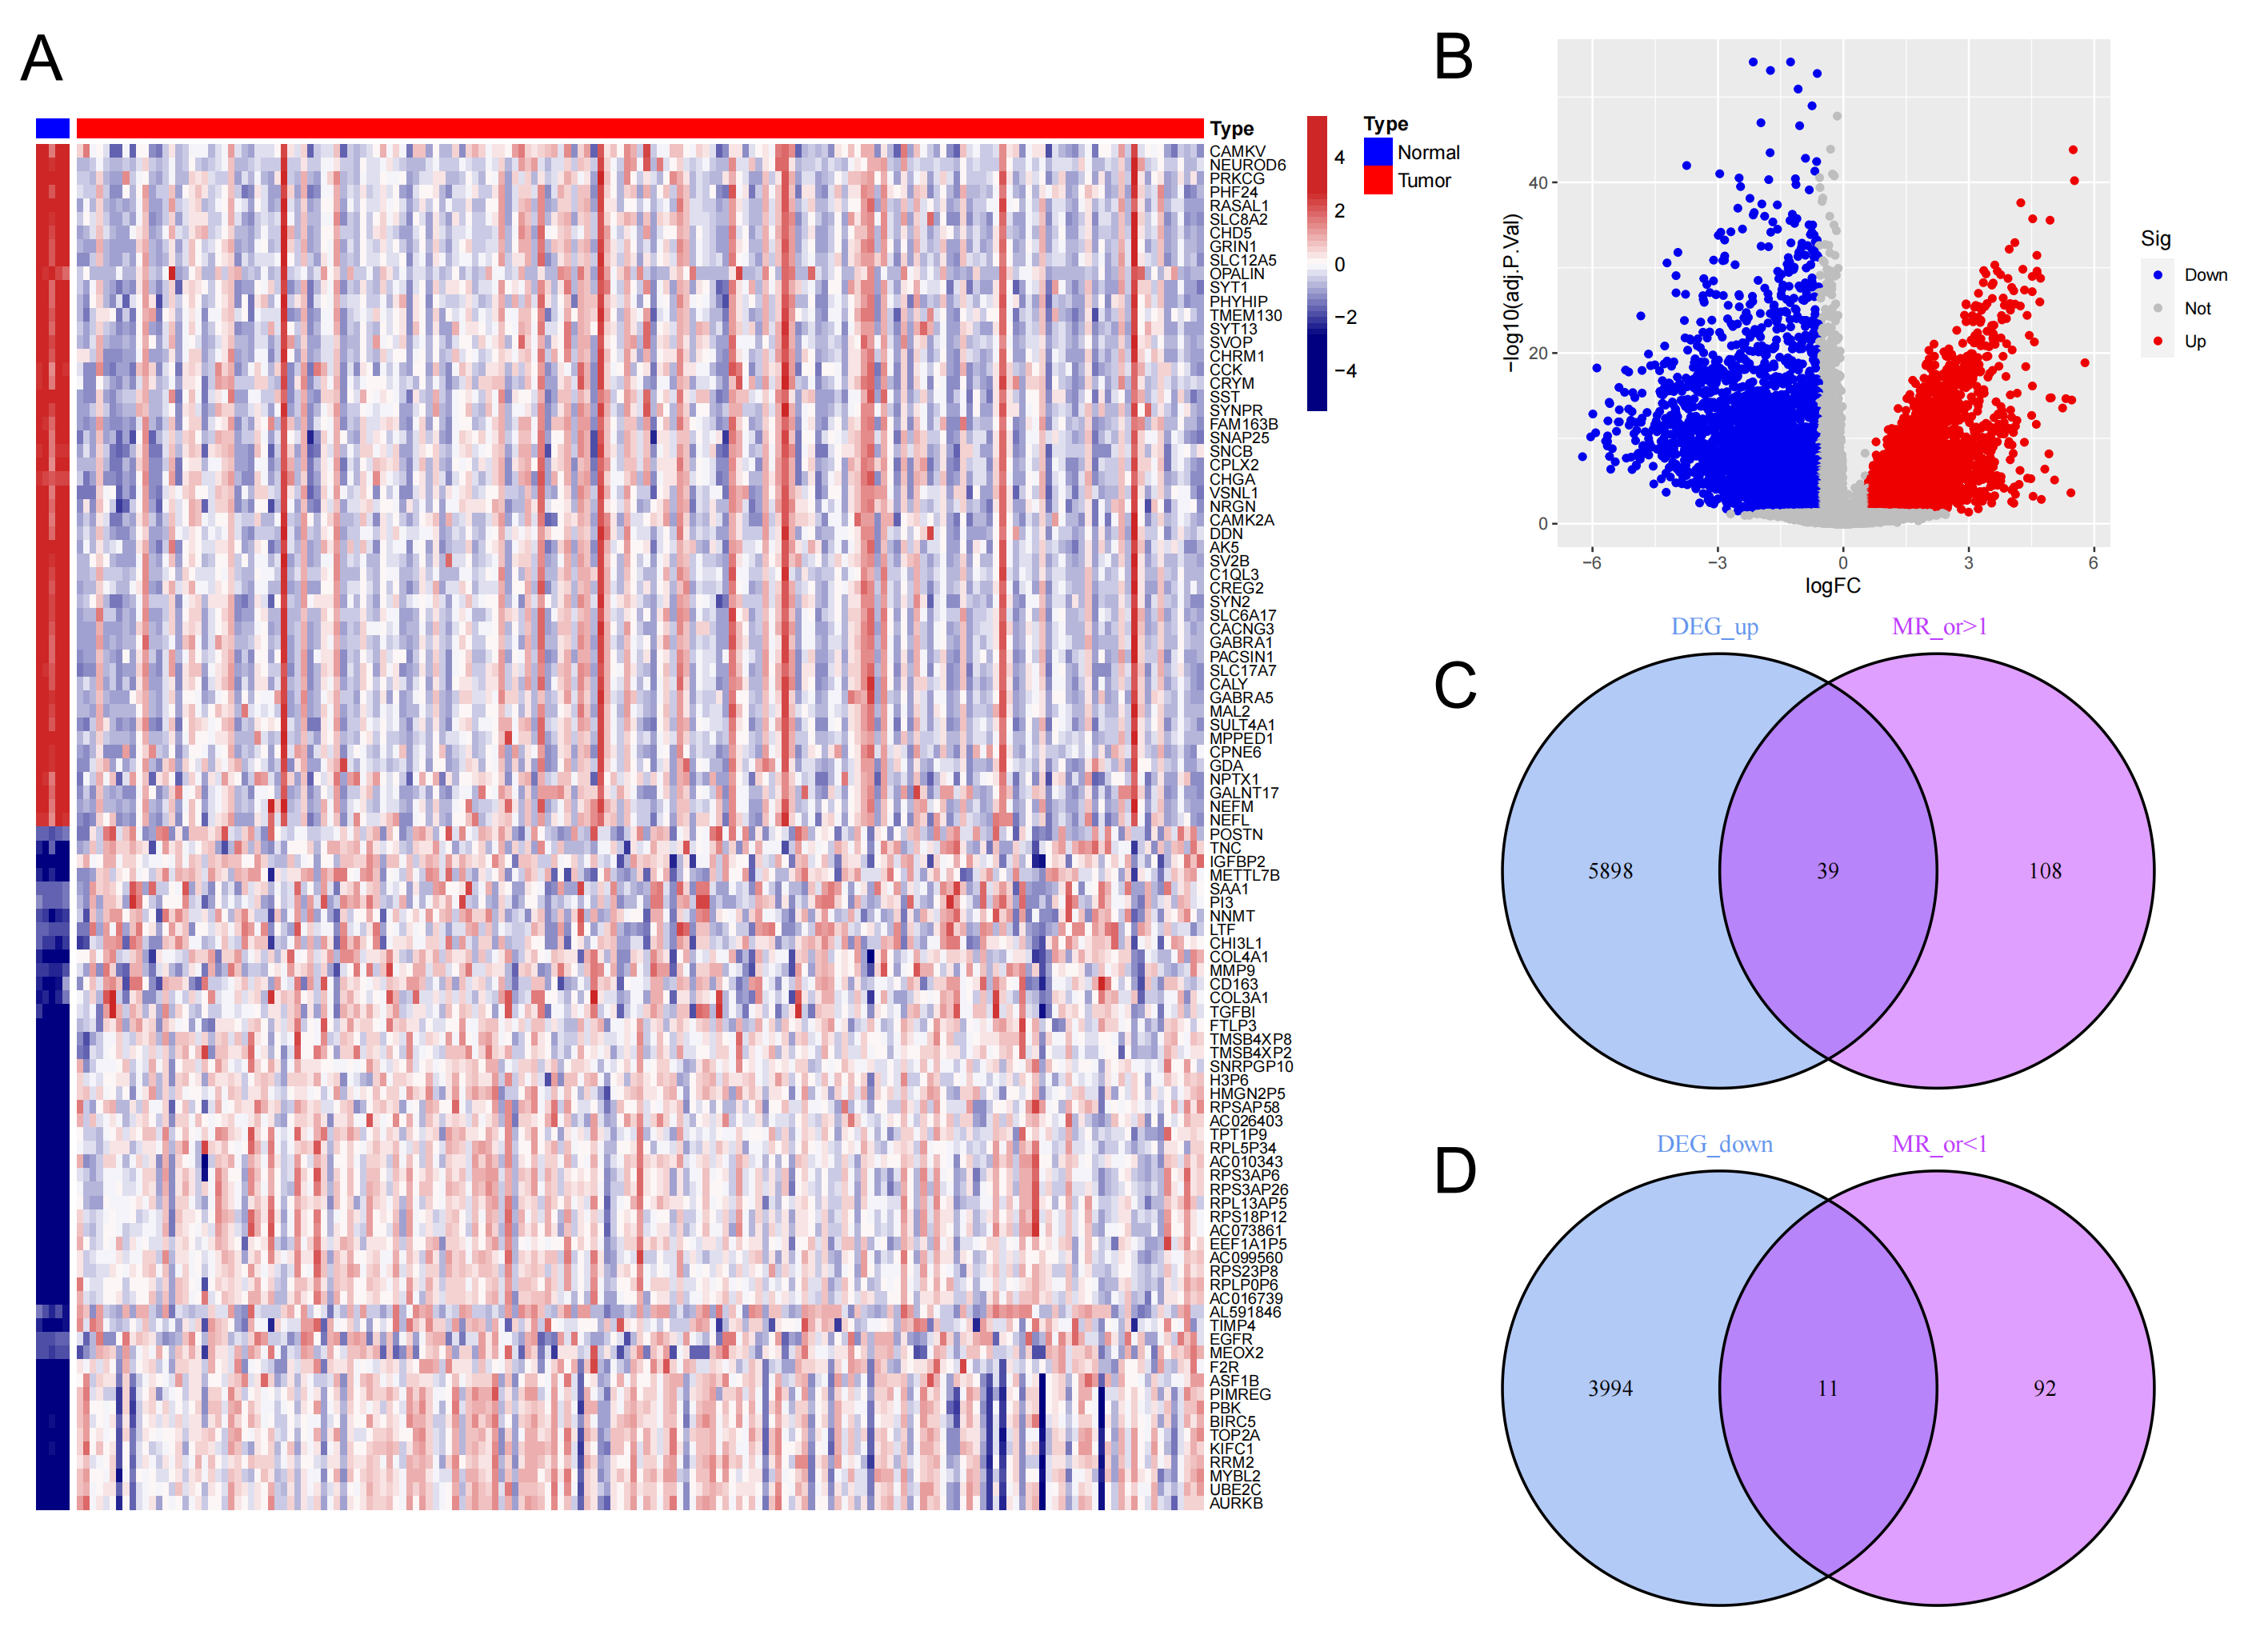 Fig. 1.
Difference analysis of GBM mRNA expression between cancer group and paracancer group, and acquisition of risk genes. (A,B) Heatmap and volcano plot illustrating genes differentially expressed between the cancer and paracancer groups. Elevated expression in tumor tissues is indicated in red, while higher expression in normal tissues is shown in blue. (C) Overlap between genes highly expressed in the cancer group and those with an odds ratio (OR) greater than 1 based on MR analysis. (D) Overlap between genes predominantly expressed in the paracancer group and those with an odds ratio (OR) less than 1 according to MR analysis. MR, Mendelian randomization; GBM, glioblastoma; DEG, differentially expressed genes.
Univariate Cox regression analysis conducted on the 50 candidate genes indicated that 11 genes exhibited a statistically significant link to the prognosis of GBM patients (Fig. 2A). Subsequent MR analysis indicated that the eQTLs of these 11 genes may have a significant impact on GBM prognosis (Fig. 2B). The Circos plot visually illustrates the chromosomal locations of these 11 genes (Fig. 2C). Cross-validation curve analysis and LASSO coefficient path analysis determined four risk genes (FSTL1, FXYD5, RRAS, and RNF216P1) as variables in the model and provided the model coefficients for each gene (Fig. 2D,E, Supplementary Table 10).
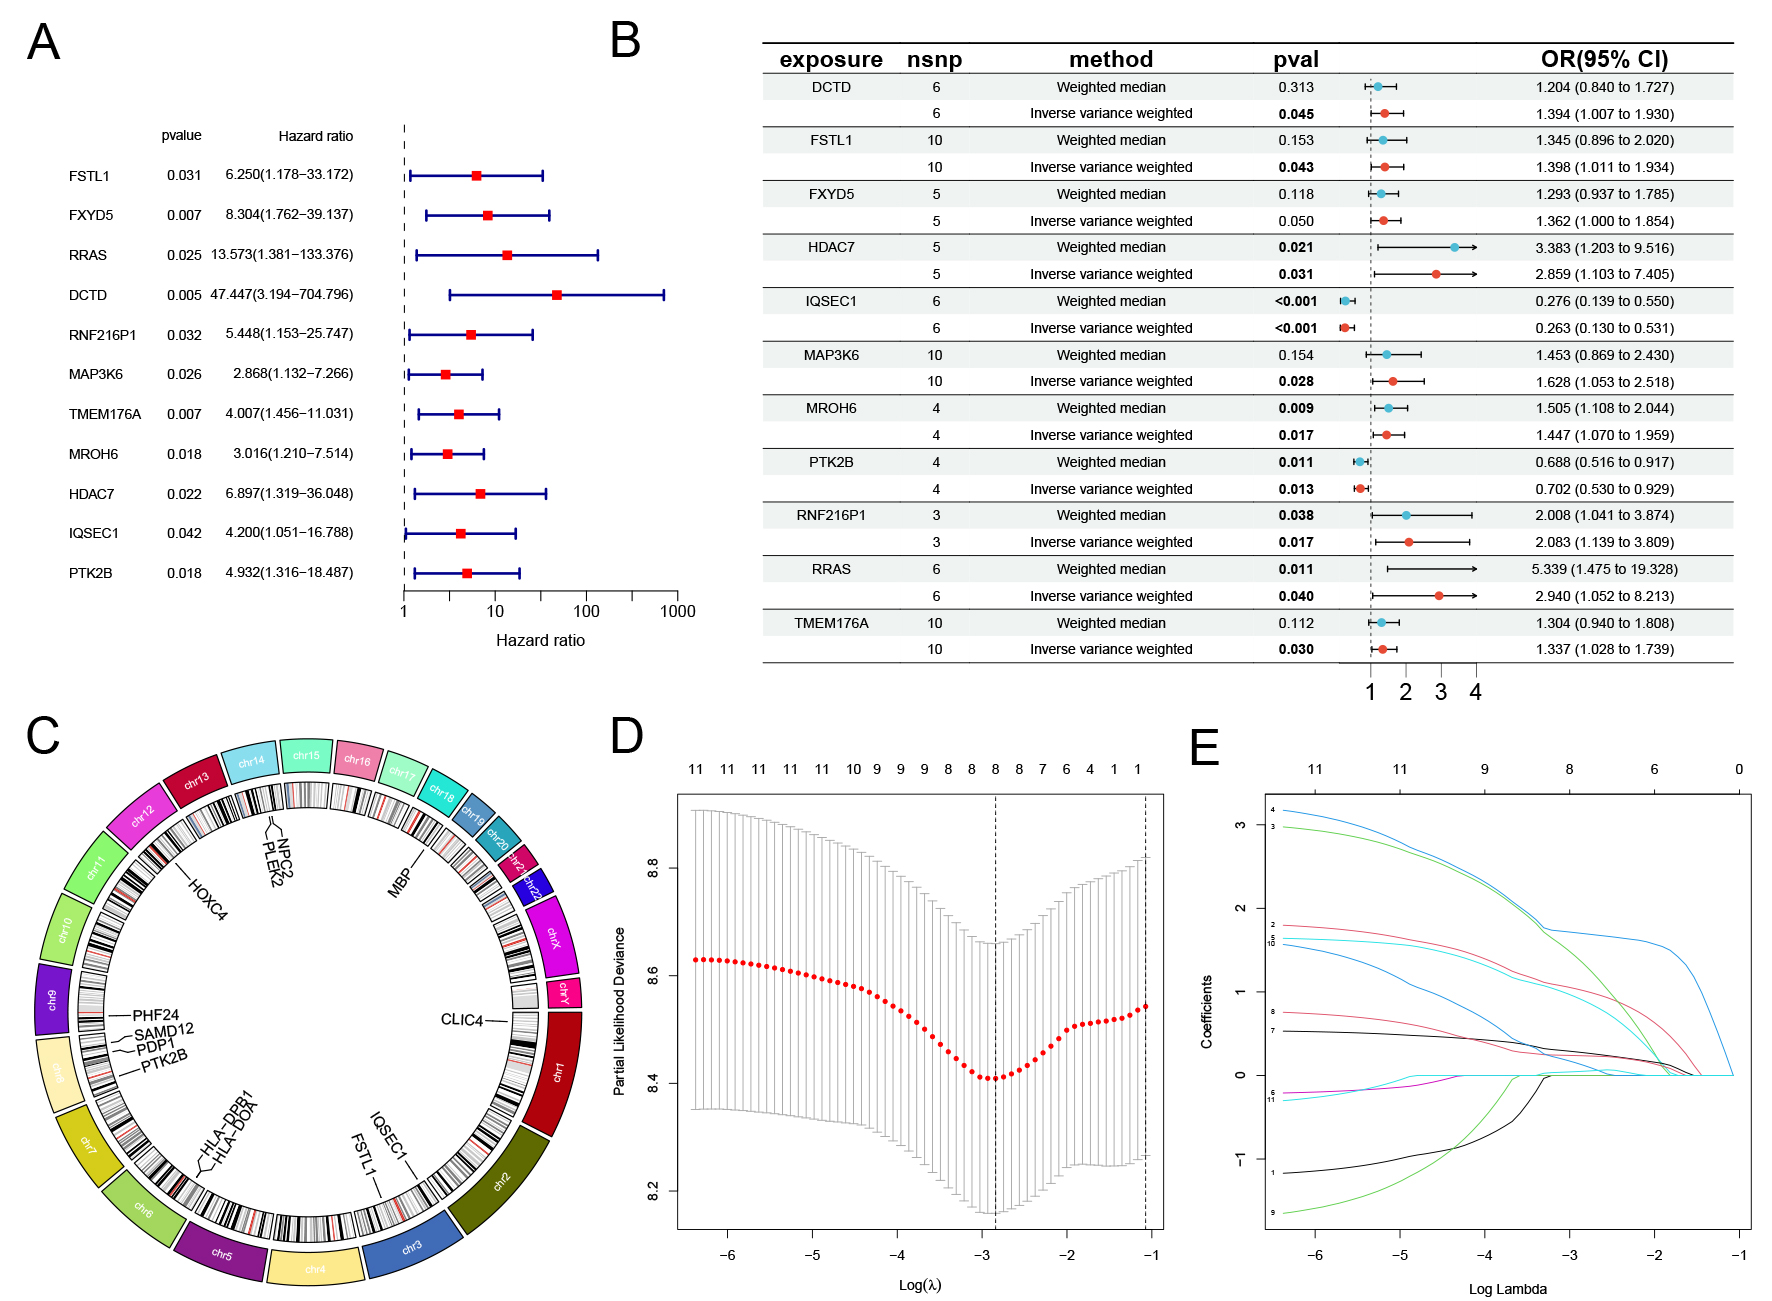 Fig. 2.
Acquisition of GBM candidate genes and establishment of LASSO
regression model. (A) Univariate Cox analysis of candidate genes in GBM
patients (p
TCGA tumor samples were divided randomly into training and testing cohorts. Four key genes were significantly higher in the high-risk group than in the low-risk group. High-risk individuals showed higher mortality and shorter survival times (Fig. 3A–C). Survival analysis confirmed that high-risk patients had notably lower survival rates (Fig. 3D–F). Data validation analysis was also performed using the GSE4421 dataset. Unfortunately, the RNA expression data in this dataset does not include RNF216P1, so the results from this analysis cannot be used (Supplementary Fig. 1). These findings were consistent when validated across all TCGA tumor samples, underscoring the importance of these four genes in GBM prognosis.
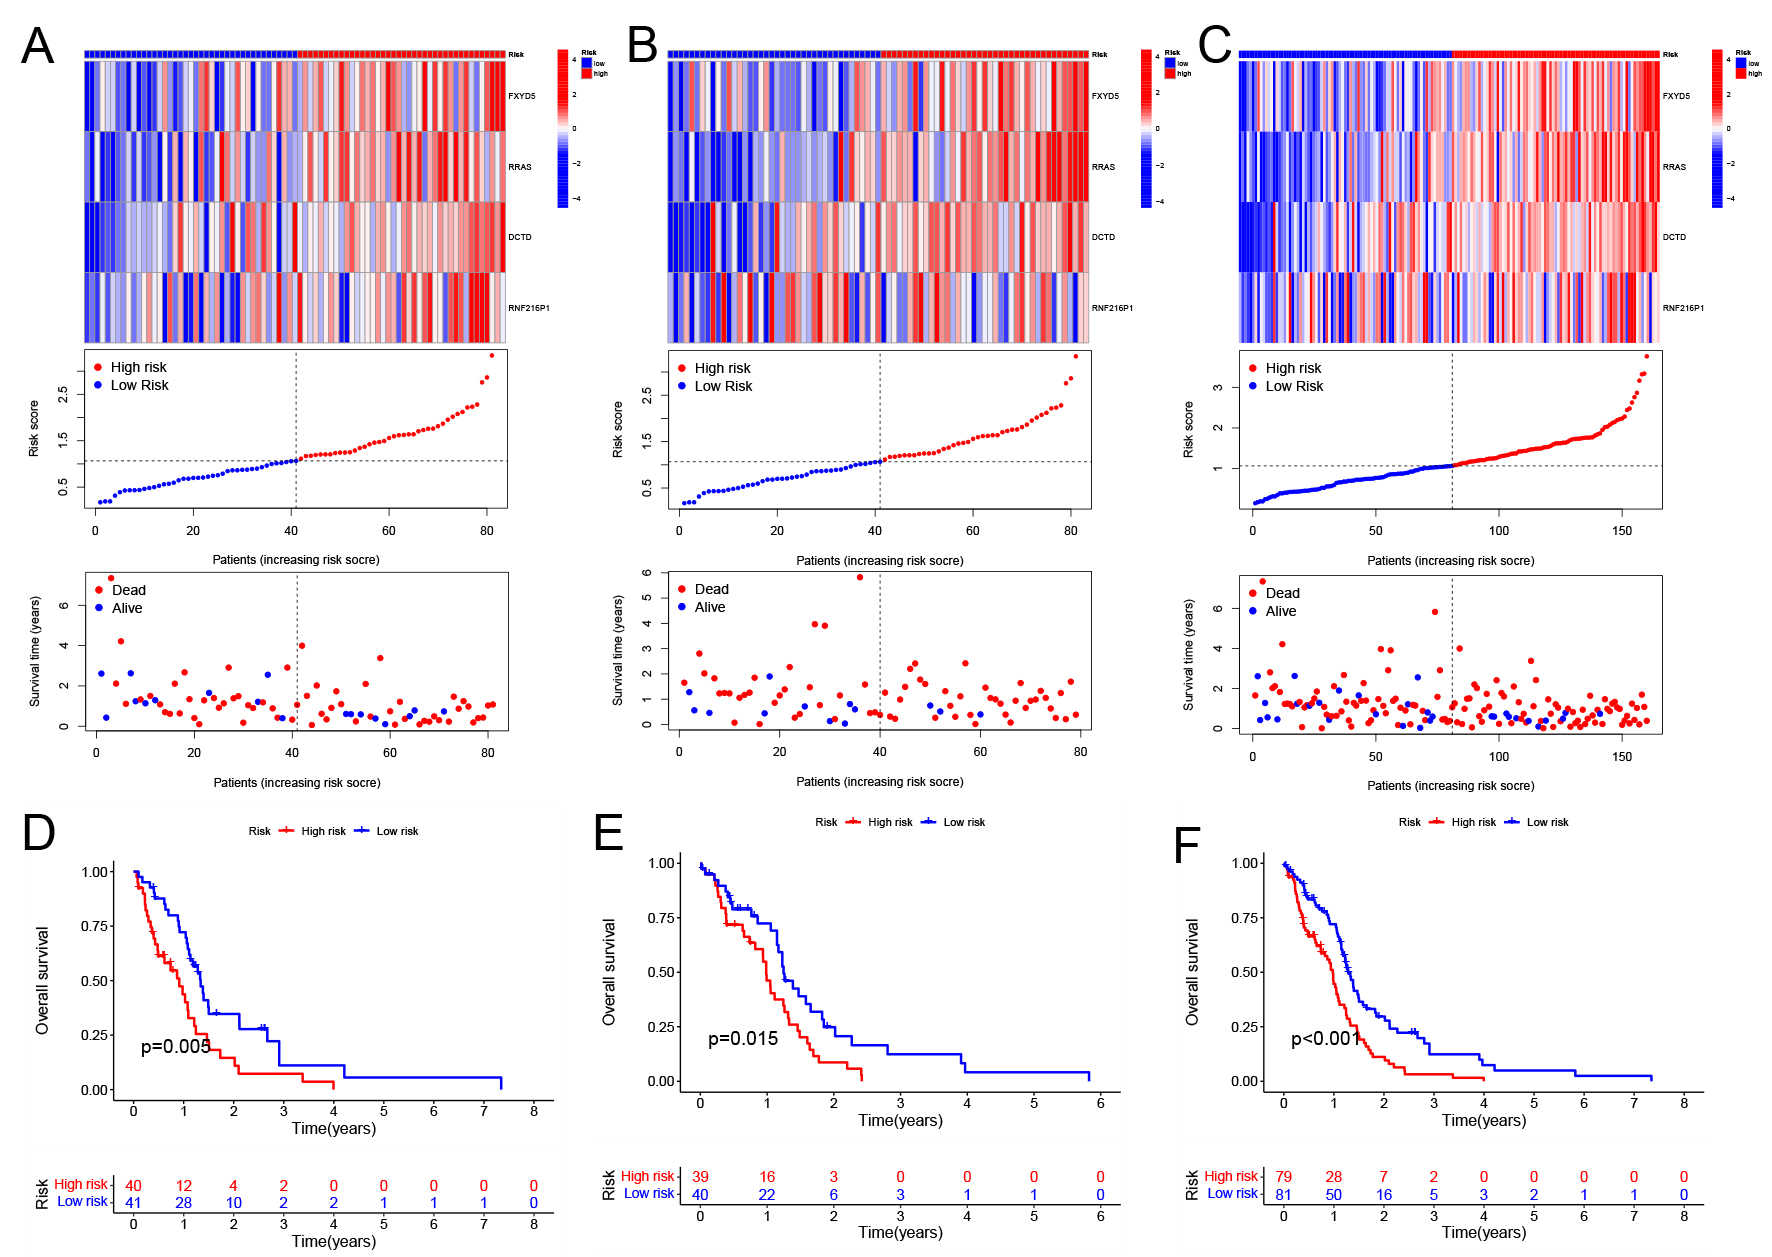 Fig. 3.
Survival status and gene expression differences across high- and low-risk categories. ((A) Training cohort, (B) Testing cohort, (C) Combined cohort) The expression levels of four critical genes and their association with riskScore and survival outcomes. ((D) Training cohort, (E) Testing cohort, (F) Combined cohort) Survival regression analysis comparing high- and low-risk groups.
In conjunction with age and gender, was significantly associated with GBM prognosis, exhibiting a hazard ratio (HR) greater than 1.5. This suggests that an elevated riskScore is correlated with a poorer prognosis (Fig. 4A,B). Receiver operating characteristic (ROC) curves and the concordance index (C-index) further demonstrated that the riskScore possessed high specificity and sensitivity for predicting GBM prognosis (Fig. 4C,D, Supplementary Fig. 2). A more sophisticated predictive model integrating age, gender, and the riskScore was subsequently developed to enhance prediction accuracy (Fig. 4E). This model exhibited robust accuracy in forecasting 2- and 3-year survival rates, albeit with slightly diminished performance for 1-year survival prediction (Fig. 4F). Principal component analysis (PCA) effectively differentiated between high-risk and low-risk groups, particularly through the application of the four identified risk-associated genes (Fig. 4G–I).
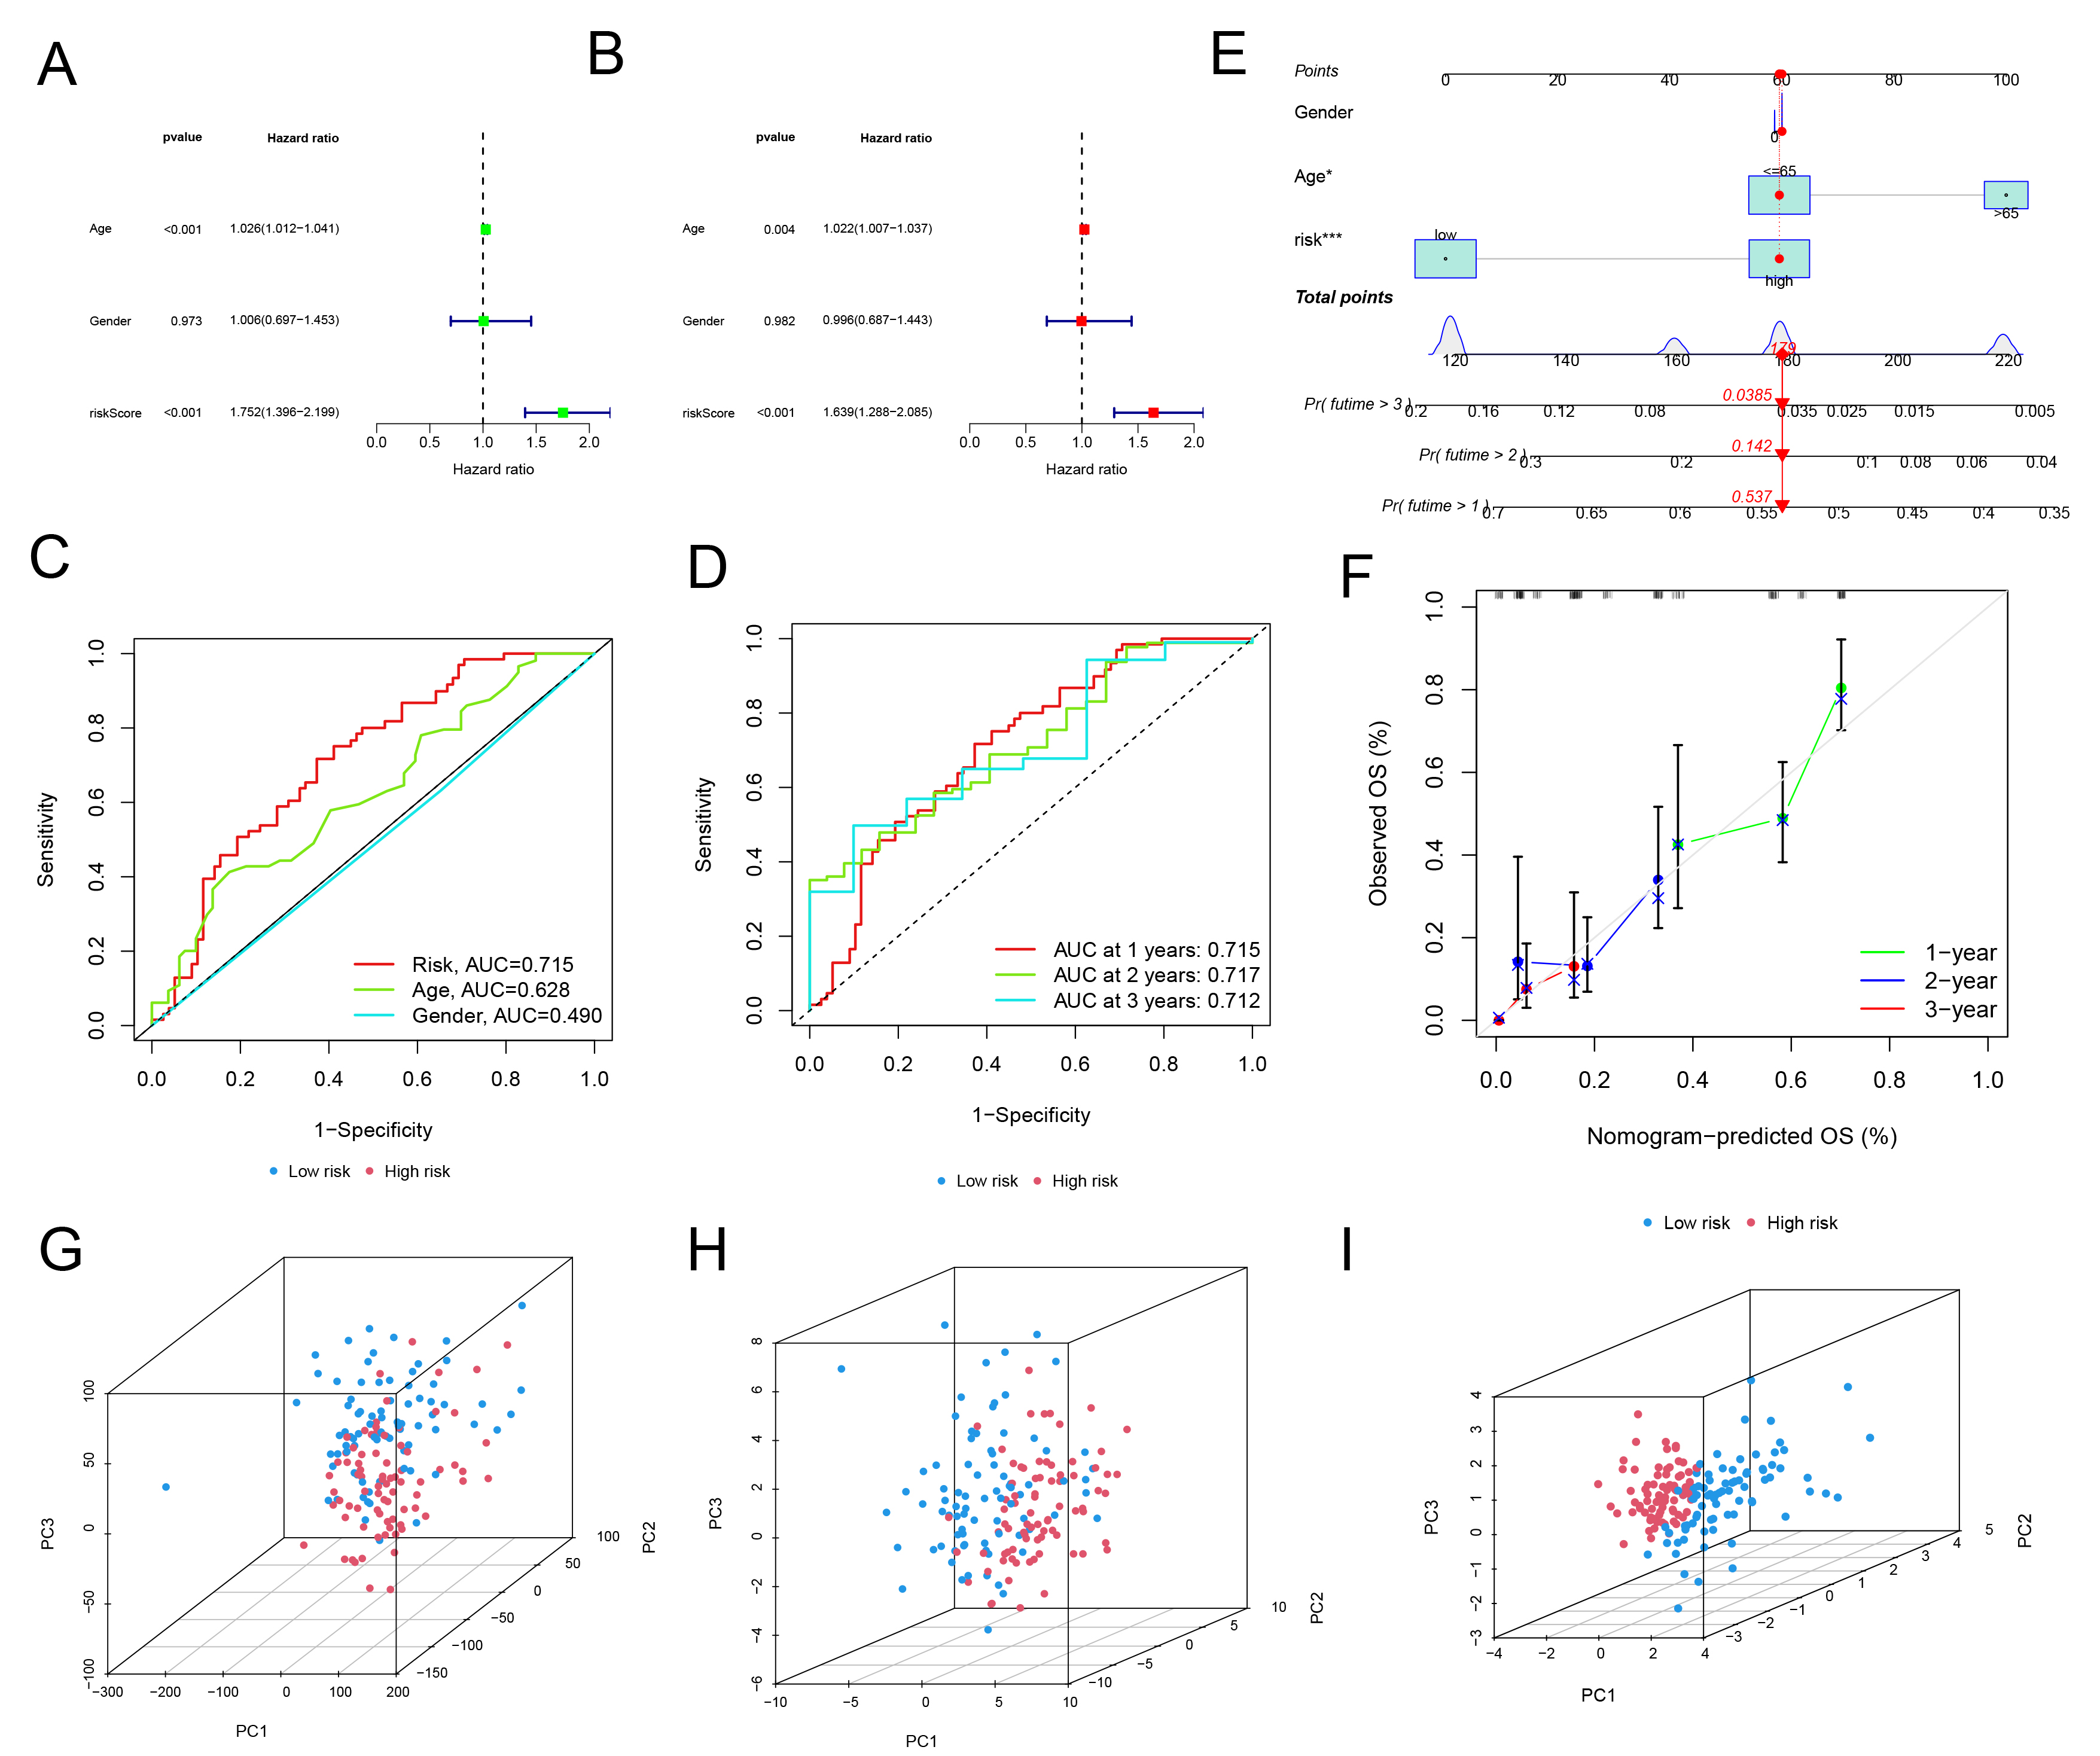 Fig. 4.
Validation of risk regression model. (A) Univariate regression
analysis was conducted to assess the impact of riskScore, sex, and age on
glioblastoma (GBM) patients. (B) A multivariate regression model was employed to
evaluate the combined effects of riskScore, gender, and age in GBM patients. (C)
Receiver operating characteristic (ROC) curves were generated for riskScore, sex,
and age. (D) ROC curves specifically for riskScore at 1, 2, and 3 years were
plotted. (E) A nomogram incorporating gender, age, and riskScore was developed
for GBM patients. *p
These genes were categorized into two groups: those more highly expressed in the high-risk group and those more prevalent in the low-risk group. GO and KEGG pathway enrichment analyses were then conducted for each gene group. Results revealed in the high-risk group, that gene sets, including those linked to cytokine activity, chemokine activity, and immune cell migration were significantly enriched. Conversely, in the low-risk group, gene sets associated with ion transport and neurotransmitter regulation, such as modulation of chemical synaptic transmission and regulation of metal ion transport, were mainly enriched (Fig. 5A–D, Supplementary Tables 11–13). Consistent with these findings, KEGG enrichment analysis mirrored the GO results, demonstrating high-risk group was related to cytokines, chemokines, and inflammation, such as interleukin-17 (IL-17) and tumor necrosis factor (TNF) signaling (Fig. 5E,F, Supplementary Table 14). The low-risk group was significantly associated with neuroactive ligand-receptor interactions and calcium signaling pathways, which are involved in ion transport and neurotransmitter regulation. The low-risk group exhibited increased expression of genes related to ion transport and neurotransmitter regulation (Fig. 5G,H, Supplementary Table 15). These findings indicate that the riskScore effectively distinguishes major gene expression patterns in GBM patients.
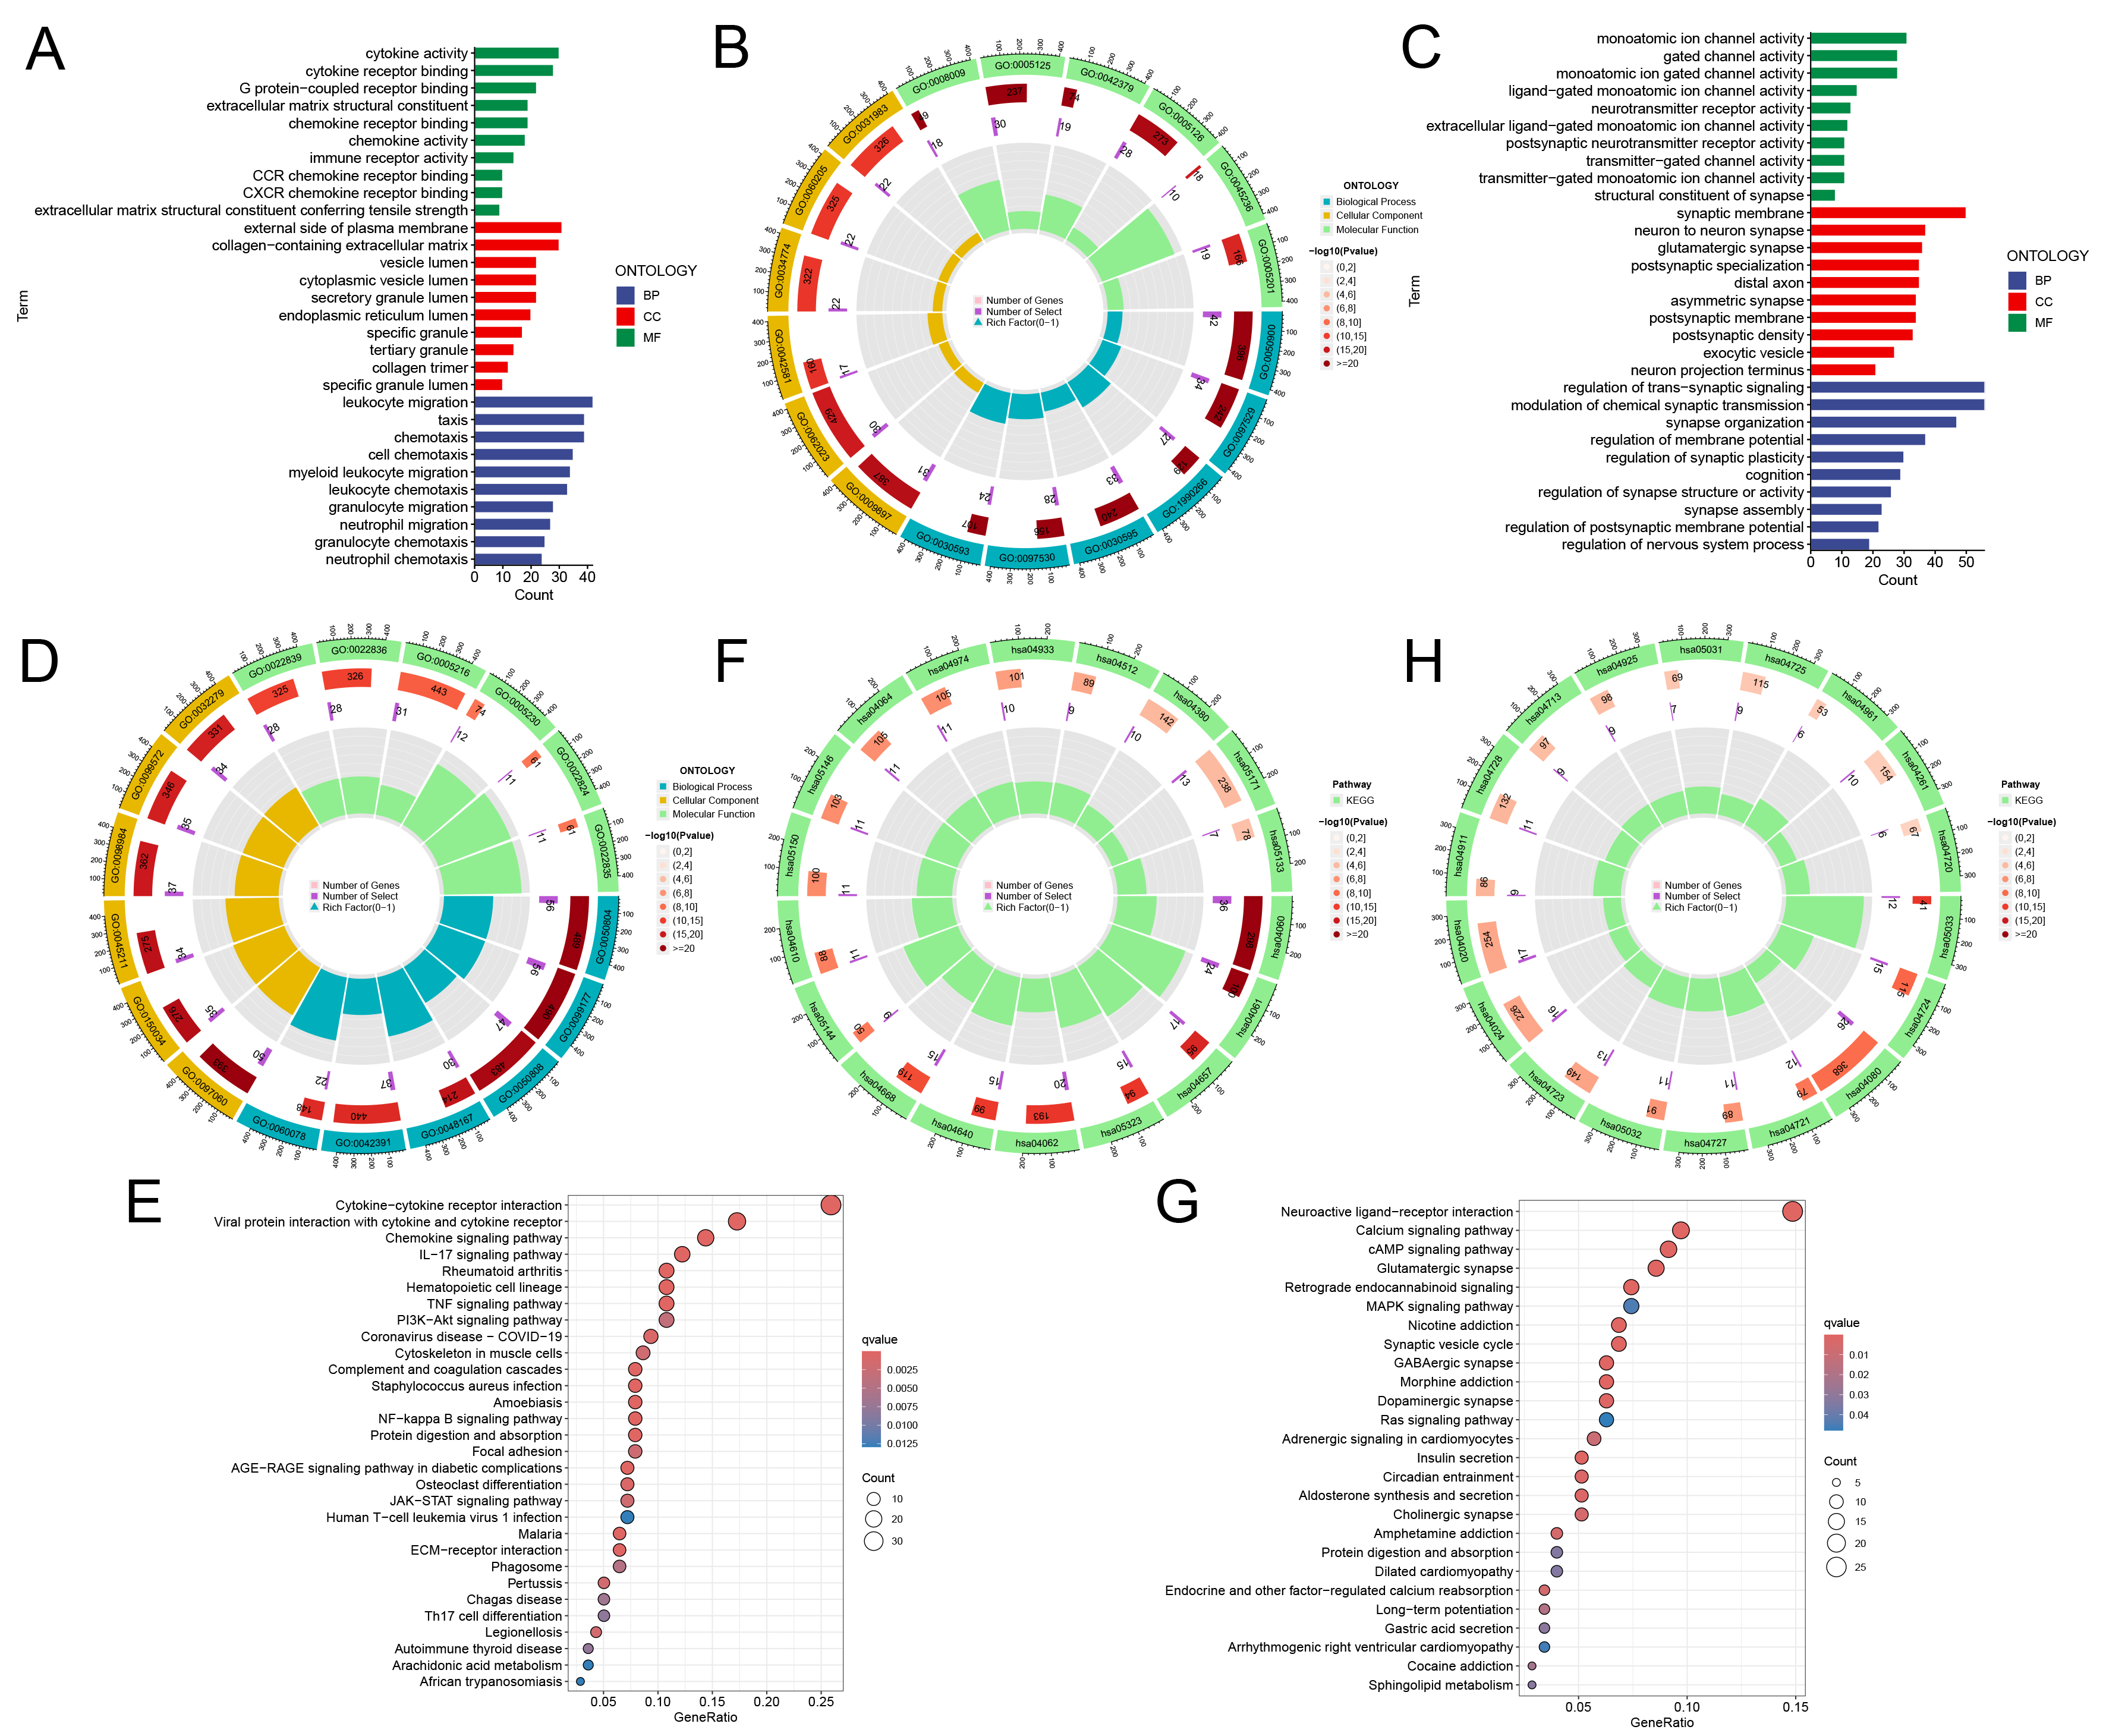 Fig. 5.
Gene Ontology (GO) and Kyoto Encyclopedia of Genes and Genomes (KEGG) analyses in high-low risk groups. (A,B) GO analysis in high-risk groups. (C,D) GO analysis in low-risk groups. (E,F) KEGG analysis in high-risk groups. (G,H) KEGG analysis in low-risk groups. Sector diagram: Different sector blocks represent different enrichment pathways, and the height of the sector in the inner circle represents the proportion of gene sets where the enriched genes are located. The higher the sector is, the higher the proportion is.
Next, we conducted a comprehensive examination of genetic mutation characteristics in both high- and low-risk groups based on TCGA data. The findings revealed notable variations in the mutation rates of the wild-type human p53 (TP53), epidermal growth factor receptor (EGFR), and phosphatase and tensin homolog (PTEN) across the two groups. In particular, in the high-risk group, mutations in PTEN were more prevalent, but mutation frequencies of TP53 and EGFR were more prevalent in low-risk group (Fig. 6A,B). Co-mutation analysis further revealed notable patterns of co-occurrence and mutual exclusivity. For instance, PTEN and TP53 co-occurred more frequently in the high-risk group, while TP53 co-occurred with isocitrate dehydrogenase 1 (IDH1) and alpha-thalassemia mental retardation X-linked (ATRX) in both groups. Conversely, TP53 and EGFR exhibited mutual exclusivity. Notably, the high-risk group exhibited a larger number of concurrently occurring gene pairs (16 pairs) in comparison to the low-risk group (9 pairs) (Fig. 6C,D). variant allele frequency (VAF) analysis revealed that the high-risk group had generally lower average VAF values than the low-risk group. Among the high-risk group, PTEN, TP53, and erythrocytic 1 (SPTA1) were the top genes based on VAF. In contrast, the low-risk group showed ATRX, retinoblastoma protein 1 (RB1), and TP53 as the most prominent genes. Importantly, the average VAF of TP53 differed significantly between the two groups (Fig. 6E,F).
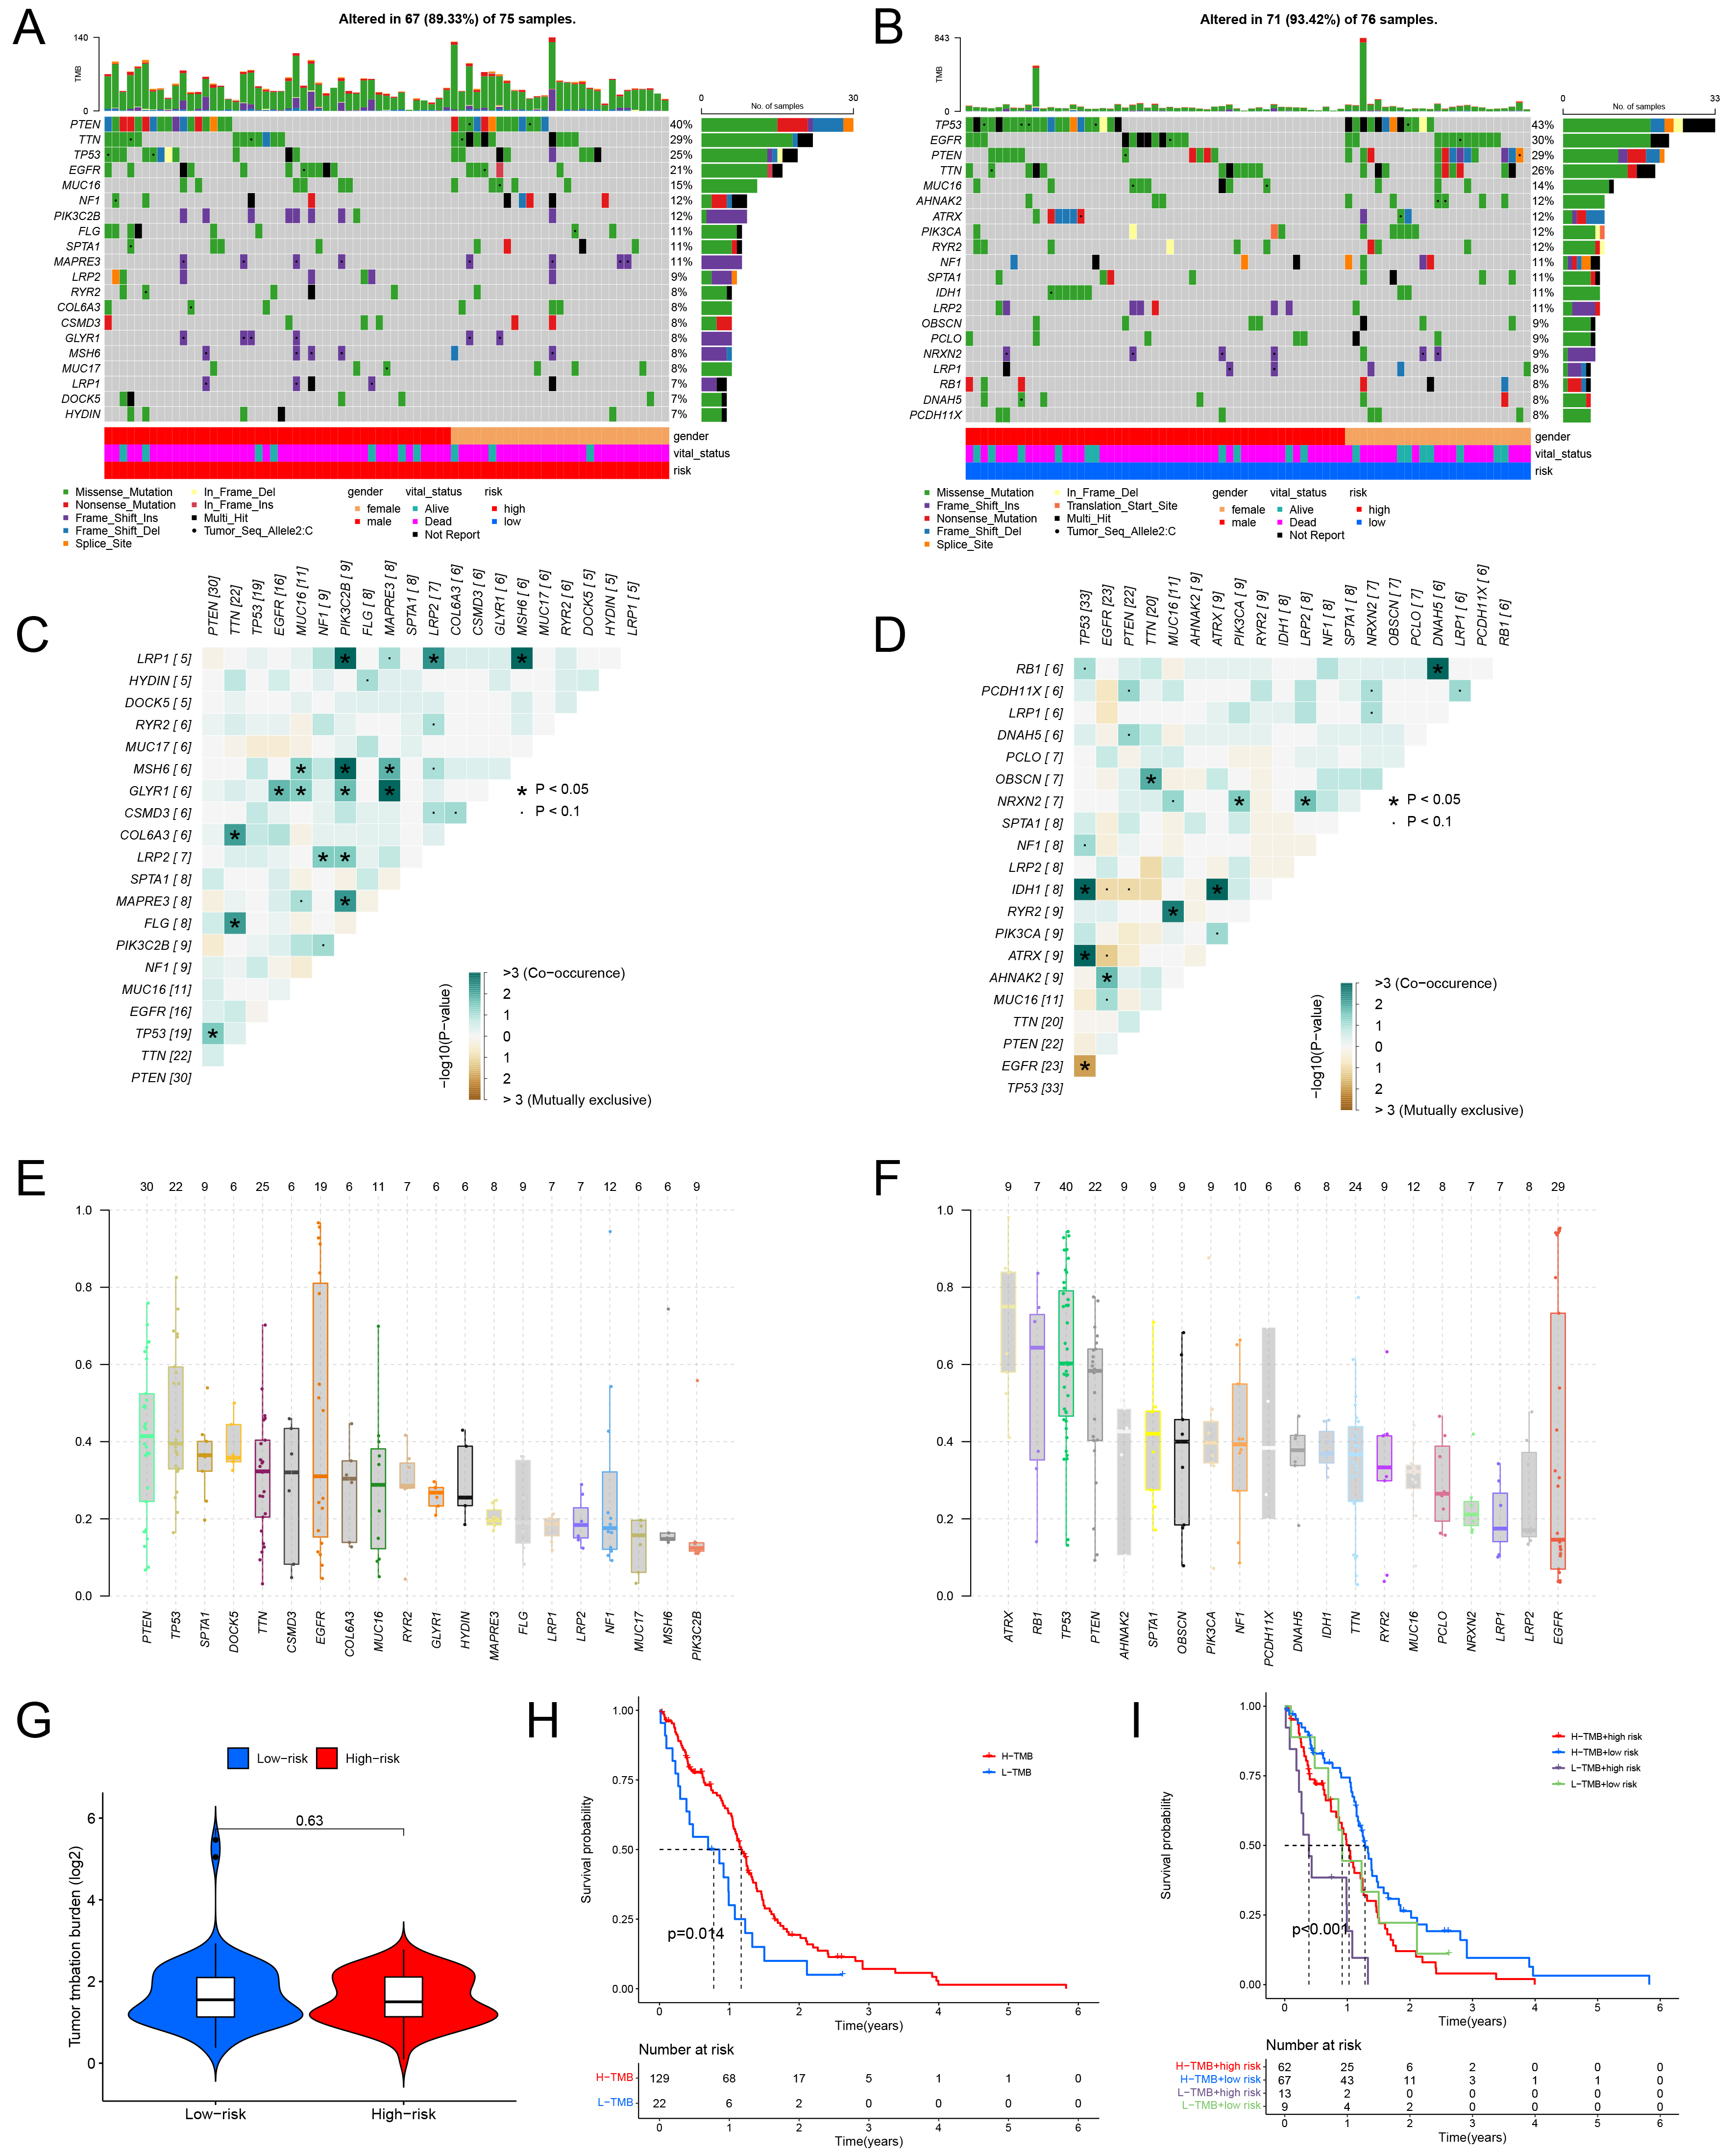 Fig. 6.
Gene mutation characteristics and tumor mutational burden (TMB) status of high and low-risk groups. ((A) High-risk cohort, (B) Low-risk cohort) The waterfall plot illustrates the mutation frequency and types of genes within the two groups. The upper section of the plot represents TMB, while the lower section provides clinical details and risk classifications of the patients. ((C) High-risk cohort, (D) Low-risk cohort) The co-mutation patterns and mutation frequencies of the top 20 genes in both groups are displayed. Green highlights co-occurring mutations, whereas yellow signifies mutually exclusive mutations. ((E) High-risk cohort, (F) Low-risk cohort) Box plots depicting the mean VAFs observed in the two groups. (G) A violin plot demonstrating the correlation between the high-risk cohort and TMB levels. (H) Survival analysis comparing groups with high and low TMB. (I) Survival curves stratifying patients based on both TMB levels and riskScore categories. VAF, variant allele frequency.
We further explored the impact of tumor mutational burden (TMB) on GBM and found that patients with higher TMB levels had notably better survival outcomes than those with lower TMB levels (Fig. 6H). Nevertheless, no significant difference in TMB was observed (Fig. 6G). The patients were divided into four groups based on TMB levels and riskScores. The low TMB but high-risk group had the worst survival prognosis. The high TMB and low-risk group showed the better quality of life (Fig. 6I). Collectively, these findings indicate that the riskScore effectively distinguishes gene mutation patterns and characteristics among the different groups.
We utilized the R programming language to assess immune infiltration levels in the samples through multiple immune cell estimation approaches, such as Estimate, ssGSEA, MCPcounter, Timer, Epic, CIBERSORT, and Quantiseq. Out of these seven techniques, the high-risk group demonstrated markedly increased infiltration levels of T cells (specifically CD4+ and CD8+ T cells) when compared to the low-risk group. Furthermore, in nearly all methods except CIBERSORT, the high-risk group displayed significantly greater infiltration of monocytes and tumor-associated fibroblasts. (Fig. 7A–G, Supplementary Table 16). The high-risk group also exhibited higher stromal and immune scores overall. Additionally, scores associated with immune inflammatory responses—such as those involving major histocompatibility complex (MHC), interferon (IFN), antigen-presenting cell (APC), and T cell-related gene sets—were considerably elevated in this group (Fig. 7D,H, Supplementary Table 16). Using the ssGSEA method, the infiltration levels of myeloid-derived suppressor cells (MDSCs) were found to be significantly higher in the high-risk group compared to the low-risk group (Fig. 7G, Supplementary Table 16). Examination of immune checkpoint expression revealed that several key checkpoints, such as cytotoxic T lymphocyte-associated antigen-4 (CTLA4), Programmed cell death protein 1 (PDCD1), Programmed Cell Death 1 Ligand 1 (CD274), and Recombinant Hepatitis A Virus Cellular Receptor 2 (HAVCR2), were significantly overexpressed in the high-risk group (Fig. 7I,J). Collectively, these results highlight a clear distinction in the tumor immune microenvironment between the high-risk and low-risk groups.
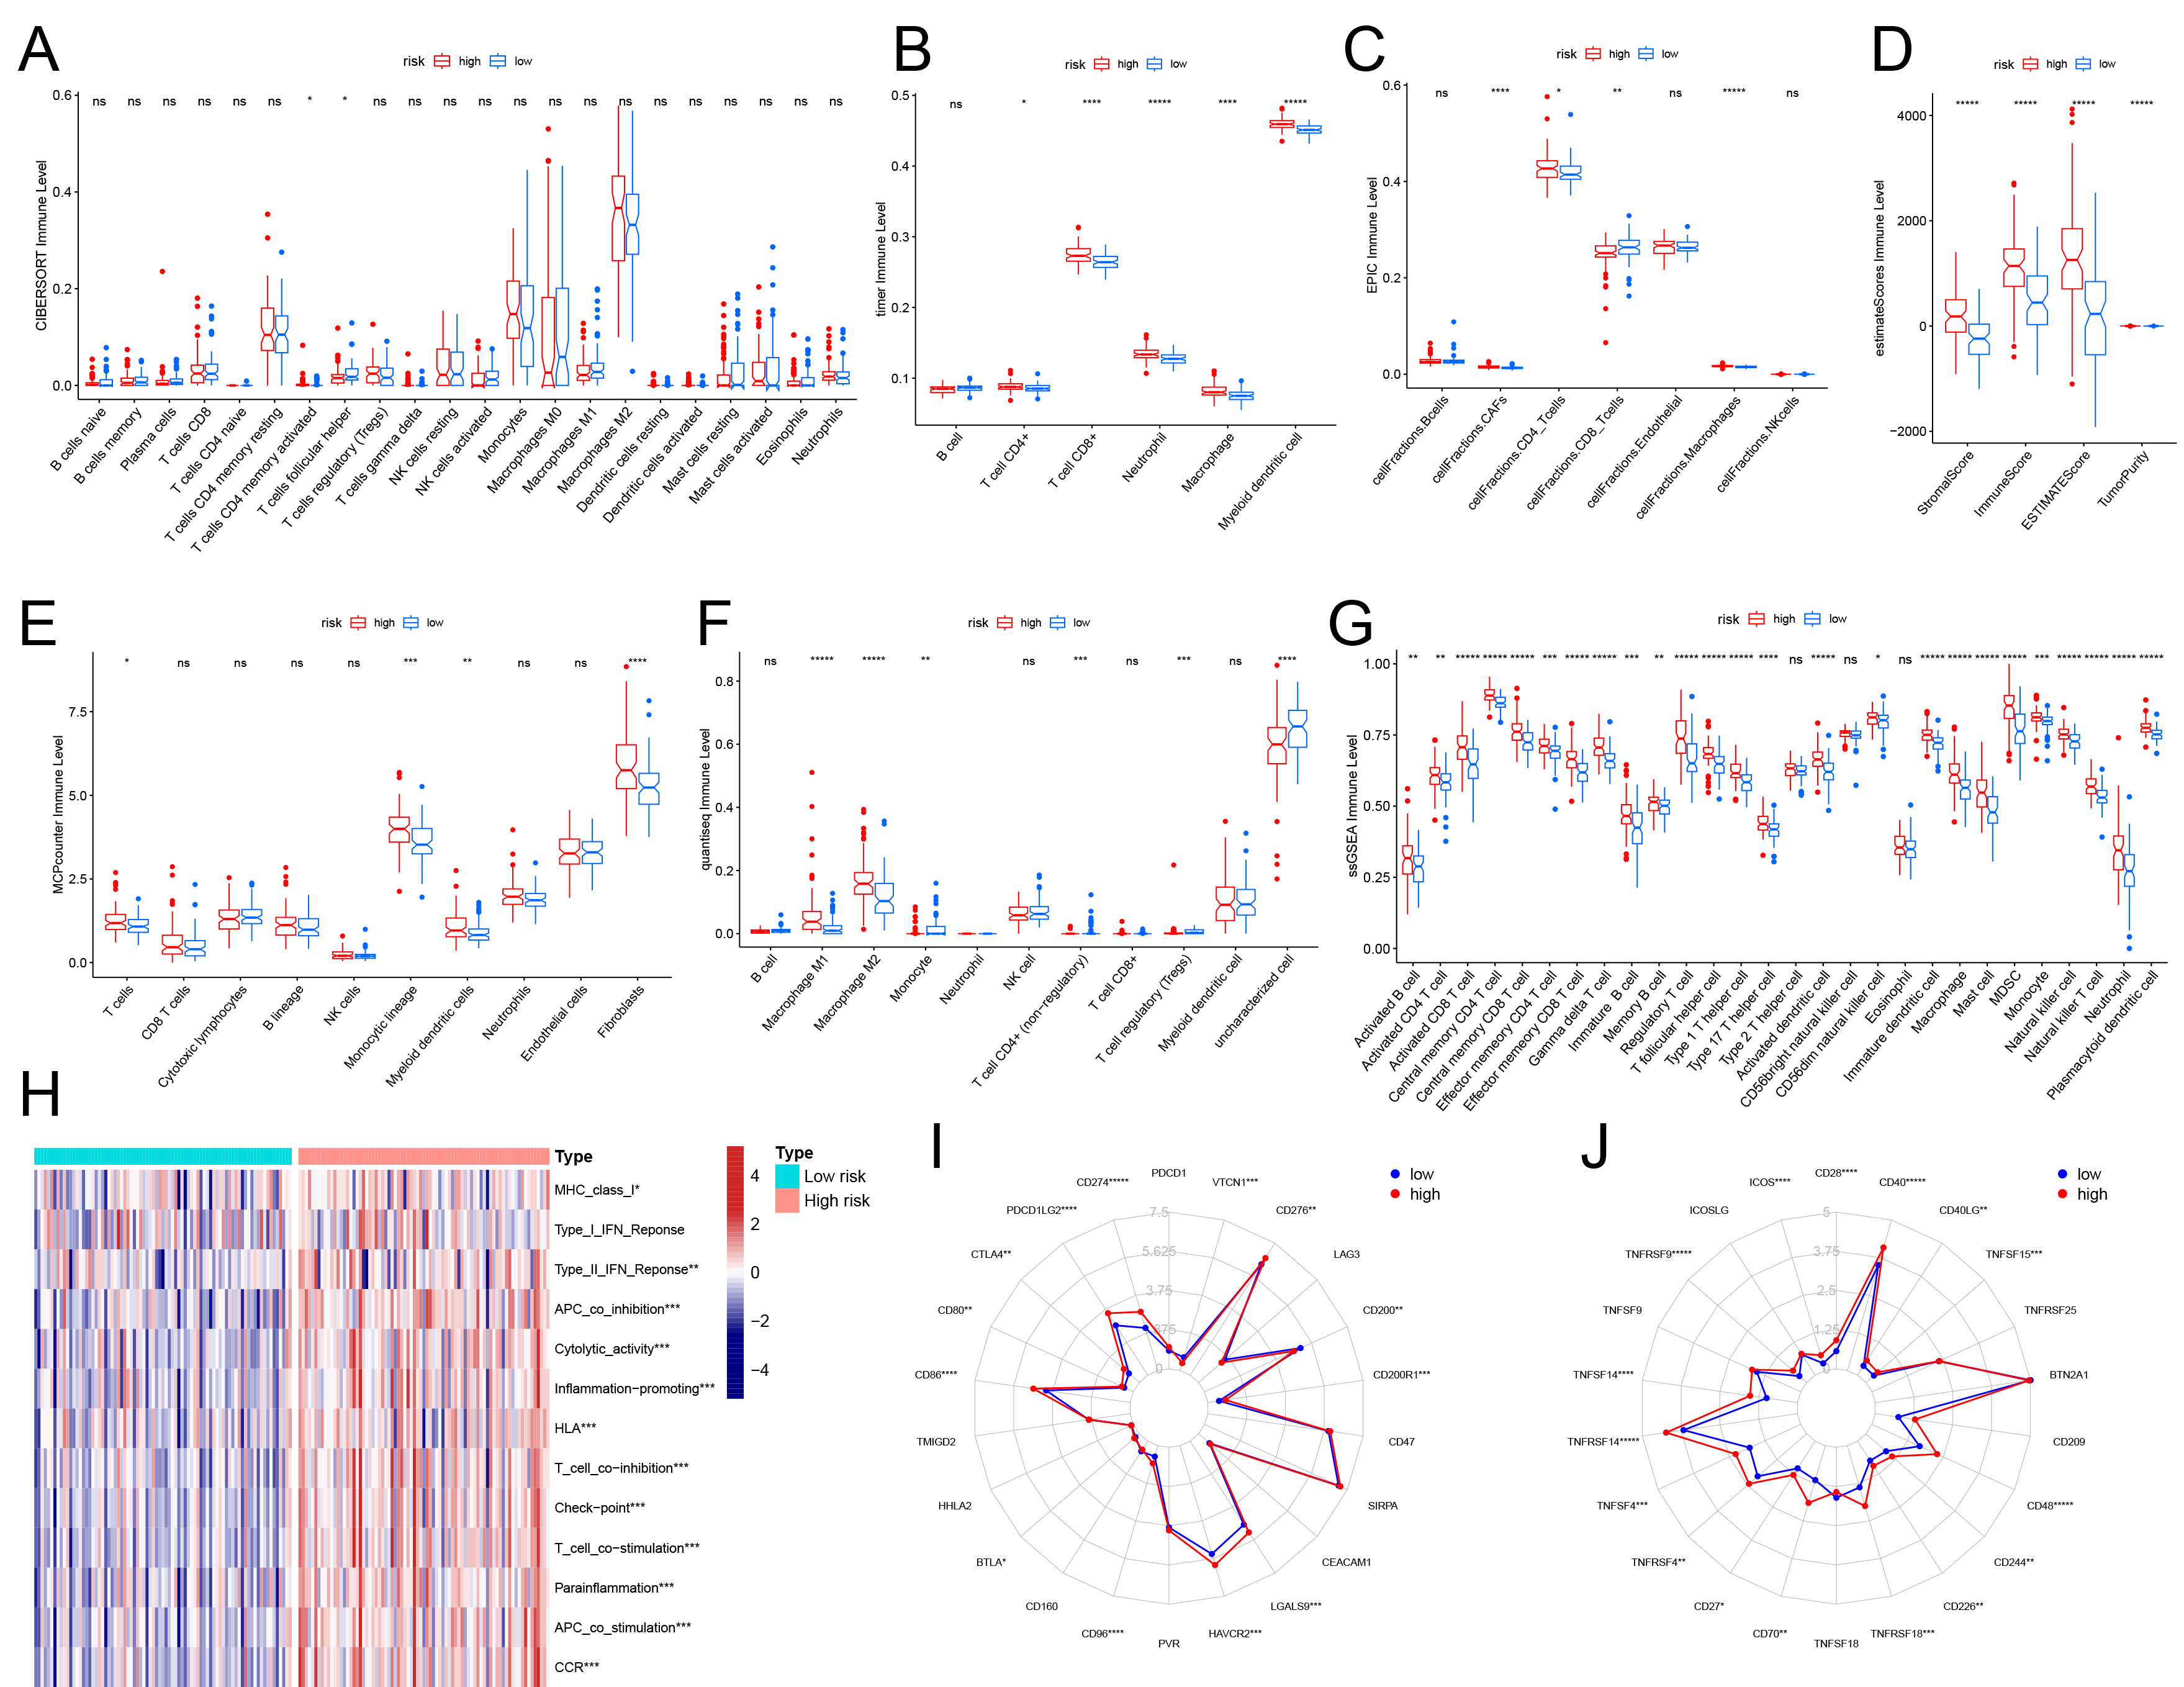 Fig. 7.
Relationship between high-low risk groups and tumor immune
microenvironment. (A–G) The relationship between high and low-risk groups and
the level of immune cell infiltration in 7 immune scoring tools. The vertical
coordinates indicate different methods, and the horizontal coordinates indicate
different immune cells. (H) Heatmap show the score levels of immune-related gene
sets in all samples from both groups. The radar map showed the difference in the
expression levels of co-inhibitory (I) and co-stimulatory immune checkpoints (J)
in high and low-risk groups. *p
Study used the TIDE platform to judge immunotherapy response immune cell infiltration in GBM samples. Higher infiltration of CAFs and increased expression of IFN, CD8, and programmed cell death ligand 1 (PD-L1) in high-risk group. The high-risk group also had higher immune dysfunction scores, indicating more significant infiltration of tumor-associated immune cells. Unlike previous findings, the high-risk group had lower infiltration of MDSCs and M2 macrophages. However, there was no significant difference in predicted immunotherapy response between the two groups (Supplementary Fig. 3, Supplementary Table 17).
The study used the R package “pRRophetic” to estimate TCGA GBM patients’ sensitivity to various chemotherapeutic agents. A significant inversion was found in dasatinib, lapatinib, and temsirolimus, suggesting higher riskScores correlate with better responses to these drugs. Conversely, a positive correlation was observed between riskScore and the IC50 values of elacridar, lestaurtinib, and tubastatin A, indicating lower riskScores may lead to greater sensitivity to these drugs (Supplementary Fig. 4). A systematic analysis of the link between riskScore and chemotherapy drug sensitivity allowed us to identify differing drug sensitivity among patient groups with varying riskScores.
The boxplots of gene expression demonstrated that the mRNA expression levels of the four risk-associated genes were significantly elevated in tumor tissues relative to adjacent normal tissues (Fig. 8A). Subsequently, we investigated the correlation between the abundance of tumor-infiltrating immune cells and the expression of these four risk genes to elucidate their roles in immune cell infiltration. Across six distinct immune cell infiltration scoring methodologies, FXYD5 exhibited a significant positive correlation with macrophage infiltration levels. Furthermore, FXYD5 demonstrated a positive relationship CD4+ and CD8+ T cells across the majority of the scoring methods employed. In the Epic and MCPcounter models, FXYD5 was found to be positively linked with CAFs. Additionally, using the ssGSEA, MCPcounter, and CIBERSORT approaches, a positive association was observed between FXYD5 and B cell infiltration levels (Fig. 8B–H). In a similar manner, RRAS expression levels were related to the presence of CAFs, T cells, and macrophages, within the microenvironment. However, RNF216P1 expression showed a bad relationship with multiple tumor-infiltrating immune cells, such as macrophages, CAFs, and T cells, as indicated by six different scoring systems (Fig. 8B–H). These results suggest that riskScore serves as a significant indicator for evaluating immune cell infiltration in GBM patients.
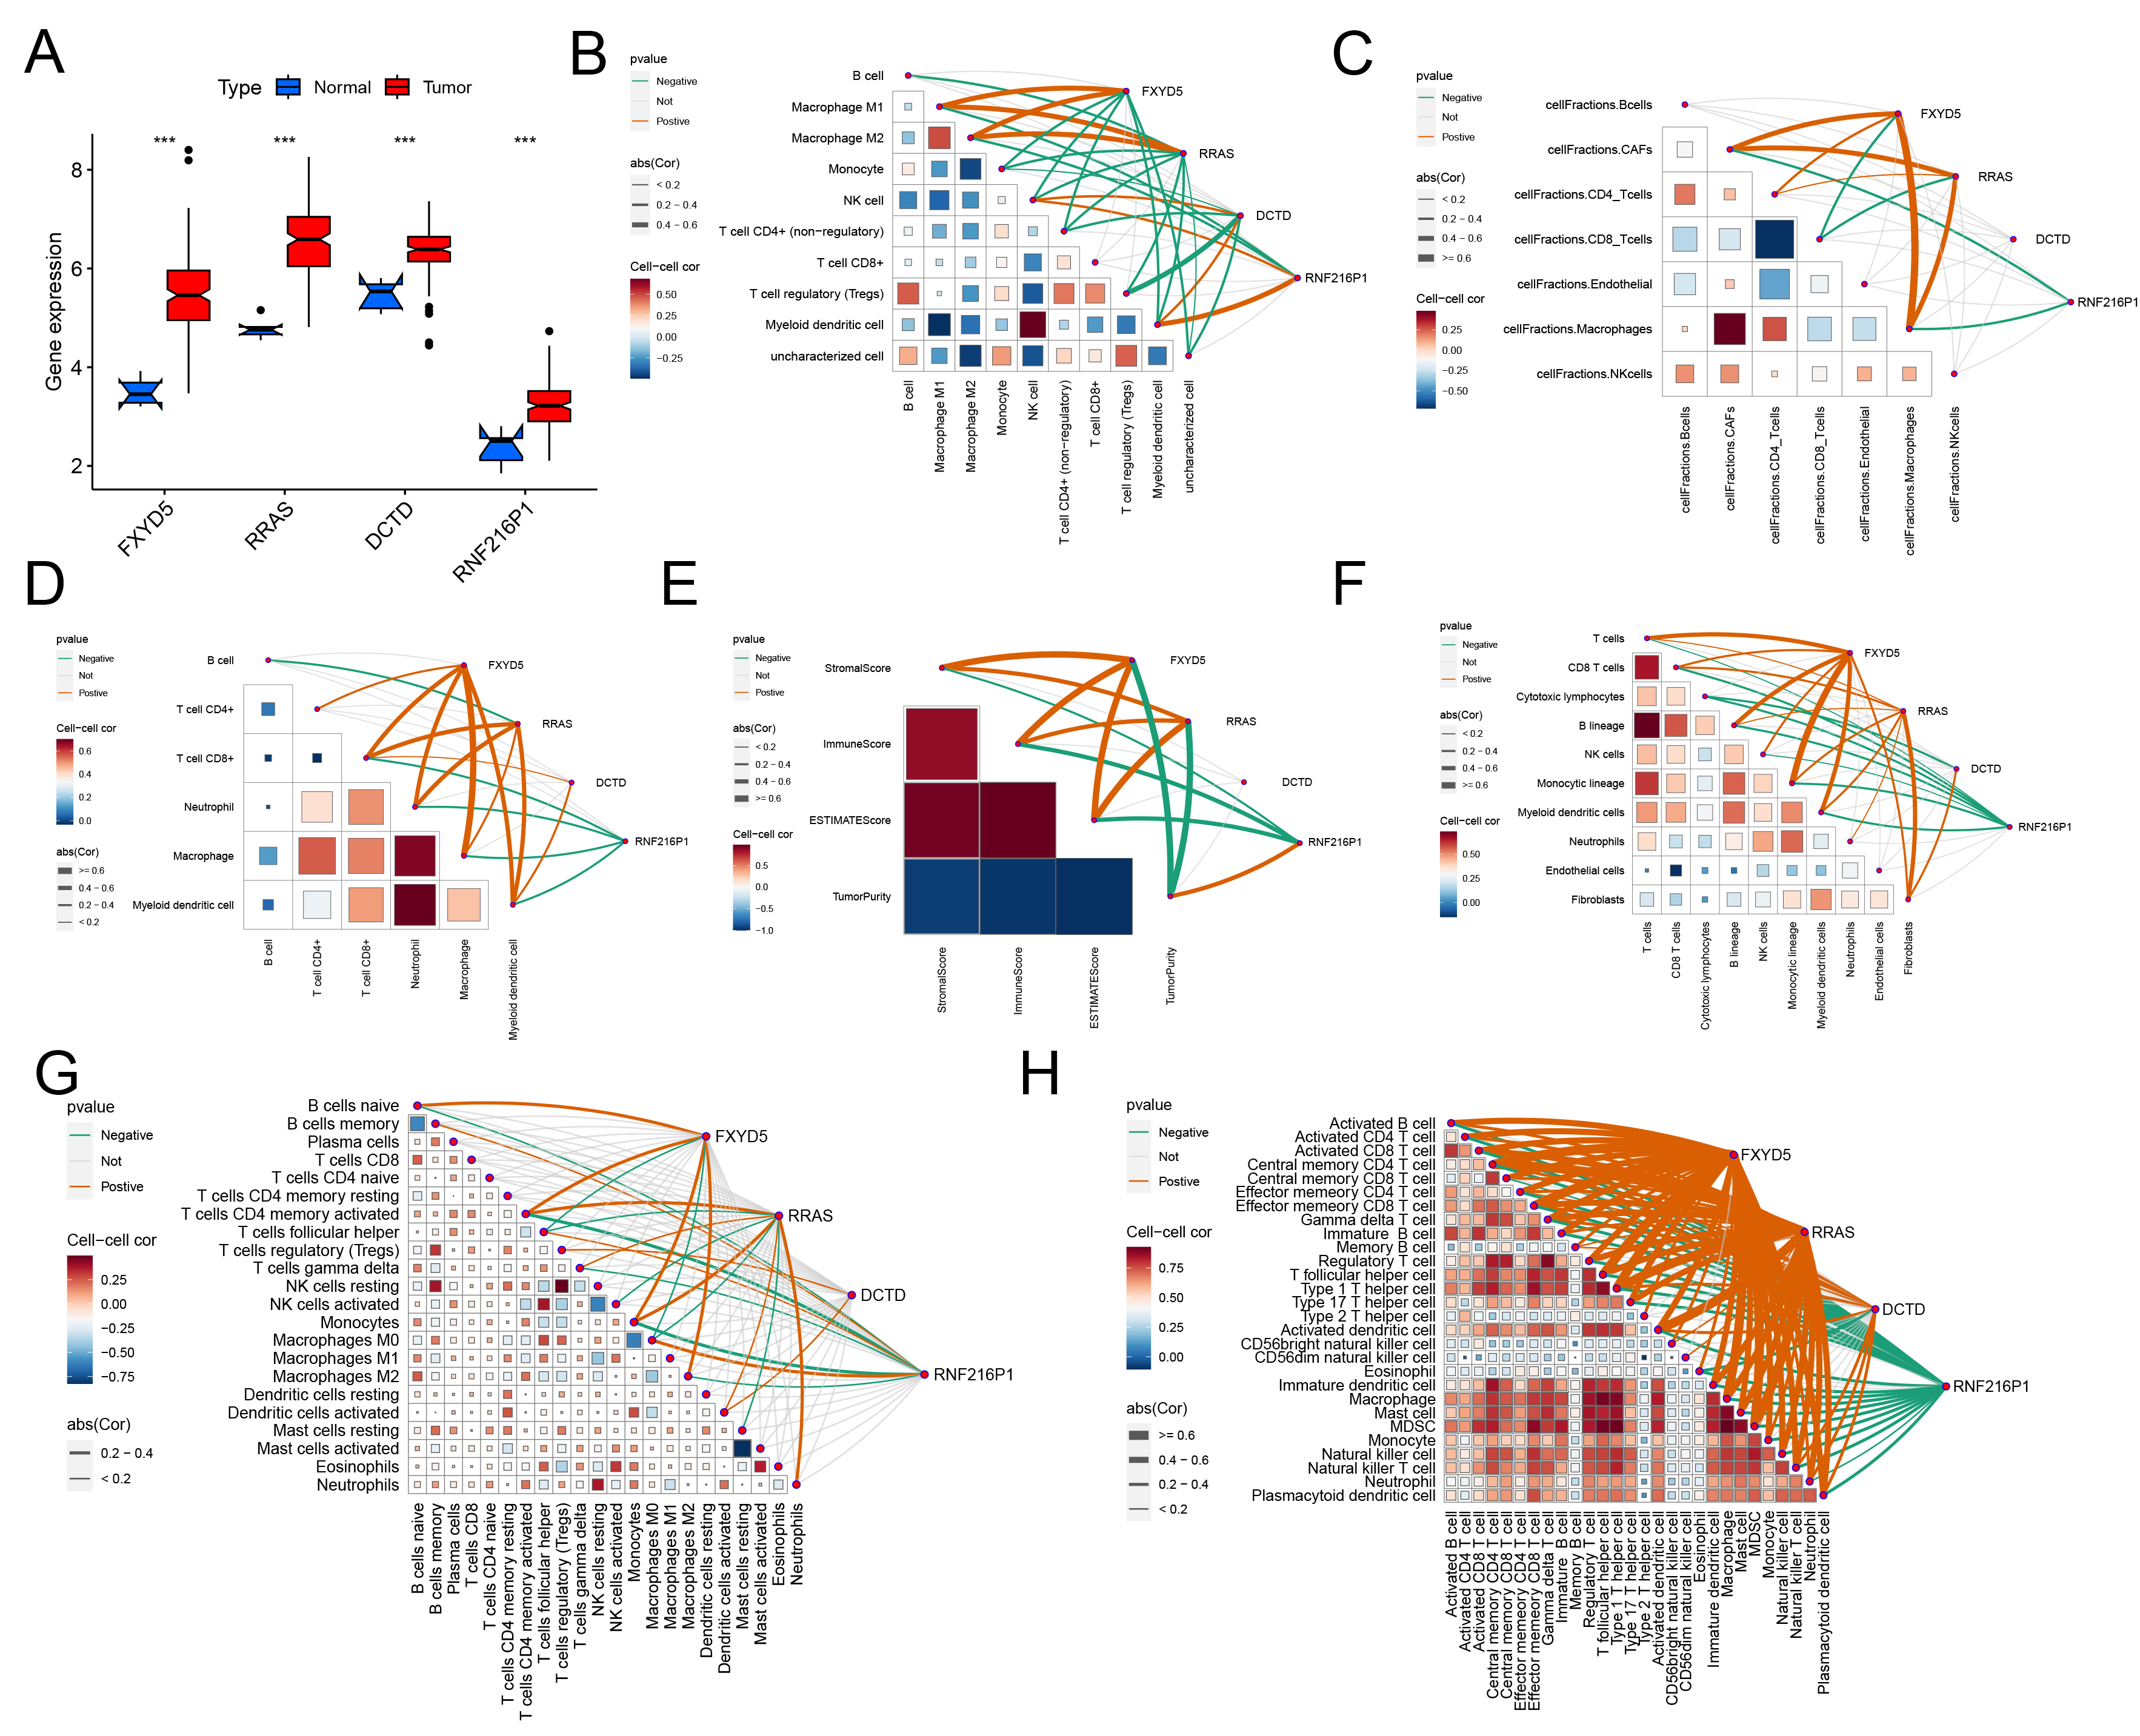 Fig. 8.
Relationship between key genes and tumor immune
microenvironment. (A) Expression levels of 4 key genes in cancer and para-cancer
tissues in TCGA GBM. ((B) Quantiseq, (C) Epic, (D) Timer, (E) Estimate, (F)
MCPcounter, (G) CIBERSORT, (H) ssGSEA) Relationship between immune cell
infiltration level and key genes in 7 kinds of immune score calculation tools.
The orange line indicates a positive correlation between the gene and the level
of immune cell infiltration, whereas the green line indicates a negative
correlation. ***p
The GBM samples were categorized into two groups—low expression and high expression—according to the median expression values of the four risk-associated genes, after which survival analysis was conducted. The findings revealed that higher expression levels of DCTD and RRAS were linked to worse prognostic outcomes (Fig. 9A,B), whereas the remaining two genes did not exhibit a statistically significant difference between the two expression groups (Fig. 9C,D). Based on these results, we selected DCTD and RRAS for further experiments. We transfected GBM U-87MG cells with siRNAs targeting DCTD and RRAS.
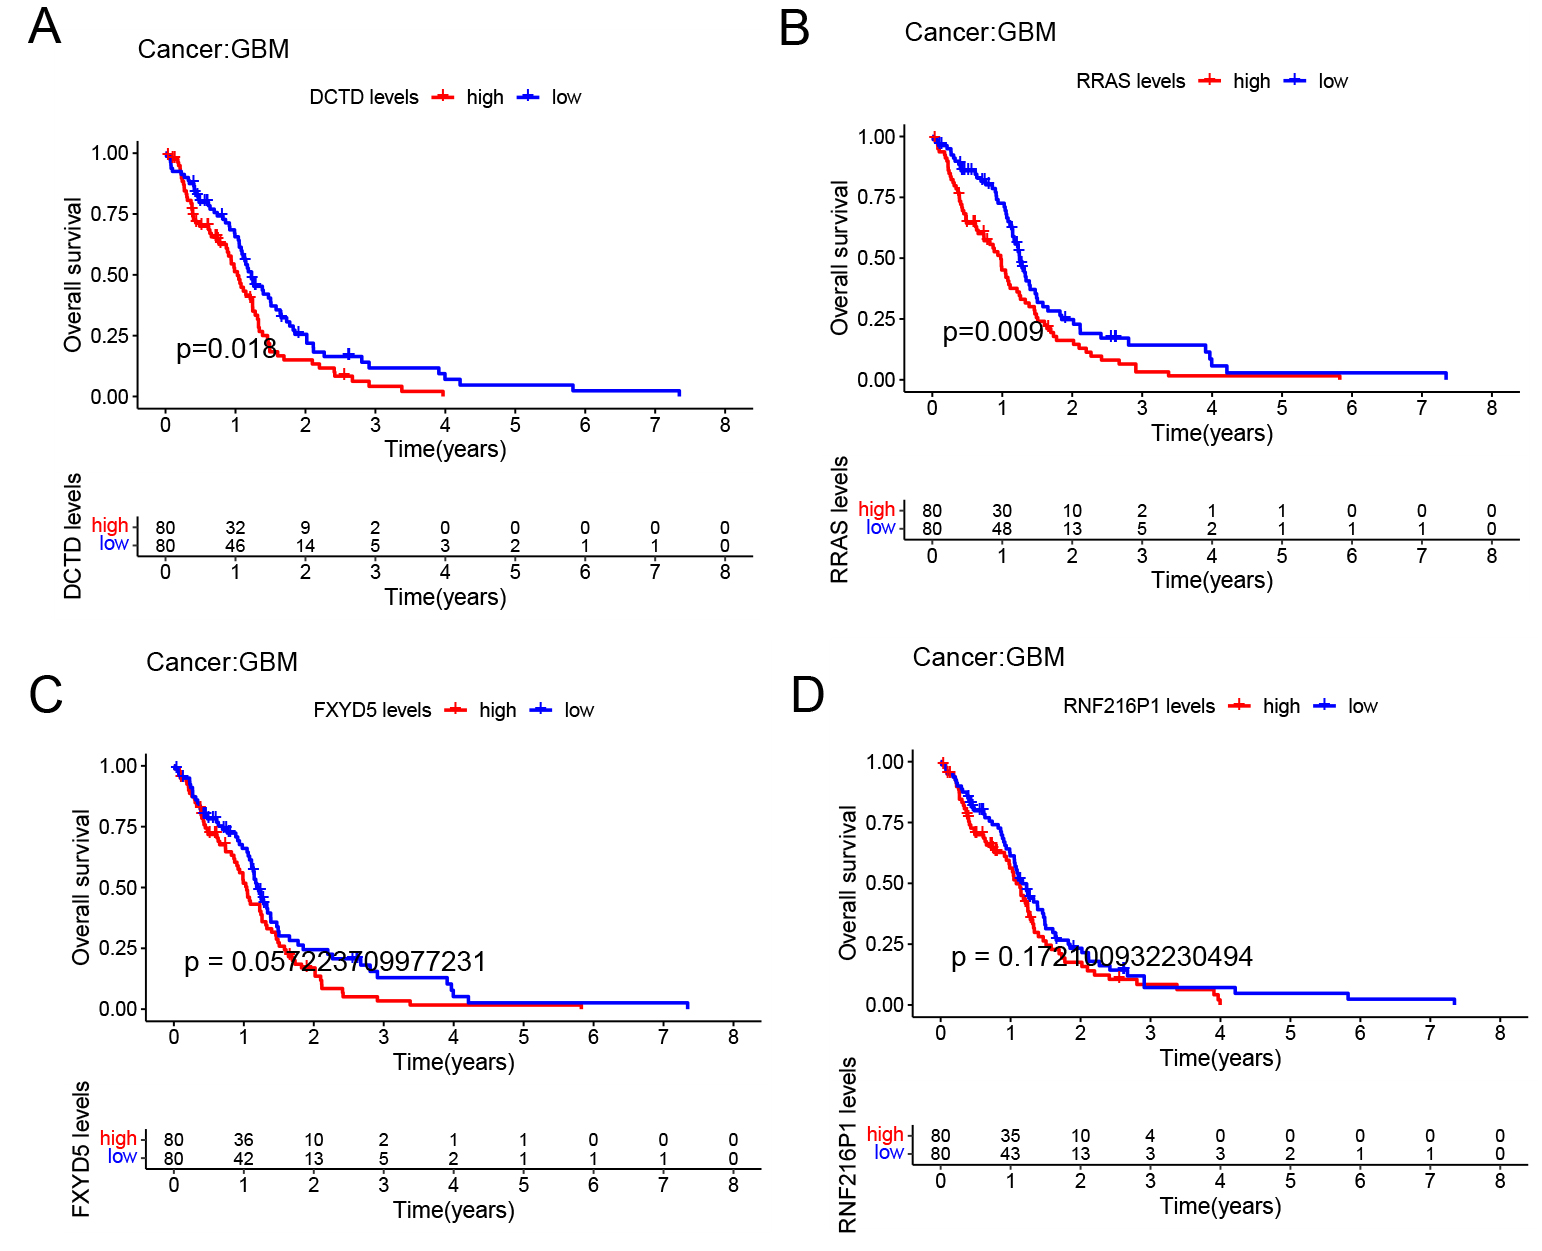 Fig. 9.
Survival analysis of four risk genes. (A–D) The KM survival curves of four survival genes. Based on these results, we selected DCTD and RRAS for further experiments. RRAS, Ras-related protein.
We transfected GBM U-87MG cells with siRNAs targeting DCTD and RRAS. Knockdown of DCTD or RRAS led to a reduction in their respective protein levels (Fig. 10A,B). MTT, colony formation, wound healing, and invasion assays demonstrated that knockdown of DCTD or RRAS reduced U-87MG cell proliferation, migration, and invasion (Fig. 10C–J, Supplementary Fig. 5). Using a CDX model, we found that tumors with DCTD or RRAS knockdown were significantly smaller than those in the control group (Fig. 10K–N), We have also added a new cell line, U251, and obtained similar results (Supplementary Fig. 6) indicating that knockdown of DCTD or RRAS inhibits GBM CDX model tumor growth.
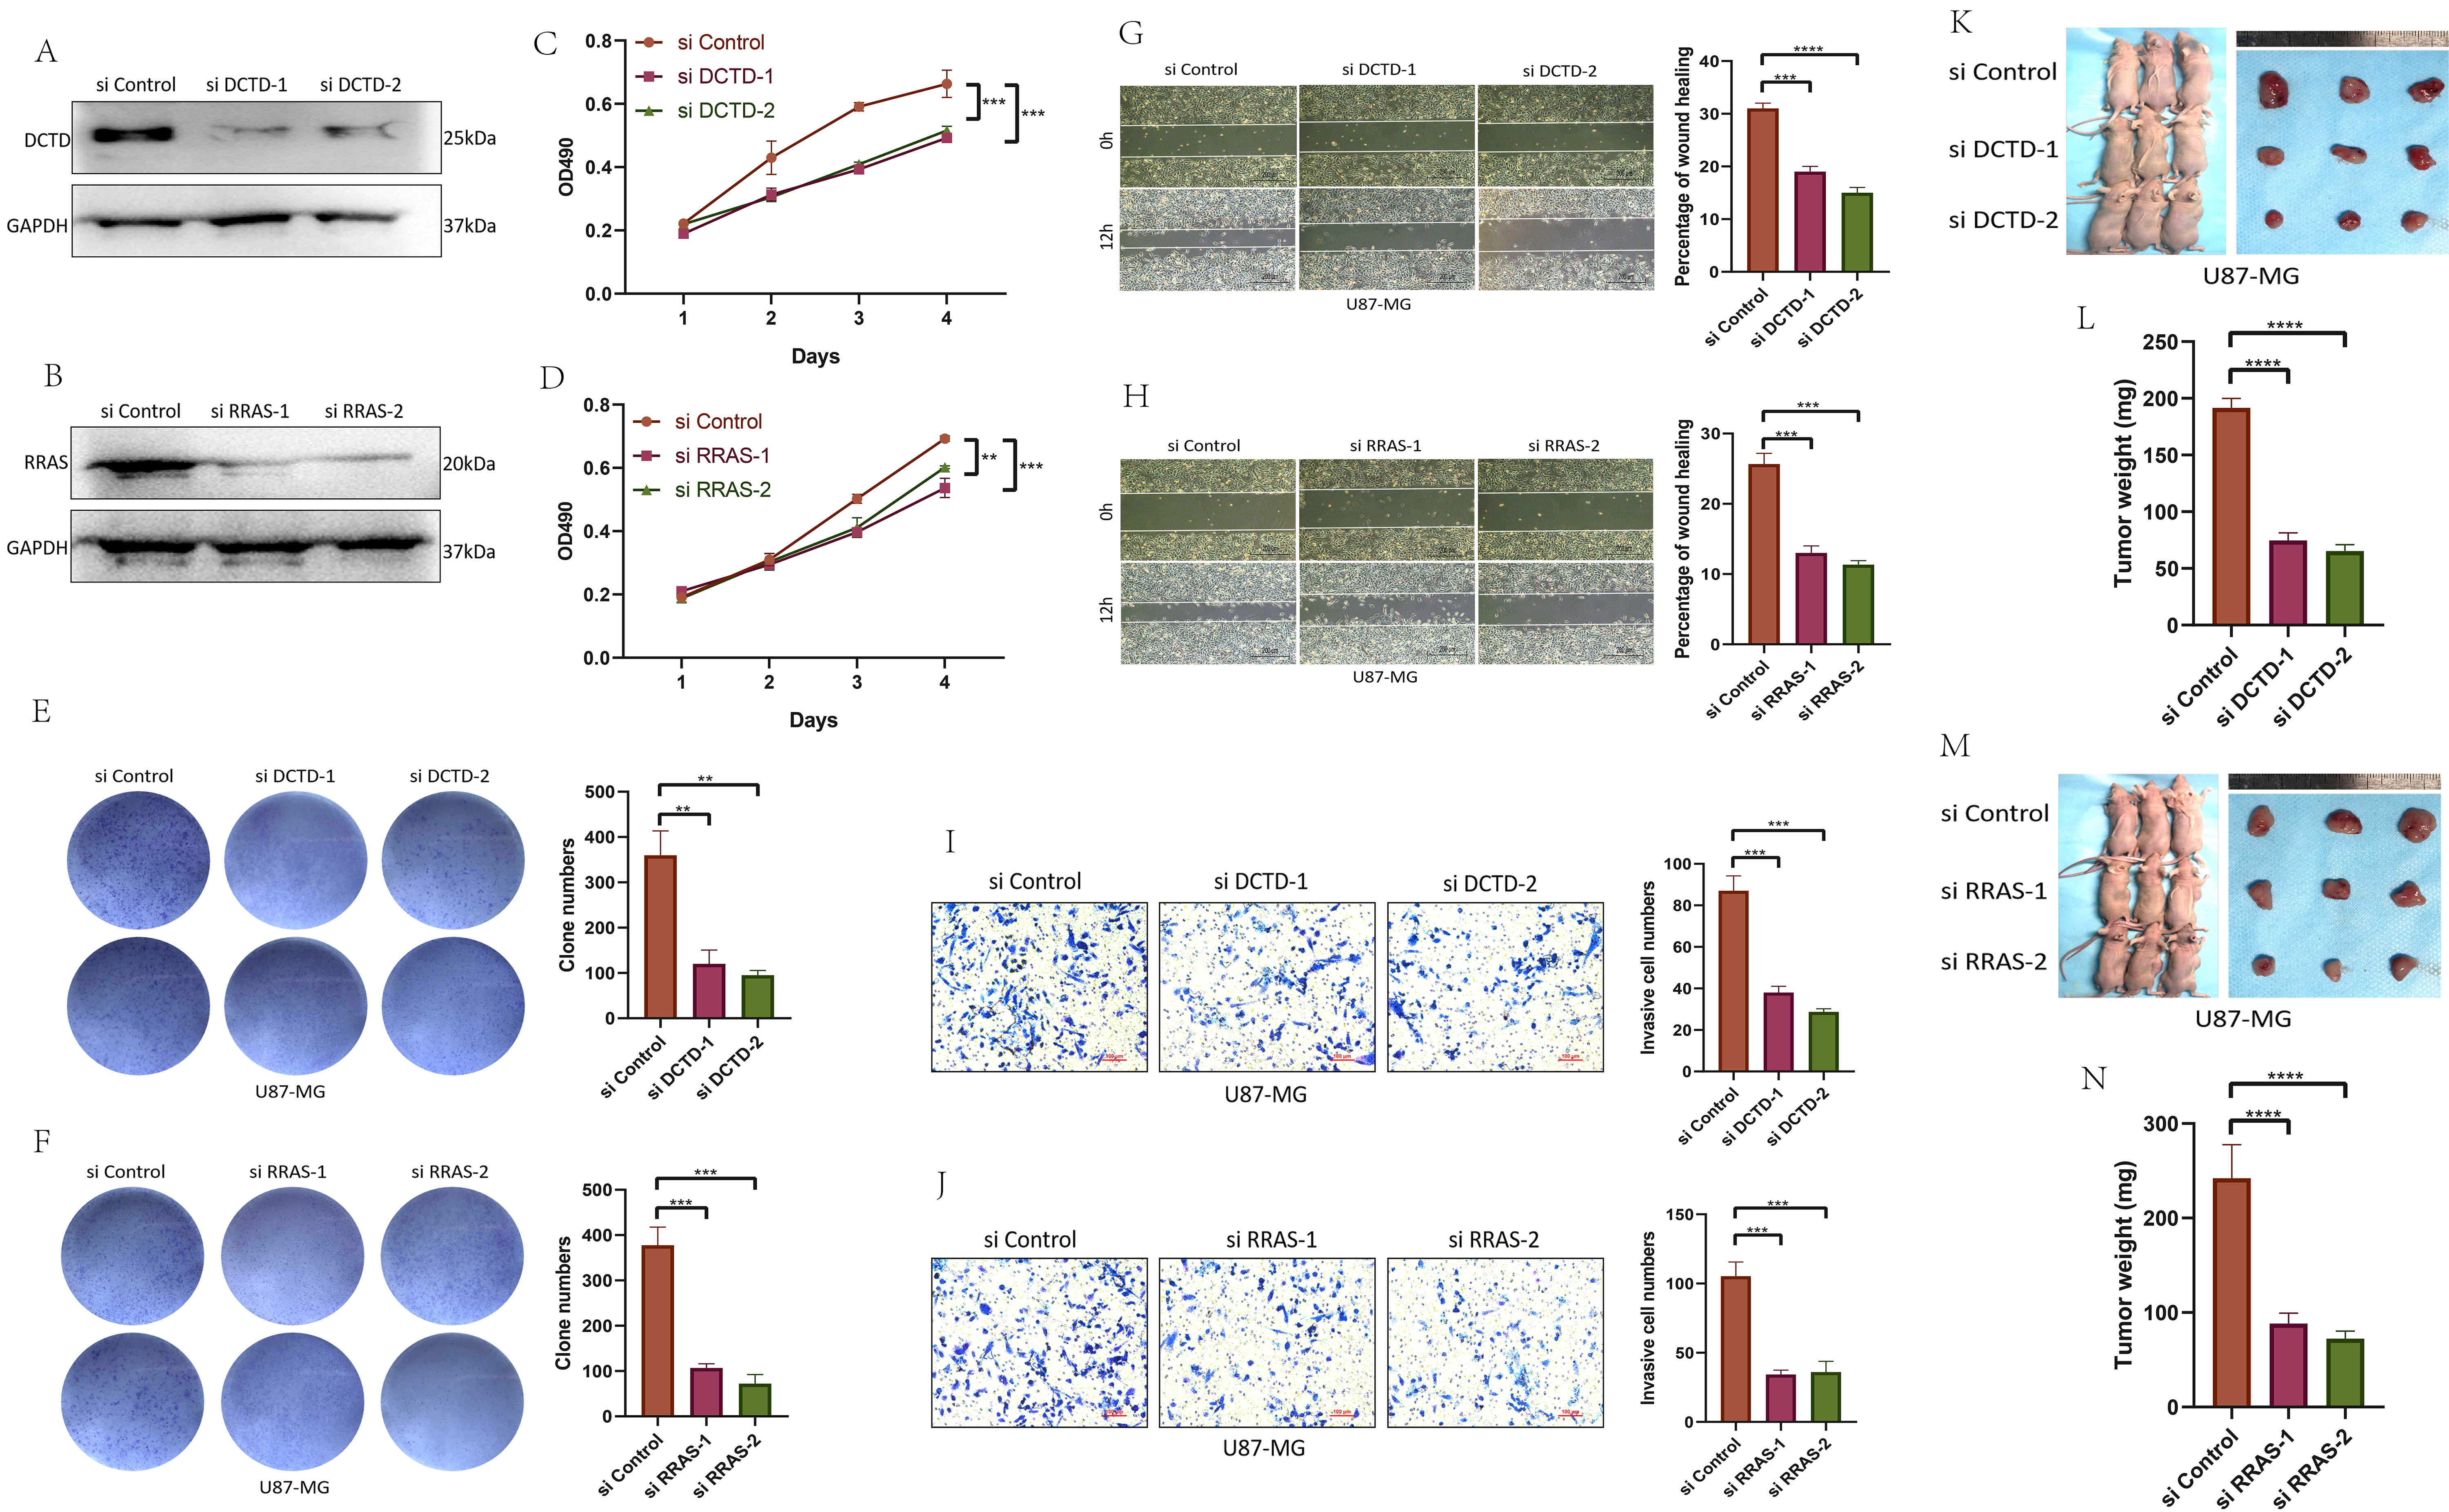 Fig. 10.
DCTD and RRAS promote the proliferation,
migration and invasion of GBM. (A,B) Protein expression after DCTD or
RRAS knockdown. (C,D) MTT experiment after DCTD or
RRAS knockdown. (E,F) Clone formation experiment after DCTD or
RRAS knockdown. (G,H) Wound healing test after DCTD or
RRAS knockdown. Scale bar = 200 µm. (I,J) Invasion Assay after DCTD or
RRAS knockdown. Scale bar = 100 µm. (K–N) CDX model
construction and tumor weight detection after DCTD or RRAS
knockdown. (Related experiments were independently replicated three times.)
**p
Using GEPIA for correlation analysis, a significant positive correlation was found between RRAS and GPX4, a key ferroptosis gene (Supplementary Fig. 7A). Although the correlation between DCTD and GPX4 was not statistically significant, the p-value was close to 0.05 with a positive correlation coefficient (Supplementary Fig. 7B). Knockdown of DCTD or RRAS led to decreased expression of ferroptosis inhibitory proteins SLC7A11 and GPX4, and increased expression of the ferroptosis-promoting protein ACSL4 (Fig. 11A–D, Supplementary Fig. 5A–D). Colony formation, wound healing, and invasion assays showed that cells with si-DCTD or si-RRAS and exogenous ACSL4 had lower proliferation, migration, and invasion capabilities compared to cells with si-DCTD or si-RRAS alone. Conversely, overexpression of DCTD or RRAS enhanced these abilities, and knocking down ACSL4 in DCTD or RRAS overexpression cells increased proliferation, migration, and invasion (Fig. 11E–P, Supplementary Fig. 5G–I). This indicates that DCTD and RRAS influence the ferroptosis signaling pathway and affect U-87MG cell phenotype. Meanwhile, we investigated the mechanism by which DCTD regulates ferroptosis. Initially, using q-PCR, we demonstrated that DCTD knockout did not induce changes in the transcriptional level of ACSL4 (Supplementary Fig. 8A). Subsequently, we hypothesized whether DCTD modulates ACSL4 expression by influencing ubiquitination-related enzymes. To this end, we predicted E3 ubiquitin ligases regulating ACSL4 via the ubibrowser website and identified autocrine motility factor receptor (AMFR) as a regulator of ACSL4 (Supplementary Fig. 8B). Furthermore, through analysis on gepia2.cancer, we observed a positive correlation between DCTD and AMFR (Supplementary Fig. 8C). Next, we transfected si-RRAS and si-DCTD into the U251 cell line and assessed the protein expression levels of RRAS, DCTD, and AMFR using Western blotting. Our results revealed that RRAS and DCTD regulate the protein level of AMFR, with a positive correlation among them (Supplementary Fig. 8D,E). Finally, we designed an experiment to transfect an AMFR overexpression plasmid following DCTD knockout and examined the ubiquitination level of ACSL4. We found that the ubiquitination level of ACSL4 decreased significantly upon DCTD knockout. However, when the AMFR overexpression plasmid was transfected subsequent to DCTD knockout, the ubiquitination level of ACSL4 was restored (Supplementary Fig. 8F).
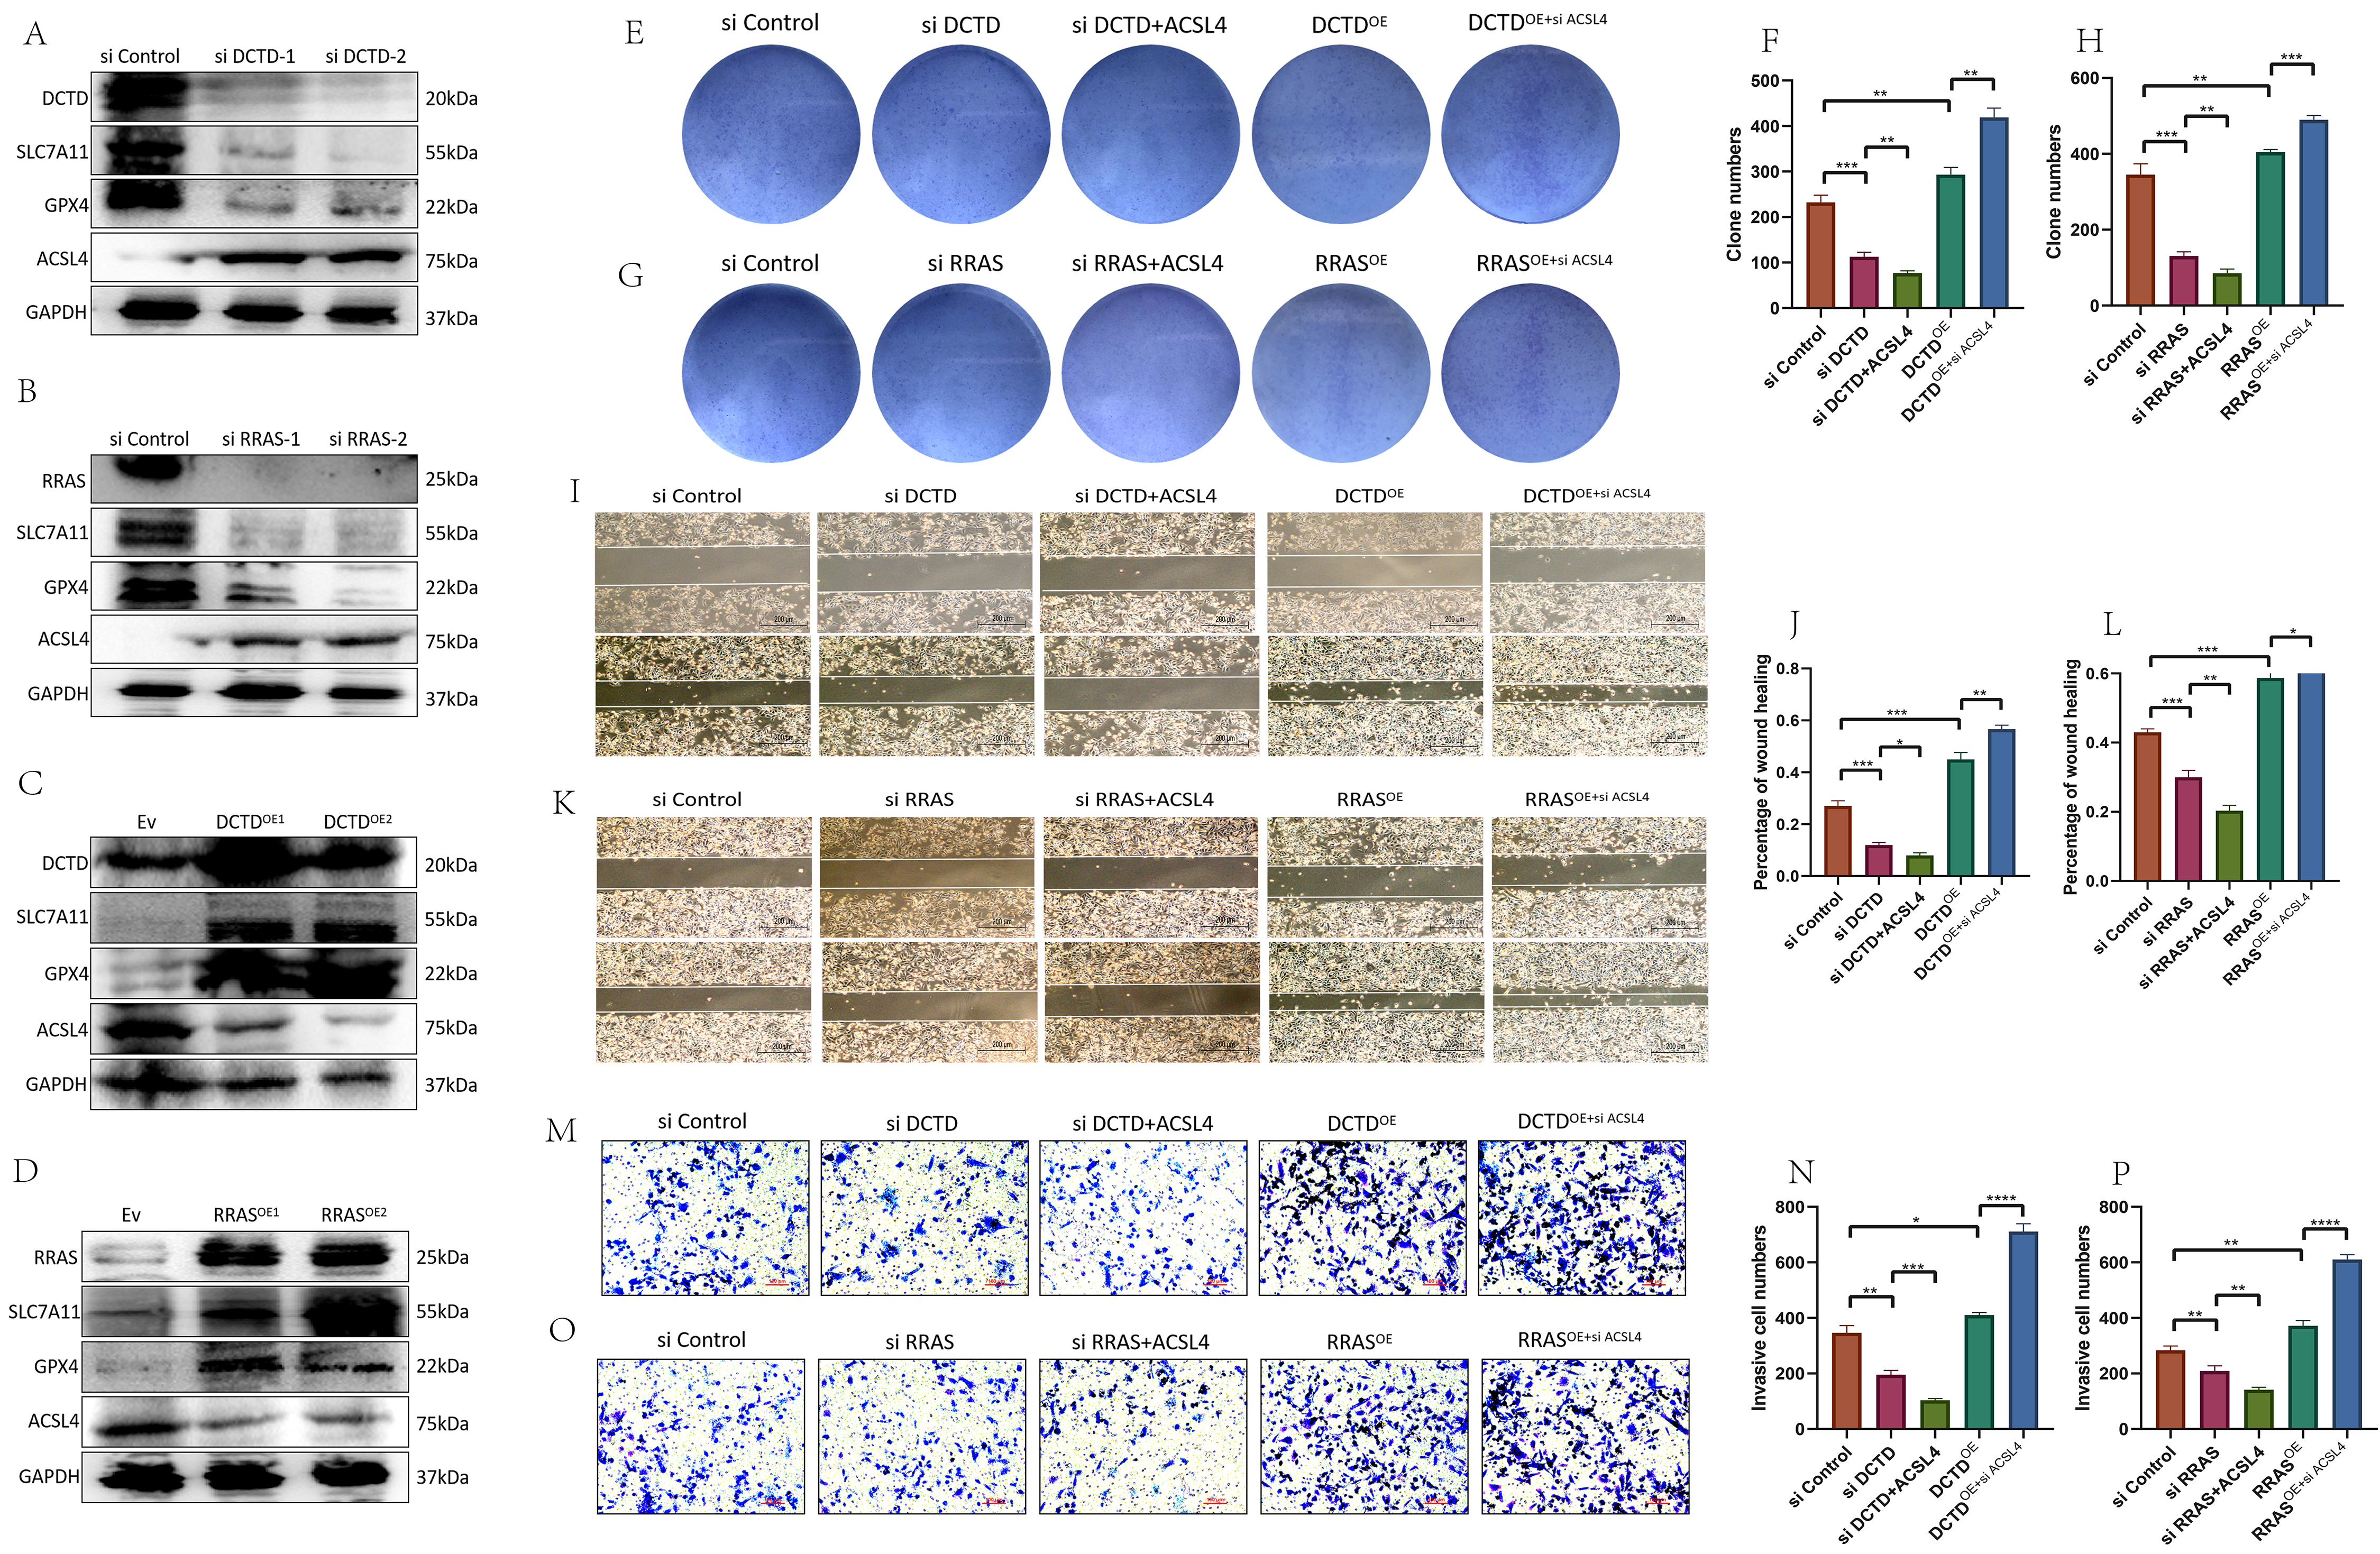 Fig. 11.
Detection of ferroptosis and effect on GBM cell phenotype after
knockdown or overexpression of DCTD and RRAS. (A,B) Expression of ferroptosis signaling protein after DCTD or RRAS knockdown.
(C,D) Expression of ferroptosis signaling protein after DCTD or RRAS
overexpression. (E–P) Clone formation experiment, migration experiment and
invasion experiment of different groups of U-87MG. (I, K) Scale bar = 200 µm. (M, O) Scale bar = 100
µm. (Related experiments were independently replicated three times.)
*p
To validate the effect of ferroptosis on GBM cells, we treated cells with the ferroptosis activator RSL3 and the ferroptosis inhibitors ferrostatin-1 and deferoxamine (iron chelator). Activation of the ferroptosis pathway significantly reduced cell viability in three GBM cell lines, and this effect was reversed by ferroptosis inhibitors (Fig. 12A–C), indicating that activation of the ferroptosis pathway decreases GBM cell viability. In U-87MG cells with DCTD or RRAS knockdown or overexpression, RSL3 treatment at varying concentrations for 24 hours showed that the IC50 of RSL3 decreased with DCTD or RRAS knockdown and increased with overexpression. Cells treated with RSL3 showed reduced viability in si-DCTD, si-RRAS, OE-DCTD, and OE-RRAS groups compared to controls. Additionally, lipid peroxidation levels were higher in the DCTD or RRAS knockdown groups and lower in the overexpression groups after RSL3 treatment (Fig. 12D–O), suggesting that knockdown of DCTD or RRAS enhances ferroptosis in U-87MG cells treated with RSL3. We detected the intracellular reactive oxygen species (ROS) levels after the knockout and overexpression of RRAS and DCTD using a flow cytometer. We found that the expression level of ROS increased significantly after the knockout of RRAS and DCTD, while it decreased significantly after their overexpression (Supplementary Fig. 9).
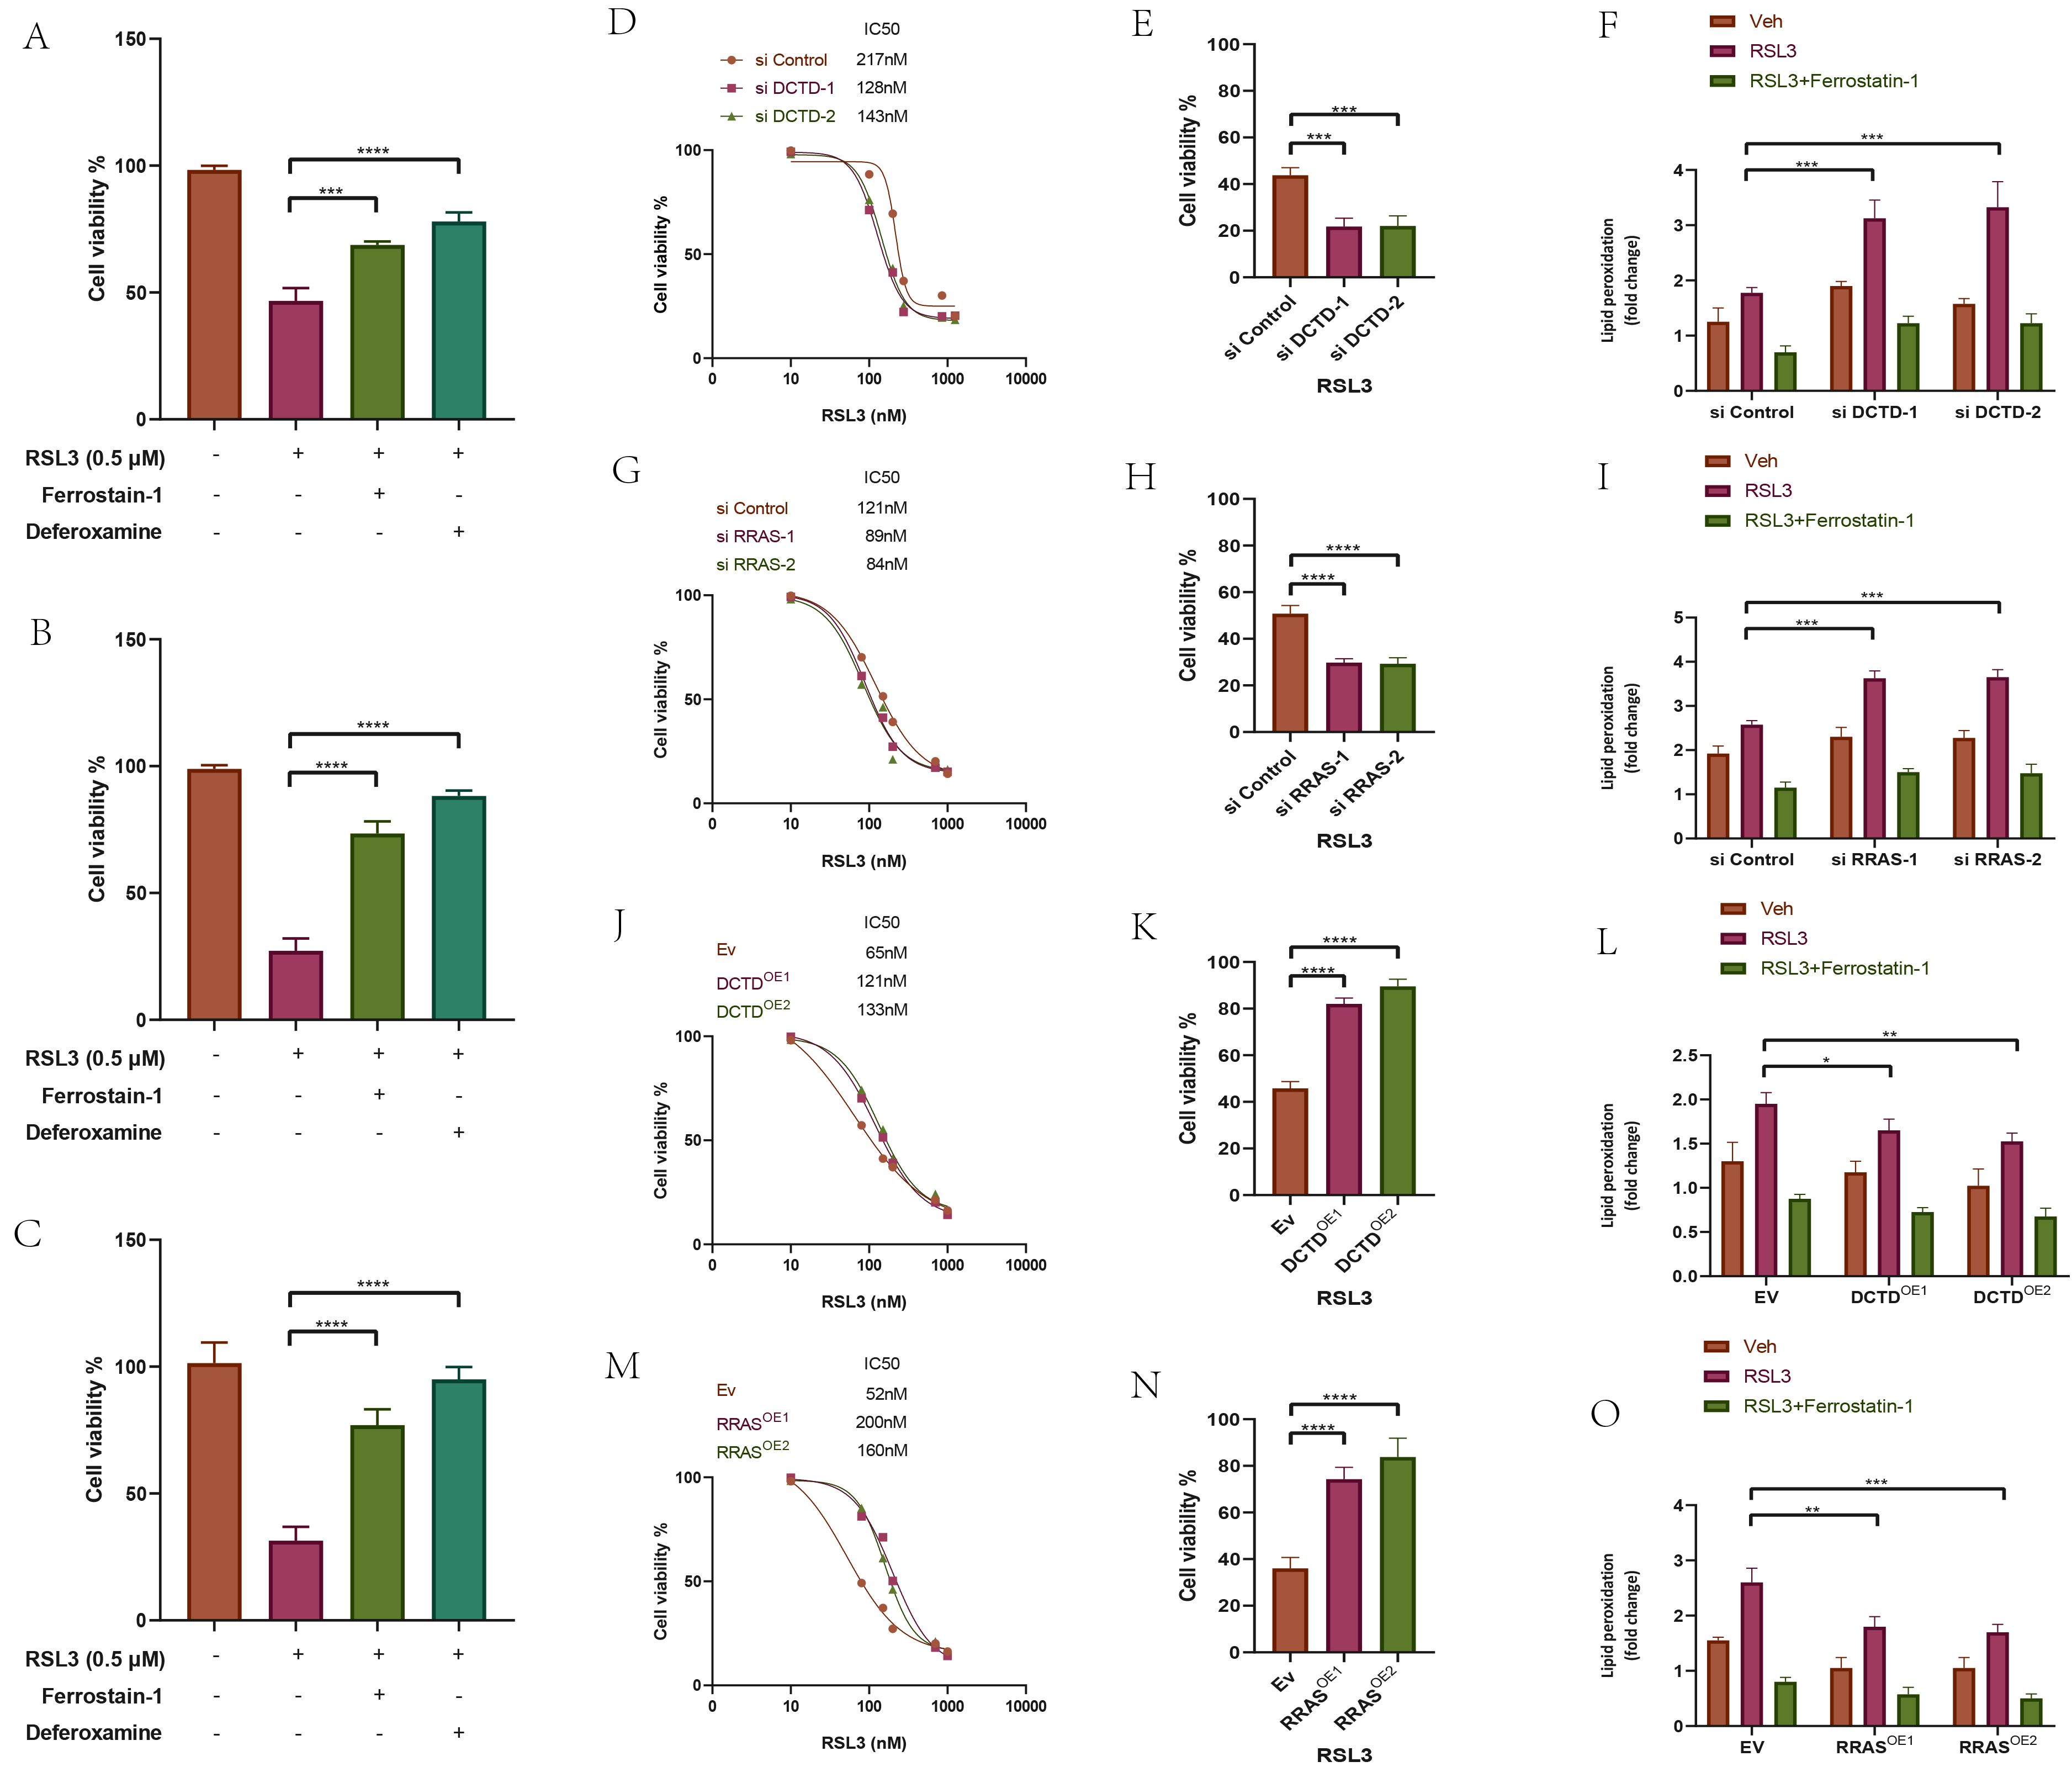 Fig. 12.
Determination of the effect of DCTD and RRAS
on the level of ferroptosis of GBM cells. ((A) TG-905, (B) U-87MG, (C)
A172) Cell viability analyses of different groups of three GBM cells
treated with ferroptosis activators or ferroptosis inhibitors. (D,E,G,H,J,K,M,N) Detection of IC50 values of RAS-selective lethal small
molecule 3 (RSL3) after knockdown or overexpression of DCTD,
RRAS by cell viability analyses. (F,I,L,O) Detection of lipid
peroxidation levels after application of RSL3 or Ferrostain-1 in knockdown or
overexpression of DCTD and RRAS U-87MG cells. (Related
experiments were independently replicated three times.) *p
Given that JKE-1647 is more easily metabolized in vivo and induces ferroptosis [18], we chose JKE-1647 as the ferroptosis inducer for in vivo experiments. Since DCTD and RRAS are positively correlated with immune cell infiltration, we selected the PD-L1 inhibitor atezolizumab to verify the efficacy of immunotherapy for GBM. We established a subcutaneous tumor model with three groups: si-con + JKE-1647, si-con + JKE-1647 + atezolizumab, and si-DCTD/si-RRAS + JKE-1647 + atezolizumab. Consistent with in vitro results, ferroptosis activation significantly inhibited subcutaneous tumor growth, and the combination of JKE-1647 and atezolizumab had a stronger inhibitory effect than JKE-1647 alone. As expected, knockdown of DCTD or RRAS combined with JKE-1647 and atezolizumab more effectively inhibited GBM subcutaneous tumor growth (Fig. 13A–C, F–H), indicating that DCTD or RRAS knockdown promotes ferroptosis activation. Plasma ALT and AST levels showed no significant differences among the groups, suggesting that JKE-1647 combined with atezolizumab does not cause noticeable hepatotoxicity (Fig. 13D,E,I,J). We added the murine glioma cell line GL261 to establish a subcutaneous tumor model, and obtained the same conclusion (Supplementary Fig. 10).
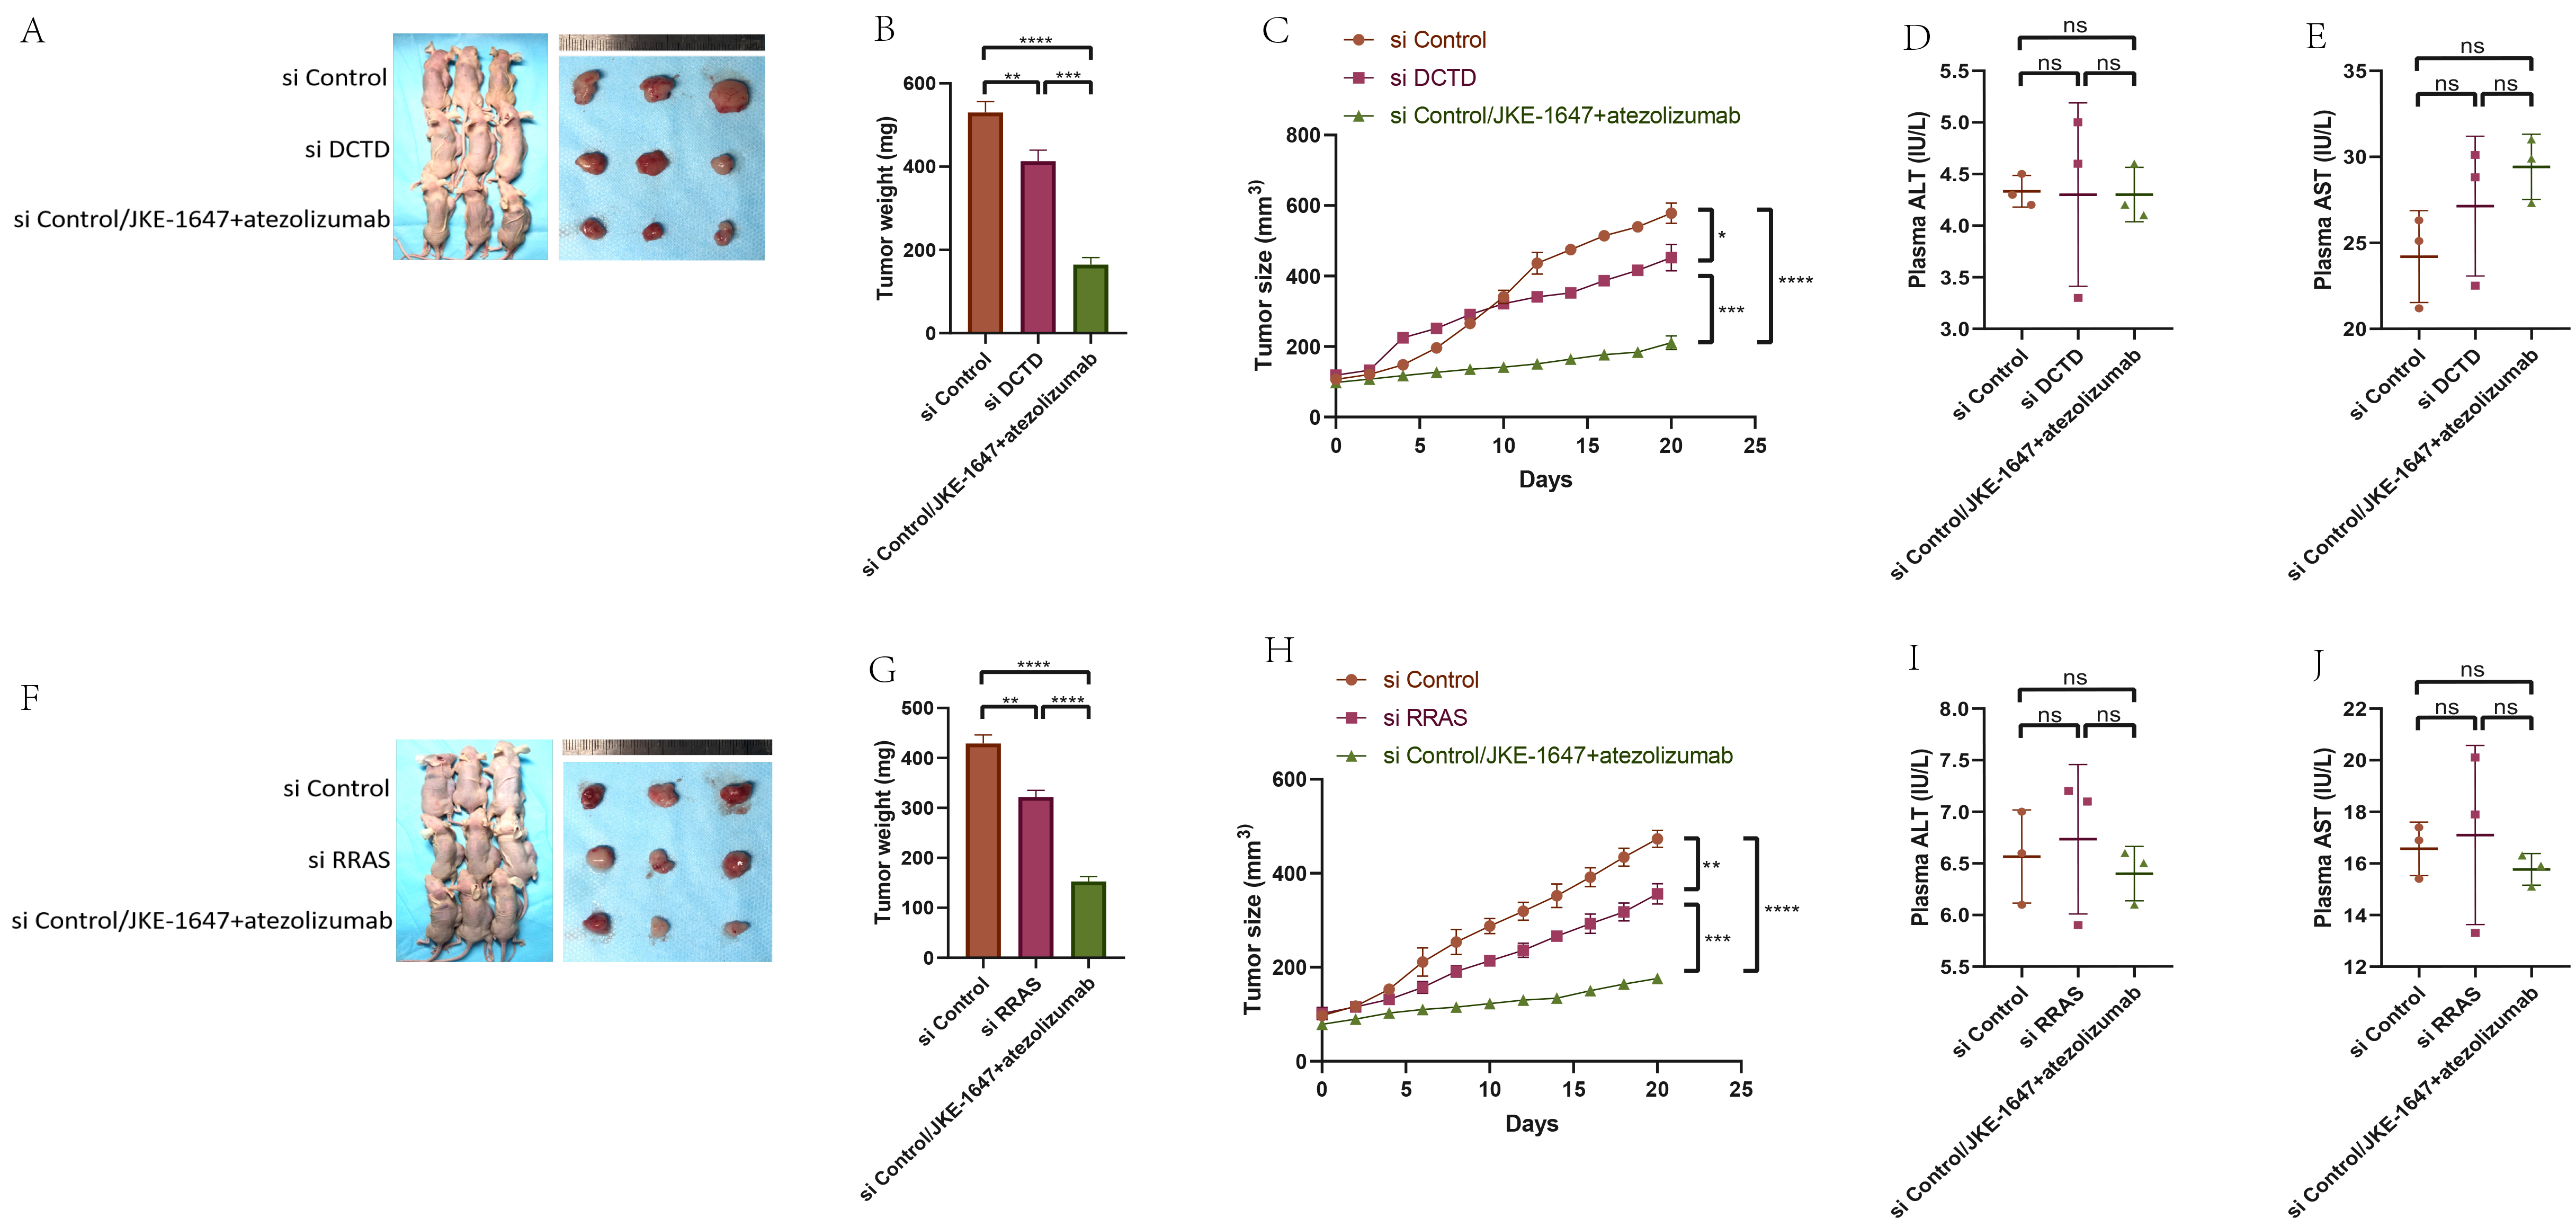 Fig. 13.
Effect of JKE-1647 combined with atezolizumab on the growth of
subcutaneous transplanted tumors in nude mice. (A–C, F–H) CDX model
construction and tumor volume and weight detection in different groups. (D,E,I,J)
Detection of liver function in different groups of nude mice. *p
Numerous studies have demonstrated that eQTL analysis can effectively identify the association between SNP genotypes and gene dysregulation in GBM [7, 8, 9]. A meta-analysis of SNP data from glioma-associated loci identified 12 candidate susceptibility SNPs and investigated 12 glioma-associated genes that had not previously been implicated in GBM [1]. Another study identified rs3761124 as a functional variant located on 20q13.33, which is associated with the risk of glioma and GBM. This variant regulates the expression of stathmin-3 (STMN3) and other potential genes across various cellular contexts [7]. Cancer eQTL analysis can specifically focus on differentially regulated genes in GBM by utilizing fold-change expression levels, thereby highlighting the enrichment of genes associated with neuronal functions. While individual variations may potentially impact the results, the fold-change-based screening of probe sets uncovers gene dysregulation patterns that are characteristic of GBM [2]. A systematic evaluation of the genetic impact on tumor gene expression revealed 13 cis-eQTL target genes associated with GBM survival, underscoring the substantial genetic influence on tumor gene expression [8]. eQTL analysis not only investigates the impact of copy number variations on single-gene expression but also explores large-scale genomic associations across entire gene networks [9]. These results suggest that eQTL-related analyses can reveal the characteristics of gene regulation in GBM. In this study, we identified 250 genes associated with GBM by conducting MR analysis using blood eQTL data and GBM GWAS data.
Next, leveraging the TCGA dataset, we conducted a differential gene expression analysis comparing normal and tumor tissues to identify genes with significantly altered mRNA expression levels. Following this, we applied LASSO regression to construct a prognostic model, which determined the risk coefficients of four key genes: FSTL1, FXYD5, RRAS, and RNF216P1. This allowed us to calculate the riskScore for each sample. Notably, FSTL1, a member of the secreted protein acidic and rich in cysteine (SPARC) family, is up-regulated in glioblastoma, and its co-expression with p53 correlates with poor survival in GBM patients. In our prognostic model, it is associated with the high-risk population and a poor prognosis [19]. FSTL1 plays a pivotal role in temozolomide resistance by modulating discointeracting protein 2 homolog A (DIP2A) protein localization, H3K9 acetylation, and O6-methylguanine methyltransferase (MGMT) transcription [20]. Elevated FSTL1 expression inhibits the nuclear translocation of DIP2A, leading to increased MGMT expression and consequently enhancing glioblastoma resistance to temozolomide [21]. FXYD5, part of the FXYD ion-transport regulator family, has unclear precise roles in glioma, but its significance in our prognostic model points to a strong association with glioma prognosis [22]. At least half of the survey datasets demonstrate a marked increase in the expression levels of multiple ion channels, including FXYD5, in GBM [23]. A study has demonstrated that alterations in the RRAS gene are predominantly observed in gemistocytic astrocytomas and secondary glioblastomas, rather than fibrillary astrocytomas and primary GBM [24]. Furthermore, patients harboring RRAS deletions exhibit significantly reduced survival rates [25]. The existing literature has not documented the relationship between RNF216P1 and GBM. To date, RNF216P1 has only been identified in hepatocellular carcinoma, where it may be involved in an EZH2-related ceRNA pathway [26]. FSTL1, FXYD5, and RRAS have been investigated to a certain extent in GBM; however, research specifically addressing their roles is limited [27, 28]. We need a more detailed exploration of their associations with the GBM immune microenvironment.
In GBM, Tumor-associated macrophages (TAMs) consist of macrophages, making up
the largest proportion of immune cells in the tumor [29]. Their function in GBM
exemplifies a prevalent phenomenon observed in the TME [30, 31]. Unlike primary
brain tumors, metastatic brain tumors lack microglia at their core and are
instead populated by macrophages [18, 32, 33, 34], with recurrent GBM being predominantly
macrophage-driven [35]. TAM-derived Oncostatin M (OSM), its receptor OSMR,
leukemia inhibitory factor (LIF), and its receptor LIFR activate the STAT3
signaling pathway. This activation can induce a mesenchymal (MES)-like
transformation in GBM cells both in vivo and in vitro [36, 37].
M2 macrophages sustain their immunosuppressive phenotype via integrin
Compared to TAMs, which constitute 50% of all viable GBM cells, MDSCs exert a greater suppressive effect on the TME than TAMs and Tregs [41, 42]. MDSCs are classified into two main categories, one of which is monocytic myeloid-derived suppressor cells (M-MDSCs), which resemble monocytes, which resemble neutrophils. M-MDSCs primarily tend to polarize into TAMs and rapidly exert immunosuppressive effects, while polymorphonuclear myeloid-derived suppressor cells (PMN-MDSCs) mainly induce long-term immune tolerance [43]. The chemokines, including C-X-C chemokine receptor type 4/C-X-C motif chemokine 12 (CXCR4-CXCL12), CXCR2-CXCL5/8, and CCR2-CCL2, play important roles in M-MDSC mobilization, with CCL2 and CCL15 being especially relevant in colorectal cancer [44, 45]. PMN-MDSC recruitment is mainly mediated by CXCR1-CXCL8, CXCR2-CXCL8, CCR5-CCL5, CXCL6, and CXCL12, along with factors such as CCL2, CCL3, and hypoxia [46, 47]. Genes highly expressed in the high-risk group are significantly enriched in chemokine-related pathways compared to those in the low-risk group [48, 49, 50, 51]. The elevated levels of MDSCs in the high-risk group indicate that riskScore is a key marker for distinguishing MDSC infiltration in GBM.
CD8+ T cells lose functionality in the immunosuppressive environment of glioblastoma. This decline is caused by gene expression changes, epigenetic modifications, and immunosuppressive cells like Tregs, TAMs, and MDSCs. Despite higher CD8+ T cell infiltration, high-risk patients still have poorer clinical outcomes [48, 49]. This may be attributed to the high levels of infiltrating Tregs, TAMs, and MDSCs, as well as the inhibitory effects of co-inhibitory immune checkpoints on CD8+ T cells [50].
To better characterize this risk model, we analyzed the link between riskScore and tumor mutations in depth. TP53, EGFR, and PTEN showed significant differences in mutation frequencies between high-risk and low-risk groups. Notably, the high-risk group had more co-mutations, indicating a more complex mutational profile. While TMB did not differ significantly between the groups, combining riskScore with TMB in subgroup analyses effectively distinguished patient survival outcomes, highlighting riskScore’s potential prognostic value. Additionally, examining the relationships between the four key risk genes and the TME revealed that FXYD5 and RRAS correlated positively with T cells, macrophages, and CAFs, whereas RNF216P1 expression correlated negatively with the infiltration of these immune cells.
Based on the pRRophetic “package predictions”, we confirmed that High-risk patients had lower IC50 to Dasatinib, Lapatinib, and Temsirolimus, whereas low-risk patients showed lower IC50 to Elesclomol, Lisitinib, and Tubastatin A. This systematic analysis helps clarify differences in chemotherapy drug sensitivity among GBM patients based on riskScore. Given that clinical trials are currently underway evaluating Lapatinib in combination with radiotherapy and temozolomide (RT/TMZ) for GBM treatment [51], riskScore may potentially be valuable in predicting the effectiveness of Lapatinib for GBM.
Our study elucidates the pivotal roles of DCTD and RRAS in the progression of GBM. By employing siRNA-mediated knockdown of DCTD and RRAS, we observed a marked reduction in the proliferation, migration, and invasion capabilities of U-87MG and U251 cells, as well as a suppression of tumor growth in cell-derived xenograft (CDX) models. The result showed DCTD and RRAS can accelerate GBM progression by promoting these biological processes. Further investigation revealed that DCTD and RRAS regulate the expression of key proteins associated with ferroptosis. Although the correlation between DCTD and the ferroptosis-related gene GPX4 did not achieve statistical significance, it approached significance, indicating a potential association. Following the knockdown of DCTD or RRAS, we detected a decrease in the expression of the ferroptosis-inhibitory protein SLC7A11 and its downstream effector GPX4, alongside an increase in the expression of the ferroptosis-promoting protein ACSL4. Collectively, these results imply that DCTD and RRAS may modulate the phenotypic characteristics of GBM cells by influencing the ferroptosis signaling pathway. By applying ferroptosis activators (RSL3) and inhibitors (Ferrostatin-1, Deferoxamine), we validated the impact of ferroptosis on GBM cell viability. The results demonstrated that the knockdown of DCTD or RRAS significantly reduced the IC50 of RSL3, whereas their overexpression substantially elevated the IC50, further underscoring the critical roles of DCTD and RRAS in ferroptosis regulation. When ferroptosis activators were employed in combination, the groups with DCTD and RRAS knockdown displayed augmented ferroptosis effects. In vivo experiments revealed that the combination of JKE-1647 with the PD-L1 inhibitor atezolizumab effectively suppressed the growth of subcutaneously implanted tumors. Moreover, the integration of DCTD or RRAS knockdown with this combined therapy exhibited even more pronounced inhibitory effects without inducing observable liver toxicity. These findings indicate that DCTD and RRAS not only play pivotal roles in GBM cell proliferation and metastasis but also modulate treatment sensitivity via ferroptosis regulation, potentially providing novel therapeutic targets for GBM in the future.
While our study provides valuable insights into GBM risk profiling and treatment sensitivity, there are several limitations to consider. Firstly, the study’s focus on a limited set of key genes might overlook other important biomarkers and their interactions. Secondly, since the ssGSEA method only measures the relative levels of immune cell infiltration, rather than their absolute abundance, the interpretation of our results has certain limitations. Further experimental validation is required to confirm our conclusions. Additionally, although we identified differential gene expression patterns and their associations with immune cell infiltration, the causal relationships and mechanisms remain unclear. The predictive accuracy of the riskScore model may vary across different patient populations and treatment contexts, and our findings are constrained by the data quality and sample sizes available. Lastly, while predicting drug sensitivity is promising, experimental validation in clinical settings is necessary to confirm these predictions and assess their practical utility in personalized GBM therapy.
This study integrated multi-omics data and experimental validation to investigate GBM pathogenesis and potential therapies. Using MR analysis of blood eQTL and GBM GWAS data, we identified 250 GBM-associated genes, and constructed a prognostic risk model based on four key genes (FSTL1, FXYD5, RRAS, RNF216P1). This model effectively stratified patients into high- and low-risk groups, with high-risk patients showing poorer survival, distinct TME features, and differential drug sensitivity. High-risk groups were enriched in immune-related pathways with increased infiltration of T cells, macrophages, and cancer-associated fibroblasts, along with upregulated immune checkpoints. Low-risk groups were linked to ion transport and neurotransmitter regulation pathways. Mutation analyses revealed differential patterns of TP53, EGFR, and PTEN mutations between groups. Experimental validation confirmed that DCTD and RRAS promote GBM cell proliferation, migration, invasion, and in vivo tumor growth by inhibiting ferroptosis via regulating SLC7A11, GPX4, and ACSL4. Combining the ferroptosis inducer JKE-1647 with the PD-L1 inhibitor atezolizumab—enhanced by DCTD/RRAS knockdown—significantly suppressed tumor growth without hepatotoxicity. These findings highlight the risk model’s prognostic value and identify DCTD/RRAS as potential targets for GBM therapy, supporting personalized treatment development.
The datasets used and analyzed during the current study are available from the corresponding author on reasonable request.
Conceptualization, LLZ, WC, HLC; material preparation, LLZ, WBH; writing-original draft preparation, LLZ, WBH, HLC; writing, editing, and review, LLZ, WBH, HLC. All authors contributed to editorial changes in the manuscript. All authors read and approved the final manuscript. All authors have participated sufficiently in the work and agreed to be accountable for all aspects of the work.
This study was approved by the Animal Ethics Committee of Fujian Medical University. Our in vivo studies strictly follow the “ARRIVE and PREPARE” guidelines. All experiments were conducted in accordance with relevant guidelines and regulations (Animal Ethics Approval No. IACUC FJMU 2024-Y-1661). The TCGA, GEO, IEU, and FinnGen databases are open access and freely available to all researchers, in compliance with ethical guidelines.
We acknowledge the TCGA, GEO, IEU, and FinnGen databases and their contributors.
This work was supported by Natural Science Foundation of Fujian Province [Grant number 2024J08172], Scientific Research Foundation for the Introduction of Talent of the First Affiliated Hospital of Fujian Medical University [Grant number YJRC3991].
The authors declare no conflict of interest.
Supplementary material associated with this article can be found, in the online version, at https://doi.org/10.31083/FBL42844.
References
Publisher’s Note: IMR Press stays neutral with regard to jurisdictional claims in published maps and institutional affiliations.