


 , Liusheng Wu 2,†, Zhen Peng 3, Wei Mao 4, Ting Wang 3, Bo Wu 3, Zhendong Yu 5, Xiaoqiang Li 6,*
 , Erbao Chen 3,*
1 Central Laboratory, Peking University Shenzhen Hospital, 518036 Shenzhen, Guangdong, China
2 Yong Loo Lin School of Medicine, National University of Singapore, 119077 Singapore, Singapore
3 Department of Hepatobiliary and Pancreatic Surgery, Peking University Shenzhen Hospital, 518036 Shenzhen, Guangdong, China
4 Department of Oncology, Shenzhen Key Laboratory of Gastrointestinal Cancer Translational Research, Cancer Institute, Peking University Shenzhen Hospital, Shenzhen Peking University-Hong Kong University of Science & Technology Medical Center, 518036 Shenzhen, Guangdong, China
5 Blood Transfusion Department, Peking University Shenzhen Hospital, 518036 Shenzhen, Guangdong, China
6 Department of Thoracic Surgery, Peking University Shenzhen Hospital, 518036 Shenzhen, Guangdong, China
†These authors contributed equally.
Abstract
Lon protease 1 (LONP1), an adenosine triphosphate (ATP)-dependent protease encoded by nuclear DNA that is highly conserved, maintains the mitochondrial protein balance and regulates adaptive responses to cellular stress. LONP1 dysfunction ultimately results in various forms of cellular and tissue damage. The function of LONP1 in hepatocellular carcinoma (HCC) and how it affects HCC growth were investigated in this work.
The RNA and protein expression levels of LONP1 were determined in paired HCC and adjacent tissue samples through real-time quantitative polymerase chain reaction (RT-qPCR) and immunohistochemistry (IHC) staining. The correlation between LONP1 expression and clinical features was evaluated via statistical analysis. Overexpression (OE) and knockdown (KD) experiments, small RNA interference, Cell Counting Kit-8 (CCK8) and wound-healing assays, and animal experiments were employed to assess the potential mechanism by which LONP1 promotes the proliferation and migration of HCC cells both in vitro and in vivo.
In HCC samples, LONP1 expression was higher than in the equivalent surrounding tissues. Compared to patients with low LONP1 expression, individuals with high LONP1 expression had shorter disease-free survival and overall survival periods. Functionally, LONP1 facilitated the proliferation and migration of HCC cells, whereas LONP1 knockdown mitigated the growth of HCC subcutaneous tumors. Mechanistically, LONP1 affects the processes of ferroptosis and cuproptosis processes by regulating the stability of aconitase 2 (ACO2). Histological analysis showed that the expression of LONP1 in liver cancer tissues was significantly upregulated, accompanied by a decrease in the level of ACO2 protein (Hematoxylin-Eosin (HE) staining and IHC verification). Mitochondrial function experiments indicated that overexpression of LONP1 led to a significant decrease in mitochondrial membrane potential suggesting mitochondrial dysfunction and reduced susceptibility to ferroptosis.
Our results suggest that LONP1 promotes HCC proliferation and migration by inhibiting ferroptosis and cuproptosis through the degradation of ACO2. Therefore, targeting LONP1 might be an effective therapeutic strategy to inhibit HCC growth.
Keywords
- Lon protease 1 (LONP1)
- hepatocellular carcinoma
- ferroptosis regulation
- aconitase 2 (ACO2)
- survival prognosis
Since it makes up 90% of primary liver malignancies, hepatocellular carcinoma (HCC) is the most common histological subtype of liver cancer and has a high death rate. It ranks as the third most frequent cause of cancer-related mortality globally [1], and is especially common in Asia, Africa and southern Europe [2]. HCC is known as the “king of cancers” because of its biological characteristics, such as high malignancy, strong invasiveness and easy metastasis. The main occurrence factors of HCC include genetic and epigenetic changes, chronic hepatitis B virus or hepatitis C virus exposure, aflatoxin exposure, smoking, obesity and diabetes [1, 3]. The incidence of HCC associated with metabolic dysfunction-associated fatty liver disease (MAFLD) is increasing in Western countries [4], and the high recurrence and metastasis rates of HCC lead to serious adverse prognoses [5]. Although patients with HCC have a wide range of treatment options, including liver transplantation, surgical resection, percutaneous ablation and radiotherapy, as well as standard treatment methods such as transarterial and systemic therapy [6], more than 70% of advanced cases are not suitable for transplantation or surgery [7]. Current studies on the dysregulation of key signaling pathways, epigenetic modifications, and the tumor microenvironment in HCC progression have provided novel insights for intervention strategies [8, 9, 10]. However, the current understanding of the molecular mechanisms underlying HCC progression and metastasis remains incomplete. In-depth investigation of its pathological mechanisms is crucial for identifying early biomarkers and improving treatment approaches.
Lon protease 1 (LONP1) is a highly conserved adenosine triphosphate
(ATP)-dependent protease encoded by nuclear DNA and located in the mitochondrial
matrix. This protein mediates the selective degradation of misfolded or
oxidation-damaged polypeptides in the mitochondrial matrix, maintains the
mitochondrial protein balance and regulates adaptive responses to cellular stress
[11, 12]. Mitochondrial dysfunction is a signature phenomenon in cancer biology
and may be one of the reasons for the transformation of mitochondrial energy
metabolism in tumor tissues from aerobic respiration to glycolysis, a process
that requires less oxygen. Dysfunction of LONP1 directly leads to the failure of
mitochondrial protein degradation, and the accumulation of abnormal mitochondrial
proteins leads to a series of types of cells and tissue damage. Previous studies
have shown that the upregulation of LONP1 helps lung fibroblasts adapt to acute
stress and is important for maintaining normal cell viability [13] and overcoming
hypoxia and metabolic and proteotoxic stress associated with the oncogenic
transformation of tumor cells [14]. Silencing LONP1 leads to apoptosis and
mitochondrial damage in colon cancer cells, and LONP1 is involved in
epithelial‒mesenchymal transition (EMT) in colon cancer cells [15]. It has shown
that some long non-coding RNAs (lncRNAs) impair CD4+ T-cell activation by
targeting LONP1, leading to a poor prognosis in patients with gastric cancer
[16]. Helicobacter pylori partially induce LONP1 expression and
overgrowth of gastric cancer cells through HIF1
An iron-dependent type of regulatory cell death linked to an excessive buildup of lipid peroxides is known as ferroptosis [18, 19], and limiting cytotoxic lipid peroxidation protects cells against ferroptosis. Current studies on the mechanism of ferroptosis have confirmed that inhibiting the activity of System Xc– and glutathione peroxidase 4 (GPX4) can induce ferroptosis, which is inhibited by erastin and RSL3, respectively [20, 21]. GPX4 is the main enzyme that catalyzes the neutralization of phospholipid hydroperoxides (PLOOH) in mammalian cells, peroxidation of lipid hydrogen and reduction to the corresponding alcohol. GPX4 gene deletion is known to cause lipid peroxidation-dependent cell death in mouse embryonic fibroblasts [22], and uncontrolled lipid peroxidation is a marker of ferroptosis. Acyl-coa synthase long chain family member 4 (ACSL4) is an important driver of ferroptosis [23, 24] and is regulated by multiple signaling pathways [25, 26]. The expression of ACSL4 in the triple-negative breast cancer cell line subpopulation is related to its sensitivity to ferroptosis inducers [23], and this correlation also exists in clear cell renal cancer cells [24]. p53 may promote ferroptosis by inhibiting the transcription of solute carrier family 7 member 11 (SLC7A11), the subunit of System Xc–, and thus exerting its tumor suppressor function [27]. Arachidonate 12-lipoxygenase (ALOX12) has been reported to be essential for tumor protein 53 (p53)-dependent ferroptosis induced by peroxide [28]. It has reported that PE binding protein-1 (PEBP1) can interact with some lipoxygenases (LOXs) and participate in the regulation of ferroptosis [29]. The protein encoded by the aconitase 2 (ACO2) gene belongs to the cis-aconitase/isopropylmalate (IPM) isomerase family. This protein, which is encoded in the nucleus and plays a role in mitochondria, is a mitochondrial matrix protein that catalyzes the mutual conversion of citric acid to isocitric acid through cisaconite acid in the second step of the tricarboxylic acid cycle (TCA). It is involved mainly in the anabolism and catabolism of organisms, such as DNA repair and replication, as well as protein synthesis and degradation, and its expression products are widely distributed in the heart, kidney and other tissues and organs. Studies have shown that pathogenic gene variation or disordered expression of ACO2 is involved in neurodegenerative syndromes such as optic neuropathy [30] and Parkinson’s disease [31]. Abnormal expression of the Fe-S cluster protein ACO2 leads to mitochondrial dysfunction, and abdominal aortic aneurysm [32]. In addition, mitochondrial dysfunction leads to metabolic changes and affects the activation process of macrophages [33].
Ferroptosis is closely related to HCC development, but its mechanism of action remains unclear [34, 35]. Our study revealed that silencing LONP1 leads to the accumulation of malondialdehyde (MDA) and reactive oxygen species (ROS) in liver cancer cells, suggesting that abnormal LONP1 expression is associated with ferroptosis in these cells. However, the role of LONP1 in iron-related death in liver cancer is unknown. In this project, the expression, biological function and mechanism of LONP1 were studied in the field of HCC. These findings help to elucidate the new mechanism of HCC development and metastasis, provide new ideas for the treatment and diagnosis of HCC, and may also provide important reference value for similar studies of other tumors or diseases.
HCC sequence data and related clinicopathological data were extracted from The Cancer Genome Atlas (TCGA, https://portal.gdc.cancer.gov/) and compiled from the TCGA database using RNAseq data from 33 tumor projects processed using the spliced transcripts alignment to a reference (STAR) process and data in TPM (transcripts per million reads) format. There were 424 tumor samples and 50 normal samples collected (duplicate samples were eliminated, but clinical data was kept). Paracancer and cancer samples that matched the correct numbers were also extracted. For the purpose of comparing expression across samples, the RNA-seq data in TPM format were transformed to log2(value + 1) values. The Stats [4.2.1, https://cran.r-project.org/bin/windows/base/old/4.2.1/] R software package and car package [3.1-0] were used to select appropriate statistical methods according to the data format characteristics (statistical analysis was not performed if the statistical requirements were not met), and the ggplot2 package [3.3.6, https://cran.r-project.org/src/contrib/Archive/ggplot2/] was used to visualize the data.
Since the TCGA database is open to the public according to specific guidelines, it confirms that written informed consent was obtained from all the subjects prior to data collection.
A total of 424 HCC patients were divided into high and low LONP1 expression groups according to the median LONP1 expression. The R package DESeq2 [1.36.0, https://mghp.osn.xsede.org/bir190004-bucket01/index.html#archive.bioconductor.org/packages/3.15/bioc/src/contrib/DESeq2] was used to identify intergroup DEGs. The clusterProfiler [4.4.4, https://mghp.osn.xsede.org/bir190004-bucket01/index.html#archive.bioconductor.org/packages/3.15/bioc/src/contrib/clusterProfiler] and GOplot [1.0.2, https://cran.r-project.org/web/packages/GOplot/] R packages were subsequently used to conduct Gene Ontology/Kyoto Encyclopedia of Genes and Genomes (GO/KEGG) combined LogFC enrichment analysis for the identified DEGs, and the org.Hs.eg.db package [3.21.0, https://bioconductor.org/packages/release/data/annotation/html/org.Hs.eg.db.html] was subsequently used to convert the Entrez ID for the input DEGs. The clusterProfiler package [4.4.4] is used for enrichment analysis, and the LogFC value of DEGs is used to calculate the corresponding z score value of each enrichment item through the GOplot package to preliminarily determine whether the corresponding item is positively regulated (z score is positive) or negatively regulated (z score is negative). The enrichment analysis results were visualized via the ggplot2 package.
In order to provide light on the clinical relevance of LONP1 expression, we
examined how LONP1 expression varied during the course of the disease (stage I,
stage II, stage III, and stage IV). The statistical methods used are the global
test (Kruskal‒Wallis test) and the multiple hypothesis test (Dunn’s test). The
effectiveness of the LONP1 expression level in differentiating HCC tissues from
nontumor tissues was compared via receiver operating characteristic (ROC) curve
analysis to test its predictive value in HCC diagnosis. Three prognostic indices,
overall survival (OS), disease-specific survival (DSS) and the progression-free
interval (PFI), were evaluated. A survival kit was subsequently used to conduct a
proportional risk hypothesis test and univariate and multivariate Cox regression
analyses to analyze the possibility that LONP1 is an independent risk factor for
HCC. The risk factors for Cox regression were p
The Huh7 cell lines were purchased from the Guangzhou Cellcook Biotech Co., Ltd (Guangdong, China). Dulbecco’s Modified Eagle Medium (DMEM, Invitrogen, CA, USA) containing 10% Fetal Bovine Serum (FBS, Gibco, CA, USA) and 1% penicillin and streptomycin double antibody was used to culture Huh7 cells in an incubator at 37 °C and 5% CO2. All cell lines were validated by STR profiling and tested negative for mycoplasma. After logarithmic growth, siLONP1 (SIGS0001490-1, RiboBio, Guangzhou, China, 5′-ACCACTCCTCGGAGTTCAA-3′) and siNC (RiboBio, Guangzhou, China, siNC0000001-1-5) were transferred into Huh7 cells via LipofectamineTM 3000 (Invitrogen, Carlsbad, CA, USA, L3000015). The cells were divided into the siLONP1 group and the siNC group. The cell plates were placed in incubators for further culture. After transfection for 48 h, RNA was collected for real-time quantitative polymerase chain reaction (RT-qPCR) detection, and protein samples were collected for Western blot detection.
The Huh7 cells were counted and put onto 6-well cell culture plates following digestion. The plates were then incubated with a 5% CO2 volume fraction at 37 °C for the entire night. A total of 30~40% of the cells were infected with lentivirus (shRNA targeting LONP1: 5′-CCGGGCAAGATCCTCTGCTTCTATGCTCGAGCATAGAAGCAGAGGATCTTGCTTTTTG-3′). The medium was changed to fresh medium 12 hours after virus infection, and the cells were collected 48 hours after the medium was changed for subsequent detection.
A total of 144 HCC cancer tissues and corresponding adjacent non-tumor samples were collected from patients who received curative hepatectomies between January 2015 and December 2018 at Peking University Shenzhen Hospital, and were constructed into tissue microarrays (TMA).
Another cohort of 71 fresh HCC sample pairs was obtained from HCC patients undergoing curative resection between January 2020 and December 2020 at the Department of Hepatobiliary and Pancreatic Surgery. Thus, a total of 215 clinical sample were involved in the study. TRIzol was used to grind RNA from hepatocellular carcinoma tissues and paired normal or paracancerous tissues, and a NanoDrop 2000 (Thermo Fisher Scientific, Waltham, MA, USA) was used to determine the RNA concentration. The RNA samples whose D260 nm/D280 nm ratio ranged from 1.9 to 2.1 were retained. A RT kit (R323-01, Vazyme, Nanjing, China) was used for reverse transcription with 1 µg of RNA. SYBR Green Real-time PCR Master Mix (Q121-02, Vazyme, Nanjing, China) and a Roche LightCycler 480 Real-Time PCR system (Roche Diagnostics, Basel, Switzerland) were used for the relative quantitative analysis of genes expression level. Details of the qPCR primer sequences are presented in Table 1. The data were analyzed via the 2-ΔΔCT method.
| Primer ID | Primer sequences (5′–3′) |
| LONP1 - forward | TATGGAGATGATCAACGTGTCG |
| LONP1 - reverse | GACAATCTTGTAGGCCGATTTC |
| AAAGACCTGTACGCCAACAC | |
| GTCATACTCCTGCTTGCTGAT | |
| ACO2 - forward | GCAACGACGCAAACCCC |
| ACO2 - reverse | CCATCCCACTTGTCAAAAGGCT |
| ATP7A - forward | TGGTGGGTACAGGAGTAGGTGC |
| ATP7A - reverse | GGGGTTCCGTGAGTAATGGTTC |
| ATP7B - forward | GGGGTTCAAAGTATTCAAGTGTCC |
| ATP7B - reverse | GGCAATGGCAATCAGAGTGGT |
| DLAT - forward | CTGCTGCCACTGCTTCGC |
| DLAT - reverse | TCCTTCACTTAGCTTCTCACCCA |
| FAM50A - forward | ATCGAGACCGTGAGGAGGAG |
| FAM50A - reverse | TTTCCGAAGGATCTCGAGCG |
| FDX1 - forward | ACCCTGGCTTGTTCAACCTGT |
| FDX1 - reverse | TGGCAGCCCAACCGTGA |
| HSPA4 - forward | GTACTGTGGACCTGCCAATCG |
| HSPA4 - reverse | AGCATCATTCCGCTCCTTCTC |
| LIAS - forward | GATGCCAGTGAGCCCTACAAT |
| LIAS - reverse | CCCCATCAGGCATATCATCTCG |
| PUS1 - forward | GCGGGTTTAACTCCAAGAACAG |
| PUS1 - reverse | GCTCAGGCGGTAGGTCTCAT |
| SLC31A1 - forward | ACAATTCCATGCCTGTCCCA |
| SLC31A1 - reverse | TCCACTACCACTGCCTTCTTC |
Cells were lysed and their proteins extracted using radio immunoprecipitation assay (RIPA) buffer (Beyotime, Shanghai, China, P0013B) containing 1 mM phenylmethanesulfonyl fluoride (PMSF, Beyotime, Shanghai, China, ST506) and a protease inhibitor combination (Beyotime, Shanghai, China, P1005). After protein transfer, the polyvinylidene fluoride (PVDF) membrane (Millipore, Burlington, MA, USA, IPVH00010) was placed in 3% bovine serum albumin (BSA, Sangon, Shanghai, China, A600332) and incubated at room temperature for 1 h. An enhanced chemiluminescence (ECL) substrate (Biosharp, Beijing, China, BL520A) was added, and the signal was detected via a chemiluminescence imaging and analysis system (Cytiva, Uppsala, Sweden, GE AI800). Anti-LONP1 antibody (Proteintech, Chicago, IL, USA, 15440-1-AP, 1:1000), anti-beta-actin antibody (Proteintech, Chicago, IL, USA, 66009-1-Ig, 1:500), anti-ACO2 antibody (Proteintech, Chicago, IL, 11134-1-AP, 1:1000), horseradish peroxidase (HRP)-coupled goat anti-mouse antibody (ABclonal, Wuhan, China, AS003, 1:500), and HRP-coupled goat anti-rabbit antibody (ABclonal, Wuhan, China, AS014, 1:500) were used.
Negative control (NC) cells and cells overexpressing LONP1 (LONP1-OE) were trypsinized, tallied, and seeded onto 96-well plates at a density of 2000 cells per well. Four replicates per group were cultivated for 0, 24, 48, 72, 96 hours in a 37 °C CO2 incubator. Each well was then filled with 10 µL of CCK8 solution (Solarbio, Beijing, China, CA1210), and the wells were incubated for an additional hour. A microplate reader (Thermo Fisher Scientific, MA, USA, MultiskanGO) was used to measure absorbance at 450 nm. Cells with LONP1 knockdown (LONP1-KD) and their respective negative control group (shRNA) were processed identically.
Approximately 5
Paraffin sections were processed via the UltraSensitiveTM SP (Mouse/Rabbit) IHC Kit (MXB Biotechnologies, Fuzhou, China, KIT-9720) according to the laboratory instructions. The paraffin-embedded sections were incubated overnight at 4 °C with a specified dilution of antibody. DAB color development reagent (ZSGB-BIO, Beijing, China, ZLI-9017) was used, and the samples were sealed with neutral resin (Biosharp, BL704A). Anti-LONP1 antibody (Proteintech, Chicago, IL, 15440-1-AP, 1:200) and anti-ACO2 antibody (Proteintech, Chicago, IL, 11134-1-AP, 1:1000) were used.
Huh7-shNC and LONP1-KD stable transfer cell lines were digested with pancreatic
enzymes, the washed cells were precooled with PBS 3 times and counted, and the
cells were injected into the subcutaneous area of the armpits of nude mice
according to the number of cells at the site 5
The male BALB/c-nu mice (4 weeks old) used in the experiment were purchased from
Weitonglihua (Beijing, China) Biotechnology Co., Ltd. All mice were raised in a
specific pathogen-free (SPF) grade barrier environment at the Laboratory Animal
Center of Peking University - Hong Kong University of Science and Technology
Medical Center. The environmental conditions were: temperature 22
Post-hoc multiple comparisons were conducted using Dunn’s test, which is
appropriate for non-normally distributed data. Pairwise comparisons were
performed to identify which specific groups exhibited statistically significant
differences. For survival analysis, the Kaplan-Meier (KM) method was employed,
with the Log-Rank test used to determine the p-value. All cellular
experiments were replicated to ensure reliability. Data from these experiments
were analyzed using the t-test, with results presented as mean
The expression of LONP1 mRNA in various tumor types was examined using the
Wilcoxon rank sum test based on the TCGA data (Fig. 1A). Compared with that in
normal tissues, LONP1 was differentially expressed in 17 types of tumors, such as
bladder urothelial carcinoma (BLCA) and breast invasive carcinoma (BRCA)
(p
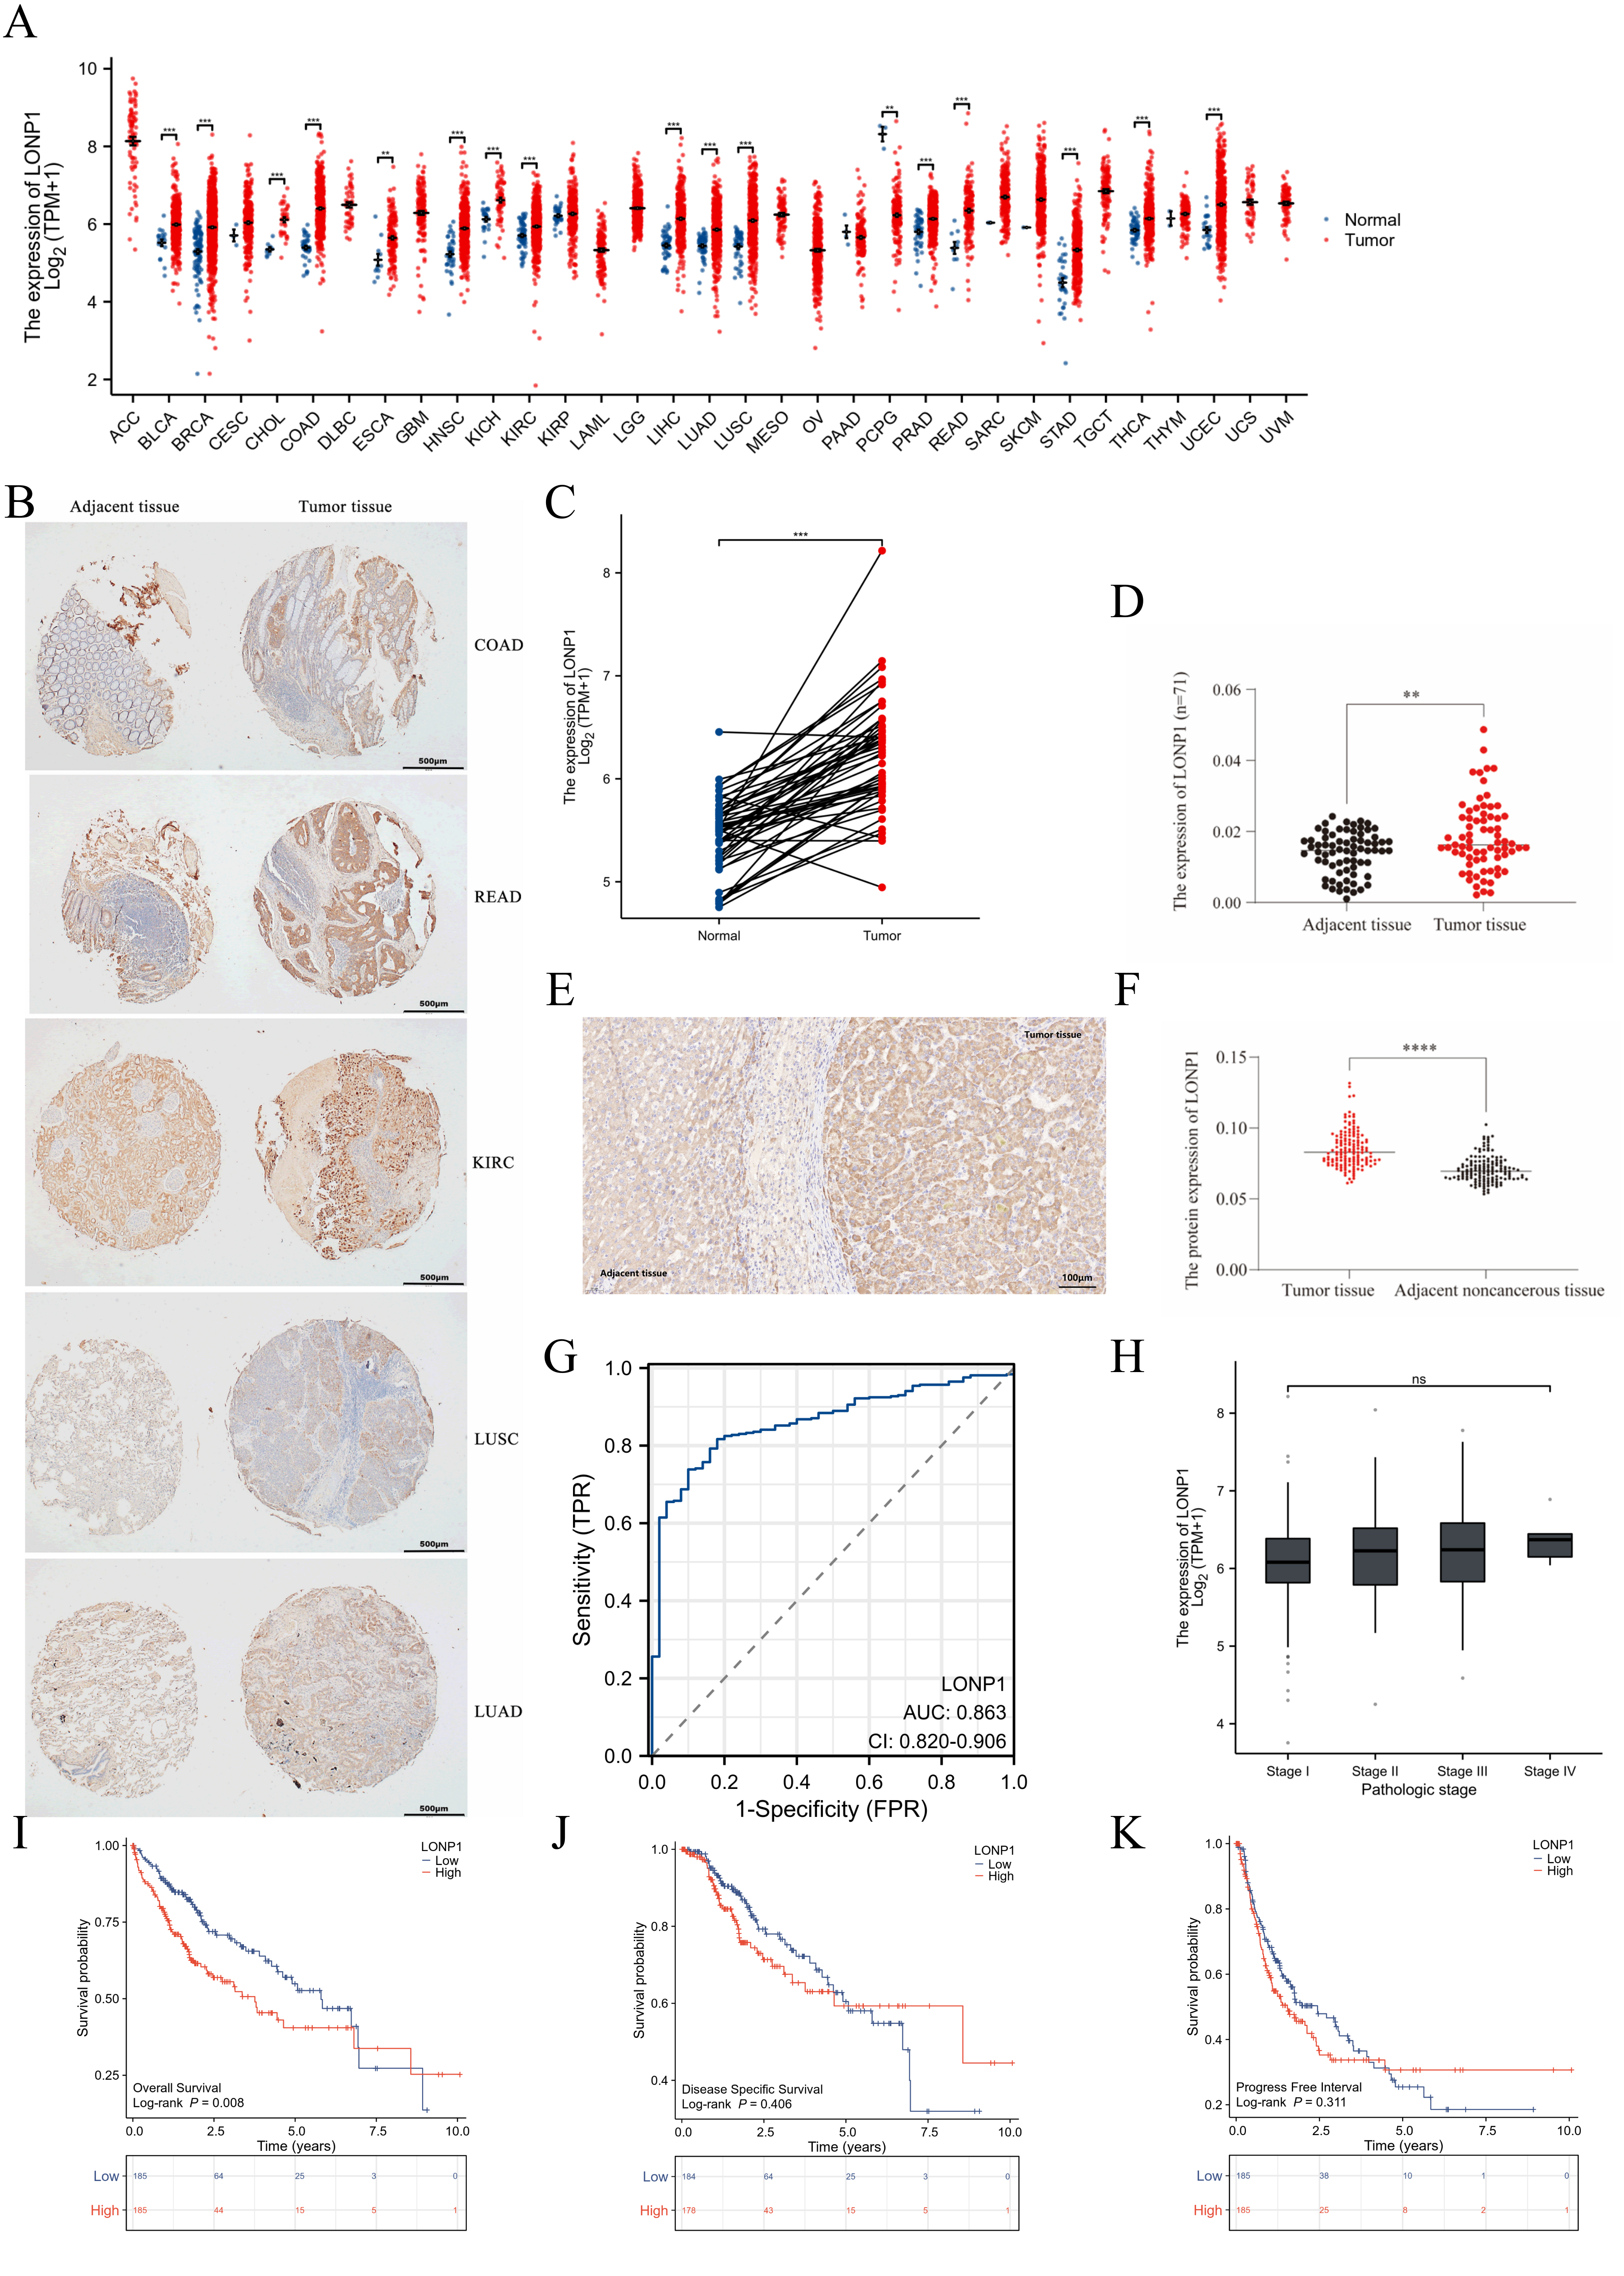 Fig. 1.
Expression characteristics of LONP1 (LONP1 RNA level increased,
diagnostic and prognostic value). (A) Expression of LONP1 in 11,123 unmatched
cancer-associated RNAseq samples. (B) The IHC statinging of a pancancer chip
indicated that LONP1 is highly expressed in a variety of tumors. Scale bar = 500
µm. (C) Expression of LONP1 in 50 paired HCC samples. (D) LONP1 expression
in 71 paired hepatocellular carcinoma- and paracarcinoma-related mRNA samples.
(E) IHC staining was used to detect the expression of LONP1 in liver cancer
tissues, and representative image was showed. Scale bar = 100 µm. (F) LONP1
protein expression levels in 144 liver cancer microtissue chips were scored on
the basis of the average optical density value. (G) ROC curve analysis of the
correlation of differences in LONP1 expression with HCC diagnosis. (H)
Correlation between LONP1 expression and the tumor stage of HCC. (I–K) KM curves
were used to analyze the correlations between high and low LONP1 expression in
patients with liver cancer in terms of OS, PFI, DSS and other clinical
indicators. The data used for the analysis were derived from the RNAseq data
platform in the TCGA database. LONP1, Lon protease 1; IHC, immunohistochemistry;
HCC, hepatocellular carcinoma; ROC, receiver operating characteristic; KM,
Kaplan-Meier; OS, overall survival; PFI, progression-free interval; DSS,
disease-specific survival; TCGA, The Cancer Genome Atlas. **p
To explore the reference value of the LONP1 expression level in distinguishing HCC samples from normal samples, ROC curve analysis was first performed on RNA-seq samples in the TCGA database (Fig. 1G), and the results revealed that the area under roc curve (AUC) value of LONP1 was 0.863 (95% CI: 0.820–0.906), suggesting that LONP1 could be used as a diagnostic marker for HCC but was not associated with tumor stage (Fig. 1H). To further clarify whether differences in LONP1 expression are associated with poor prognosis in HCC patients, we analyzed the clinical information of 370 HCC RNAseq samples in the TCGA database. LONP1 expression was divided into high and low-expression groups according to the median value of LONP1 expression. K‒M survival analysis revealed that LONP1 was associated with OS (Fig. 1I) but was not a risk factor for the PFI or DSS of patients with HCC (Fig. 1J,K).
To further elucidate the biological function and mechanism of LONP1 and screen suitable liver cancer cell lines for further study, we analyzed the expression of the LONP1 gene in a variety of liver cancer cell lines (Fig. 2A) and finally selected the Huh7 cell line with stable expression of LONP1 as the object of subsequent functional and mechanistic studies.
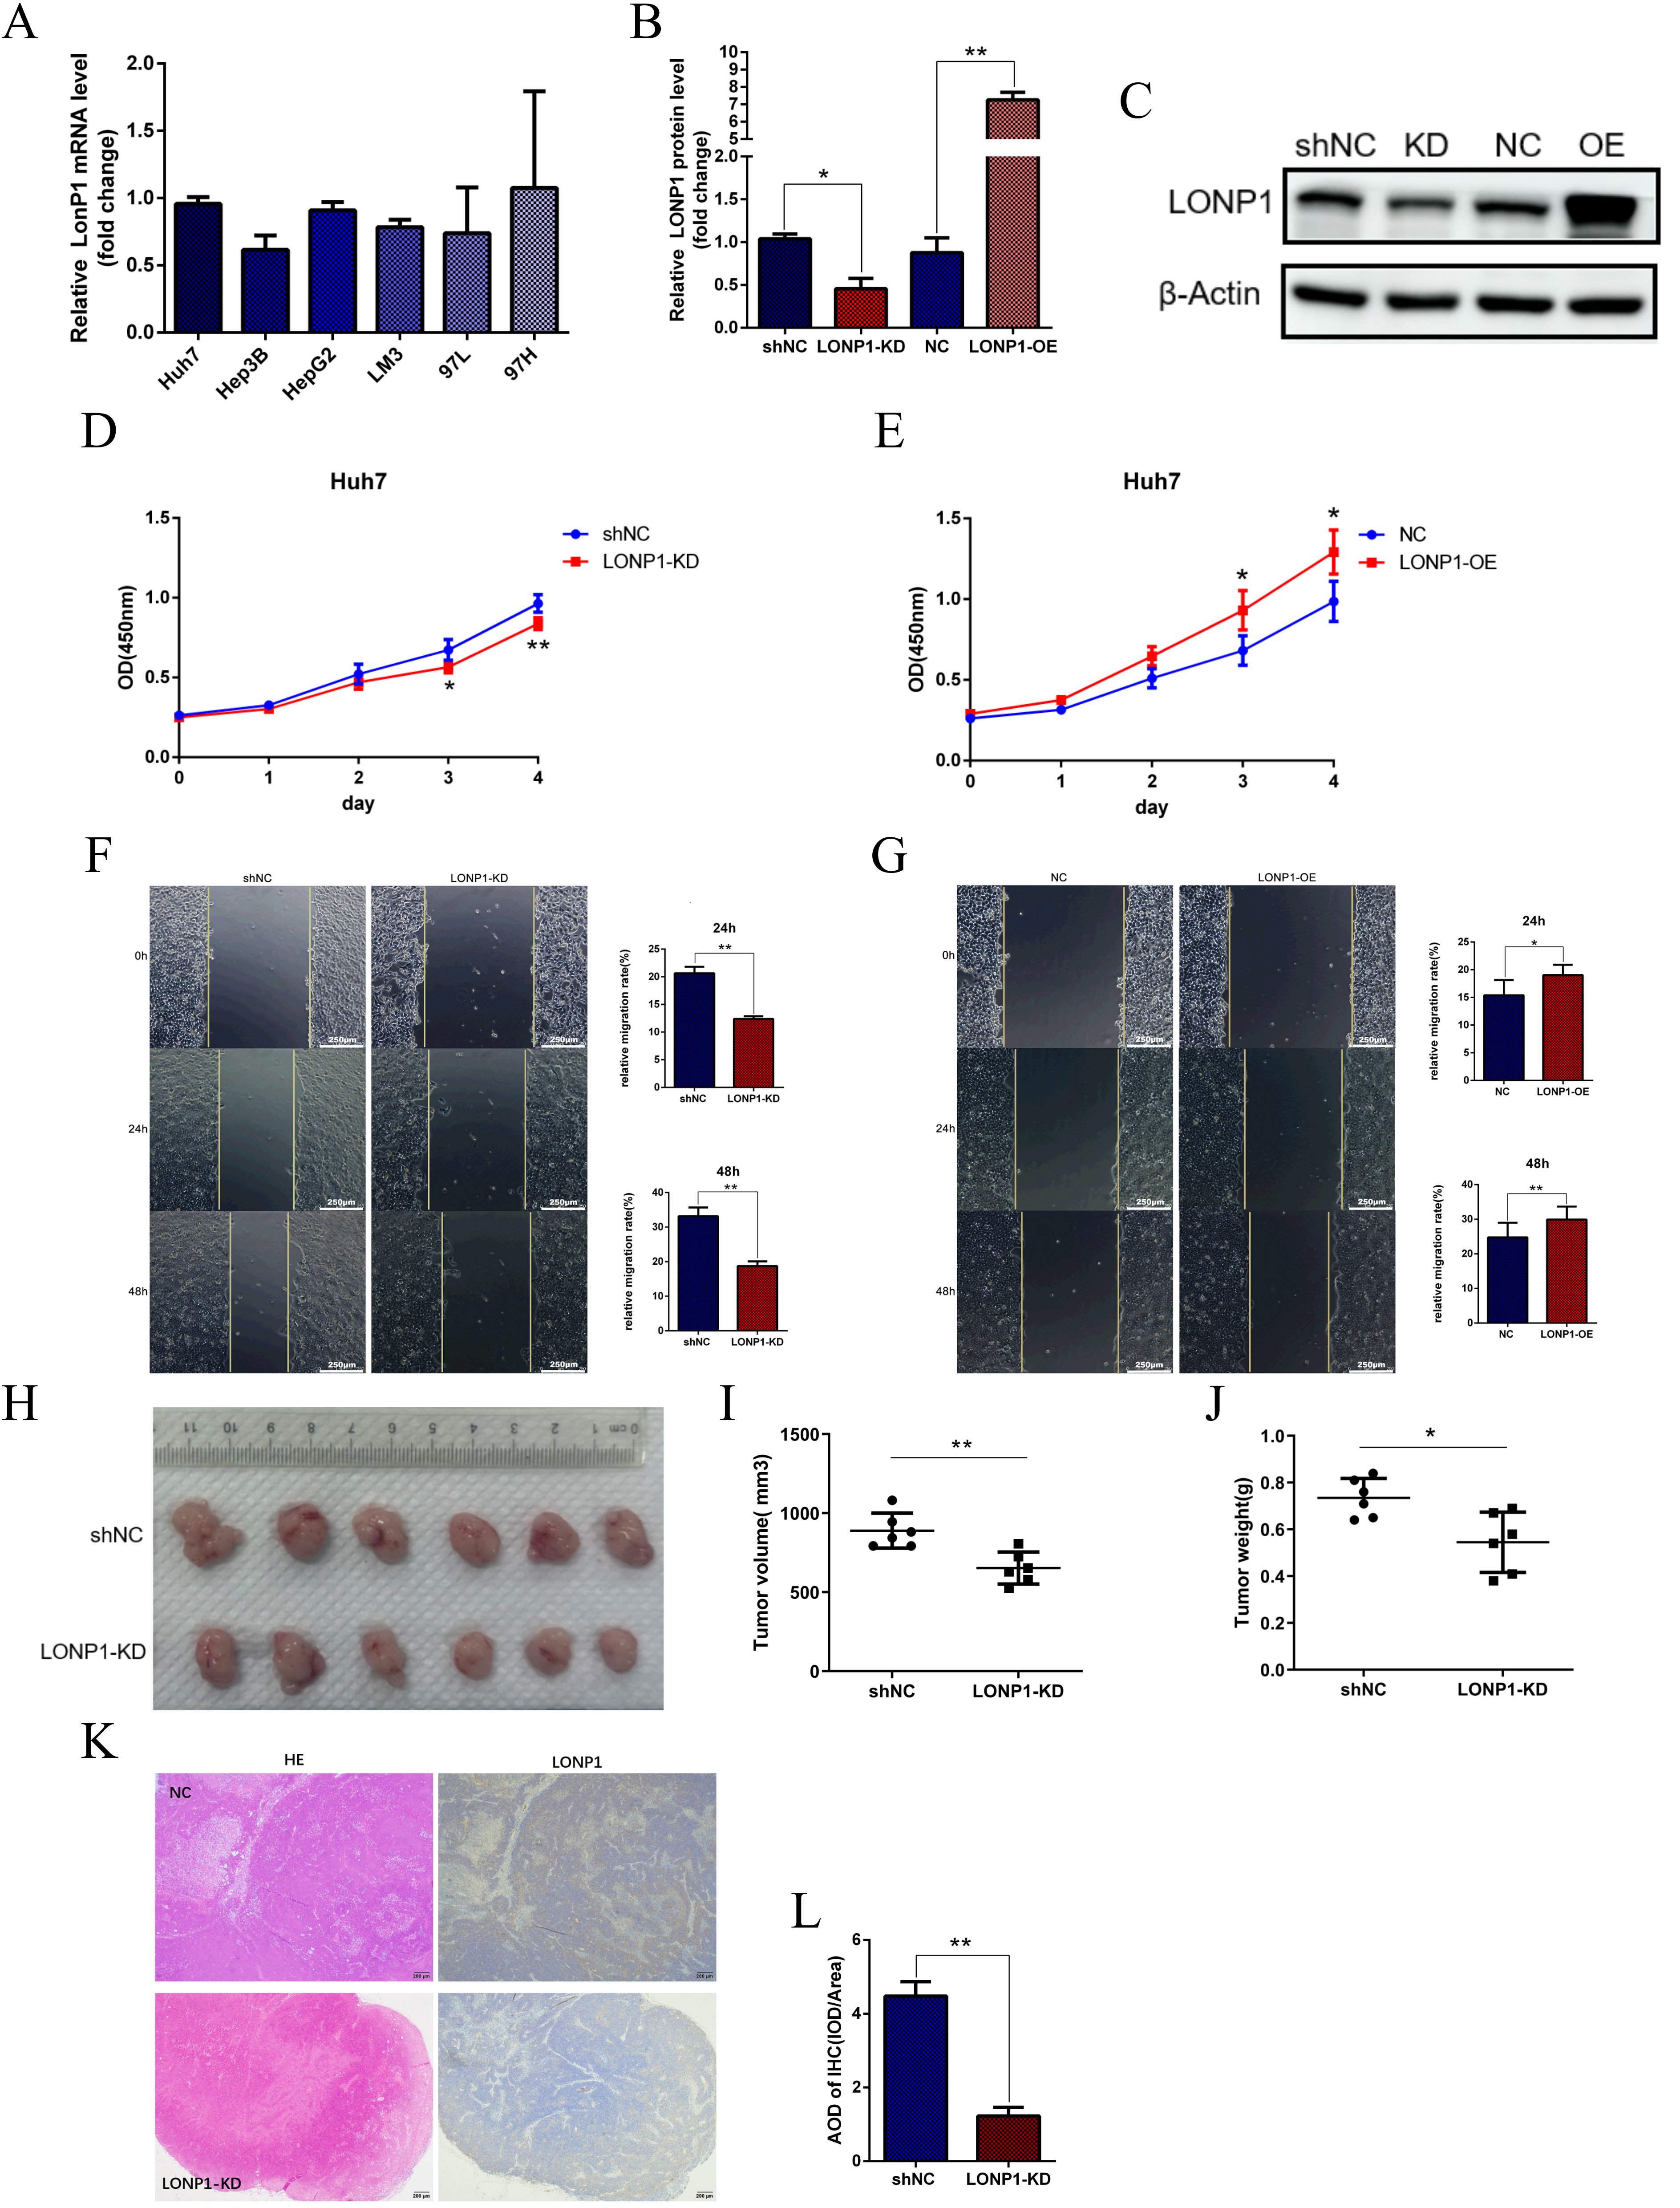 Fig. 2.
LONP1 expression regulates cell proliferation, migration and
tumor formation. (A) RT-qPCR was used to detect the expression of LONP1 in the
mRNA samples of various hepatoma cell lines. (B,C) After lentivirus infection of
Huh7 cells, stable knockdown and overexpression cell lines were constructed, and
the relative expression of LONP1 was detected via western blotting. The internal
reference was beta-actin, and representative images were showed. (D,E) CCK8 was
used to detect the activity of Huh7 cells with LONP1 knockdown or overexpression.
(F,G) The migration ability of Huh7 cells with low knockdown or overexpression of
LONP1 was detected via a wound healing assay. Scale bar = 250 µm. (H–J)
Huh7 stable cells with LONP1 knockdown were inoculated into subcutaneous tumors
formed at the lateral axilla of nude mice, and the number of cells inoculated at
each site was 5
In this study, lentivirus interference was used to inhibit and overexpress LONP1 in Huh7 cells, and its inhibitory and overexpression effects were verified at the mRNA and protein levels (Fig. 2B,C). Next, we detected cell viability after the inhibition or overexpression of LONP1 via a CCK8 assay. The results showed that the inhibition of LONP1 expression decreased the activity of Huh7 cells, whereas the overexpression of LONP1 increased activity of Huh7 cells (Fig. 2D,E), suggesting that LONP1 is involved in regulating the proliferation of Huh7 cells. Subsequently, wound healing assays were used to determine whether the migration capacity of the cells was affected by LONP1. Compared with the control, inhibition of LONP1 expression significantly reduced the mobility of Huh7 cells, whereas overexpression of LONP1 promoted migration (Fig. 2F,G), indicating that LONP1 expression regulated the migration ability of Huh7 cells. To further clarify the function of LONP1, we derived a stable Huh7 cell line derived from LONP1 via lentivirus and inoculated it subcutaneously into 4-week-old nude mice to construct a CDX model. The tumor samples were extracted, measured and weighed two weeks later. According to the results, the experimental group with reduced LONP1 expression had smaller tumors in terms of both weight and volume than the control group (Fig. 2H–J), and LONP1 in liver cancer tissues was significantly upregulated (Fig. 2K,L), indicating that inhibiting LONP expression could inhibit the formation of transplanted Huh7 tumors.
To explore the potential biological function of the LONP1 gene
differentially expressed in HCC, a total of 681 genes were significantly
differentially expressed in the LONP1 gene
(
 Fig. 3.
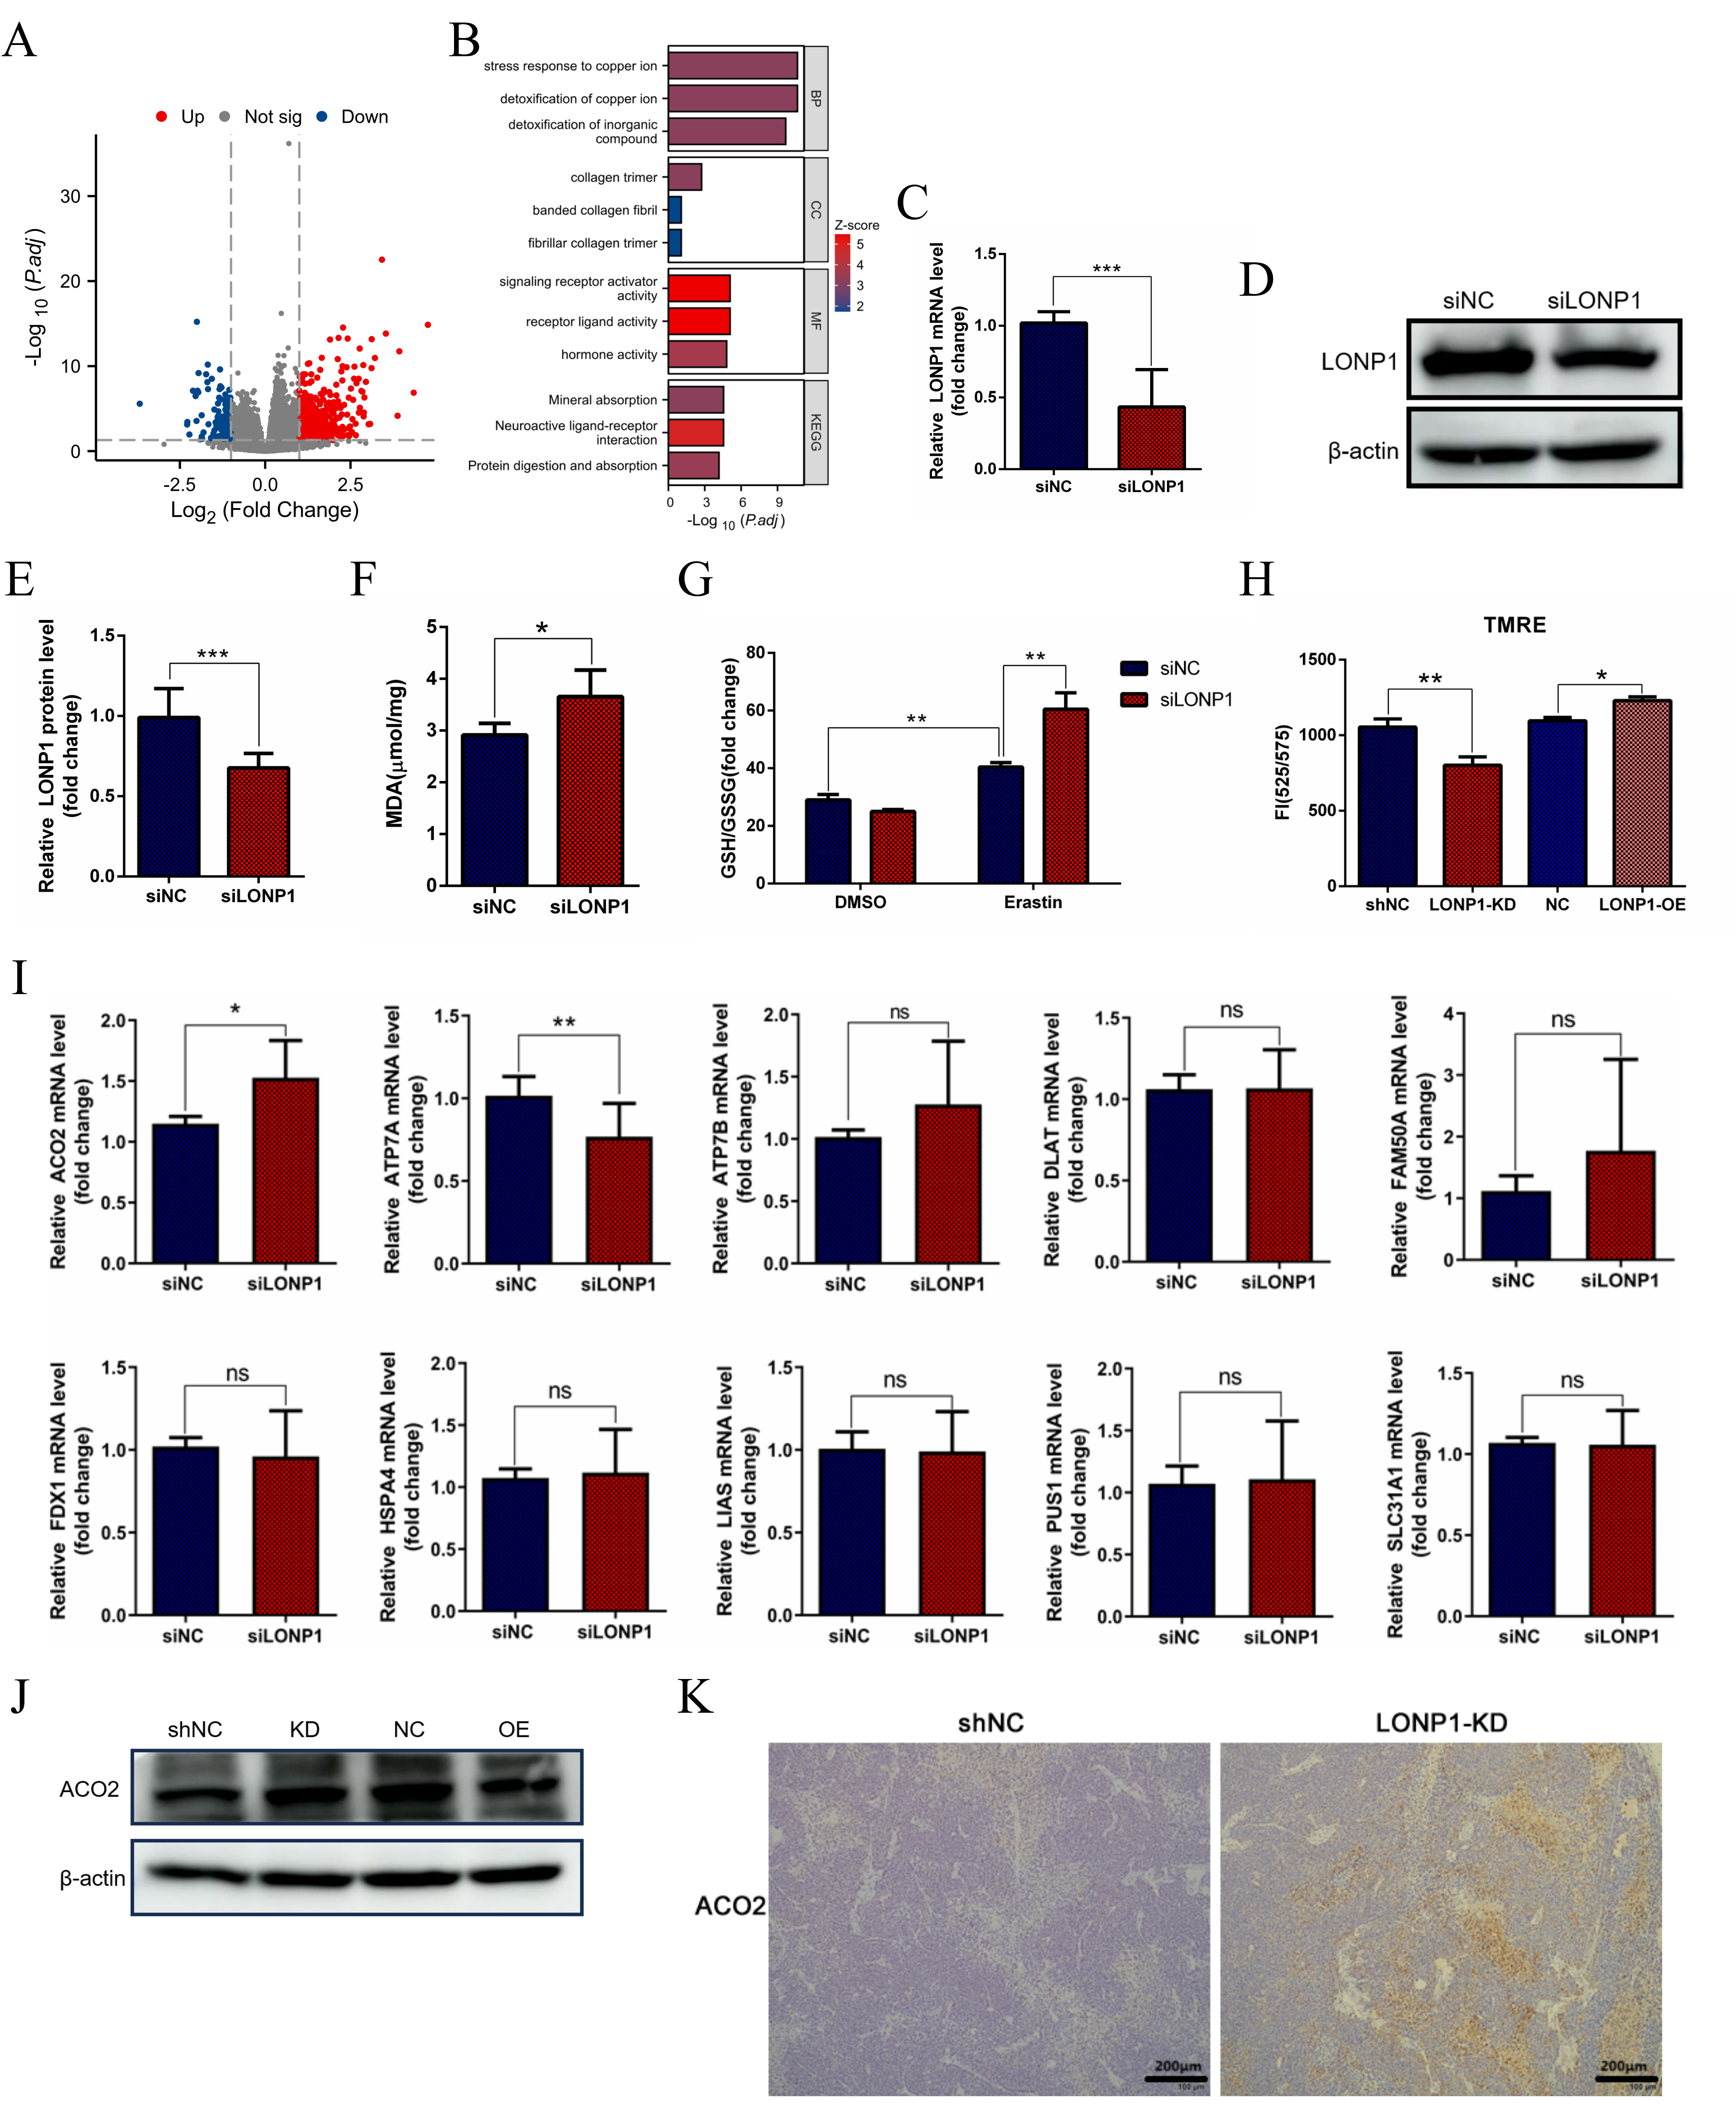
Knocking down LONP1 expression promotes ferroptosis. (A)
HCC-related single-gene difference analysis was performed on LONP1 RNAseq data
from the TCGA database. (B) Functional cluster analysis of Gene Ontology/Kyoto
Encyclopedia of Genes and Genomes (GO/KEGG) combined with logFC was performed for
the DEGs in (A). (C) RT-qPCR detection of LONP1 expression by small interfering
RNA (siRNA). (D) Western blot detection of LONP1 expression following small
interfering RNA (siRNA), and representative images were selected. (E)
Quantitative statistics of the data in (D). (F) Statistical analysis of the
detected MDA levels. (G) The glutathione (GSH)/oxidized glutathione (GSSG) ratio
measurement and statistical analysis. (H) The changes of mitochondrial membrane
potential were detected by TMRE fluorescence signal. (I) RT-qPCR detection of
mRNA expression levels of several cuproptosis related genes in Huh7 cell samples
with LONP1 knockdown by siRNA. (J) Huh7 cells with stable knockdown or
overexpression of LONP1were constructed, and the relative expression of ACO2 was
detected via western blotting. The internal reference was beta-actin, and
representative images were selected. (K) Hematoxylin-Eosinand
Immunohistochemistry of Liver cancer subcutaneous tumors section. Scale bar = 200
µm. DEGs, differentially expressed genes; MDA, malondialdehyde; ACO2,
aconitase 2; TMRE, tetramethylrhodamine ethyl ester perchlorate.
*p
Since LONP1 is an important mitochondrial protease, we first considered indicators related to mitochondrial function. Free radicals in living organisms can cause peroxidation of membrane lipids and lead to cross-linking polymerization of macromolecules such as proteins and nucleic acids, which is cytotoxic. Malondialdehyde (MDA) is an important metabolic product of oxygen free radicals (OFRs) in vivo. In this study, a small interfering RNA (siRNA) strategy was used to silence the expression of LONP1 in Huh7 cells (Fig. 3C–E), and the levels of MDA in the cells were significantly increased (Fig. 3F), which was due to the increase in lipid peroxides caused by the intensification of the ferroptosis process in the cells, suggesting that inhibiting LONP1 could promote ferroptosis. Thus, LONP1 is a negative regulator of ferroptosis. When LONP1 expression was knocked down and erastin-treated cells were added, the glutathione (GSH)/oxidized glutathione (GSSG) ratio increased (Fig. 3G), but LONP1 inhibition alone had no significant effect on the GSH/GSSG ratio. These findings suggest that the body’s regulation of ferroptosis is more complicated when the cells are under severe oxidative stress. Mitochondrial function experiments indicated that knockdown of LONP1 led to a significant decrease in mitochondrial membrane potential (tetramethylrhodamine ethyl ester perchlorate (TMRE) fluorescence signal) (Fig. 3H), suggesting mitochondrial dysfunction.
According to the previous analysis of TCGA database—the function of LONP1 protein in response to copper stress and the correlation with detoxification of copper ion (Fig. 3B), we also speculated that LONP1 may be involved to cuproptosis. To explore the involvement of LONP1 in the regulation of cuproptosis (Fig. 3I). Further analysis of lentiviral stable LONP1-KD and LONP1-OE cell lines in this study found that inhibition of LONP1 expression could promote the upregulation of ACO2 protein in Huh7 cells, while overexpression of LONP1 could inhibit the expression of ACO2 (Fig. 3J). Meanwhile, histological analysis showed that the lower expression of LONP1 in liver cancer tissues accompanied by an increase in the level of ACO2 protein (Fig. 3K), confirming that the LONP1-ACO2 axis promotes the malignant progression of liver cancer by maintaining the stability of mitochondrial membrane potential and antagonizing ferroptose-dependent cell death.
To further verify the expression of the LONP1 and ACO2 proteins, 144 liver cancer tissue samples were subjected to immunohistochemical staining. The results revealed that the expression of LONP1 in cancer tissue was significantly greater than that in paracancerous tissue, while the expression of ACO2 was opposite (Fig. 4A). Moreover, the differential expression of these two proteins is correlated (Fig. 4B).
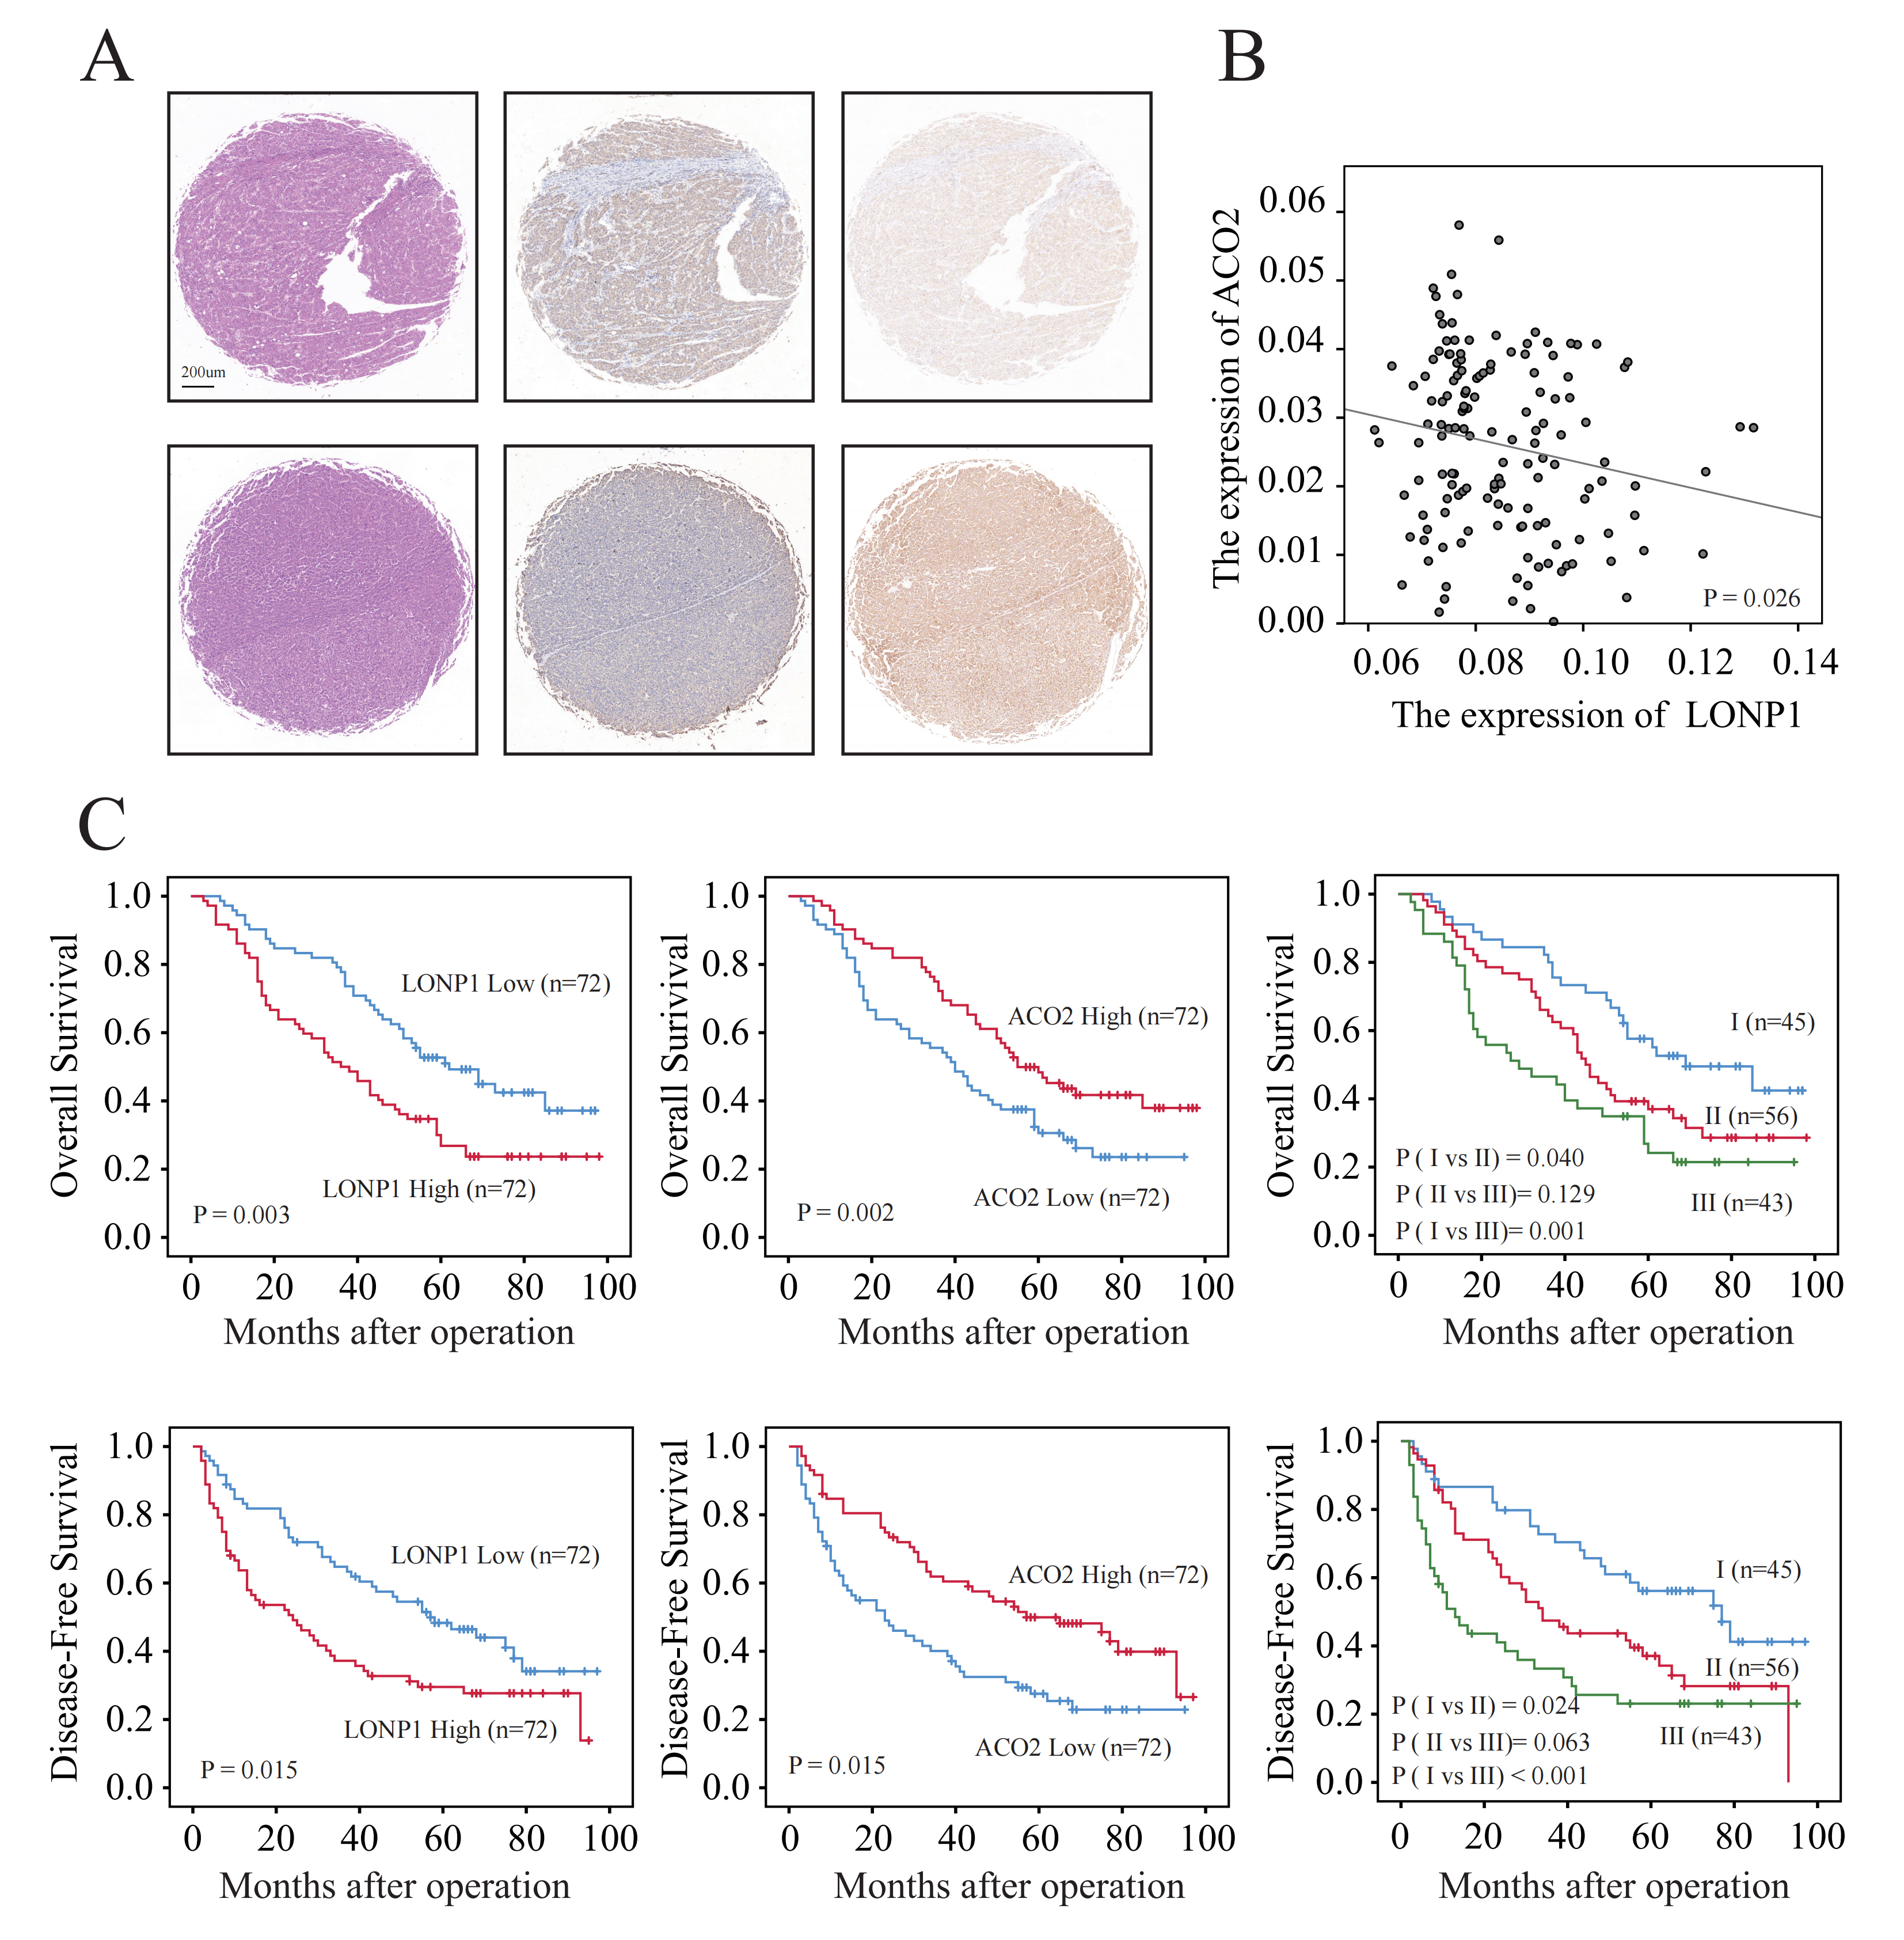 Fig. 4.
Elevated protein level and prognostic value of LONP1. (A) Illustration of high and low LONP1 and ACO2 expression in liver cancer tissue chips detected by IHC. Scale bar = 200 µm. (B) Scatter plot of the correlation between LONP1 and ACO2 protein expression. (C) KM curve. The data used for the analysis were derived from the IHC analysis statistics of 144 liver cancer tissue chips.
Accordingly, we distinguished liver cancer patients according to the median expression of LONP1 protein in liver cancer tissue chips (Table 2). Compared to patients with low LONP1 expression, HCC patients with high LONP1 expression had significantly shorter OS and disease-free survival (DFS), according to the KM curve, while the opposite was true for ACO2 (Fig. 4C). Accordingly, further univariate and multivariate Cox analyses suggested that LONP1 was an independent prognostic predictor of liver cancer (Table 3). Therefore, we confirmed that LONP1 is a liver cancer oncogene.
| Clinical characteristics | LONP1 expression | p value | ||
| Low (n = 72) | High (n = 72) | |||
| Sex (Female vs. Male) | 0.085 | |||
| Female | 13 | 6 | ||
| Male | 59 | 66 | ||
| Age, year ( |
0.045 | |||
| 28 | 40 | |||
| 44 | 32 | |||
| AFP, ng/mL ( |
0.003 | |||
| 35 | 18 | |||
| 37 | 54 | |||
| HBsAg (Negative vs. Positive) | 0.479 | |||
| Negative | 9 | 12 | ||
| Positive | 63 | 60 | ||
| Liver cirrhosis (Negative vs. Positive) | 0.354 | |||
| Negative | 13 | 9 | ||
| Positive | 59 | 63 | ||
| Tumor size, cm ( |
0.003 | |||
| 47 | 29 | |||
| 25 | 43 | |||
| Tumor number (Single vs. Multiple) | 0.248 | |||
| Single | 57 | 51 | ||
| Multiple | 15 | 21 | ||
| Tumor encapsulation (Complete vs. None) | 0.074 | |||
| Complete | 54 | 44 | ||
| None | 18 | 28 | ||
| Vascular invasion (Negative vs. Positive) | 0.045 | |||
| Negative | 45 | 33 | ||
| Positive | 27 | 39 | ||
| Tumor differentiation (I+II vs. III+IV) | 1.000 | |||
| I+II | 46 | 46 | ||
| III+IV | 26 | 26 | ||
| TNM stage (I vs. II+III) | 0.001 | |||
| Ι | 40 | 21 | ||
| II+III | 32 | 51 | ||
LONP1, Lon protease 1; HCC, hepatocellular carcinoma; AFP, alpha fetoprotein; HBsAg, hepatitis B surface antigen; TNM, tumor node metastasis.
| Variable | OS | DFS | |||
| HR (95% CI) | p | HR (95% CI) | p | ||
| Univariate analysis | |||||
| Sex (Female vs. Male) | 1.435 (0.744–2.767) | 0.281 | 1.427 (0.737–2.763) | 0.291 | |
| Age, year ( |
0.745 (0.497–1.119) | 0.156 | 0.707 (0.469–1.066) | 0.098 | |
| AFP, ng/mL ( |
1.392 (0.91–2.13) | 0.127 | 1.468 (0.952–2.263) | 0.082 | |
| HBsAg (Negative vs. Positive) | 1.363 (0.726–2.558) | 0.335 | 1.14 (0.621–2.096) | 0.672 | |
| Liver cirrhosis (No vs. Yes) | 1.307 (0.727–2.351) | 0.371 | 1.307 (0.724–2.36) | 0.374 | |
| Tumor size, cm ( |
1.548 (1.031–2.323) | 0.035 | 1.915 (1.268–2.893) | 0.002 | |
| Tumor number (Single vs. Multiple) | 1.962 (1.269–3.033) | 0.002 | 2.078 (1.335–3.232) | 0.001 | |
| Tumor encapsulation (Complete vs. None) | 1.641 (1.078–2.499) | 0.021 | 1.878 (1.231–2.865) | 0.003 | |
| Vascular invasion (Negative vs. Positive) | 1.872 (1.246–2.814) | 0.003 | 1.836 (1.212–2.78) | 0.004 | |
| Tumor differentiation (I+II vs. III+IV) | 1.688 (1.118–2.548) | 0.013 | 1.703 (1.123–2.584) | 0.012 | |
| TNM stage (I vs. II+III) | 3.159 (2.019–4.942) | 0.000 | 2.72 (1.747–4.234) | 0.000 | |
| LONP1 (Low vs. High) | 1.855 (1.231–2.797) | 0.003 | 1.748 (1.156–2.642) | 0.008 | |
| Multivariate analysis | |||||
| Tumor size, cm ( |
1.367 (0.891–2.097) | 0.152 | 1.828 (1.177–2.839) | 0.007 | |
| Tumor number (Single vs. Multiple) | 1.946 (1.252–3.025) | 0.003 | 2.141 (1.361–3.367) | 0.001 | |
| Tumor encapsulation (Complete vs. None) | 1.102 (0.695–1.749) | 0.679 | 1.217 (0.764–1.939) | 0.409 | |
| Vascular invasion (Negative vs. Positive) | 1.621 (1.034–2.542) | 0.035 | 1.437 (0.911–2.268) | 0.119 | |
| Tumor differentiation (I+II vs. III+IV) | 1.841 (1.205–2.81) | 0.005 | 1.772 (1.155–2.717) | 0.009 | |
| LONP1 (Low vs. High) | 1.712 (1.127–2.6) | 0.012 | 1.601 (1.049–2.443) | 0.029 | |
OS, overall survival; DFS, disease-free survival; HR, hazard ratio; CI, confidence interval.
HCC is the fourth leading cause of cancer-related death and continues to increase worldwide, representing a major challenge for global health care. The biological process of HCC is complex and involves a variety of factors, and regulation of liver cancer cell differentiation and angiogenesis [36]. However, owing to the insidious onset of HCC, most HCC patients are already in the advanced stage when diagnosed and can only receive systemic therapy [37]. Systemic antitumor therapy is the best treatment for patients with advanced liver cancer. With the approval of several new drugs for the treatment of advanced HCC and the establishment of checkpoint inhibitor-based therapy as the standard of care [38], the therapeutic landscape for advanced HCC is more diverse than ever before.
In this study, statistical analysis of RNAseq samples of the LONP1 gene in the database revealed that the gene was differentially expressed in a variety of malignant tumors and their adjacent or normal tissues and was significantly highly expressed in HCC, suggesting that the protein encoded by the LONP1 gene plays an important role in tumor occurrence and development. We subsequently analyzed the expression level of the LONP1 protein in the liver cancer microtissue chip, and the results were mutually confirmed with the RNA-seq data, indicating that LONP1 was significantly highly expressed in liver cancer. Finally, these results were also verified via RT-qPCR and IHC experiments. Additionally, the development of therapeutic strategies targeting LONP1 could potentially alleviate the clinical pathology in HCC patients. After identifying the significant correlation between LONP1 and the occurrence and development of liver cancer, we further explored the function and mechanism of this gene at the cellular and animal levels.
Given the high expression of LONP1 in HCC, we first investigated whether the proliferation and migration of HCC cells were affected by LONP1 expression. To support long-term functional studies, we adopted a lentivirus interference strategy to construct stable Huh7 cell lines with low knockdown and overexpression of LONP1. The results showed that knocking down LONP1 inhibited the proliferation and migration of Huh7 cells, whereas overexpressing LONP1 increased the proliferation and migration of Huh7 cells. We subsequently verified these findings at the animal level, and the results showed that the inhibition of LONP1 expression significantly inhibited the growth of Huh7 tumors in vivo. We found that LONP1 is a tumor-promoting factor in HCC. These results are consistent with our previous findings and further elucidate the clinical value and significance of targeting LONP1.
This suggests that the aberrant expression of LONP1 in HCC may be associated with the ferroptosis process in tumor cells. Furthermore, LONP1 may interact with other mitochondrial proteins to regulate cell ferroptosis. Subsequently, we investigated the impact of the LONP1 gene on the ferroptosis process. siRNA strategy was used in Huh7 cells to lower the expression of LONP1, and changes in the ferroptosis-related indicators GSH/GSSG ratio and MDA accumulation were detected. The results revealed that when LONP1 was silenced as a single factor, the MDA contents were increased in Huh7 cells, but the GSH/GSSG ratio remained unchanged. However, the GSH/GSSG ratio was significantly increased when erastin treatment was combined with LONP1 silencing, suggesting that the ability of LONP1 to promote ferroptosis was weakened when the cells were severely damaged. These experimental results are consistent with existing studies in the field of chronic kidney diseases, and inhibition of the LONP1 gene can aggravate kidney injury and mitochondrial dysfunction [39].
In terms of the mechanism of action of LONP1, many studies have reported that LONP1 plays a role in protecting cell homeostasis by regulating mitochondrial function. LONP1 is a mitochondrial protease that is involved in the degradation of abnormal proteins in mitochondria due to oxidative damage or misfolding and is extremely important for maintaining the normal function of mitochondria [40, 41]. LONP expression induced by LONP1 in the liver can counteract the silencing effect of mitochondrial transcription factor A (TFAM), thereby maintaining the copy number of mitochondrial DNA (mtDNA) and mitochondrial function [42]. The inhibition of mitochondrial LONP1 activity by specific siRNAs can affect liver function [43, 44]. In addition, abnormalities in LONP1 are also associated with the development of other tumors [15], and are involved in cardiac stress [45]. As ACO2 is a mitochondrial protein, it plays a key role in TCA cycle, maintenance of iron homeostasis, oxidative stress defense, and integrity of mtDNA [46]. In this study, we found that knocking down LONP1 in Huh7 cells can promote the upregulated expression of ACO2. Correspondingly, the overexpression of LONP1 inhibited the expression of ACO2. ACO2 is a key mitochondrial protein involved in the TCA cycle, suggesting that LONP1 may influence mitochondrial function by modulating ACO2 expression, thereby regulating the proliferation and migration of liver cancer cells. Studies have shown that ACO2 affects the tumorigenicity of non-small cell lung cancer by regulating iron homeostasis [47]. ACO2 dysfunction can promote mitochondrial dysfunction, thus affecting the occurrence and development of different diseases [48]. In addition, we propose other hypotheses concerning the molecular mechanism of the cellular function and related signaling pathways of LONP1 [49, 50, 51, 52]. GPX4 converts reduced GSH to GSSG, thereby protecting cells against ferroptosis by limiting cytotoxic lipid peroxidation [53]. The GPX4 pathway is further regulated by amino acid antitransporters with xCT/SLC7A11 participation [54, 55, 56]. Importantly, the ferroptosis inducer erastin works by directly inhibiting the function of this heterodimer. In this study, the inhibition of LONP1 expression and erastin treatment resulted in an increased GSH/GSSG ratio and increased MDA accumulation, indicating that the pathway of GSH to GSSG transformation was blocked and that GPX4 may be inactivated. In other words, LONP1 may be involved in the regulation of ferroptosis via this pathway, thereby promoting cell proliferation, migration, and tumor formation. Based on relevant detection indicators, it is plausible that LONP1 exerts its effects through GPX4. It is important to note that no interactions between GPX4 and ACO2 have been reported in the literature. This mechanism remains underexplored and will be a key focus of our future studies. And we will enhance our investigation of mitochondrial function and elucidate the potential mechanisms underlying the LONP1/ACO2 axis in greater detail. LONP1 can also be used to predict the prognosis, immunotherapy response and sorafenib sensitivity of HCC patients [57]. p53, as a key tumor suppressor, plays a significant role in regulating apoptosis, autophagy and ferroptosis. Previous studies have shown that p53 can affect the ferroptosis process by regulating the expression of SLC7A11[27].
This study reveals a novel mechanism by which LONP1 inhibits ferroptosis in liver cancer by specifically degrading ACO2. This discovery expands our understanding of the carci9genic effect of LONP1 and shows similarities and differences with other types of cancer. Unlike the direct regulation of ferroptosis by LONP1 in this study, research in malignant tumors such as pancreatic cancer, breast cancer and ovarian cancer mostly emphasizes that LONP1 promotes tumor survival and proliferation by maintaining mitochondrial protein homeostasis, energy metabolism (such as stabilizing the key enzyme isocitrate dehydrogenase 2 (IDH2) of the TCA cycle) and resisting apoptosis (such as degrading pro-apoptotic factors). For instance, in glioblastoma, LONP1 has been reported to maintain mitochondrial genomic stability by eliminating oxidative damage proteins, but its association with the ferroptosis pathway has not been elaborated in depth. In colorectal cancer (though excluded but used as a comparison point) and lung cancer, the pro-cancer effect of LONP1 is often associated with antioxidant stress (such as regulating the nuclear factor erythroid 2-related factor 2 (NRF2) pathway) and metabolic reprogramming. Therefore, this study found that LONP1 directly alleviates ferroptosis by targeting and degrading ACO2. This not only provides a new perspective for the occurrence of liver cancer but also highlights the tissue or environmental specificity of LONP1’s carcinogenic function—in liver cancer, its unique ability to counteract ferroptosis may constitute a key carcinogenic driving force. This is significantly different from the mode in which LONP1 mainly supports basal metabolism and anti-apoptosis in other cancers, suggesting the potential of tissue-specific therapeutic targeting strategies.
In our study, LONP1 alleviated ferroptosis by degrading ACO2, thereby promoting the occurrence of HCC. However, the role of LONP1 is not limited to intracellular metabolic regulation; its role in the tumor immune microenvironment is also worthy of attention. Furthermore, the mechanism by which lncRNAs regulate LONP1 in gastric cancer [16] suggests that there may be similar pathways associated with HCC. These lncRNAs may further affect the activity of immune cells in the HCC microenvironment by regulating the expression of LONP1. Therefore, future research should delve deeply into the specific role of LONP1 in immune regulation in HCC, so as to gain a more comprehensive understanding of its multiple mechanisms in the occurrence and development of hepatocellular carcinoma.
In this study, highly expressed LONP1 in HCC participated in the regulation of ferroptosis, promoted the proliferation and migration of Huh7 cells, and thus affected tumor formation. Silencing its expression in HCC may play an important role in providing a new way to stop the progression of clinical HCC. Validation using bioinformatics data and clinical tissue microarrays from our research group suggests that LONP1 may exert its oncogenic effects through ACO2. We hypothesize that LONP1, at normal expression levels, primarily functions to maintain mitochondrial function in normal liver tissue. However, in cancerous tissues with overexpressed LONP1, the excess LONP1 may dissociate from the mitochondria and regulate the expression of ACO2, thereby inhibiting ferroptosis in liver cancer cells. A limitation of this study is that we have not explored the molecular regulatory mechanisms between LONP1, ACO2, and GPX4. Due to time constraints, we regret that we are unable to present research findings on this aspect at this time. Additionally, the biological regulatory roles of LONP1 and ACO2 in normal liver tissue have not been fully investigated.
By preventing ferroptosis and cuproptosis through the breakdown of ACO2, LONP1 stimulates HCC migration and proliferation. LONP1 targeting may be a useful therapeutic approach to stop the formation of HCC.
The datasets used or analyzed during the current study are available from the corresponding authors on reasonable request.
YZ, LW: Designed the experiments, Performed the experiments; Collected and analyzed data; Wrote the paper. ZP, WM, TW: technique support. BW, ZY: Designed the experiments and supervision. XL, EC: Designed the experiments, Supervision, and Funding acquisition. All authors contributed to editorial changes in the manuscript. All authors read and approved the final manuscript. All authors have participated sufficiently in the work and agreed to be accountable for all aspects of the work.
This retrospective study was approved by the Institutional Review Board of Peking University Shenzhen Hospital (Approval Number: [2022]No.(164)). Given the retrospective nature of the study and the use of de-identified patient data, the requirement for informed consent was waived by the IRB. The study was conducted in accordance with the ethical standards of the Declaration of Helsinki and its later Follow-up review (Approval Number: [2022]No.(164-Extension 1)). The animal study protocol was approved by the Institutional Review Board (or Ethics Committee) of Peking University Shenzhen Hospital (protocol code 2023-959) for studies involving animals. All animal experiments and operations strictly adhere to the experimental protocols approved by the Laboratory Animal Ethics Committee of Peking University Shenzhen Hospital, as well as national and international laboratory animal welfare guidelines. All experimental animals were euthanized by trained researchers proficient in the cervical dislocation method.
We would like to express our gratitude to all those who helped me during the writing of this manuscript, thanks to all the peer reviewers for their opinions and suggestions.
This work was supported by the National Natural Science Foundation of China (82303446), the Shenzhen High-level Hospital Construction Fund and Peking University Shenzhen Hospital Scientific Research Fund (KYQD2023303), GuangDong Basic and Applied Basic Research Foundation (2023A1515220200), Medical Scientific Research Foundation of Guangdong Province of China (A2024351) and the Science and Technology Development Fund Project of Shenzhen (JCYJ20190809095011463).
The authors declare no conflict of interest.
References
Publisher’s Note: IMR Press stays neutral with regard to jurisdictional claims in published maps and institutional affiliations.