


 , Natalia N. Veiko 1, Oksana N. Agafonova 1, Andrey V. Martynov 1, Roman V. Veiko 1,2, Lev N. Porokhovnik 1, Tatyana A. Salimova 1, Georgy P. Kostyuk 3, Natalia V. Zakharova 4,5, Svetlana V. Kostyuk 1,2
1 Laboratory of Molecular Biology, Research Centre for Medical Genetics (RCMG), 115522 Moscow, Russia
2 State Scientific Center of the Russian Federation “Russian Scientific Center of Surgery Named After Academician B.V. Petrovsky”, Institute of Longevity with a Clinic of Rehabilitation and Preventive Medicine, 119435 Moscow, Russia
3 Psychiatric Hospital No. 1 Named After N.A. Alexeev of The Department of Health of Moscow, 117152 Moscow, Russia
4 V.M. Bekhterev National Medical Research Center for Psychiatry and Neurology, The Institute of Personalized Psychiatry and Neurology, 192019 St Petersburg, Russia
5 International Centre for Education and Research in Neuropsychiatry, Samara State Medical University, 443099 Samara, Russia
Abstract
Schizophrenia (SZ) is associated with chronic oxidative stress in the patient’s body. Previous studies revealed an increased copy number of genes for 47S pre-ribosomal RNA (pre-rRNA) in SZ patients. In this study, levels of oxidative stress and factors involved in the adaptive response to chronic stress (rDNA transcription) were, for the first time, compared in blood cells of patients with catatonic SZ(C) and paranoid SZ(P), chronic forms of schizophrenia, as well as healthy controls (HC).
Ribosomal DNA (rDNA) and telomere repeat (TR) were quantified in leukocyte DNA using non-radioactive quantitative hybridization. Fragments of 5′ external transcribed spacer (5′ ETS) and 18S rRNA were assayed in leukocyte RNA using quantitative reverse transcription PCR (RT-qPCR). Proteins γ-histone H2AX (γH2AX), NADPH-oxidase 4 (NOX4), nuclear factor erythroid 2-related factor 2 (NRF2), BCL2-like protein 4 (BAX), BCL2, and oxidation marker 8-oxo-2′-deoxyguanosine (8-oxodG) were quantified in blood lymphocytes using flow cytometry.
SZ(C) cells exhibited higher levels of the oxidative stress markers than SZ(P) and HC cells. The rDNA copy numbers in SZ(C) genomes negatively correlated with the amounts of the oxidative stress markers levels. Thus, genomes of blood cells isolated from catatonic patients harbor more copies of ribosomal genes than those from paranoid schizophrenia patients, correlating with higher levels of rRNA in catatonic patients.
The upregulated ribosome biogenesis appears to be required for adaptive response to the elevated levels of oxidative stress in catatonic compared to paranoid patients.
Keywords
- schizophrenia
- ribosome biogenesis
- paranoid schizophrenia
- catatonia
- rDNA
- telomere repeat
- oxidative stress
Schizophrenia is associated with chronic oxidative stress in the patient [1, 2, 3]. The oxidative stress is one of the factors of chronic inflammation and immune system activation resulting in the disruption of brain function (so called sterile inflammation hypothesis of schizophrenia development) [3, 4, 5, 6, 7]. The elevated stress is found not only in the patient’s cells, but also in the cultured cells, such as skin fibroblasts, suggesting the existence of genetic factors that induce the oxidative stress [8, 9].
In case of pathogenic genetic variants that provoke oxidative stress, the survival under the chronic stress should involve an adaptive response aimed at compensating the damage to DNA and other cellular structures. If a pathogenic mutation manifests as early as in embryo cells, the adaptive response is crucial for the implementation of embryogenesis. The genome should harbor ‘positive’ genetic factors, which enable dampening the stress consequences. Such positive factors include genes that provide an elevated ribosome biogenesis in response to stress [10, 11, 12, 13, 14].
Indeed, enlarged ribosome abundance underpins more active and rapid biosynthesis of proteins, which counteract oxidative stress and repair the DNA damage. The ribosome number and the rate of ribosome biosynthesis in the cell depend on a number of factors [10, 12, 15]. Among them, the transcription of ribosomal genes that code for ribosomal RNA (rRNA) occupies a central place. In human genome, the ribosomal DNA (rDNA) repeats are gathered in clusters of head-to-tail tandem units (Fig. 1A) located in p-arms of the acrocentric chromosomes (13, 14, 15, 21 and 22). The ribosomal repeat codes for 18S, 5.8S and 28S rRNA subunits, which, together with 5S rRNA and 70–80 ribosomal proteins, are the essential components of the eukaryotic ribosome [16, 17].
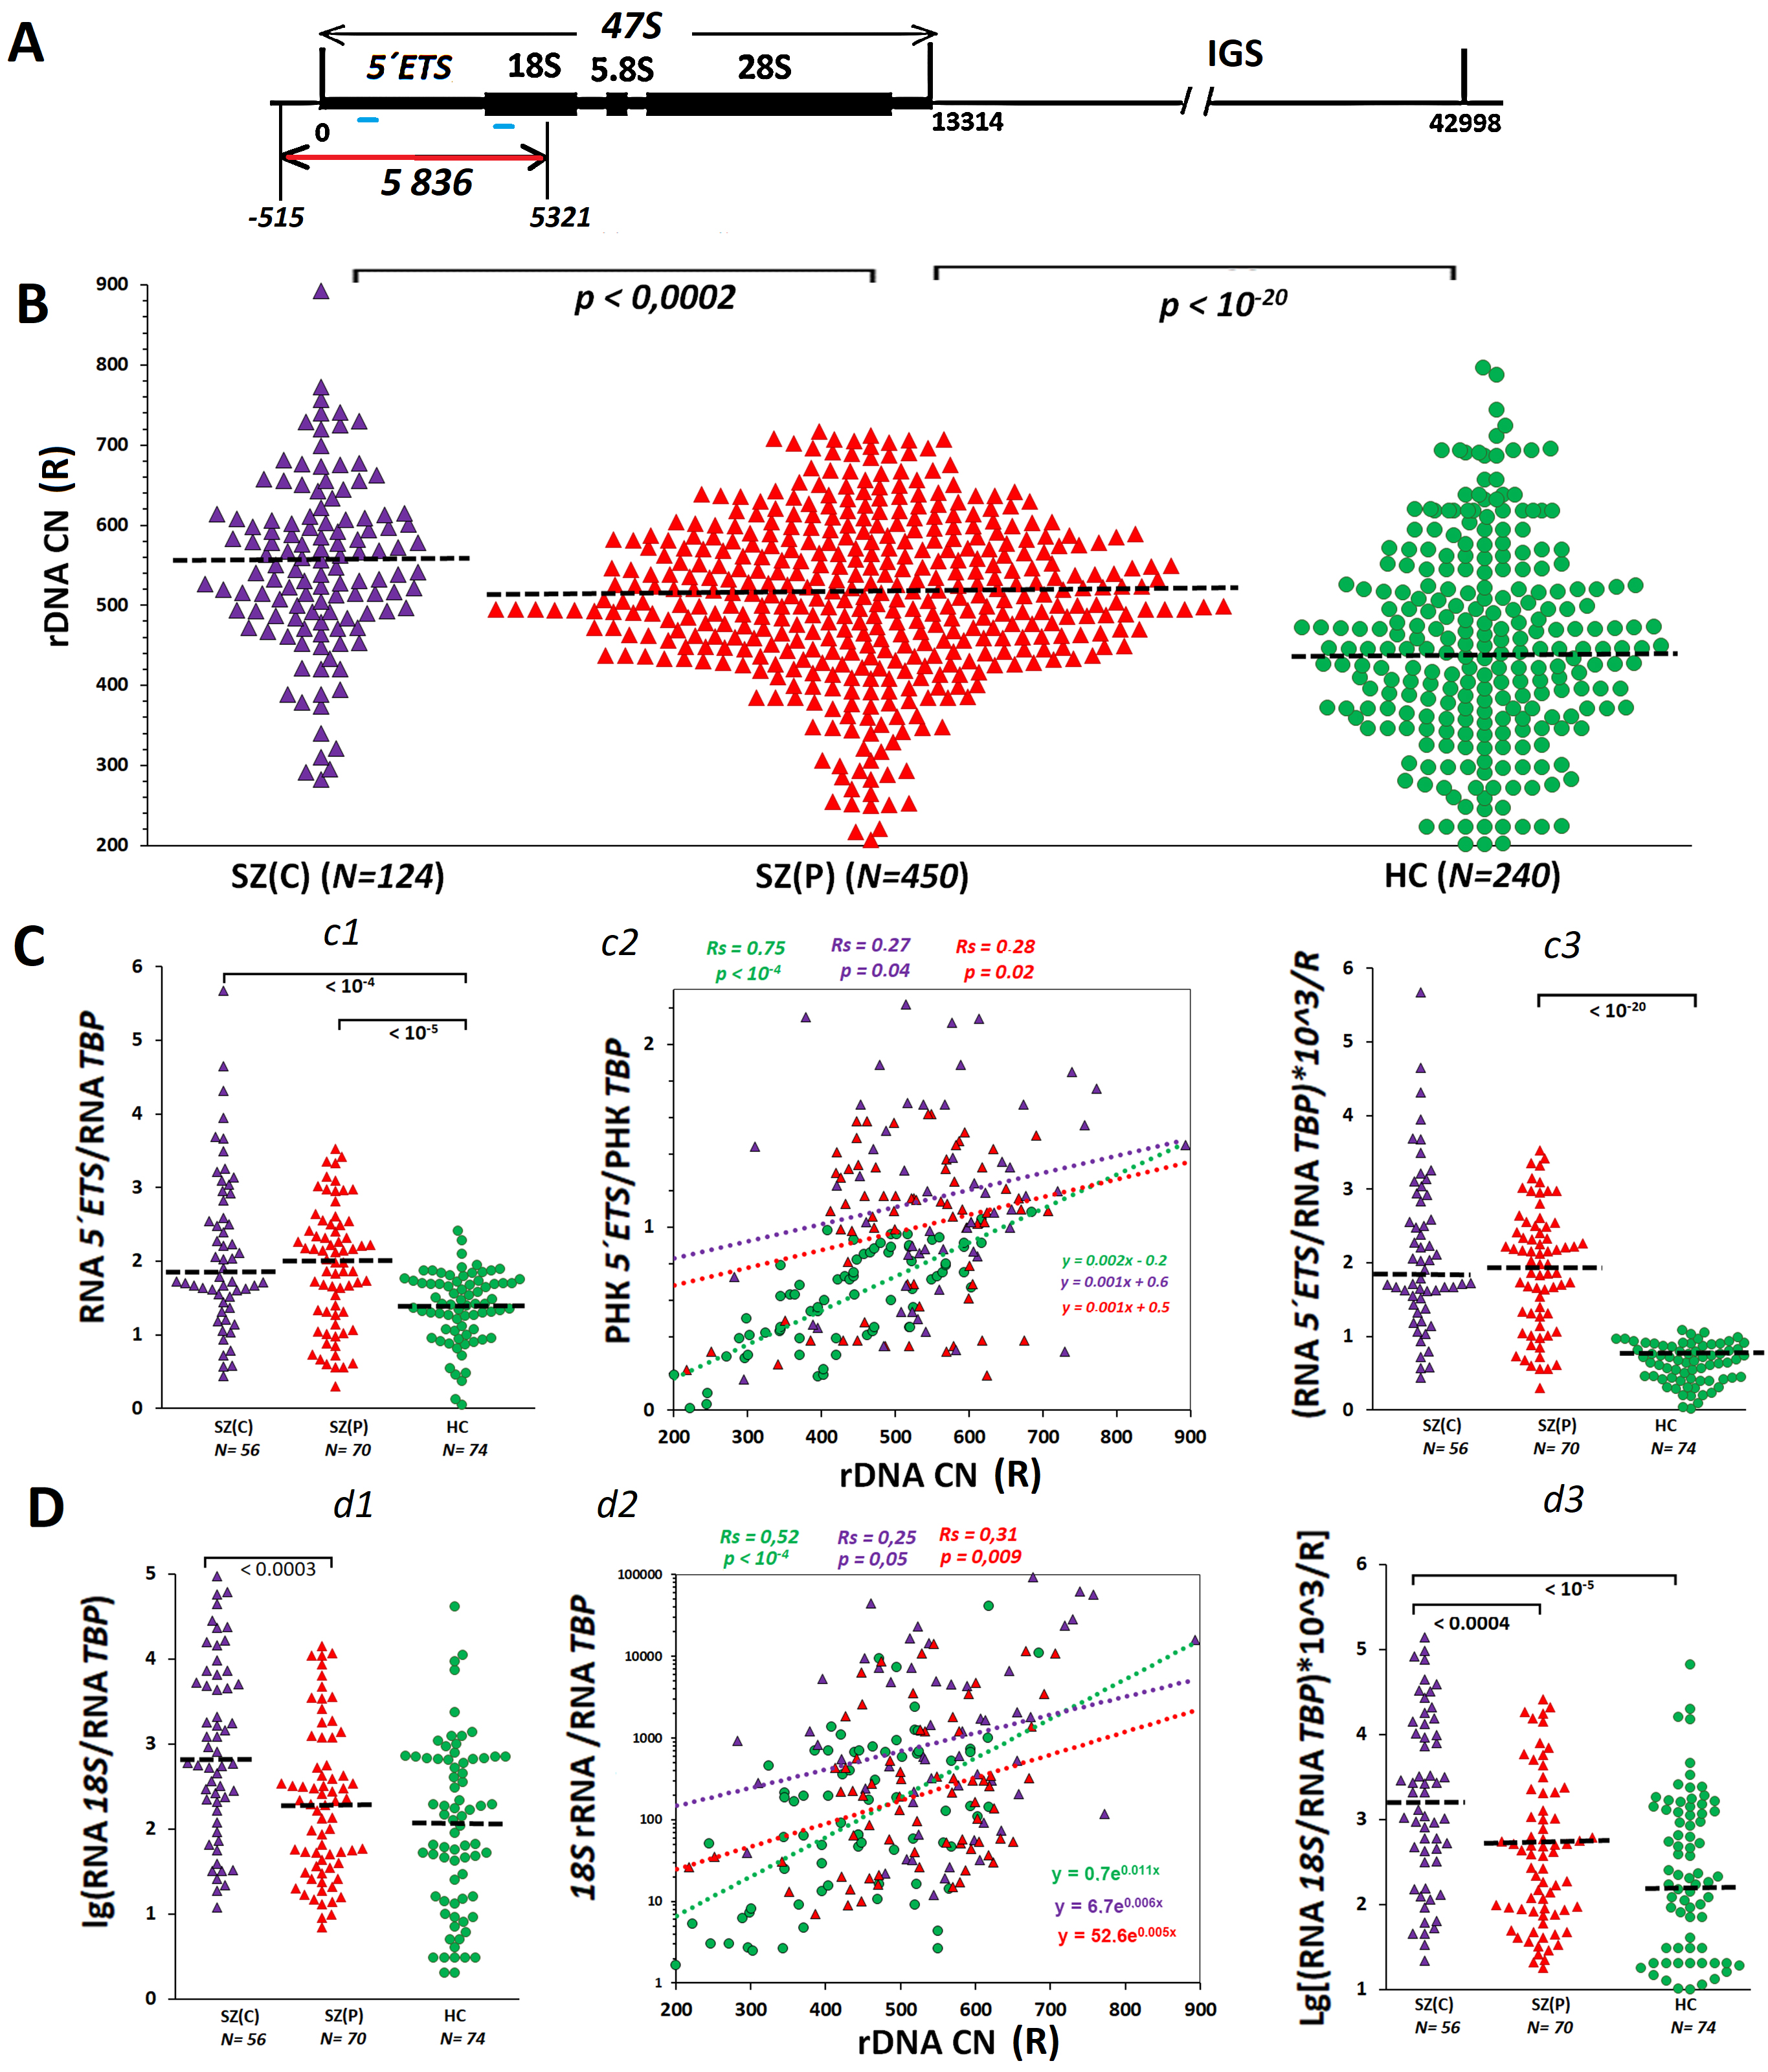 Fig. 1.
The higher ribosomal DNA copy numbers (rDNA CN) in schizophrenia patients is linked to an elevated amount of rRNA in blood cells isolated from the patients. (A) Scheme of human ribosomal repeat. The transcribed region (47S) is indicated, which contains genes for 18S, 5.8S and 28S rRNAs and transcribed spacers. The repeat region detected by the DNA probe (red line) and rRNA regions detected with PCR (blue lines) are shown. (B) The rDNA contents in blood leukocyte DNA isolated from the group of patients with catatonic manifestations SZ(C), the group of patients with paranoid form of schizophrenia SZ(P) and healthy controls (HC) group. The groups were compared using U-test. (C) 5′ ETS rRNA transcription level. c1 – content of RNA from external transcribed spacer (5′ ETS) in RNA samples of the three groups. c2 – 5′ ETS rRNA content dependence on rDNA CN. Linear regression equations and Spearman statistics (Rs and p) are presented. c3 – a parameter reflecting the rRNA content per one rDNA copy. (D) 18S rRNA content in the cells. d1 – content of 18S rRNA in RNA samples isolated from leukocytes. d2 – 18S rRNA content dependence on rDNA CN. d3 – a parameter reflecting the 18S rRNA content per one rDNA copy. SZ, Schizophrenia.
The equilibrium rRNA cellular content is determined, among other factors, by the number of transcribed copies of the ribosomal repeats [18, 19]. Hence, a high enough number of rDNA copies in the genome may be a ‘positive’ genetic trait that enables the cell of either an embryo or an adult human to compensate the impact of the negative genetic factors and to survive.
Some authors showed earlier that genomes of patients with paranoid schizophrenia carried increased rDNA copy numbers (rDNA CN), as compared to mentally healthy controls [20, 21, 22]. Transcriptomic studies have also revealed that multiple genes involved in the process of ribosome biogenesis are dramatically upregulated in schizophrenia patients [23, 24]. The rDNA CN in the blood cell genome is a stable genetic trait, which remains practically constant during the lifespan [25]. These data corroborate a hypothesis of the positive role of a large number of rDNA copies during embryogenesis to save a genome carrying some negative mutations. These mutations can later in life result, sometimes in combination with negative environmental factors, in schizophrenia onset.
The cohorts of schizophrenia patients are not homogeneous in terms of severity of oxidative stress and the disease. There are several forms or subtypes of the pathology. Among them, paranoid and catatonic are most studied. Catatonic schizophrenia is a subtype of schizophrenia characterized by the presence of a catatonic syndrome. This syndrome, besides the general symptoms of schizophrenia, includes a variety of motor disorders such as catatonic stupor, agitation, catalepsy, waxy flexibility, and some other [26, 27]. The prevalence of catatonia is 9% of mentally ill patients. Catatonia is associated with a more severe course of the disease and a higher level of stress compared to other forms of schizophrenia, including paranoid form [28, 29, 30].
The biochemical and genetic aspects of the catatonic form of schizophrenia are not adequately investigated. It remains unknown whether the more severe condition of the patients with catatonia is accompanied by higher levels of chronic oxidative stress, DNA damage, and apoptosis. The rDNA CNs in the genomes of patients with this form of schizophrenia have never been studied. We hypothesized that more severe condition of catatonia is associated with fewer copies of rDNA in the genome restricting the adaptive response to oxidative stress.
In the present study, we, firstly, conducted a comparative analysis of the level
of oxidative stress in the blood cells of chronic patients with catatonic and
paranoid schizophrenia. The level of oxidative stress was quantified by measuring
three known biomarkers. 8-oxo-2′-deoxyguanosine (8-oxodG), the main product
of DNA oxidation, is an important biomarker of in vivo oxidative DNA
damage [31, 32]. Phosphorylated on serine 139,
Secondly, an assay of proteins NADPH-oxidase 4 (NOX4), nuclear factor erythroid 2-related factor 2 (NRF2), BCL2-like protein 4 (BAX), and BCL2, which are associated to the adaptive response and apoptosis of blood cells of schizophrenia (SZ) patients to chronic stress, was performed. NOX4 [38, 39] is known to contribute to the antioxidant response via modulating NFE2L2 gene expression and affecting the activity of NRF2 in cells exposed to endo- and exogenous deleterious factors. The NRF2 transcription factor is the master regulator of the antioxidant enzyme expression [40, 41]. BAX functions as an apoptotic activator. The protein has been shown to be involved in p53-mediated apoptosis [42]. Protein BCL2, otherwise, regulates cell death inhibiting apoptosis [43].
Thirdly, we determined the number of rDNA copies and the level of transcriptional activity of the ribosomal genes in blood leukocytes of patients with catatonic and paranoid schizophrenia. It was for the first time shown that a higher level of oxidative stress in the group of patients with catatonia compared to the group of paranoid schizophrenia was associated with a large number of rDNA copies in the genomes of patients with catatonia.
The study involved patients with schizophrenia who lived in Moscow city and the Moscow region. The schizophrenia patients were hospitalized for an exacerbation to Psychiatric Clinical Hospital No. 1 named after N.A. Alekseev at Department of Health Care of the City of Moscow. Examination of the patients included psychopathological examination (original and international structured interview); psychometric tests (The positive and negative syndrome scale (PANSS), Hamilton Depression Rating Scale (HAM-D) Clinical Global Impression – Severity (CGI-S), Side-Effect Rating Scale (UKU), Yang mania scale) for a formalized assessment of mental status; registration of the socio-demographic profile; objective assessment of cognitive functions (conducted after the stabilization of the mental state using a battery of cognitive tests); registration of the psychopharmacologic profile. The catatonic signs were rated according to Bush Francis Catatonia Rating Scale (BFCRS) [16].
All the SZ patients had been taking antipsychotics for a long time before hospitalization and in the clinic. Most often (65% cases) atypical antipsychotics (risperidone, quetiapine, olanzapine, zupentixol, ziprasidone, paliperidone, aripiprazole, amisulpiride, clozapine) were prescribed. Typical antipsychotics (chlorpromazine, sulpiride, haloperidol, chlorprotixen) were used as antipsychotic relief therapy in the early days of treatment. As a result of examination, the patients with schizophrenia were divided into two groups, and a control group was also formed.
(1) A group of patients with catatonic manifestations (N = 124), SZ(C). The verified
diagnosis of schizophrenia according to the International Classification of
Diseases (ICD-10) was catatonic schizophrenia (F20.2). The age was 24 to 52 with
a mean of 38
(2) A group of patients with paranoid form of schizophrenia (N = 450), SZ(P). The
ICD-10 diagnosis was paranoid schizophrenia (F20.0). The age was 18 to 62 with a
mean of 42
Criteria for not including patients with schizophrenia in the study were: (a) concomitant mental disorders (drugs and psychoactive substance addiction); (b) organic mental disorders of any origin, dementia or mental retardation; (c) somatic and neurological diseases that may affect the diagnostics and course of the major mental disorder; (d) acute or chronic severe somatic disease that prevents examination; (e) patient’s refusal to participate in the study at any time.
(3) Control group (N = 240), HC. Group consisted from mentally healthy subjects
who lived in Moscow and the Moscow region and did not have relatives with mental
disorders. The age was 25 to 59 with a mean of 48
The techniques used in this study were described in great detail earlier (see Chestkov et al, 2018 [20]). The material for molecular genetic studies was the peripheral blood of patients taken from the cubital vein. Blood sampling was performed at Psychiatric Hospital no. 1 Named after N.A. Alexeev; DNA was isolated from the lysed leukocyte mass after treatment with RNase A and proteinase K using extraction with organic solvents (phenol, phenol/chloroform) and DNA precipitation with 70% ethanol. The DNA concentration in the solution was measured in two steps: (1) spectrophotometrically, using Shimadzu UV-160A (Shimadzu Corporation, Kyoto, Japan) at a wave length of 260 nm taking into account light scattering (320 nm); (2) more precise concentration measurement was performed using fluorescence analysis and Quant-iT PicoGreen dsDNA Assay Kit (P7589, Invitrogen, Carlsbad, CA, USA). A DNA probe containing an EcoRI fragment of the transcribed region of ribosomal repeats was used to assay the ribosomal repeat with dot hybridization (5836 basepairs, positions from –515 to 5321 bp; GenBank $U13369), cloned within pBR322 plasmid (D4904 Sigma-Aldrich, Saint Louis, MO, USA) (Fig. 1A). During each hybridization test, three samples of each DNA specimen were put onto a filter simultaneously. Each test was repeated twice. In order to quantify the repeat content by hybridization image, our in-house software ‘Image 6.0’ was used (Research Centre for Medical Genetics).
We used flow cytometry to analyze mononuclear cell samples isolated from
patients’ blood. The cells were validated for their identity by surface marker
analysis using flow cytometry and tested negative for mycoplasma. Lymphocytes
were isolated by the standard technique of centrifugation in a density gradient
in the ficol-verografin system (17-1440-03, Paneco, Moscow, Russia). RNA
isolation was performed with RNeasy Plus Mini Kit (74134, QIAGEN, Germantown, MD,
USA). RNA concentration was determined using dye Quant-iT RiboGreen RNA Reagent
(R11491, Invitrogen, Carlsbad, CA, USA) at
Lymphocytes were isolated by the standard technique of centrifugation in a
density gradient in the ficol-verografin system. Cells were fixed with 3.7%
formaldehyde for 10 min at 37 °C, washed and permeabilized in 90%
methanol at –20 °C overnight. Before antibody treatment, the cells were
precipitated, washed twice with phosphate buffered saline (PBS) (P060E, Paneco,
Moscow, Russia) with 1% BSA (2244, neoFroxx GmbH, Einhausen, Germany),
resuspended in PBS, and incubated overnight at +4 °C with the specific
antibodies in working concentration of 1 µg/mL. The following commercial
antibodies were applied: PE-8OHdG (sc-393871 PE, Santa Cruz, Dallas, TX, USA),
CY5.5-NOX4 (bs-1091r-cy5-5, Bioss Inc., Woburn, MA, USA); FITC-NRF2 pSer40
(bs2013, Bioss Inc.); PE-8OHdG (sc-393871 PE, Santa Cruz, Dallas, TX, USA);
DyLight488-
All the reported results were reproduced at least three times as the independent
biological data. The significance of the observed differences was analyzed using
the non-parametric Mann–Whitney U test, Kruskal-Wallis H-test and Student’s
t-test. Data were analyzed with StatPlus2007 professional software
(http://www.analystsoft.com). All p-values were two-sided and considered
statistically significant at p
Blood samples of 574 long term hospitalized patients with chronic schizophrenia were the objects of the study. The most severe patients with catatonia formed the group SZ(C) (N = 124). The group SZ(P) included 450 patients with paranoid schizophrenia. The groups did not differ by treatment applied for the relief of psychoses. The control group included 240 age- and sex-matched subjects.
DNA was isolated from blood leukocytes of each subject (totally, 814 subjects). The contents of ribosomal repeats and telomere repeats were determined in the DNA samples using non-radioactive quantitative hybridization with biotinated DNA probes [20]. The 5′ ETS rRNA and 18S rRNA were quantified using RT-qPCR for RNA samples isolated from leukocytes of 200 subjects from the same groups: SZ(C) (N = 56), SZ(P) (N = 70) and HC (N = 74). The content of markers reflecting the stress level in the body was quantified using flow cytometry in peripheral blood mononuclear cells (PBMCs) isolated from 255 subjects of the following groups: SZ(C) (N = 50), SZ(P) (N = 145) and HC (N = 60).
Transcription of ribosomal genes in the nucleolus is the primary and very important step of the process of ribosome biogenesis. The amount of 47S rRNA transcript (Fig. 1A) depends on the number of transcribed rDNA copies. In turn, the number of transcribed rDNA copies might depend on the total number of rDNA copies in the cell.
Fig. 1B shows experimental data reflecting the rDNA contents in blood leukocytes
of the two groups of patients with SZ and the HC group. Table 1 presents the
descriptive statistics. The three groups were significantly different by rDNA
copy numbers in the genome (Kruskal-Wallis H-test: H = 111, p
| Index | Group | N (number of patients) | Mean | SD | Range | Median | Сv | ||
| rDNA CN | HC | 240 | 432 | 1 | 107 | 201–690 | 437 | 1 | 0.25 |
| SZ(C) | 124 | 549 | 1.27 | 106 | 282–893 | 546 | 1.25 | 0.19 | |
| SZ(P) | 450 | 510 | 1.18 | 97 | 207–717 | 511 | 1.17 | 0.19 | |
| TR pg/µg DNA | HC | 240 | 350 | 1 | 63 | 200–570 | 352 | 1 | 0.18 |
| SZ(C) | 124 | 243 | 0.69 | 31 | 177–336 | 252 | 0.72 | 0.13 | |
| SZ(P) | 450 | 232 | 0.67 | 30 | 141–380 | 235 | 0.67 | 0.13 | |
| rRNA 5′ETS/RNATBP | HC | 74 | 1.37 | 1 | 0.47 | 0.04–2.4 | 1.41 | 1 | 0.35 |
| SZ(C) | 56 | 2.15 | 1.57 | 1.08 | 0.44–5.67 | 1.85 | 1.31 | 0.50 | |
| SZ(P) | 70 | 1.93 | 1.41 | 0.81 | 0.3–3.53 | 2.01 | 1.42 | 0.42 | |
| 18S rRNA/RNATBP | HC | 74 | 1205 | 1 | 4962 | 2–40,342 | 117 | 1 | 4.11 |
| SZ(C) | 56 | 8111 | 6.73 | 17,741 | 12–94,245 | 711 | 6.07 | 2.19 | |
| SZ(P) | 70 | 1392 | 1.15 | 3053 | 7–14,238 | 196 | 1.67 | 2.19 | |
TR, telomere repeat; Cv, coefficient of variation; rDNA CN, ribosomal DNA copy numbers; TR, telomere repeat; 5′ ETS, 5′ external transcribed spacer; HC, healthy controls; SD, Standard Deviation; SZ, schizophrenia; ETS/RNATBP, ratio of RNA ETS to RNA of the standard gene TBP.
The rDNA transcription rate was estimated via quantification of 5′ETS rRNA (external transcribed spacer) in RNA specimens isolated from blood leukocytes. The amount of 5′ETS rRNA is an indicator of the real transcription of the ribosomal arrays at a time. The full-size 47S pre-rRNA transcript is processed into mature rRNAs (18S, 5.8S, 28S), while the rest 47S RNA fragments rapidly degrade and do not accrue within RNA with time.
Fig. 1C and Table 1 present the data showing the 5′ETS rRNA
amounts in RNA specimens, as obtained using RT-PCR. The two groups of SZ patients
were not distinct by the amounts of 5′ETS transcripts (Fig. 1C,c1), whereas they were significantly different from HC group by
higher values of this parameter (p
The most significant correlation between the amount of the transcript and the
rDNA CN was found in HC group leukocytes (Spearman’s correlation coefficient Rs =
0.75, p
It can be assumed that the process of ribosome biogenesis at the stage of mature rRNA synthesis and degradation of internal transcribed rRNA spacers is accelerated in SZ(C) lymphocytes. If so, higher levels of mature rRNA should be expected in SZ(C) group. Indeed, we found a higher level of 18S rRNA in SZ(C) group compared to SZ(P) group (Fig. 1D,d1,d3). The strongest correlation between the parameter’s rDNA CN and 18S rRNA amount, as in the case of RNA 5′ETS, was observed in control cells (Fig. 1D,d2).
The telomere repeat content was represented as the number of picograms of the
repeat per one microgram of DNA (parameter T). One pg of repeat/µg of DNA
corresponds to an average telomere length of 17 bp. Fig. 2A and Table 1 show
experimental data and descriptive statistics reflecting the repeat content in DNA
isolated from the blood leukocytes of the three groups studied. Schizophrenia
patients contained significantly less telomere repeats in their leukocyte DNA
than age-matched healthy controls (p
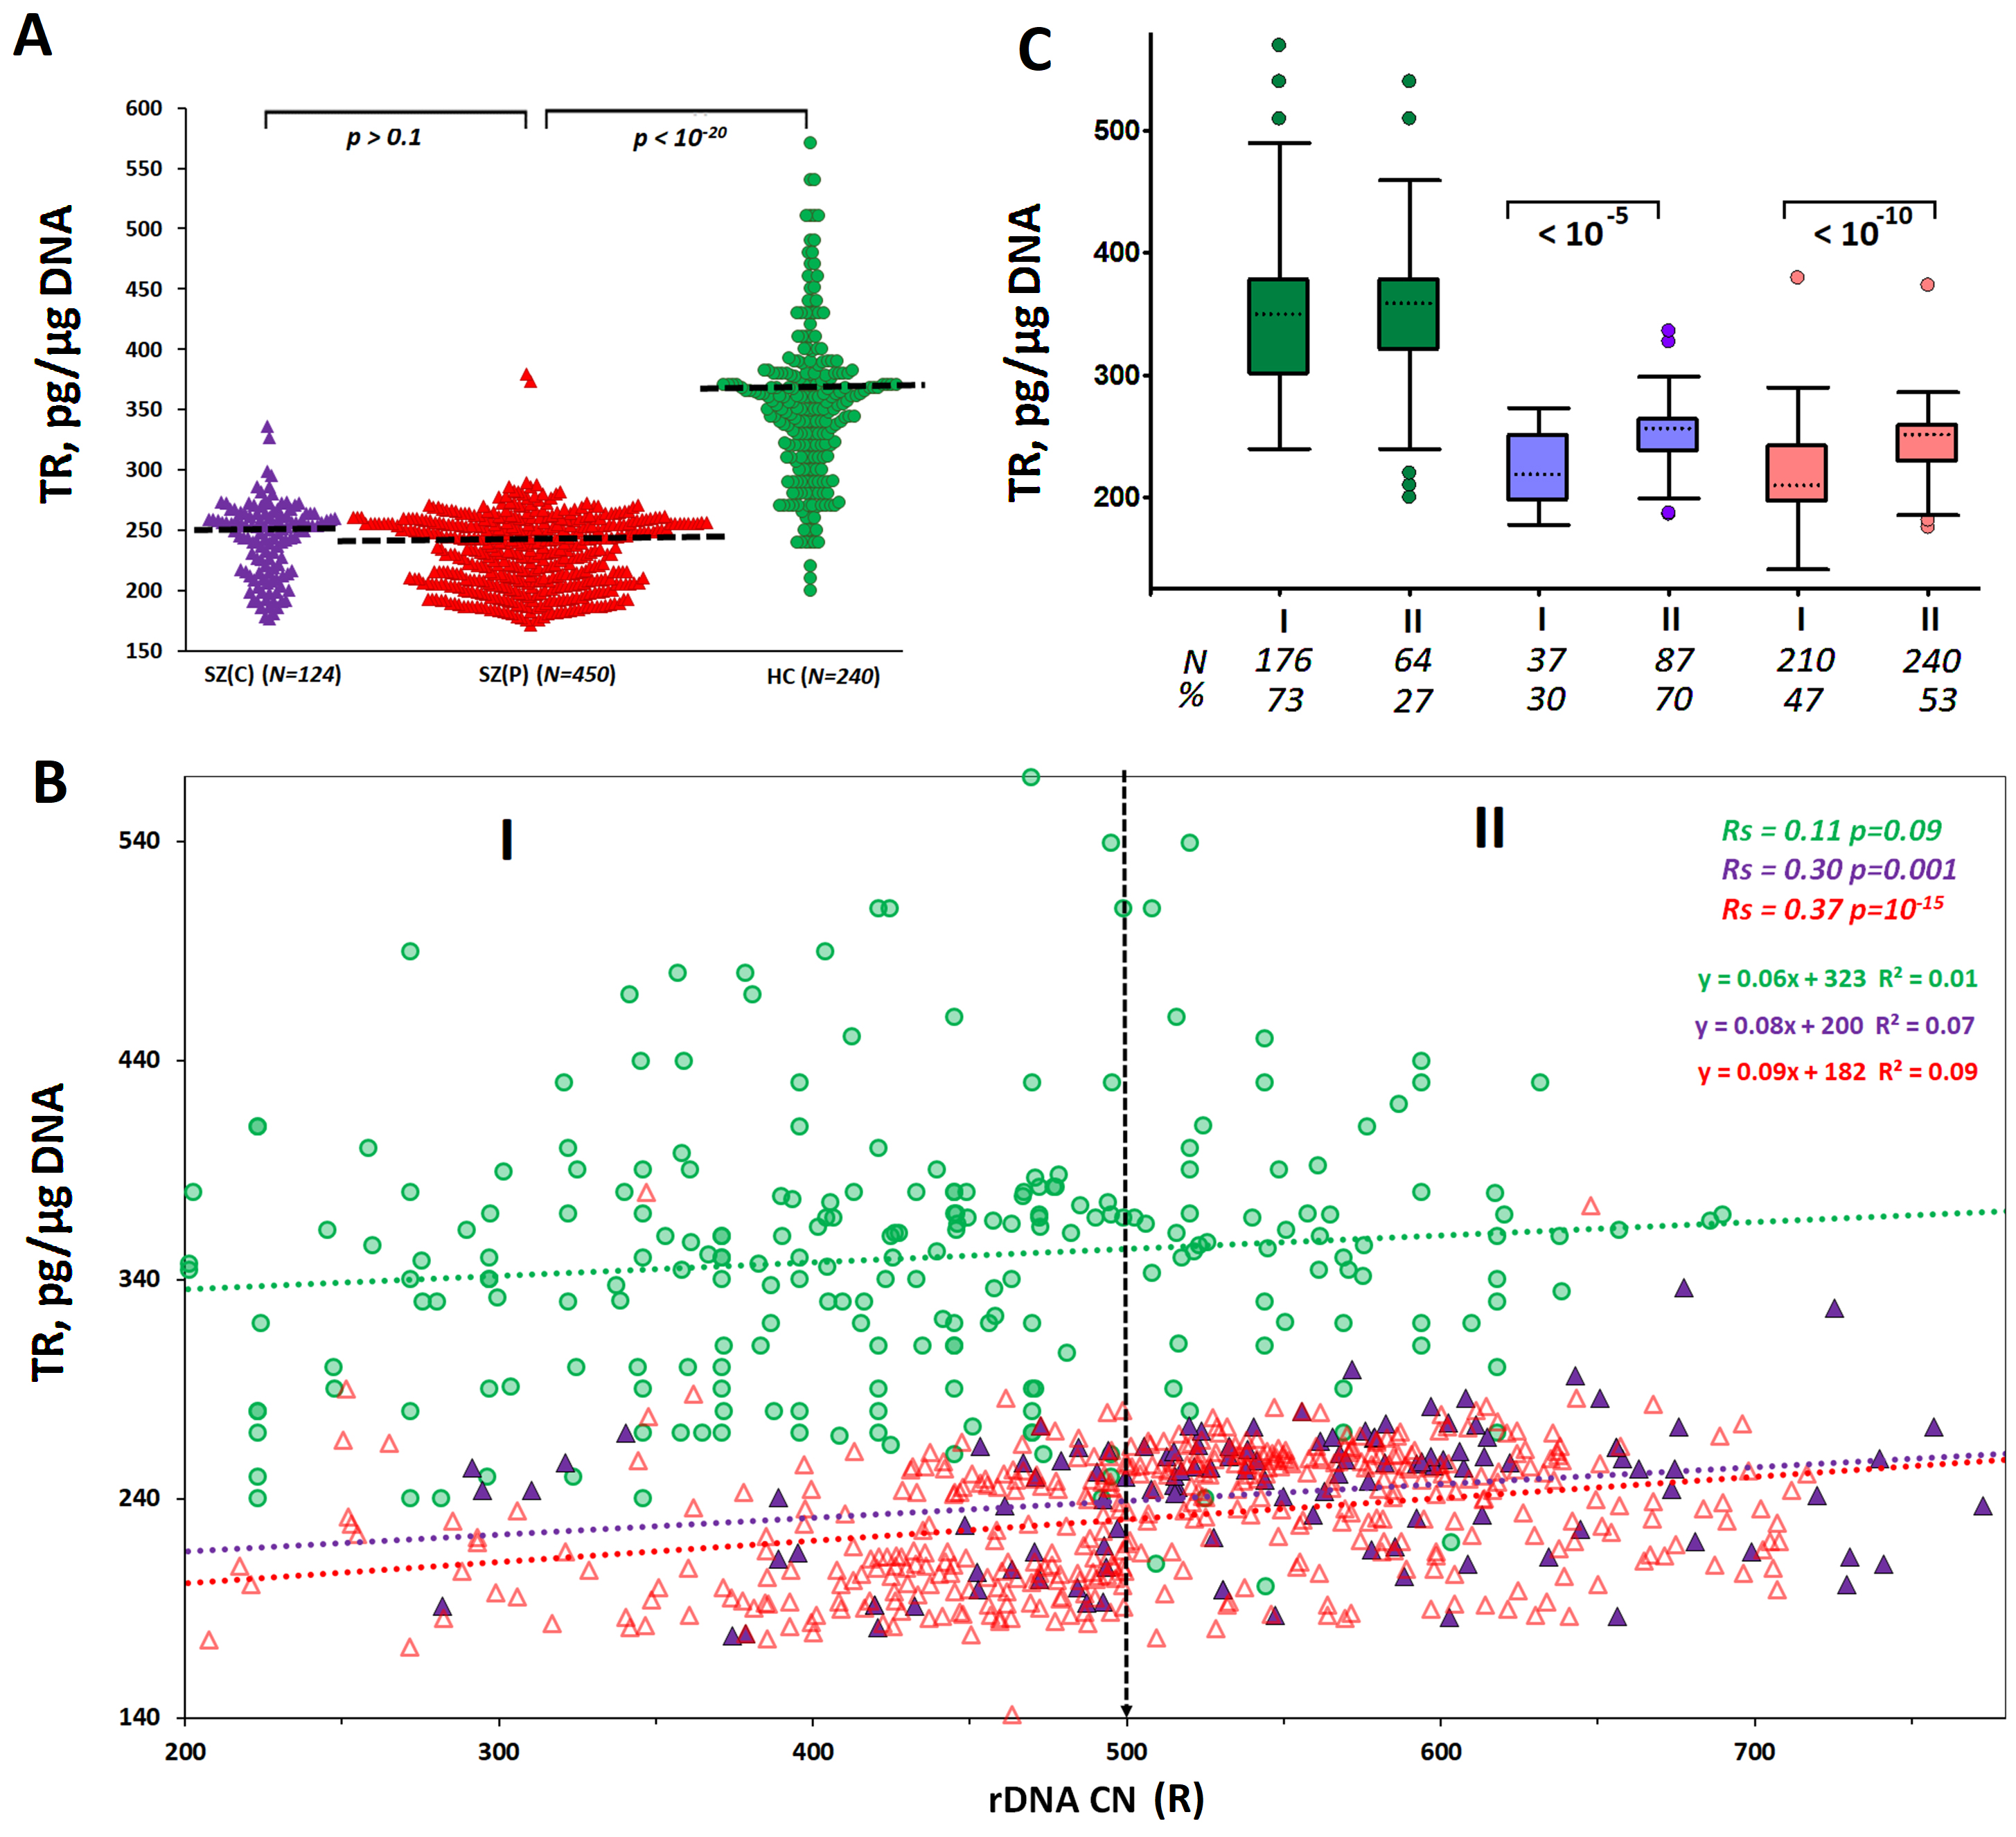 Fig. 2.
A dependence of telomere repeat content (mean telomere length)
on rDNA CN in leukocytes of SZ(C), SZ(P) and HC groups. (A) Telomere repeat (TR)
content in blood leukocyte DNA derived from the three groups studied. The groups
were compared using U-test. (B) The TR content dependence on rDNA CN. Linear
regression equations and Spearman statistics (Rs and p) are represented.
(C) TR contents in subgroups I (rDNA CN
In the control group, the telomere repeat (TR) content in the cellular DNA did not depend on the rDNA CN. In the two groups of SZ patients, a positive correlation was found between the contents of the two repeats (Fig. 2B). Genomes of patients with high values of rDNA CN (more than 500 copies) contained greater amounts of the telomere repeat than genomes with lower contents of the ribosomal repeat (Fig. 2C).
The positive correlation between TR content and rDNA CN in DNA of blood
leukocytes from SZ patients suggests lower intensity of chronic stress in
subjects with higher rDNA abundance in the genome. To verify this suggestion, we
analyzed DNA damage in blood lymphocytes using flow cytometry analysis (FCA)
technique (Fig. 3) based on two standard DNA damage markers that reflect the DNA
oxidation (8-oxodG) and the double-strand DNA breaks (
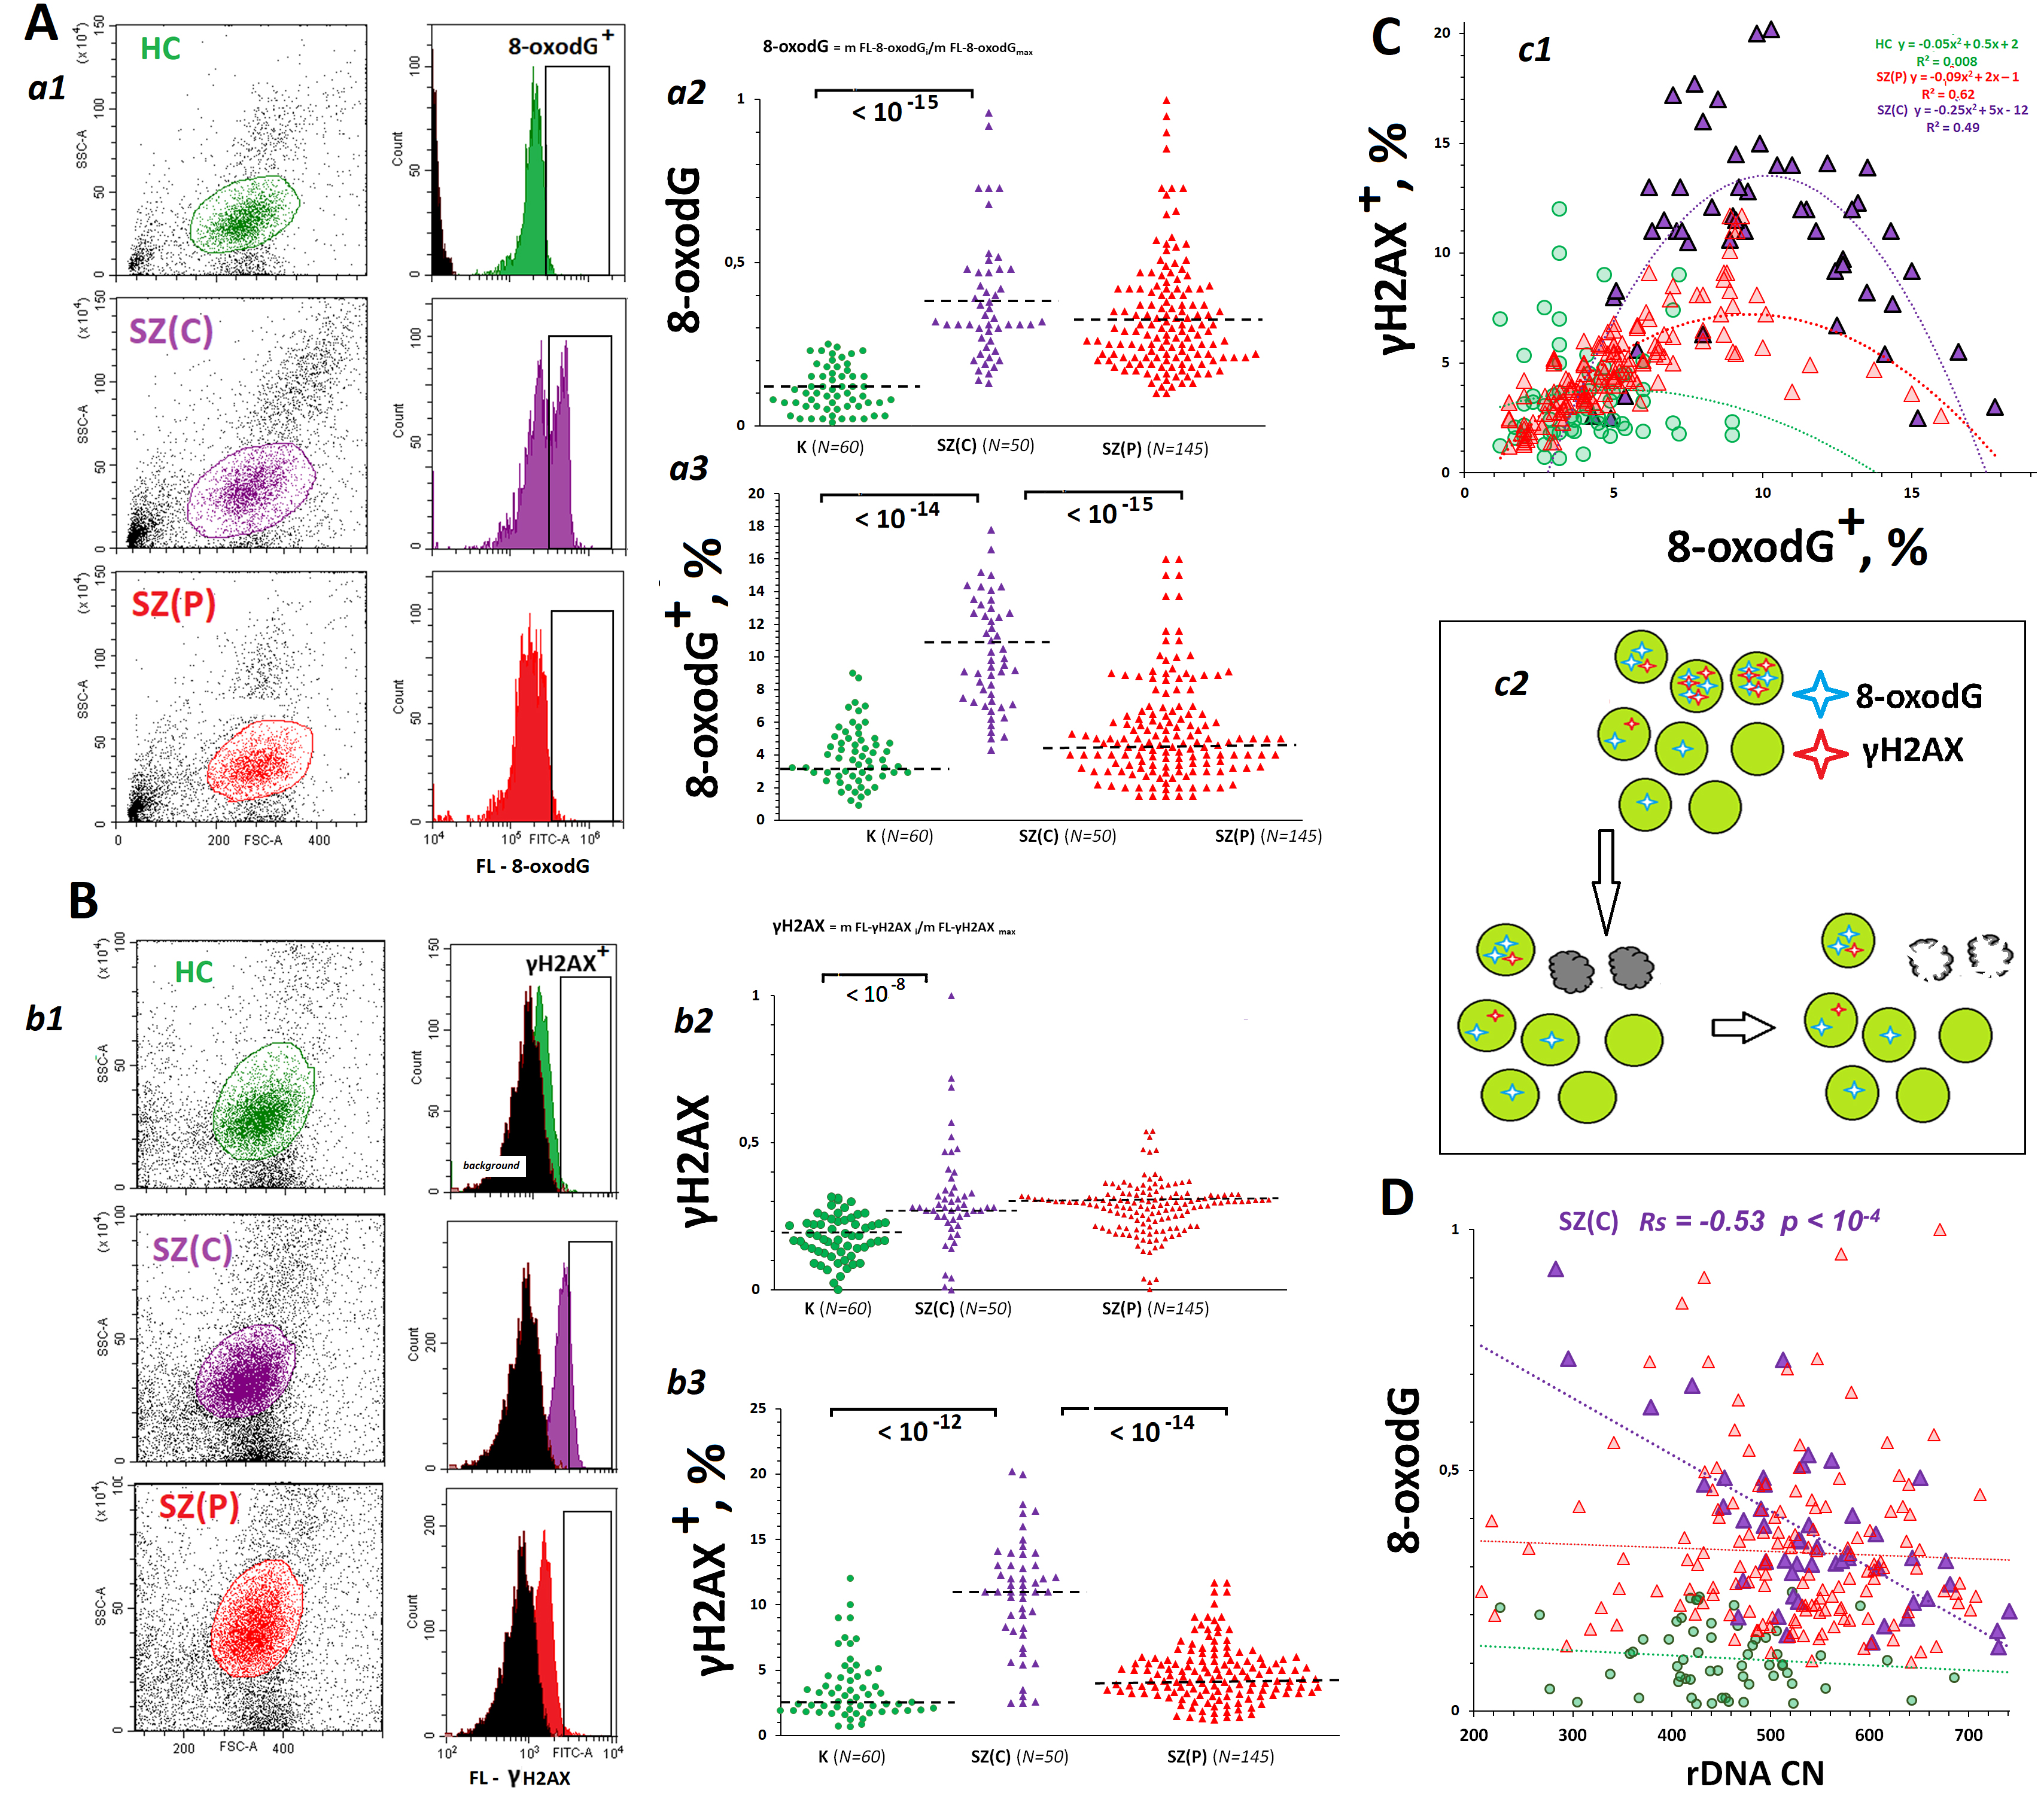 Fig. 3.
DNA damage degrees in lymphocytes from SZ(C), SZ(P) and HC
groups. (A) 8-oxo-2′-deoxyguanosine (8-oxodG) levels in the subpopulation that includes lymphocytes
(PBL) from SZ(C), SZ(P) and HC groups. a1 – The most typical examples of 8-oxodG
assay in PBL. a2 – The mean level of 8-oxodG was estimated by the
fluorescent-signal median value. The median values were normalized to the maximum
signal median values in the total sample analyzed (N = 255). a3 – 8-oxodG+
levels in PBL populations from SZ and HC groups. (B)
The population of peripheral blood mononuclear cells (PMBCs) isolated from the blood contains several subpopulations (Fig. 3A,a1 and Fig. 3B,b1, plots FCS—SSC). We analyzed the CD23+ subpopulation that includes lymphocytes (PBL).
A population of PBLs from patients consisted of, as a rule, two types of cells—with a very high content of oxidation marker 8-oxodG (fraction 8-oxodG+) and with a medium or low content of the marker (Fig. 3A,a1). The mean DNA oxidation was assessed by medians of fluorescent signal from all cells (Fig. 3A,a2). For simplicity of illustration, median values of the signal were normalized to the maximum value of the index in the sample (N = 255 PBL specimens). The index 8-oxodG was highest in SZ cases and far exceeded the corresponding index in the control group. The groups SZ(C) and SZ(P) did not differ by 8-oxodG values (Fig. 3A,a2). At the same time, SZ(C) group contained considerably more cells 8-oxodG+ with high oxidation level (Fig. 3A,a3).
A similar result was obtained when assaying the marker of double-strand breaks
(Fig. 3B). The mean values of the parameter
Fig. 3C, c1 shows the dependence of the amount of
For SZ(C) group, a pronounced negative correlation was observed between DNA oxidation marker 8-oxodG and rDNA CN (Fig. 3D). The fewer copies of rDNA contained in the leukocytes of a patient with catatonia, the higher level of DNA oxidation was observed in the lymphocytes isolated from the patient. In SZ(P) group and the control group, the negative correlation was statistically insignificant.
Oxidative stress in SZ patients induces an adaptive response aimed at reducing the DNA damage. The enzyme NOX4 catalyzes the hydrogen peroxide synthesis reaction. NOX4 plays an important role in the development of the adaptive response in SZ. Hydrogen peroxide and hydrogen peroxide-associated reactive oxygen species (ROS) induce the activity of genes involved in the adaptive response to stress [47]. NOX4 level was considerably increased in lymphocytes of SZ patients of both clinical groups (Fig. 4A,a2) compared to controls. Patient-derived lymphocytes populations contained a fraction of cells with greatly elevated NOX4 protein (NOX4+) (Fig. 4A,a1,a3). The size of this fraction was increased in patient-derived cells compared to controls. The fraction NOX4+ in SZ(P) lymphocytes was higher than in SZ(C) group. In SZ(C) group, a negative correlation between NOX4 level and rDNA CN (Rs = –0.40, p = 0.004) was observed (Fig. 4A,a4). The increased rDNA abundance in leukocytes of catatonic patients was associated with low NOX4 protein expression level. In SZ(P) group, the negative correlation was insignificant (Rs = –0.14, p = 0.1). In HC group, rDNA CN was not linked to NOX4 protein expression level.
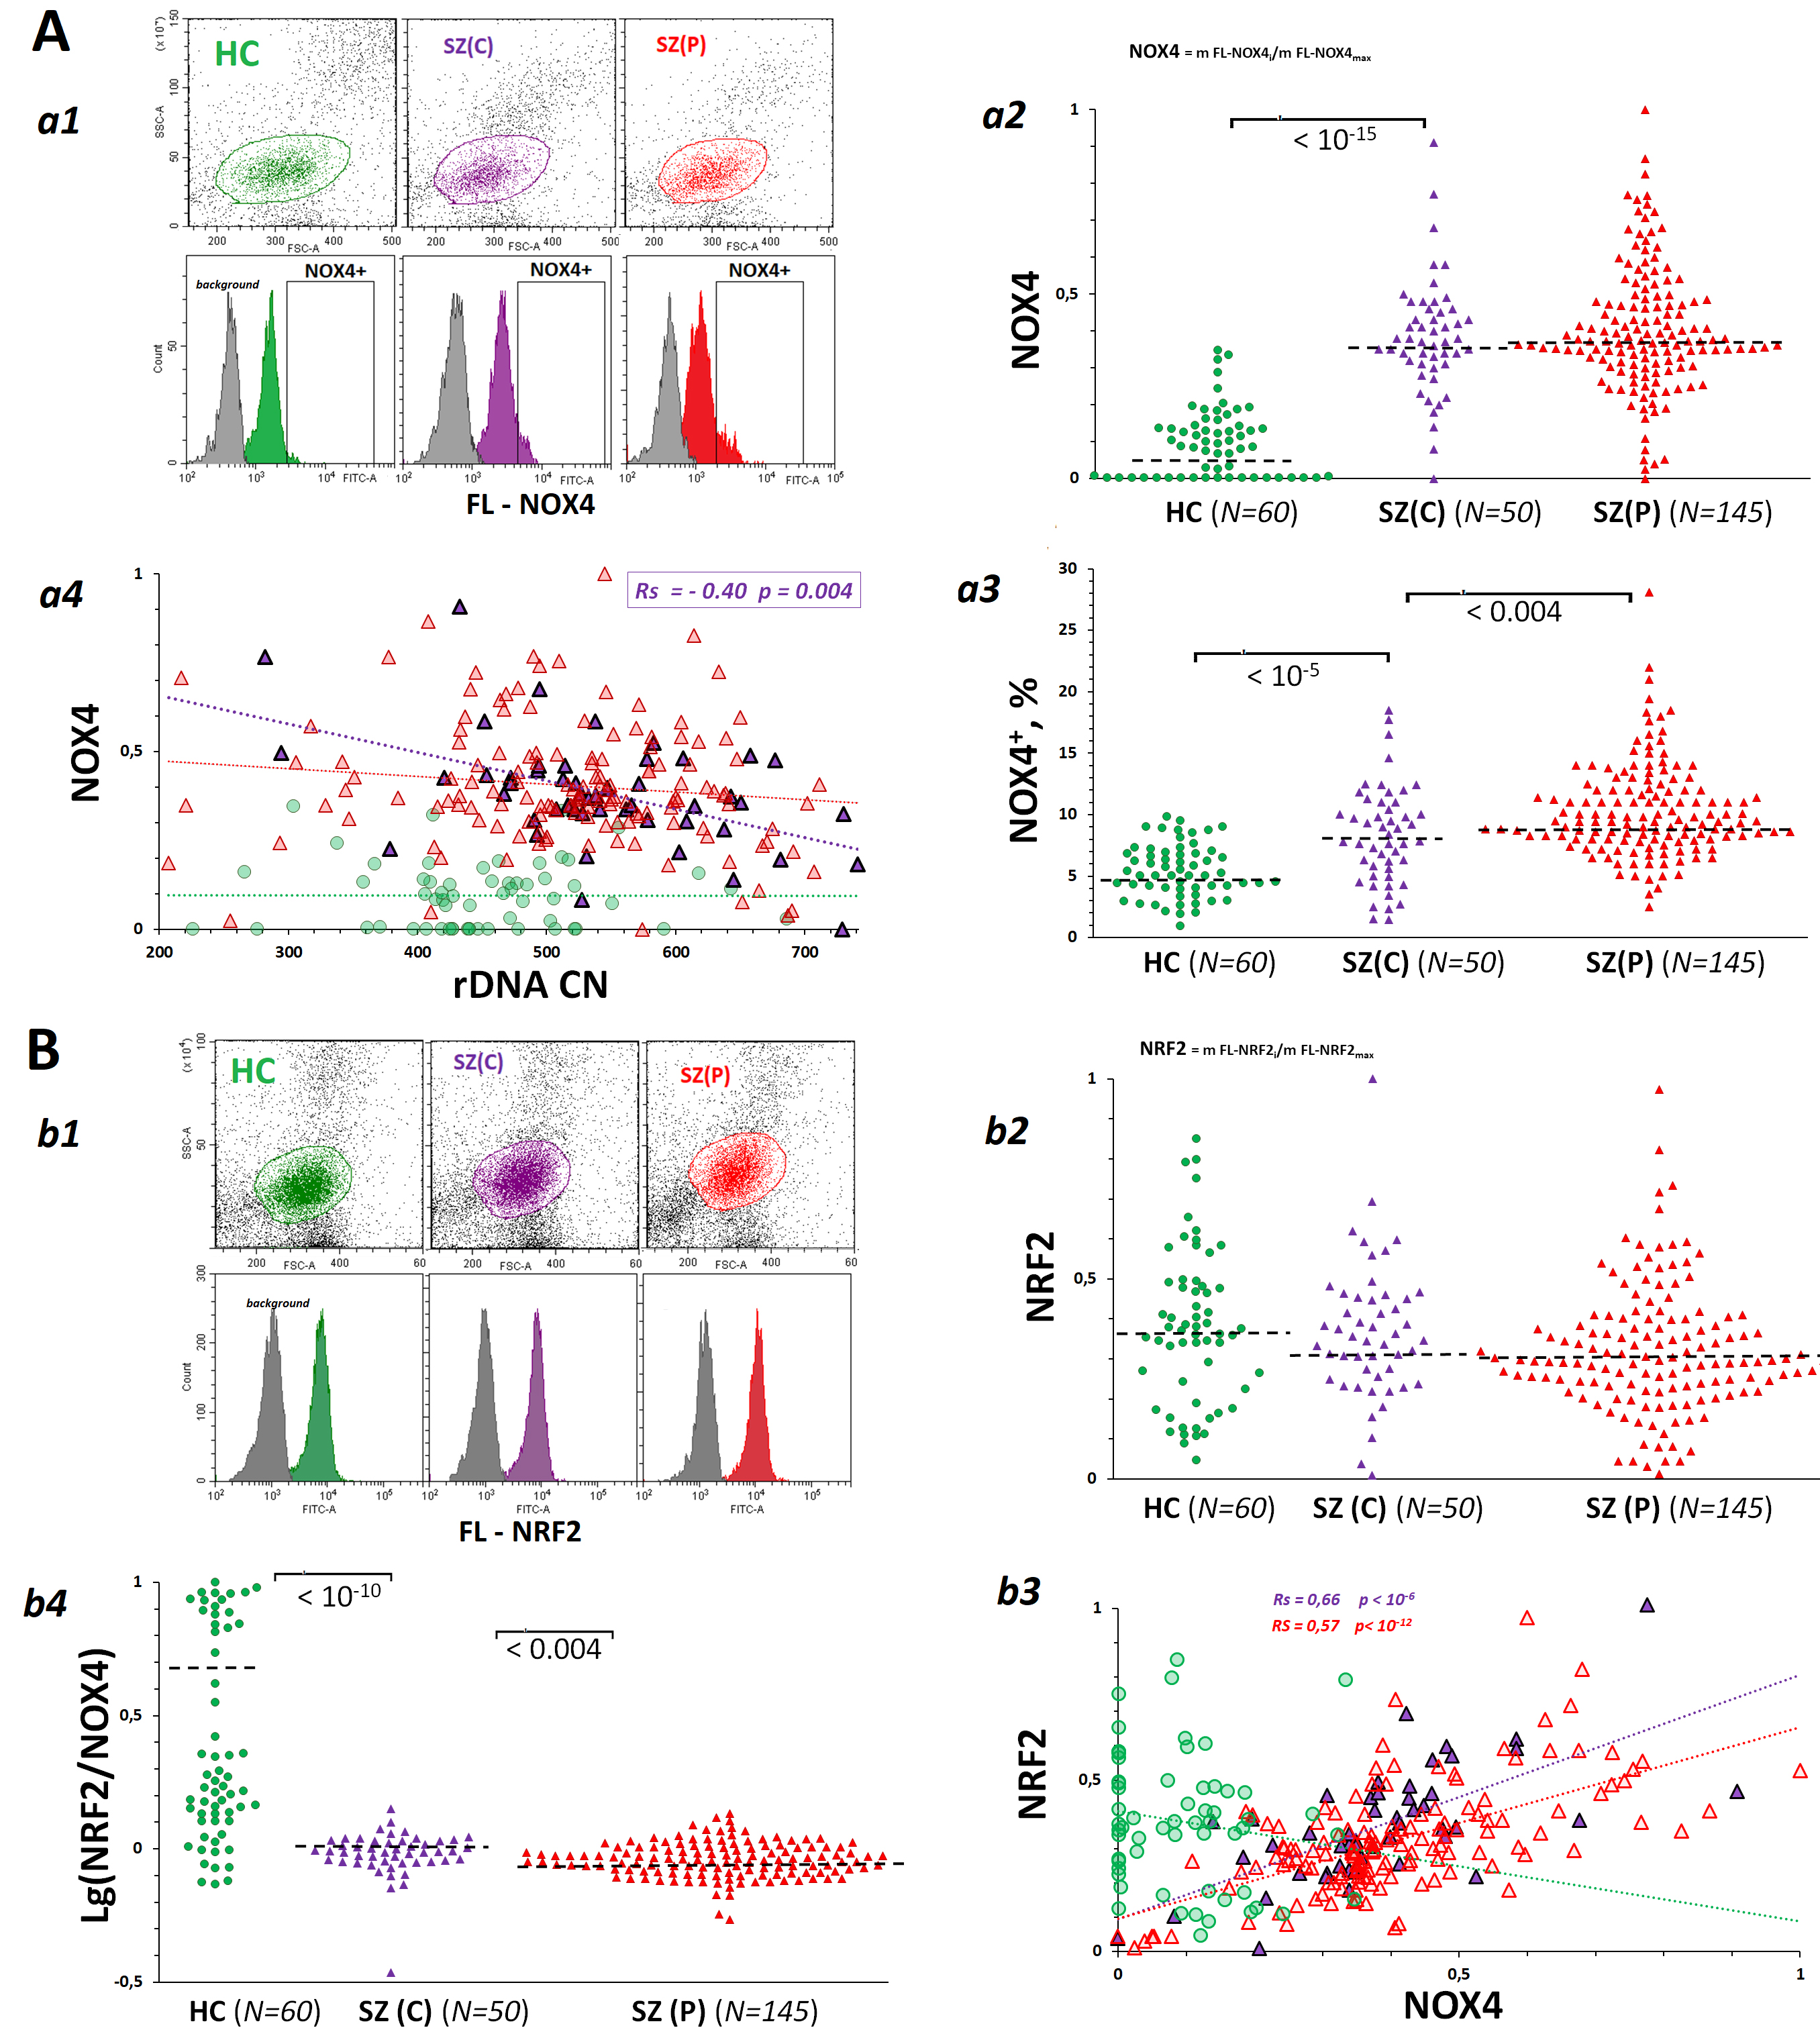 Fig. 4.
Dependence of the levels of pro-oxidative enzyme NADPH-oxidase 4 (NOX4) and antioxidant factor nuclear factor erythroid 2-related factor 2 (NRF2) in lymphocytes derived from SZ(C), SZ(P) and HC groups on the rDNA CN. (A) NOX4 levels in PBL isolated from SZ(C), SZ(P) and HC groups. a1 – The most typical examples of NOX4 assay in PBL. a2 – The mean level of NOX4 was estimated by the fluorescent-signal median value. The median values were normalized to the maximum signal median values in the total sample analyzed (N = 255). a3 – NOX4+ levels in PBL populations from SZ and HC groups. a4 – Dependence of NOX4 on rDNA CN. (B) NRF2 levels in PBL from SZ(C), SZ(P) and HC groups. b1 – The most typical examples of NRF2 assay in PBL. b2 – The mean level of NRF2 was estimated by the fluorescent-signal median value. b3 – Dependence of NRF2 on NOX4. b4 – Dependence of NRF2 on rDNA CN.
An increase in ROS, in particular, hydrogen peroxide-associated ROS, provokes an antioxidant response mediated by transcription factor NRF2. NOX4 gene activity is known to activate transcription of gene for NRF2 [41] during the development of the adaptive response to stress. The counter-action of the two genes is in balance. An excessive antioxidant response can result in a decrease in ROS, which are necessary for the cell’s key signaling pathways to respond to stress. Analysis of lymphocyte populations showed that the NRF2 protein content was described by a narrow distribution, while there was no fraction of cells with abnormally high protein levels, as was the case for NOX4 (Fig. 4B,b1). NRF2 levels in SZ and HC cells did not differ significantly (Fig. 4B,b2).
In the clinical groups, a positive correlation between NOX4 and NRF2 contents was found (Fig. 4B,b3). In HC group, the level of NRF2 was not linked to the level of NOX4. The groups of patients differed from controls by significantly lower NRF2/NOX4 ratio (Fig. 4B,b4).
The size of the fraction was significantly greater in the populations of lymphocytes derived from patients with catatonia (Fig. 5A,a1–a3). The cells from SZ(C) patients contained more pro-apoptotic protein BAX, than cells from SZ(P) patients and HC controls (Fig. 5A,a2). SZ(P) and HC groups were not different by the content of this protein. A negative correlation between BAX level and rDNA CN was found in SZ(C) group (Fig. 5A,a4).
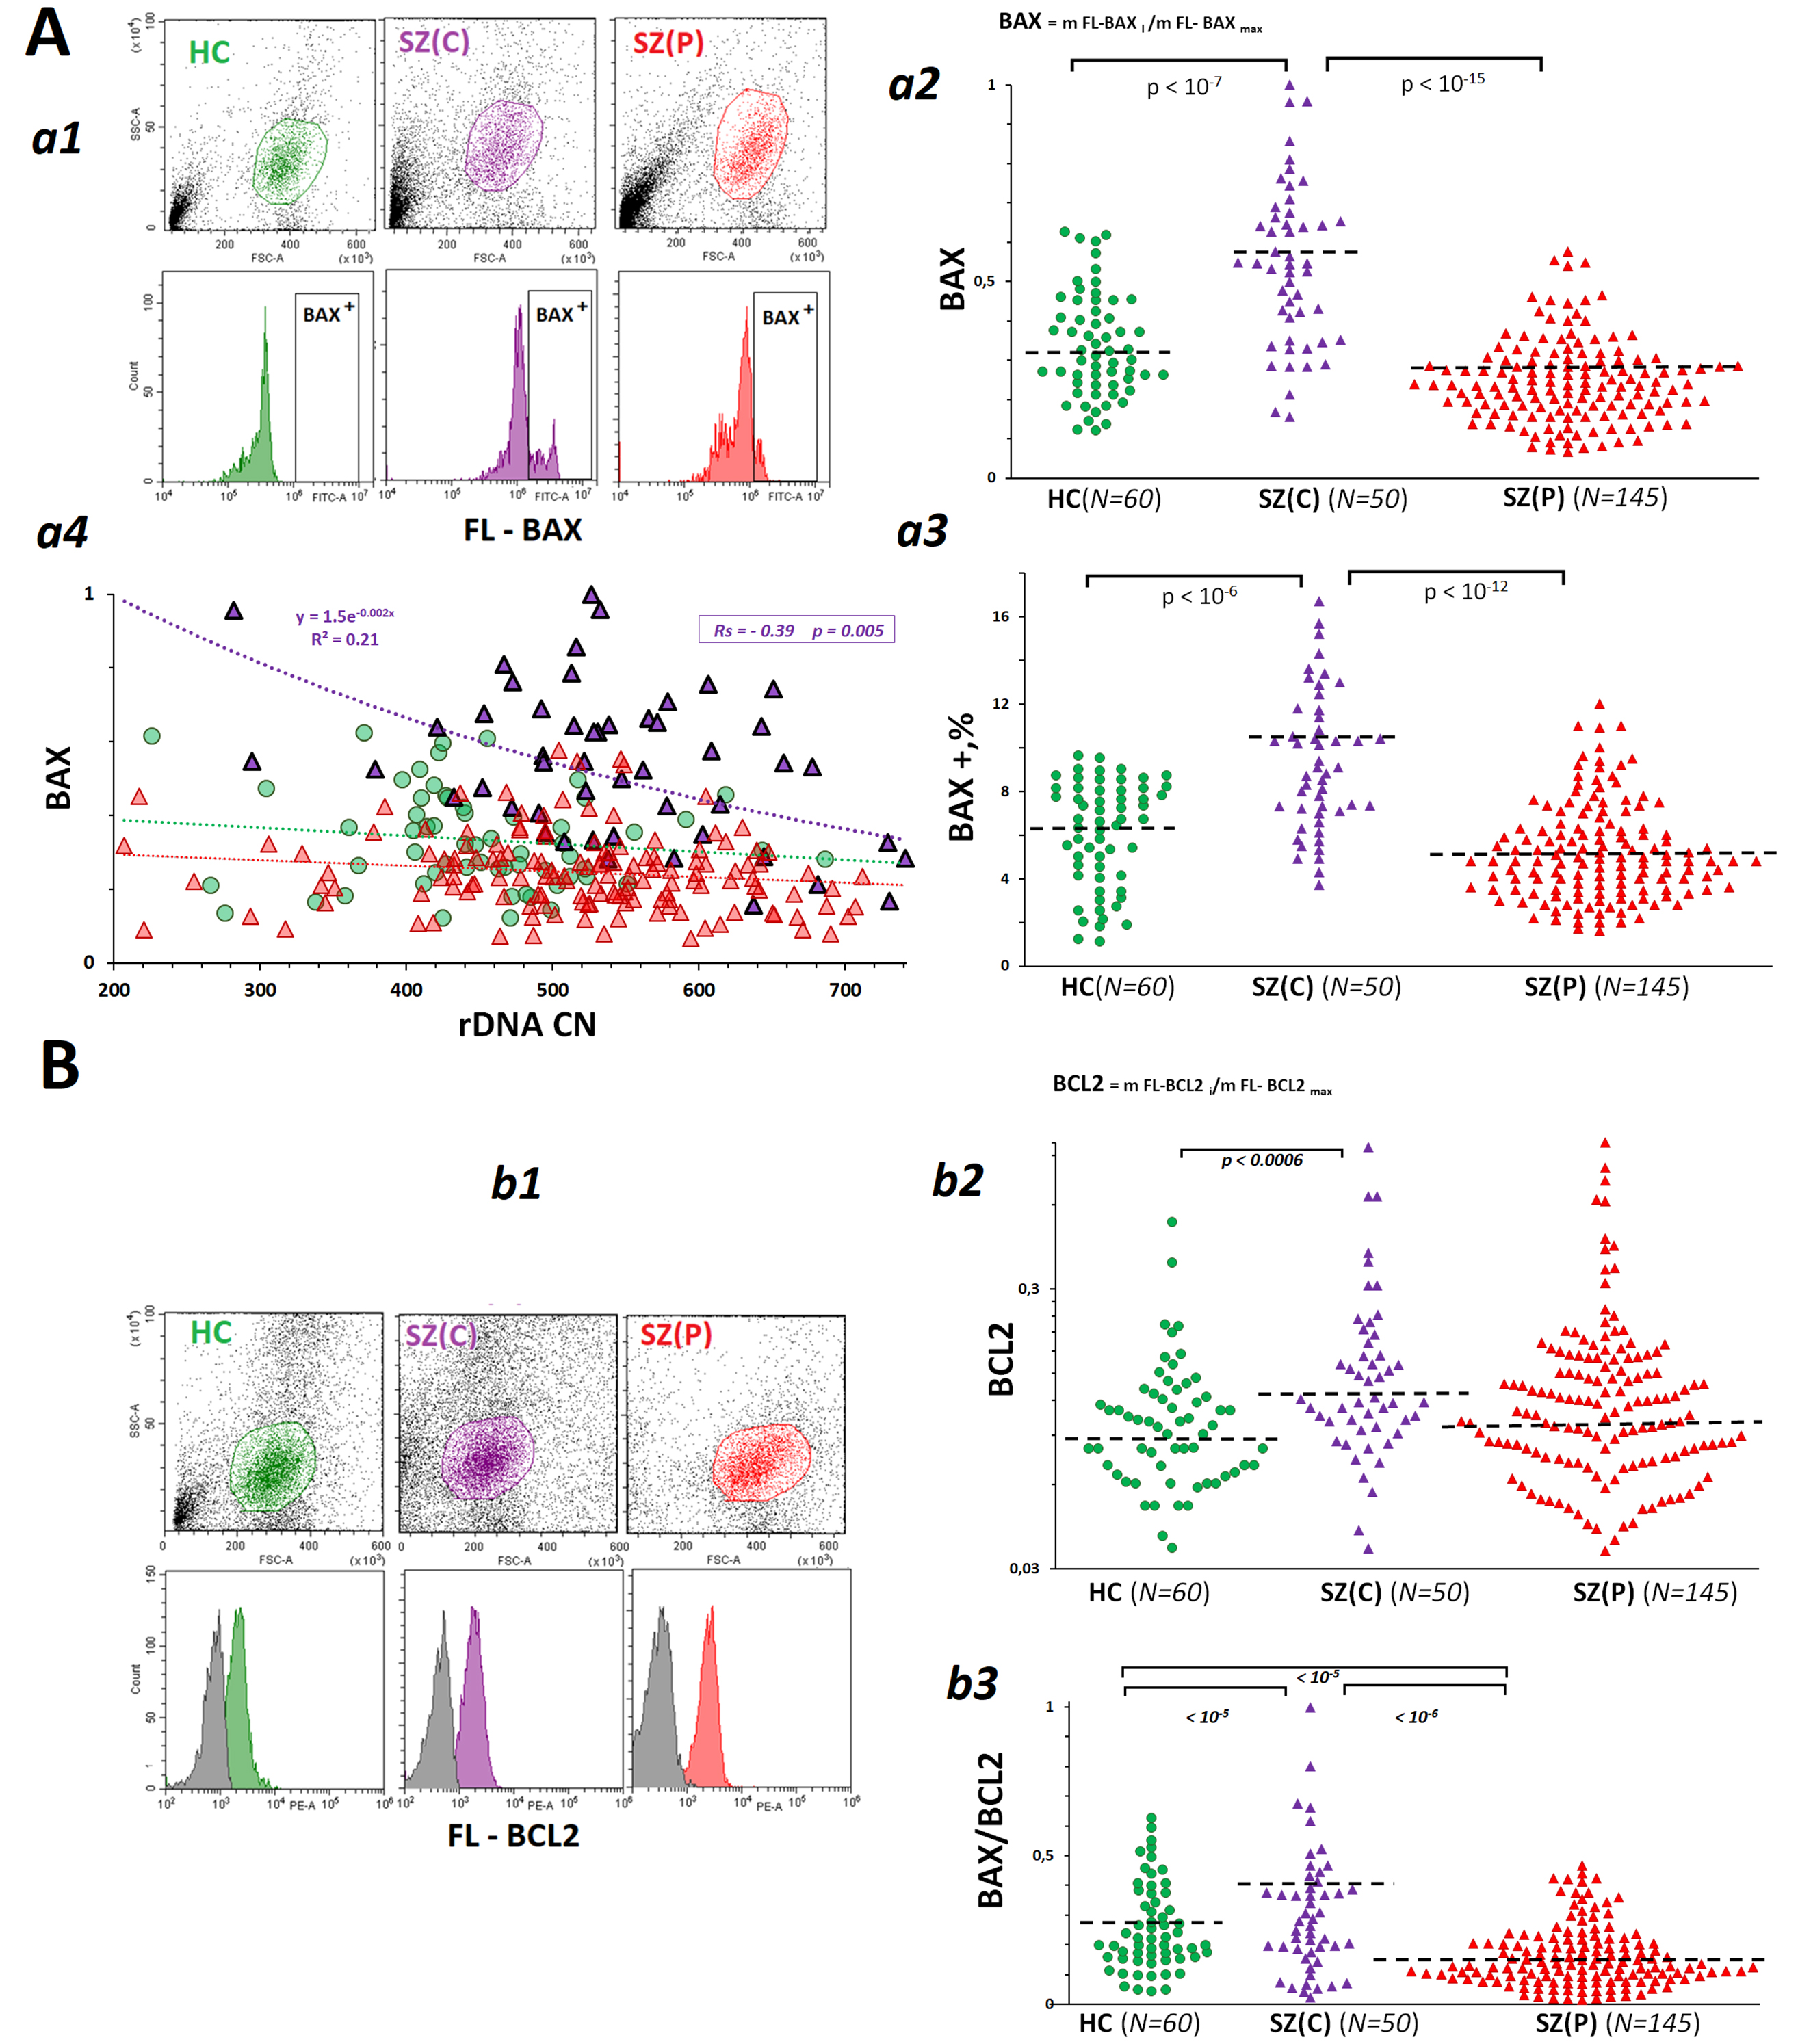 Fig. 5.
Dependence of the levels of pro-apoptotic protein BCL2-like protein 4 (BAX) and anti-apoptotic protein BCL2 in lymphocytes derived from SZ(C), SZ(P) and HC groups on rDNA CN. (A) BAX levels in PBL from SZ(C), SZ(P) and HC groups. a1 – The most typical examples of BAX assay in PBL. a2 – The mean level of BAX was estimated by the fluorescent-signal median value. The median values were normalized to the maximum signal median values in the total sample analyzed (N = 255). a3 – BAX + levels in PBL populations from SZ and HC groups. a4 – Dependence of BAX on rDNA CN. (B) BCL2 levels in PBL from SZ(C), SZ(P) and HC groups. b1 – The most typical examples of BCL2 assay in PBL. b2 – The mean level of BCL2 was estimated by the fluorescent-signal median value. b3 – BAX/BCL2 ratio for the PBL populations.
The level of anti-apoptotic protein BCL2 in lymphocytes derived from SZ(C) group of patients was slightly increased compared to controls (Fig. 5B). The ratio BAX/BCL2 allows to evaluate the intensity of apoptosis [48]. This ratio was much higher in the group of patients with catatonia than in the other two groups. In the group of patients with paranoid schizophrenia, this ratio was lower than in HC group.
In this study, we corroborated the previous reports on an increased level of oxidative stress in the blood cells of chronic SZ patients compared to healthy controls [1, 2, 7]. A high level of stress in both SZ groups studied is suggested by the equally low content of telomere repeat in the leukocytes DNA that reflects a decrease in the mean telomere length (Fig. 2). Other authors have shown that a diagnosis of chronic schizophrenia, more than gender, age, cigarette smoking or alcohol drinking, is the most important condition responsible of the telomere length shortening [49, 50]. Treatment with antipsychotics did not have an impact on such telomere length shortening [51, 52, 53]. It is suggested that telomere shortening is not a cause but a consequence of chronic schizophrenia. Antipsychotic-naïve first-episode psychosis patients have the same telomere length as healthy controls [54, 55]. Telomere length shortening is associated with a significant decline in cognitive function in SZ patients. The authors explain this fact by the accelerated aging of patients’ cells [56, 57].
8-oxodG is a well-recognized marker of chronic oxidative stress in mental
illnesses [58]. Elevated levels of this marker have been found in urine [59],
serum/plasma [60, 61], cerebrospinal fluid [62] and in the hippocampus of SZ
patients [63]. It has been shown that high 8-oxodG content is associated with a
chronic disease course rather than being an early sign of early-onset
schizophrenia [64, 65]. We found an increased 8-oxodG content in the lymphocytes
of SZ(P) and SZ(C) patients (Fig. 3A). Data on the level of double-strand breaks
(marker
Unrepaired multiple DNA lesions in cells should cause cell death. Indeed, some authors have found an increase in apoptotic cell death in SZ patients [67, 68, 69]. In lymphocytes isolated from SZ(C) cases, compared with SZ(P) and HC subjects, the amount of proapoptotic protein BAX was significantly increased, and BAX/BCL2 ratio was elevated in this group, indicating a greater intensity of cell death processes (Fig. 5).
Lymphocytes of patients with schizophrenia expressed much larger amounts of NOX4 enzyme, which catalyzes the synthesis of hydrogen peroxide, than control cells did. Despite the fact that the level of the antioxidant factor NRF2 in lymphocytes of SZ(C), SZ(P) and HC groups practically did not differ (Fig. 4), lymphocytes of patients with SZ were characterized by an imbalance in the contents of NRF2 and NOX4 (Fig. 4B,b4) compared to controls. High levels of NOX4 corresponded to relatively low levels of NRF2. In other words, there was no significant activation of NRF2 expression in response to an increased level of NOX4 protein in the patient’s cells. We observed a similar phenomenon in the early response of healthy human cells to stress caused by an exposure to genotoxic agents [70]. We believe that an imbalance in the expression levels of NRF2 and NOX4 is necessary for the cell to maintain an acceptable level of specific ROS, which are involved in the adaptive response to stress.
The adaptive response to stress involves an increase in the intensity of protein synthesis by the cell, which requires more ribosomes. The activity of genes involved in the ribosome biogenesis is increased in the cells of patients with schizophrenia [23, 24]. We have shown for the first time that the high level of rRNA synthesis in SZ(C) and SZ(P) groups is achieved not only due to a larger number of rDNA copies in the genomes of patients, but also by means of an abnormally high level of rRNA synthesis per one rDNA copy (Fig. 1C).
To explain the result obtained, Fig. 6 represents a diagram showing the structural and functional organization of ribosomal repeats in human cells. About 30–40% of the rDNA copies are in a potentially active (poised) state and ready for transcription. These copies are not methylated and are in an open (non-nucleosomal) conformation. The number of potentially active rDNA copies was shown to positively correlate with the total number of rDNA copies in the cell [44]. However, in the fraction of potentially active (poised) rDNA copies, not all copies are transcribed at a given time. The number of copies being actually transcribed (fraction 1 in Fig. 6) depends on the cell’s demand for a certain number of ribosomes. The data shown in Fig. 1C indicate a larger fraction 1 size in the blood leukocytes of schizophrenia patients in both groups compared to controls. The total level of rRNA in the cells of patients was increased, which confirms the increased activity of the ribosome biogenesis process [23, 24]. The amount of rRNA in the cells of patients with catatonia was higher than in the cells of patients with paranoid form (Fig. 1D). This fact can be explained by larger numbers of rDNA copies in the genomes of patients with catatonia (Fig. 1A), resulting in a larger fraction of potentially active copies.
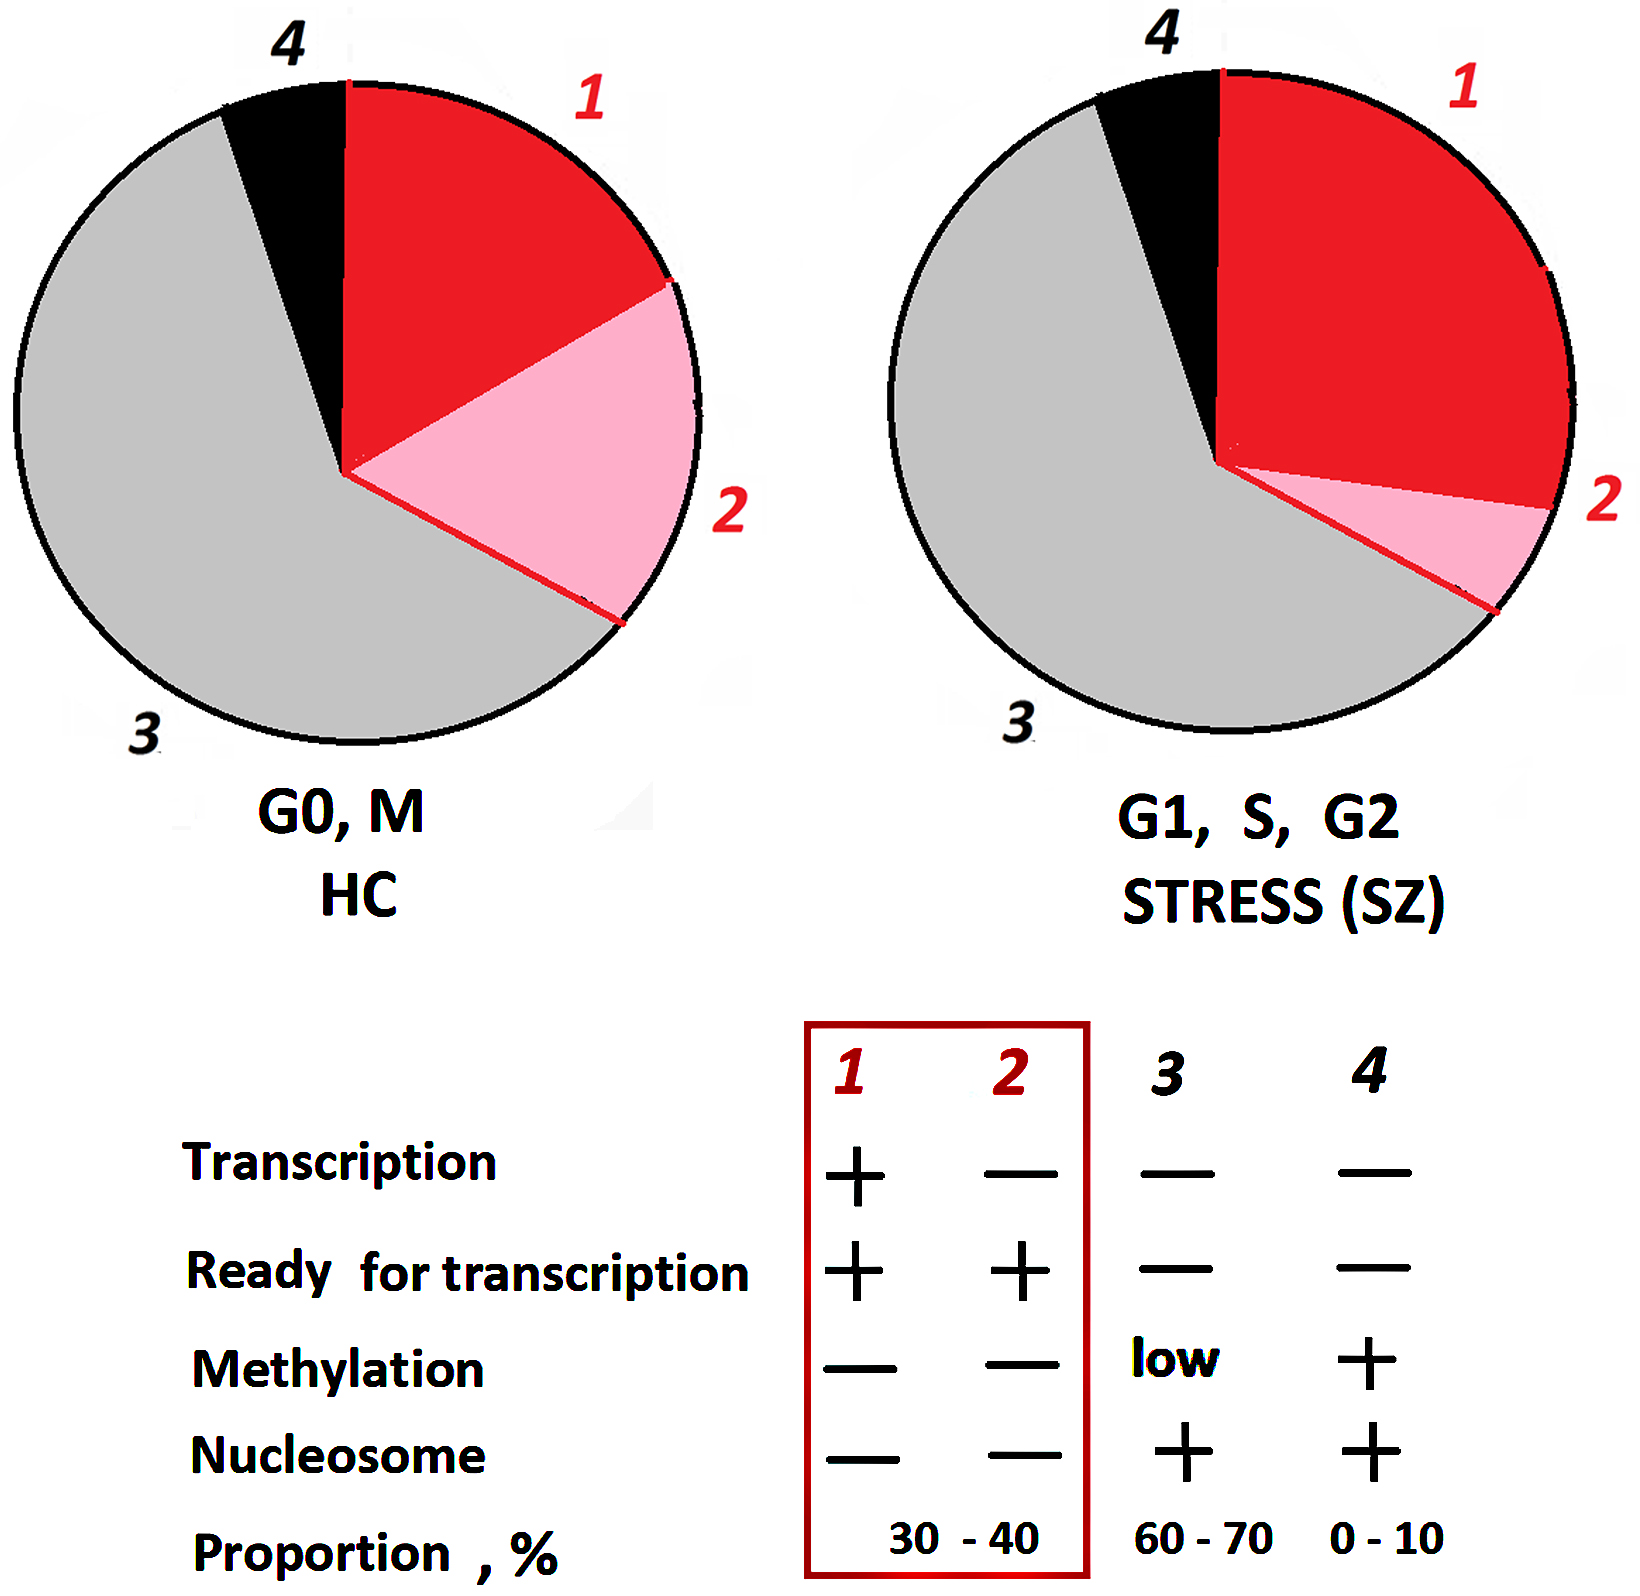 Fig. 6.
Structural-functional organization of rDNA in the nucleolus. The rDNA fractions are shown schematically. The nucleolus contains approximately 30–40% active, unmethylated copies of rDNA that can be transcribed, and 60–70% inactive copies that are poorly methylated in the promoter region. Hypermethylated rDNA copies (~10%) are located outside the nucleolus.
The importance of the increased rDNA CN in the genomes of schizophrenic patients
for the adaptive response to chronic stress is particularly evident in the group
of patients with catatonia. A large number of rDNA copies (more than 500) in
leukocytes of SZ(C) group was associated with longer telomeres (Fig. 2), a lower
level of DNA oxidation (Fig. 3B), and low levels of the pro-oxidant protein NOX4
(Fig. 4) and the pro-apoptotic protein BAX (Fig. 5). The increased number of rDNA
copies, providing an exaggerated level of ribosome biogenesis, allows the cells
to successfully cope with the high level of stress associated with the disease. A
number of authors have repeatedly raised the question of the advisability of
using antioxidants and redox-regulated transcription factor-targeting drugs
(including NRF2 activators) to improve the well-being of SZ patients [71].
Results of clinical trials indicate that antioxidant therapy has a positive
effect on patients with treatment-resistant schizophrenia [72, 73, 74]. However,
in some cases, a paradoxical increase in reactive oxygen species production has
been observed as a result of antioxidant therapy [75]. Therefore, antioxidant
therapy should be controlled. Blood biomarkers (8-oxodG,
Blood cells of patients with catatonia contain more copies of ribosomal genes than cells of patients with paranoid schizophrenia, which correlates with a higher content of ribosomal RNA in the cells of patients with catatonia. An increased level of ribosome biogenesis seems to be necessary to respond to a higher level of oxidative stress in the cells of catatonic patients compared to those of paranoid patients.
The datasets used and analyzed during the current study are available from the corresponding author on reasonable request.
SVK and NNV designed the research study. ESE, TAS, AVM and ONA performed the research. RVV, NVZ, GPK, LNP and NNV analyzed the data. NNV, ESE and LNP wrote the manuscript. All authors contributed to editorial changes in the manuscript. All authors read and approved the final manuscript. All authors have participated sufficiently in the work and agreed to be accountable for all aspects of the work.
The study was carried out in accordance with the guidelines of the Declaration of Helsinki. All participants signed an informed written consent to participate after the procedures had been completely explained. The study participants signed an informed consent for venous blood sampling and conducting research experiments with the biomaterial. The relatives of the deceased patient gave written permission to use his biological material for scientific purposes. The study design was approved by Independent Interdisciplinary Ethics Committee for the Ethical Review of Clinical Trials [(51 Leningradsky avenue, Moscow, 125468, Russia, 8 (915) 346-30-30); Protocol No. 4 (dated March 15, 2019) of scientific minimal intervention research project ‘Molecular and neurophysiological markers of endogenous human psychoses’], approval of additional research procedures at multiple research centers including - Psychiatric Hospital no. 1. Named after N.A. Alexeev.
Not applicable.
This research received no external funding.
The authors declare no conflict of interest.
References
Publisher’s Note: IMR Press stays neutral with regard to jurisdictional claims in published maps and institutional affiliations.