


 , Dongming Hua 2,†, Rong Ying 2, Xiaoshuang Liu 1, Jun Jiang 3, Zhaolong Liu 1,*
 , Yu Feng 4,*
1 Thyroid Surgery, Shanghai University of Traditional Chinese Medicine Affiliated Shuguang Hospital, 201203 Shanghai, China
2 Department of Medical Oncology, Shanghai University of Traditional Chinese Medicine Affiliated Shuguang Hospital, 201203 Shanghai, China
3 Endoscopy Center, Minhang Hospital, Fudan University, 201100 Shanghai, China
4 General Surgery, Shanghai Pudong New District Traditional Chinese Medicine Hospital, 200120 Shanghai, China
†These authors contributed equally.
Abstract
The most common endocrine cancer, thyroid carcinoma (TC), has a dismal prognosis when it reaches an advanced stage. Integrin α-2 (ITGA2) has been implicated in cancer progression, influencing both DNA damage and repair mechanisms. However, it is unknown how ITGA2 influences these processes in TC.
ITGA2 was identified as a key prognostic gene for TC from the Cancer Genome Atlas-thyroid carcinoma (THCA), GSE3678, GSE29265, and GSE33630 datasets. Functional assays were used to evaluate the impact of ITGA2 knockdown on cell viability, migration, apoptosis, invasion, pyroptosis (N-terminal fragment of GSDME, GSDME-N), and cytotoxicity (Lactate dehydrogenase, LDH). DNA damage markers (phosphorylated histone H2AX on serine 139 (γ-H2AX), phosphorylated ataxia telangiectasia mutated (p-ATM), phosphorylated checkpoint kinase 2 (p-CHK2)) and the level of Reactive Oxygen Species (ROS) were used to assess oxidative stress. The impact of ITGA2 inhibition on Wnt/β-catenin signaling was evaluated, and a mouse xenograft model assessed tumor growth in vivo.
ITGA2 was significantly overexpressed in TC. Knockdown of ITGA2 significantly reduced cell viability, migration, and invasion, while promoting pyroptosis by upregulating cleaved-poly(ADP-ribose) polymerase (PARP) and GSDME-N. ITGA2 silencing also increased LDH activity, enhanced the expression of DNA damage markers (p-ATM, γ-H2AX, p-CHK2), and increased ROS levels. Furthermore, suppression of ITGA2 activity attenuated the Wnt/β-catenin pathway by reducing the levels of MYC proto-oncogene, bHLH transcription factor (C-myc), CD44 molecule (CD44), slug, snail, β-catenin, and wingless-type MMTV integration site family, member 1 (Wnt-1). ITGA2 silencing significantly inhibited tumor growth in a mouse model.
ITGA2 promotes TC progression by regulating the DNA damage response and inhibiting pyroptosis. Knockdown of ITGA2 increases oxidative stress, exacerbates DNA damage, and inhibits the Wnt/β-catenin pathway, indicating it may have potential as a treatment target in TC.
Keywords
- thyroid cancer
- ITGA2
- Wnt/β-catenin signaling pathway
- DNA damage
- pyroptosis
Thyroid cancer (TC) is the most common endocrine malignancy globally and shows an increasing incidence [1]. Early intervention and the use of various therapeutic approaches, including surgical procedures, radioactive iodine treatment, and thyroid hormone therapy, have improved the outcomes for many TC patients. Patients with advanced or metastatic illness, on the other hand, continue to face bleak prospects [2]. DNA damage is pivotal in TC progression due to its activation of critical pathways, such as pyroptosis and apoptosis [3]. Apoptosis is a non-inflammatory, programmed mode of cellular demise, whereas pyroptosis is a pro-inflammatory process that entails inflammasome activation and the cleavage of gastrin [4, 5]. Minor DNA damage can be repaired, but severe or persistent damage triggers cell death pathways [6]. The pro-inflammatory effects of pyroptosis may contribute to the aggressive behavior of specific TC subtypes [7]. Therefore, it is essential to comprehend the connection between DNA damage and cell death in TC in order to create innovative treatment approaches [8].
Integrin alpha-2 (ITGA2) is a transmembrane receptor that forms the
ITGA2 plays a complex function in cancer development. This includes the
disruption of DNA repair processes, enhancement of genomic instability, and
stimulation of cancer-promoting pathways like Wnt/
Three TC datasets (GSE29265, GSE3678, GSE33630) were collected from the Gene
Expression Omnibus database (GEO; https://www.ncbi.nlm.nih.gov/gds/). The GSE3678
dataset comprises 7 TC samples and 7 paired control samples, the GSE29265 dataset
contains 29 TC samples and 20 control samples, while the GSE33630 dataset
contains 60 TC samples and 45 control samples. Furthermore, information collected
The Cancer Genome Atlas (TCGA; https://portal.gdc.cancer.gov/) database, which
included 59 control samples and 512 TC samples, was also used. To identify
differentially expressed genes (DEGs) in the datasets, the ASSISTANT for Clinical
Bioinformatic platform (https://www.aclbi.com/static/index.html#/) was utilized.
A fold-change (FC) threshold of
Overlapping DEGs from the four TC datasets were identified using a bioinformatics platform (https://bioinformatics.psb.ugent.be/webtools/Venn/). Intersection analysis of both upregulated and downregulated DEGs was used to obtain DEGs that overlapped. The Search Tool for the Retrieval of Interacting Genes/Proteins (STRING) database (https://string-db.org/) was used to identify PPI networks among overlapping DEGs. Further exploration of potential functional associations and regulatory networks of candidate genes was carried out by constructing PPI networks. Analysis was performed using the Molecular Complex Detection (MCODE) algorithm. For visualization, the Cytoscape open-source software platform (version 3.7.1; Cytoscape Consortium, San Diego, CA, USA) was applied to the resulting PPI network.
Overlapping DEGs were analyzed with the “glmnet” package in R software. Tuning
parameters were determined through a 10-fold cross-validation process, and the
Least Absolute Shrinkage and Selection Operator (LASSO) model was applied
[14, 15, 16]. To find the most predictive genes, we employed the ideal
Correlation analysis for significant prognostic genes was performed using R
software. Single-factor and multi-factor Cox regression analyses were conducted
on signature genes and clinical variables (age, gender, pathological TNM (pTNM)
stage) using the “forest plot” package. For each variable, the 95% confidence
intervals (CIs) [19], p-values, and HRs were computed. Statistically
significant variables (p
Otwo Biotech (Shenzhen, China) provided the normal thyroid cell line (Nthy-ori3-1), the TC cell line TPC-1, and CAL-62. The selection of TPC-1 (papillary carcinoma) and CAL-62 (mesenchymal carcinoma) was based on the unequivocal identification of their molecular features in a previous study [20] and is widely used in studies of thyroid cancer migration, DNA damage, and cell death [21]. The two cell lines can be studied to cover the heterogeneity of the main subtypes of thyroid cancer. In a humidified 37 °C atmosphere with 5% CO2, cells were cultivated in Dulbecco’s Modified Eagle Medium (DMEM; Procell; cat. no. PM150210B; Wuhan, China) supplemented with 10% fetal bovine serum (FBS) (Gibco; Thermo Fisher Scientific, Inc.; cat. no. 16000044; Waltham, MA, USA) and 1% penicillin-streptomycin (Beyotime; cat. no. C0222; Shanghai, China). We declare that all cell lines used in this study tested for mycoplasma contamination using PCR-based detection methods, and were confirmed to be free of contamination (Supplementary Fig. 1). All cell lines were obtained from OTWO (Huatuo Biotech, China). The supplier verified the authenticity of these cell lines using short tandem repeat (STR) profiling.
To conduct transient transfection, TC cells were seeded in 24-well plates at a
density of 2
qRT-PCR was carried out as previously mentioned [22]. The relative expression of genes was determined using the 2-ΔΔCT technique, and the levels were normalized to glyceraldehyde-3-phosphate dehydrogenase (GAPDH). The primer sequences utilized in the qRT-PCR tests are listed in Table 1.
| Target | Direction | Sequence (5′-3′) |
| ITGA2 | Forward | TTCAGCTCTCAGCCAGCTTC |
| ITGA2 | Reverse | ACCCCACCTGTGTCTTTGTG |
| Bax | Forward | TGATGGACGGGTCCGGG |
| Bax | Reverse | TGAGACACTCGCTCAGCTTC |
| Caspase3 | Forward | TGTGAGGCGGTTGTAGAAGAGT |
| Caspase3 | Reverse | CTTTATTAACGAAAACCAGAGCGCC |
| Caspase9 | Forward | GGCCCCATATGATCGAGGAC |
| Caspase9 | Reverse | CAACTTTGCTGCTTGCCTGT |
| Bcl-2 | Forward | AAAAATACAACATCACAGAGGAAGT |
| Bcl-2 | Reverse | AGGGGGTGTCTTCAATCACG |
| Wnt-1 | Forward | TGTGGAAATGAGGTTGGGGG |
| Wnt-1 | Reverse | CGTGGCTCTGTATCCACGTT |
| C-myc | Forward | ACACTAACATCCCACGCTCTG |
| C-myc | Reverse | AAATCATCGCAGGCGGAACA |
| CD44 | Forward | GAGCAGCACTTCAGGAGGTT |
| CD44 | Reverse | TGGTTGCTGTCTCAGTTGCT |
| Forward | GTTGAGCACCTGTTTGCCTG | |
| Reverse | GTTGAGCACCTGTTTGCCTG | |
| Slug | Forward | CATCTTTGGGGCGAGTGAGT |
| Slug | Reverse | GGCCAGCCCAGAAAAAGTTG |
| Snail | Forward | CGAGTGGTTCTTCTGCGCTA |
| Snail | Reverse | GGGCTGCTGGAAGGTAAACT |
| GAPDH | Forward | AATGGGCAGCCGTTAGGAAA |
| GAPDH | Reverse | GCGCCCAATACGACCAAATC |
qRT-PCR, quantitative real-time polymerase chain reaction; ITGA2,
Integrin
To extract protein lysates from TC cells, a combination of protease inhibitor
cocktail (CoWin Biosciences; cat. no. CW2200S; Nanjing, China) and phosphatase
inhibitors cocktail (CoWin Biosciences; cat. no. CW2383S; Nanjing, China) was
combined with RIPA lysis solution (Solarbio; cat. no. R0020; Beijing, China).
Before the protein was separated using 10% SDS-PAGE and then transferred onto
PVDF membranes (Beyotime; cat. no. FFP22; Beijing, China), the protein
concentration was measured using a BCA Protein Assay Kit (Beyotime; cat. no.
P0012; Beijing, China). Primary antibodies were then administered overnight at 4
°C after the membranes had been blocked for an hour at room temperature
using 5% skim milk. These included antibodies to ITGA2 (cat. no. ab181548),
BCL2-associated X protein (Bax) (cat. no. ab32503), caspase-3 (cat. no. ab32351),
caspase-9 (cat. no. ab32539), BCL2 apoptosis regulator (Bcl-2) (cat. no.
ab182858), poly(ADP-ribose) polymerase (PARP) (cat. no. ab191217), cleaved-PARP
(cat. no. ab32561), GSDME-full length (GSDME-FL) (cat. no. ab215191), N-terminal
fragment of GSDME (GSDME-N) (cat. no. ab222408), phosphorylated histone H2AX on
serine 139 (
The CCK-8 analysis method (KeyGEN; cat. no. KGA317; Nanjing, China) was used to
assess cell viability. At a density of 5
Trypsin-EDTA (Absin; cat. no. abs42104714; Shanghai, China) was used to separate TC cells, and then washing with phosphate-buffered saline (PBS; Beyotime; cat. no. C0221B; Shanghai, China). As advised by the manufacturer, the cells were labeled with Annexin V (BD Biosciences; cat. no. 563973; San Jose, CA, USA) and propidium iodide (PI) (BD Biosciences; cat. no. 556547; San Jose, CA, USA). Viable, necrotic, and apoptotic cells were then separated using a flow cytometer (Jiyuan, Guangzhou, China). FlowJo software (version 7.6, FlowJo, Hangzhou, China) was utilized for processing the flow cytometry data.
Transwells were utilized to monitor cell invasion and migration. Transfected TC cells were placed in serum-free media in the top compartment of the Transwell instrument.
Subsequently, the medium in the lower compartment was enriched with 10% FBS. After a 24-hour incubation period, the cells were fixed with 4% paraformaldehyde (Wuhan Servicebio Biotechnology Co., Ltd.; cat. no. G1101; Wuhan, China) and stained with DAPI (Abcam; cat. no. ab104139; Cambridge, UK). The migration of cells into the bottom compartment was then assessed using inverted microscopy. The upper chamber was initially covered with matrigel for the cell invasion studies, and the same steps as for cell migration were taken.
A suitably diluted quantity of cell culture supernatant was then added to the
wells of ELISA plates that had previously been coated with IL-1
To create the xenograft model, TC cells transfected with si-NC and
si-ITGA2-1 were suspended in serum-free media. Subcutaneous injections
of a 100 µL solution containing 5
Lactate dehydrogenase (LDH; cat. no. P0395S) activity and reactive oxygen species (ROS; cat. no. S0035) levels were assessed following the manufacturer’s instructions. The corresponding detection kits were used, respectively (Beyotime Institute of Biotechnology, Jiangsu, China).
After embedding the subcutaneous tumor tissues of mice in sections as required,
the oven temperature was set to 65 °C and baked at a constant
temperature for 120 mins. This was performed according to the
immunohistochemistry kit (Maxim; cat. no. Kit9710; Fuzhou, China). Sections were
incubated with an anti-ITGA2 primary antibody (Abcam, cat. no. ab181548; 1:500
dilution) overnight at 4 °C, followed by detection using the
HRP-conjugated secondary antibody (Kangcheng; cat. no. KC-RB-035; 1:250 dilution,
Shanghai, China). The complete tissue sample was scanned at low magnification
(
Data was analyzed using the R program (version 4.2.2, R Foundation for
Statistical Computing, Vienna, Austria). Three duplicates of each experiment were
conducted, and the mean
The number of up-regulated DEGs found in the TCGA-THCA, GSE3678, GSE29265 and GSE33630 datasets was 557, 210, 247 and 430, respectively, while the number of down-regulated DEGs was 746, 209, 295 and 404, respectively (Fig. 1A–D). An integrated bioinformatics platform found that 95 up-regulated DEGs as well as 130 down-regulated DEGs overlapped across all four datasets (Fig. 1E,F). Further analysis of these overlapping DEGs was performed by constructing a PPI network. This identified 14 genes using the MCODE plugin (Fig. 1G).
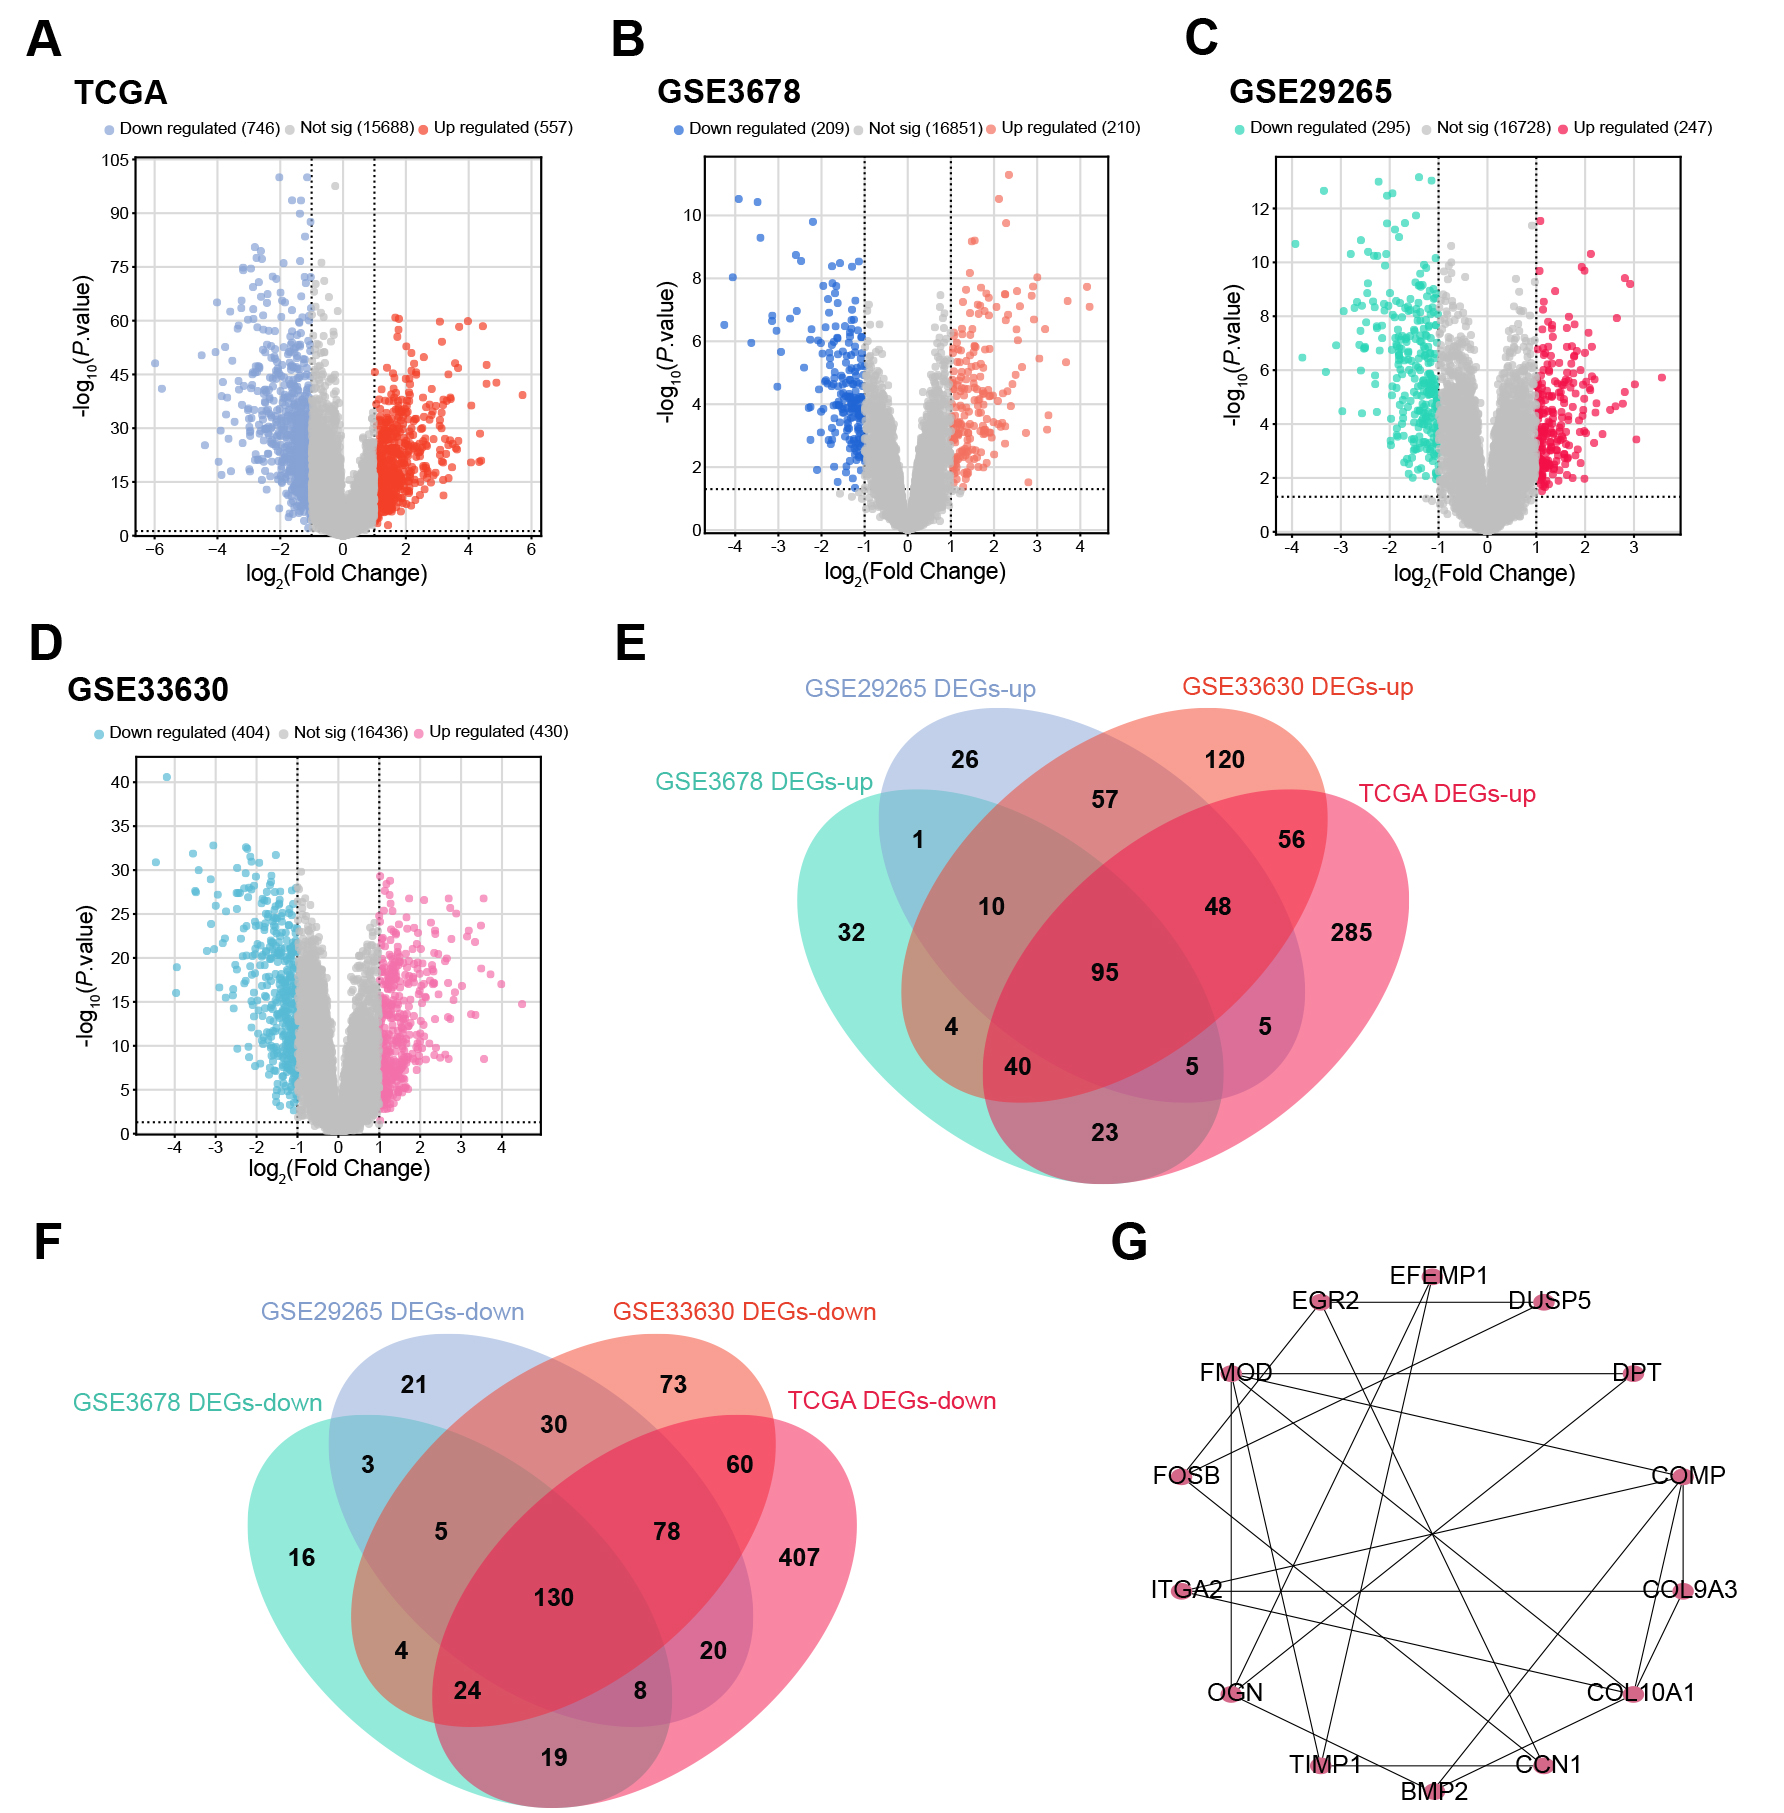 Fig. 1.
Construction of the PPI network for DEGs identified in the TC
datasets. (A–D) Volcano plots showing DEGs in TCGA-THCA (A), GSE3678 (B),
GSE29265 (C), and GSE33630 (D) datasets. Red dots represent up-regulated DEGs,
and blue dots represent down-regulated DEGs. Grey dots indicate non-significant
genes. A p-value of
As shown in Fig. 2A,B, three critical prognostic genes were identified from the
14 genes based on the ideal lambda value (
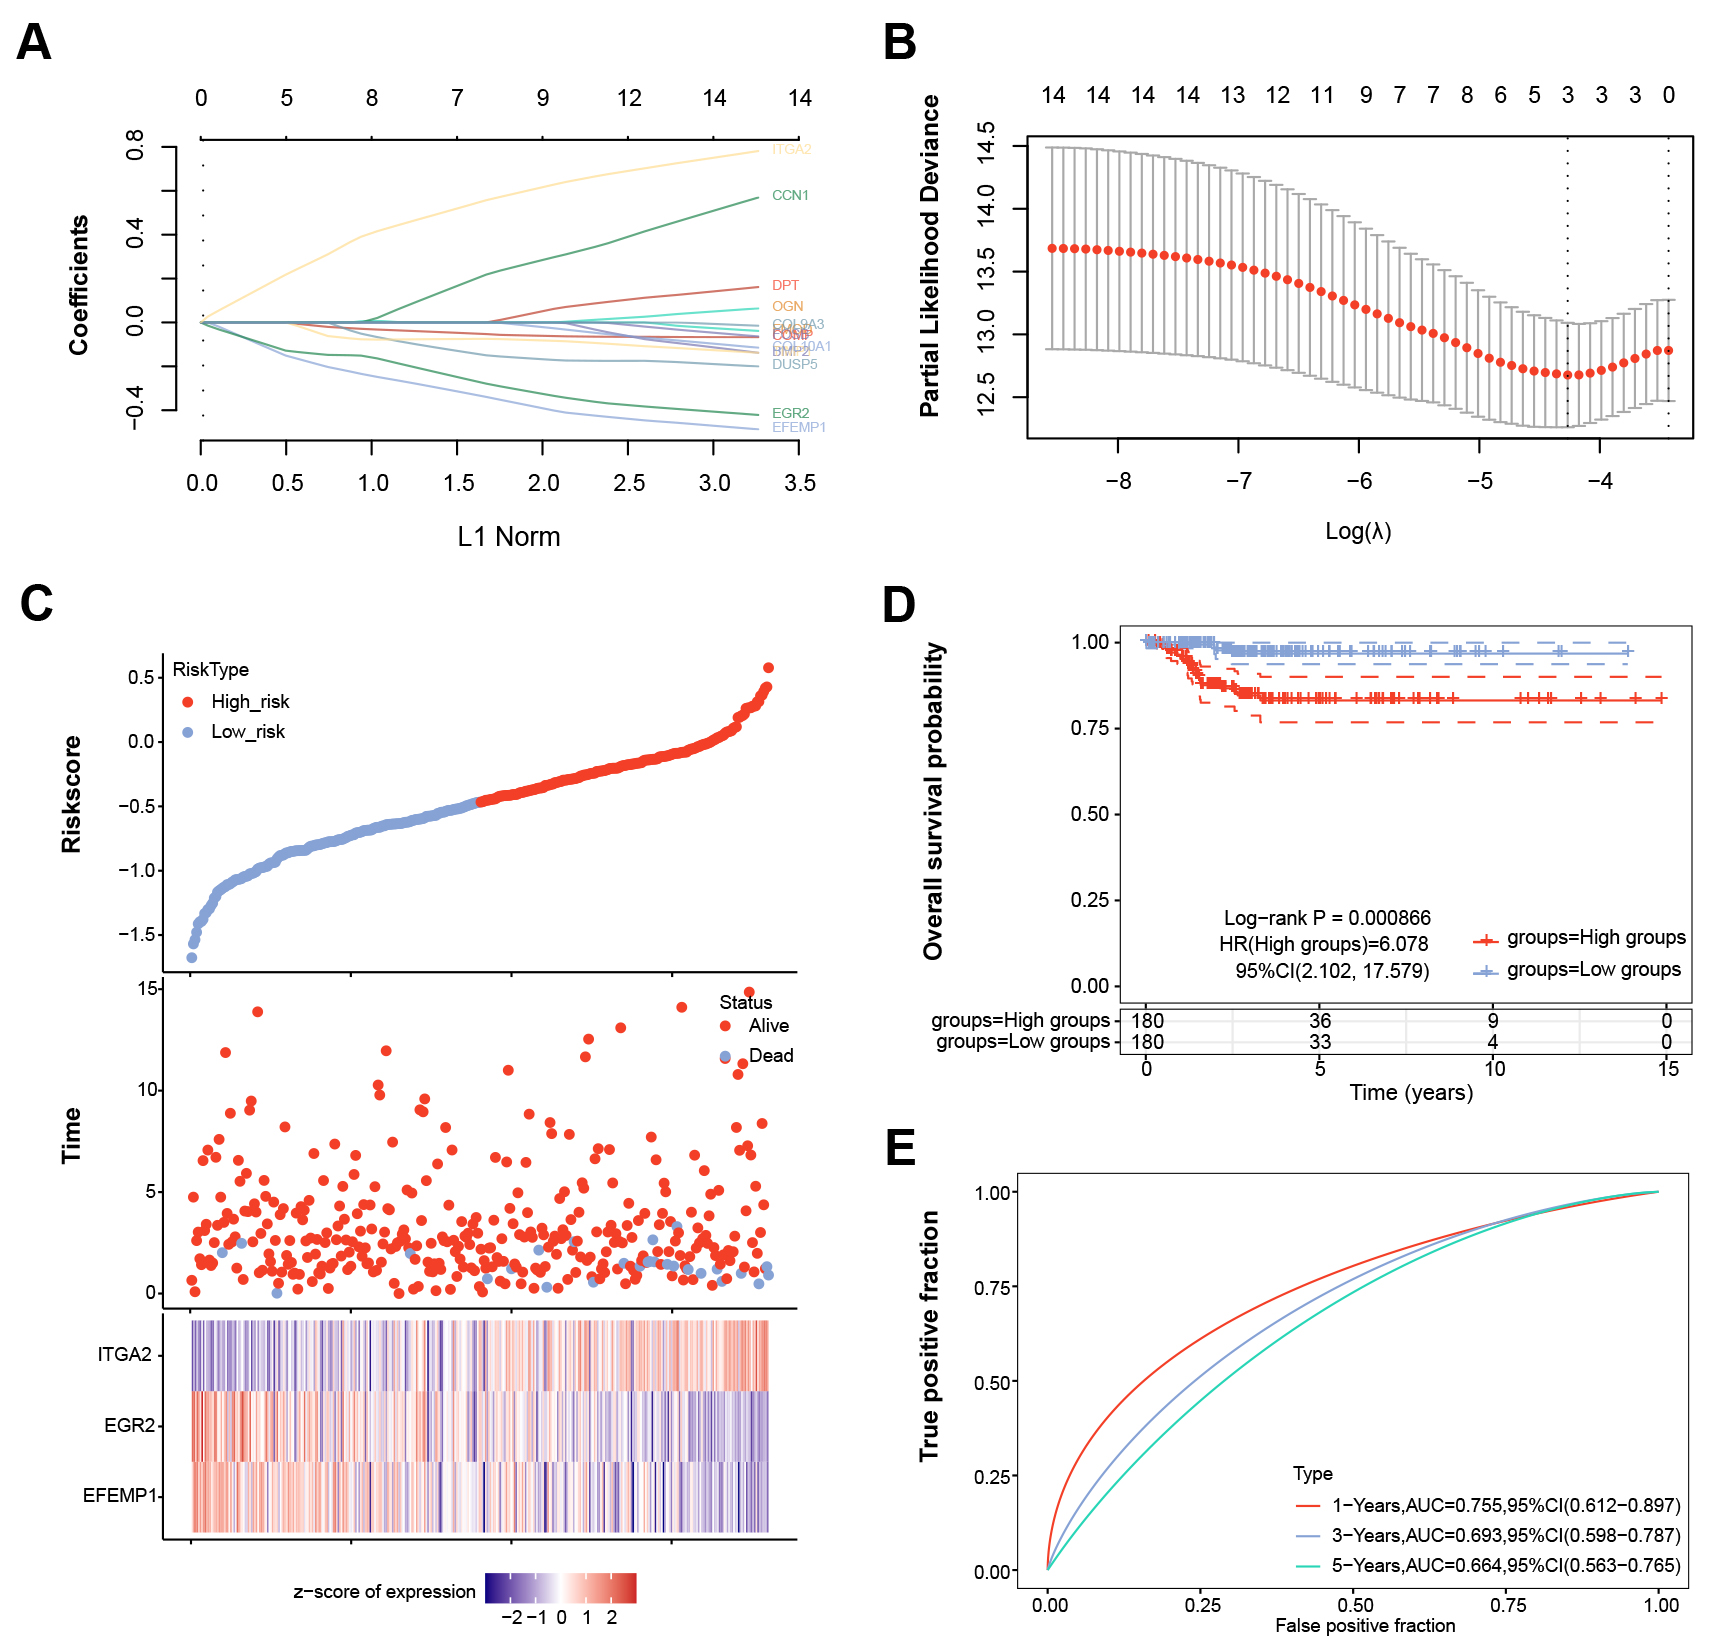 Fig. 2.
LASSO Cox regression and survival analysis for three key
prognostic genes in TC. (A) LASSO coefficient profiles of 14 candidate genes.
Each curve represents the relationship between the gene coefficient and the L1
norm. The optimal lambda value was determined by minimizing the partial
likelihood deviation. (B) Plot of the correlation between log(
Cox regression analysis and survival analysis of key prognostic factors in TC patients. The results of univariate Cox regression analysis for the 3 key candidate genes (EFEMP1, EGR2, and ITGA2) showed significant prognostic correlations, indicating that the expression levels of these genes were significantly correlated with the survival prognosis of patients (Fig. 3A). After adjusting for potential confounders, the results of multivariate Cox regression analysis for the 3 key candidate genes indicated that the ITGA2 gene still showed a significant prognostic correlation, suggesting that ITGA2 may be an independent prognostic factor (Fig. 3B). The column-line graph demonstrated a prognostic model constructed based on ITGA2 expression levels and other clinicopathologic features (Fig. 3C). The analysis showed that the predictive ability of the model was statistically significant. The calibration curves further validated the predictive accuracy of the model, showing good agreement between the predicted 1-, 3-, and 5-year survival probabilities and the actual observations (Fig. 3D). Notably, most of the actual observations in Fig. 3D are clustered near the upper-right corner, which reflects the overall high survival probability in the TC cohort. The expression level of the ITGA2 gene was significantly correlated with the prognosis of patients with thyroid cancer.
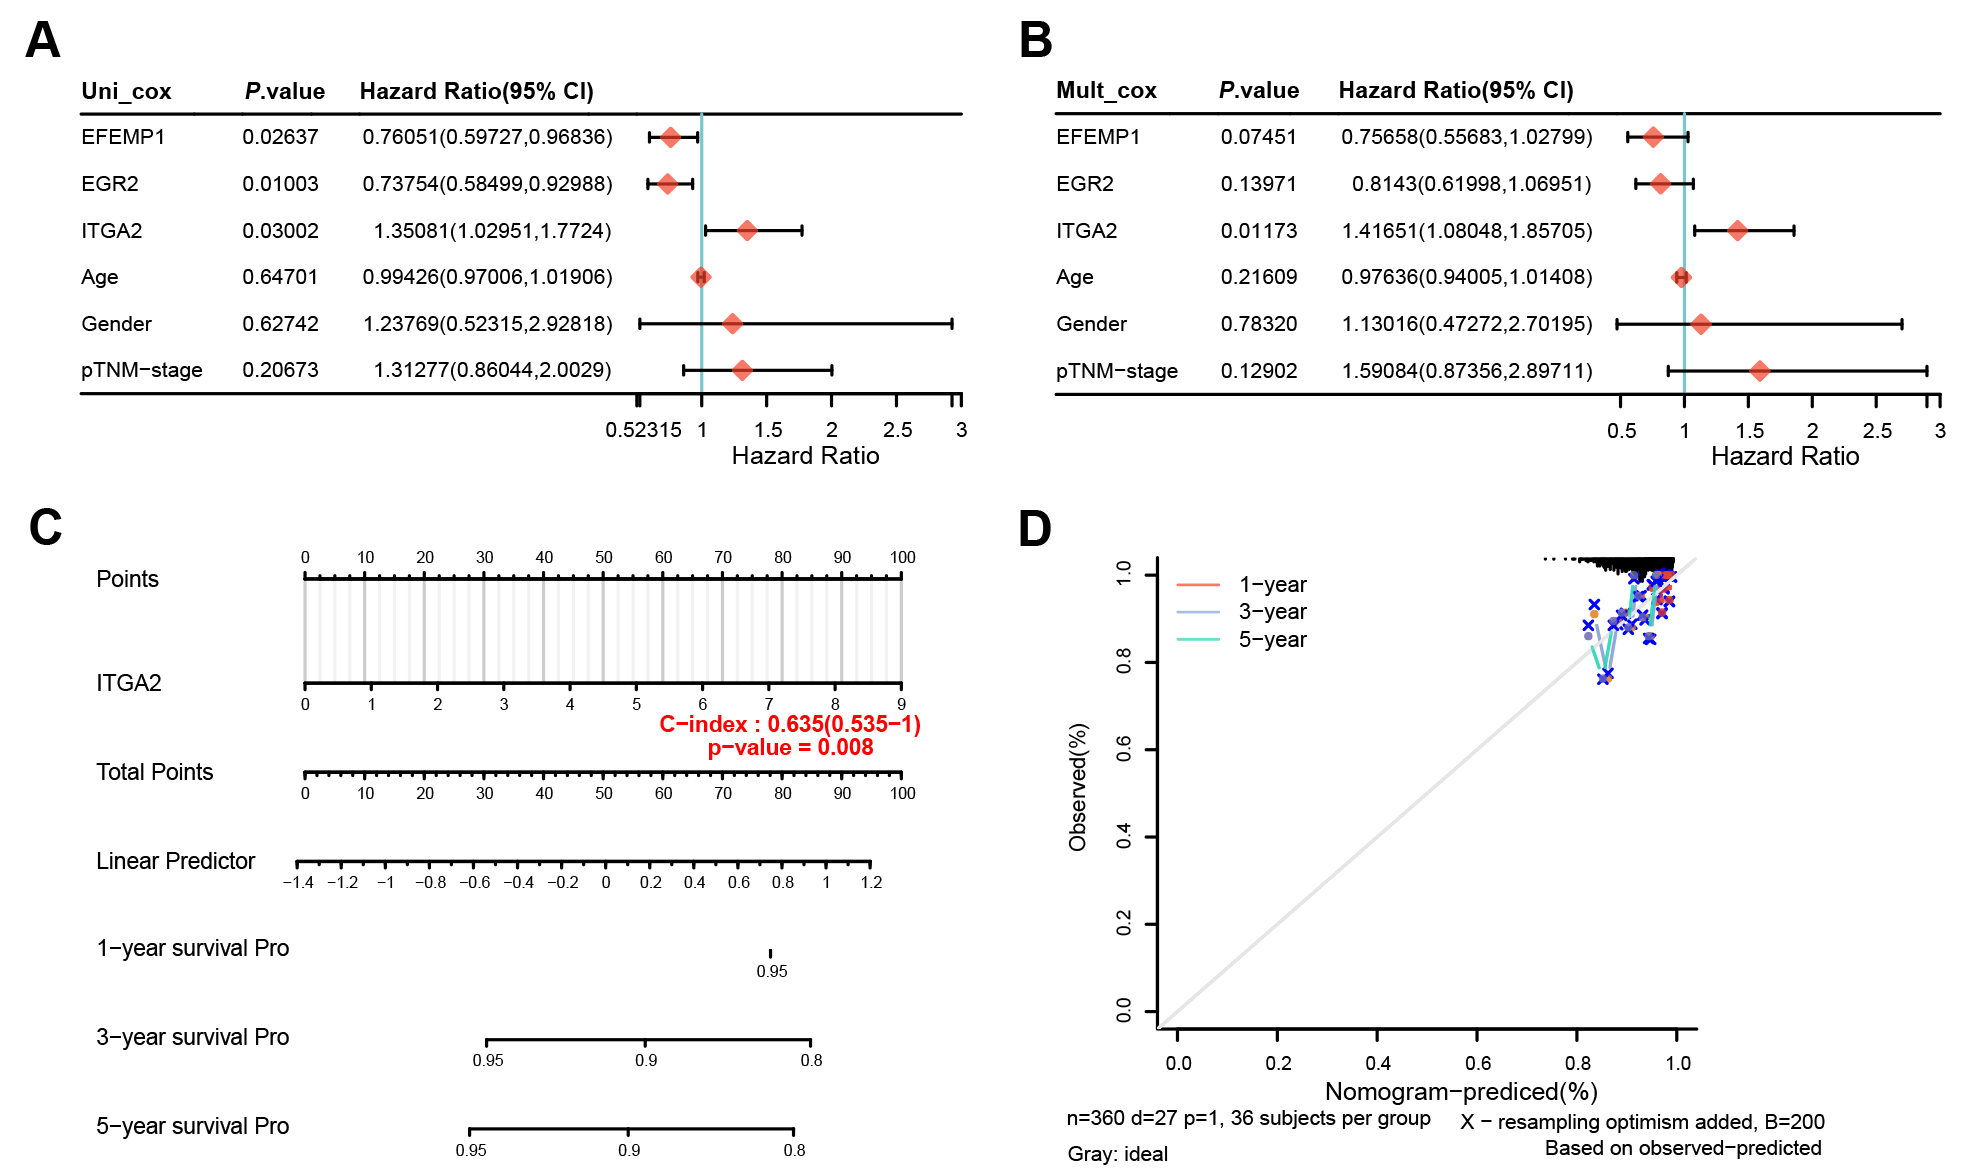 Fig. 3.
Survival analysis and prognostic assessment in TC. (A) Univariate Cox regression analysis of clinical prognostic factors and critical genes for TC patient survival. The forest plot displays HRs with 95% CI and p-values for each variable. (B) Multivariate Cox regression analysis of the same factors, adjusting for potential confounders. The forest plot shows adjusted HRs with 95% CI and p-values. (C) Nomogram for predicting 1-year, 3-year, and 5-year survival probabilities based on key prognostic factors (ITGA2, Age, Gender, pTNM-stage). The total points for each factor are summed to obtain a linear predictor, which is then translated into survival probabilities. The model’s predictive accuracy is assessed using the C-index, with a value of 0.635 (95% CI: 0.535–1) and a p-value of 0.008. (D) Calibration plot for the nomogram, showing observed versus predicted survival probabilities at 1-year, 3-year, and 5-year follow-ups. The dashed lines represent ideal prediction, while the solid lines show the actual performance of the model. The calibration plot was generated using the Clinical Bioinformatics Platform. The clustering of observed points in the upper-right region reflects the high survival probability in our TC cohort. TC, Thyroid Carcinoma; Cox, Cox proportional hazards model; HR, Hazard Ratio; CI, Confidence Interval; C-index, Concordance Index.
In this study, we analyzed the expression pattern of the ITGA2 gene in thyroid cancer and its potential as a diagnostic marker. The volcano map show that the expression level of ITGA2 was significantly up-regulated in tumor samples compared to normal samples in the TCGA database (Fig. 4A). In addition, box line plots revealed that the expression levels of ITGA2 were significantly higher in tumor samples than in normal samples in the GSE3678, GSE29265, and GSE33630 datasets, especially in the GSE29265 and GSE33630 datasets (Fig. 4B–D). Further, ROC curve analysis was performed to evaluate the potential of ITGA2 gene expression as a diagnostic marker (Fig. 4E–H). The results showed that the AUC value of ITGA2 was as high as 0.887 in the TCGA dataset, indicating a very high diagnostic accuracy. In the GSE3678 and GSE33630 datasets, the AUC values of ITGA2 were 0.898 and 0.954, respectively, which also showed good diagnostic performance. The AUC value of ITGA2 in the GSE29265 dataset was 0.907, further confirming its potential as a diagnostic marker. We analyzed the effect of ITGA2 gene expression on disease-free survival in patients using the TCGA dataset. Analysis of the Clinical BioLetter House platform (n = 512) showed that high ITGA2 expression was significantly associated with lower disease-free survival (Fig. 4I), a finding supported by results from the GEPIA database (n = 500) (Supplementary Fig. 2A). However, no significant association between ITGA2 expression and disease-free survival was found when the TCGA dataset (n = 497) was analyzed by the cBioPortal platform (Supplementary Fig. 2B). Different analytical methods or platform differences may cause this discrepancy.
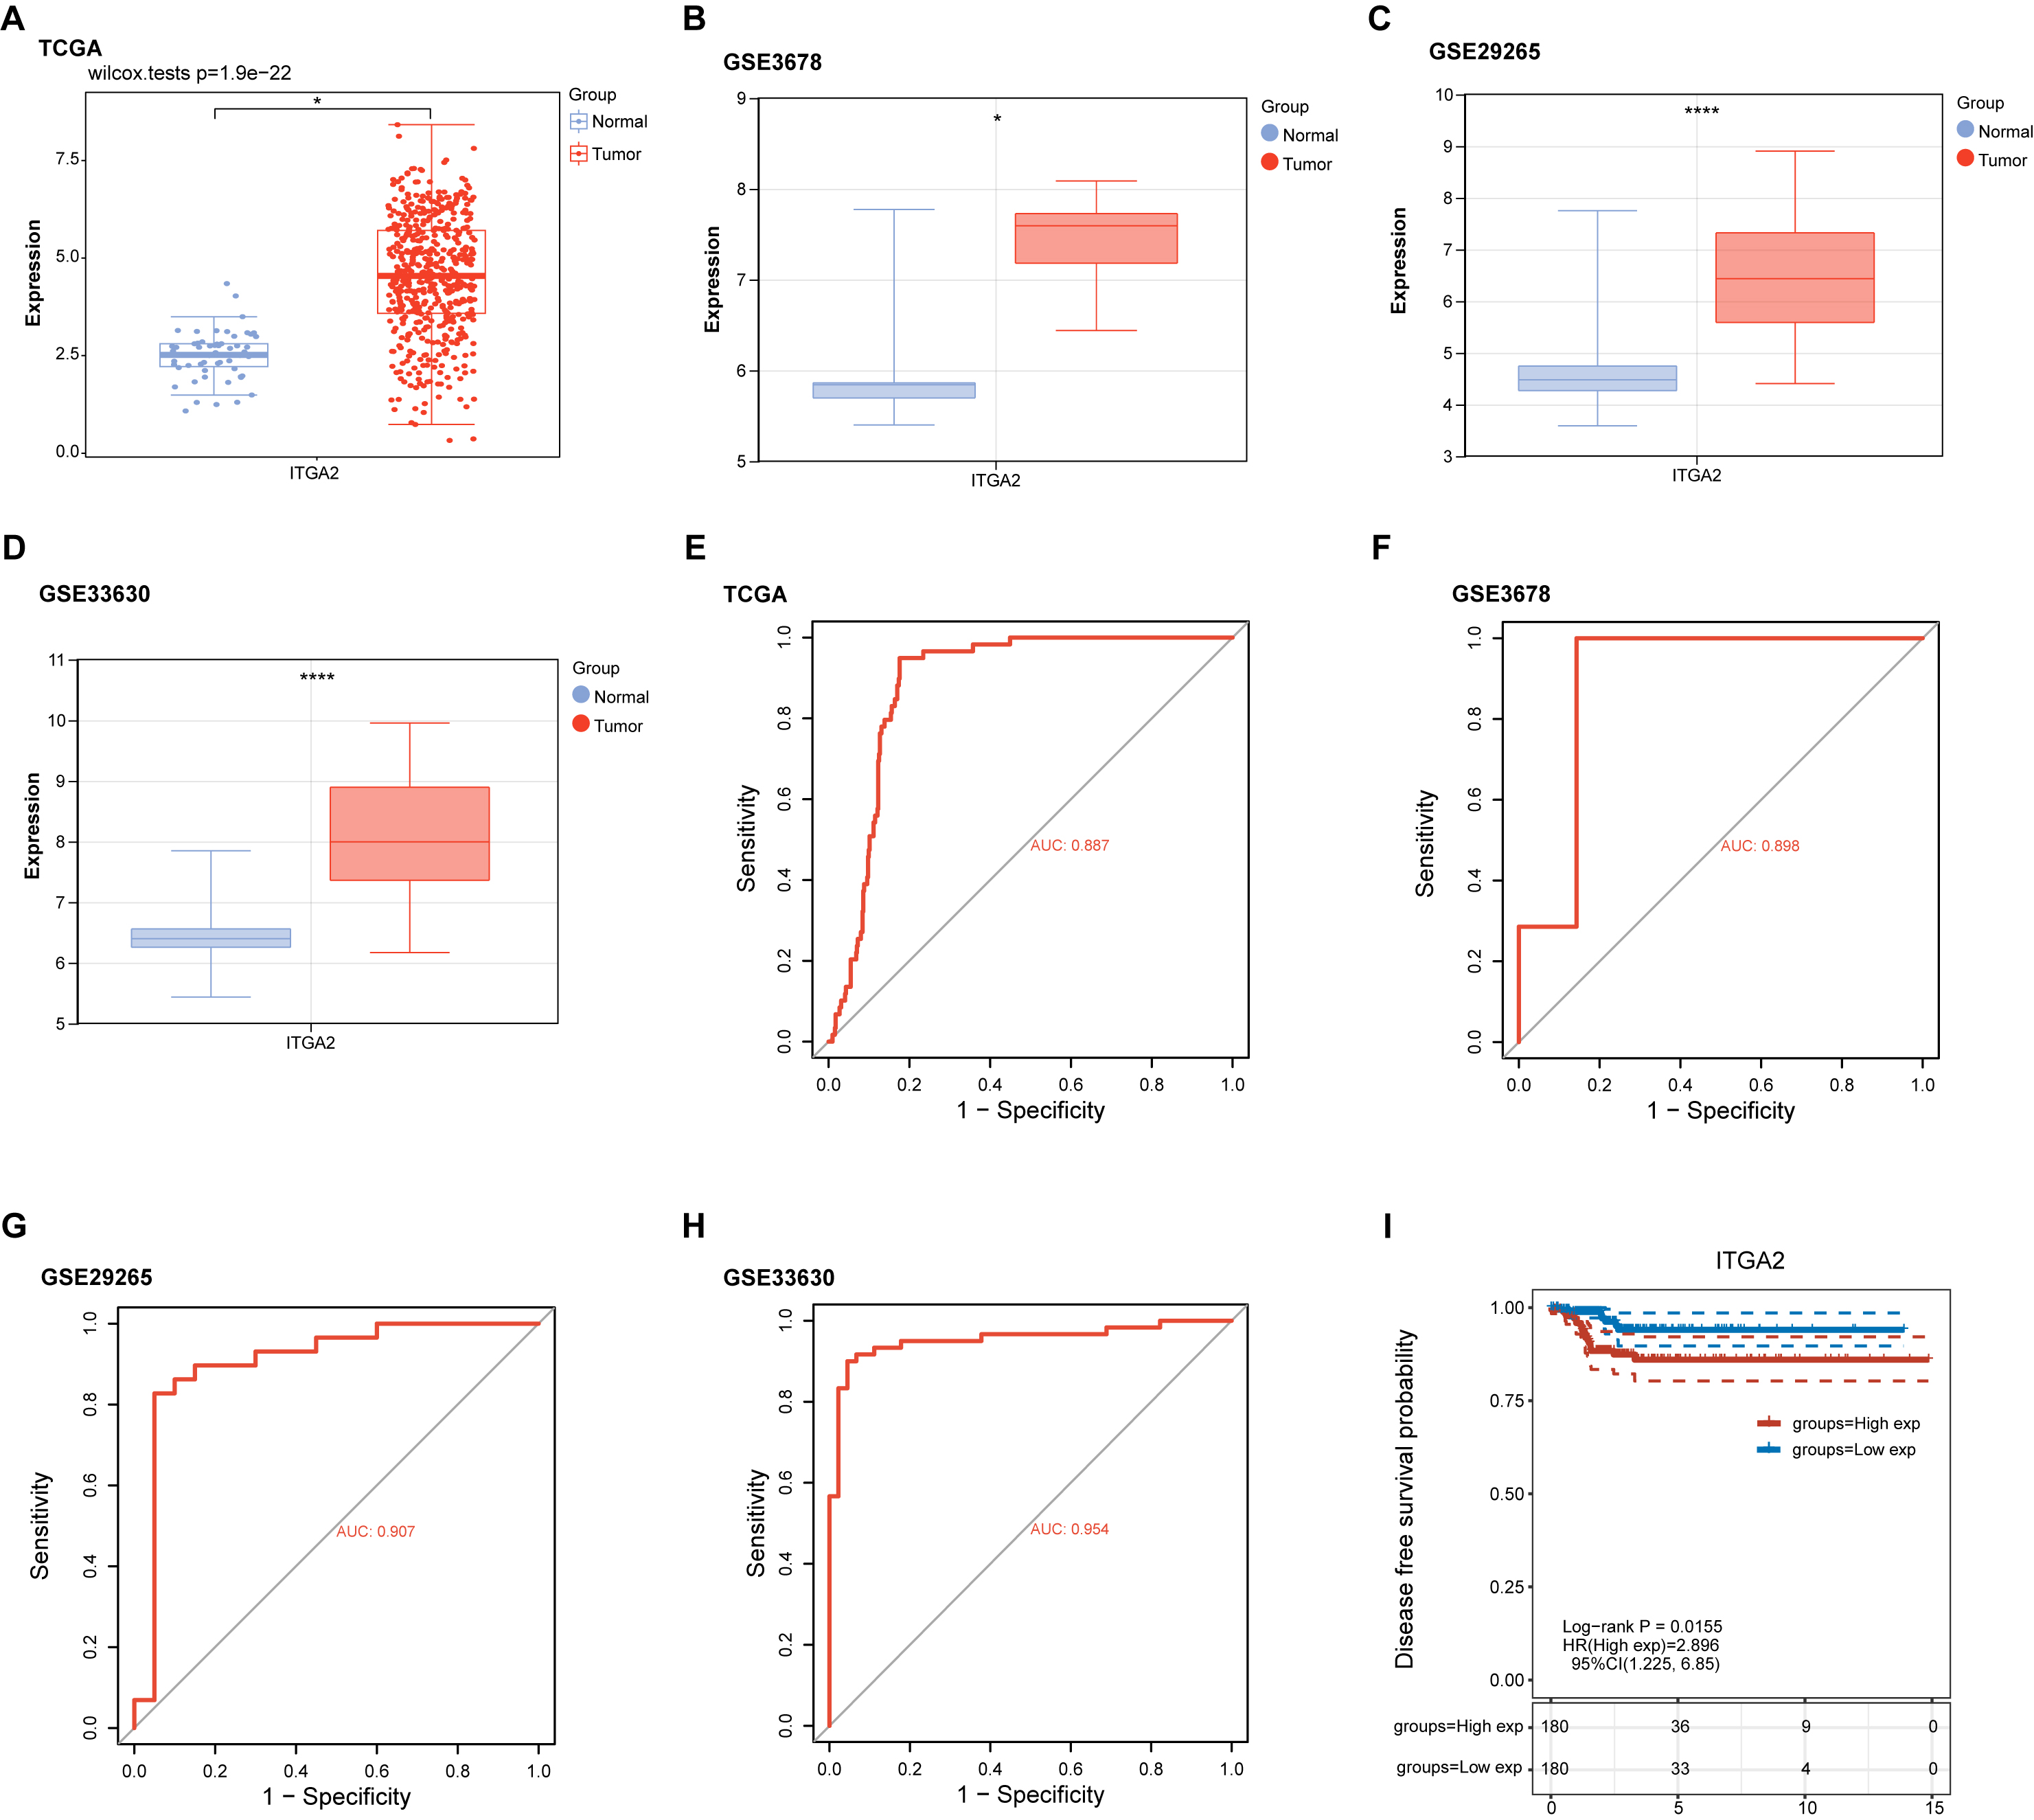 Fig. 4.
Analysis of ITGA2 expression and diagnostic
performance. (A–D) ITGA2 expression level in tumor and control samples
from the TCGA-THCA, GSE3678, GSE29265, and GSE33630 datasets. Red dots represent
tumor samples, and blue dots represent normal samples. *p
qRT-PCR and WB methods were used to investigate ITGA2 expression in TC cell lines TPC-1 and CAL-62, and normal thyroid cells (Nthy-ori3-1). Significant up-regulation of ITGA2 expression was observed in TC cell lines (Fig. 5A–C). Further, qRT-PCR and WB assays confirmed the efficient knockdown of ITGA2 by si-ITGA2-1 in TC cell lines (Fig. 5D–F). Cell viability declined significantly following ITGA2 knockdown in TC cell lines, as shown by the CCK-8 assay (Fig. 5G,H). Therefore, changes in ITGA2 expression were associated with altered biological behavior in TC cells, further supporting the important role of this key gene.
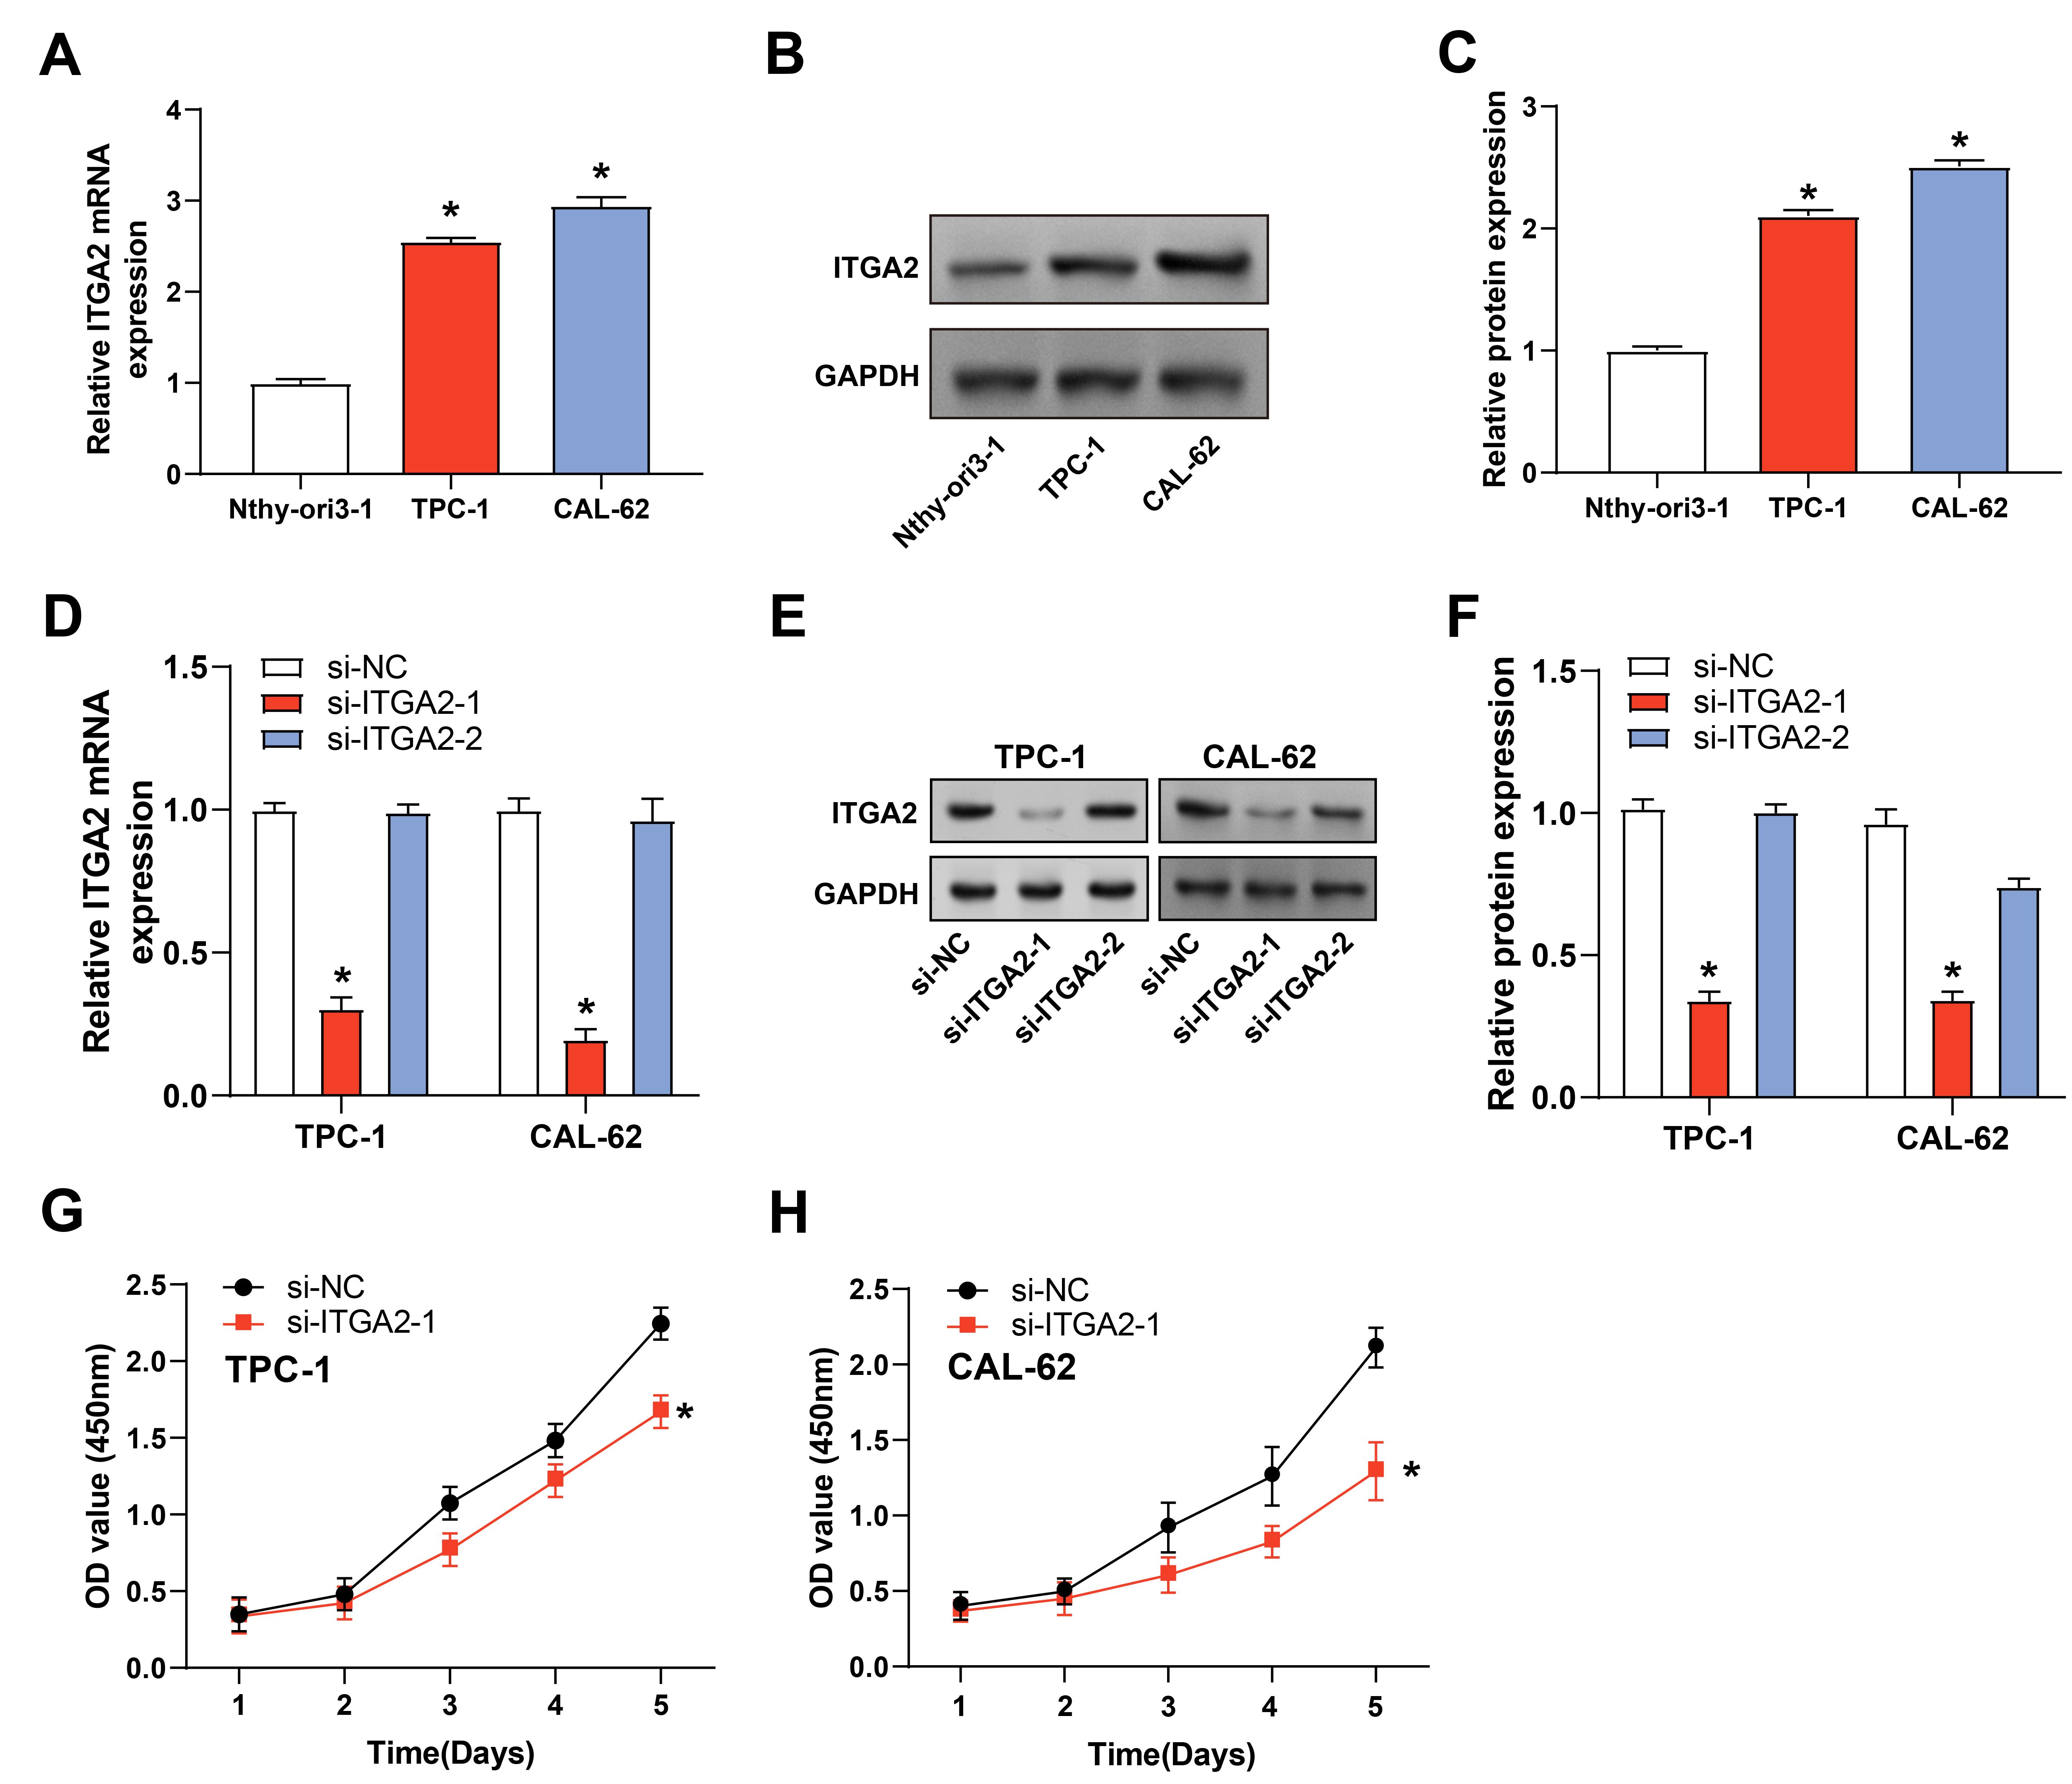 Fig. 5.
Validation of ITGA2 knockdown and its impact on TC cell
viability. (A–C) Relative mRNA (A) and protein (B,C) expression levels of
ITGA2 in Nthy-ori3-1, TPC-1, and CAL-62 cell lines. Data are normalized
to GAPDH and expressed as fold change relative to control. (D–F) Confirmation of
si-ITGA2-1 knockdown efficacy in TC cells via qRT-PCR and WB. Results
were normalized to GAPDH and presented as fold changes relative to the si-NC (n =
3 for each group). (G,H) CCK-8 demonstrated reduced cell proliferation over a
5-day period in TC cells following ITGA2 knockdown. The absorbance at
450 nm (OD value) was measured to assess cell viability. Three independent
experiments present Data as mean
Transwell tests demonstrated that ITGA2 knockdown dramatically decreased the TC cells’ migration and invasion capacity (Fig. 6A,B). Flow cytometry analysis also demonstrated a marked increase in the apoptosis rate of TC cells with silenced ITGA2 (Fig. 6C,D). qRT-PCR analysis showed that ITGA2 knockdown in TPC-1 cells led to up-regulation of the pro-apoptotic genes Caspase-3, Bax, and Caspase-9 and down-regulation of the anti-apoptotic gene Bcl-2 (Fig. 6E). This was further confirmed at the protein level by WB analysis. Cells with ITGA2 knockdown showed significantly reduced expression of anti-apoptotic proteins relative to the control group but increased expression of a pro-apoptotic marker (Fig. 6G,I). In CAL-62 cells, ITGA2 knockdown resulted in a significant up-regulation of Caspase-3 and Bax expression, whereas the changes in Bcl-2 and Caspase-9 expression were not significant compared with the control (Fig. 6F,H,J). This suggests that in CAL-62 cells, ITGA2 knockdown may promote apoptosis mainly by affecting Caspase-3 and Bax, but not through the Bcl-2 and Caspase-9 pathways. We hypothesize that this difference may reflect the diversity of responses to ITGA2 knockdown in different thyroid cancer cell lines or suggest that CAL-62 cells may be more dependent on the Caspase-3 and Bax-mediated apoptotic pathways.
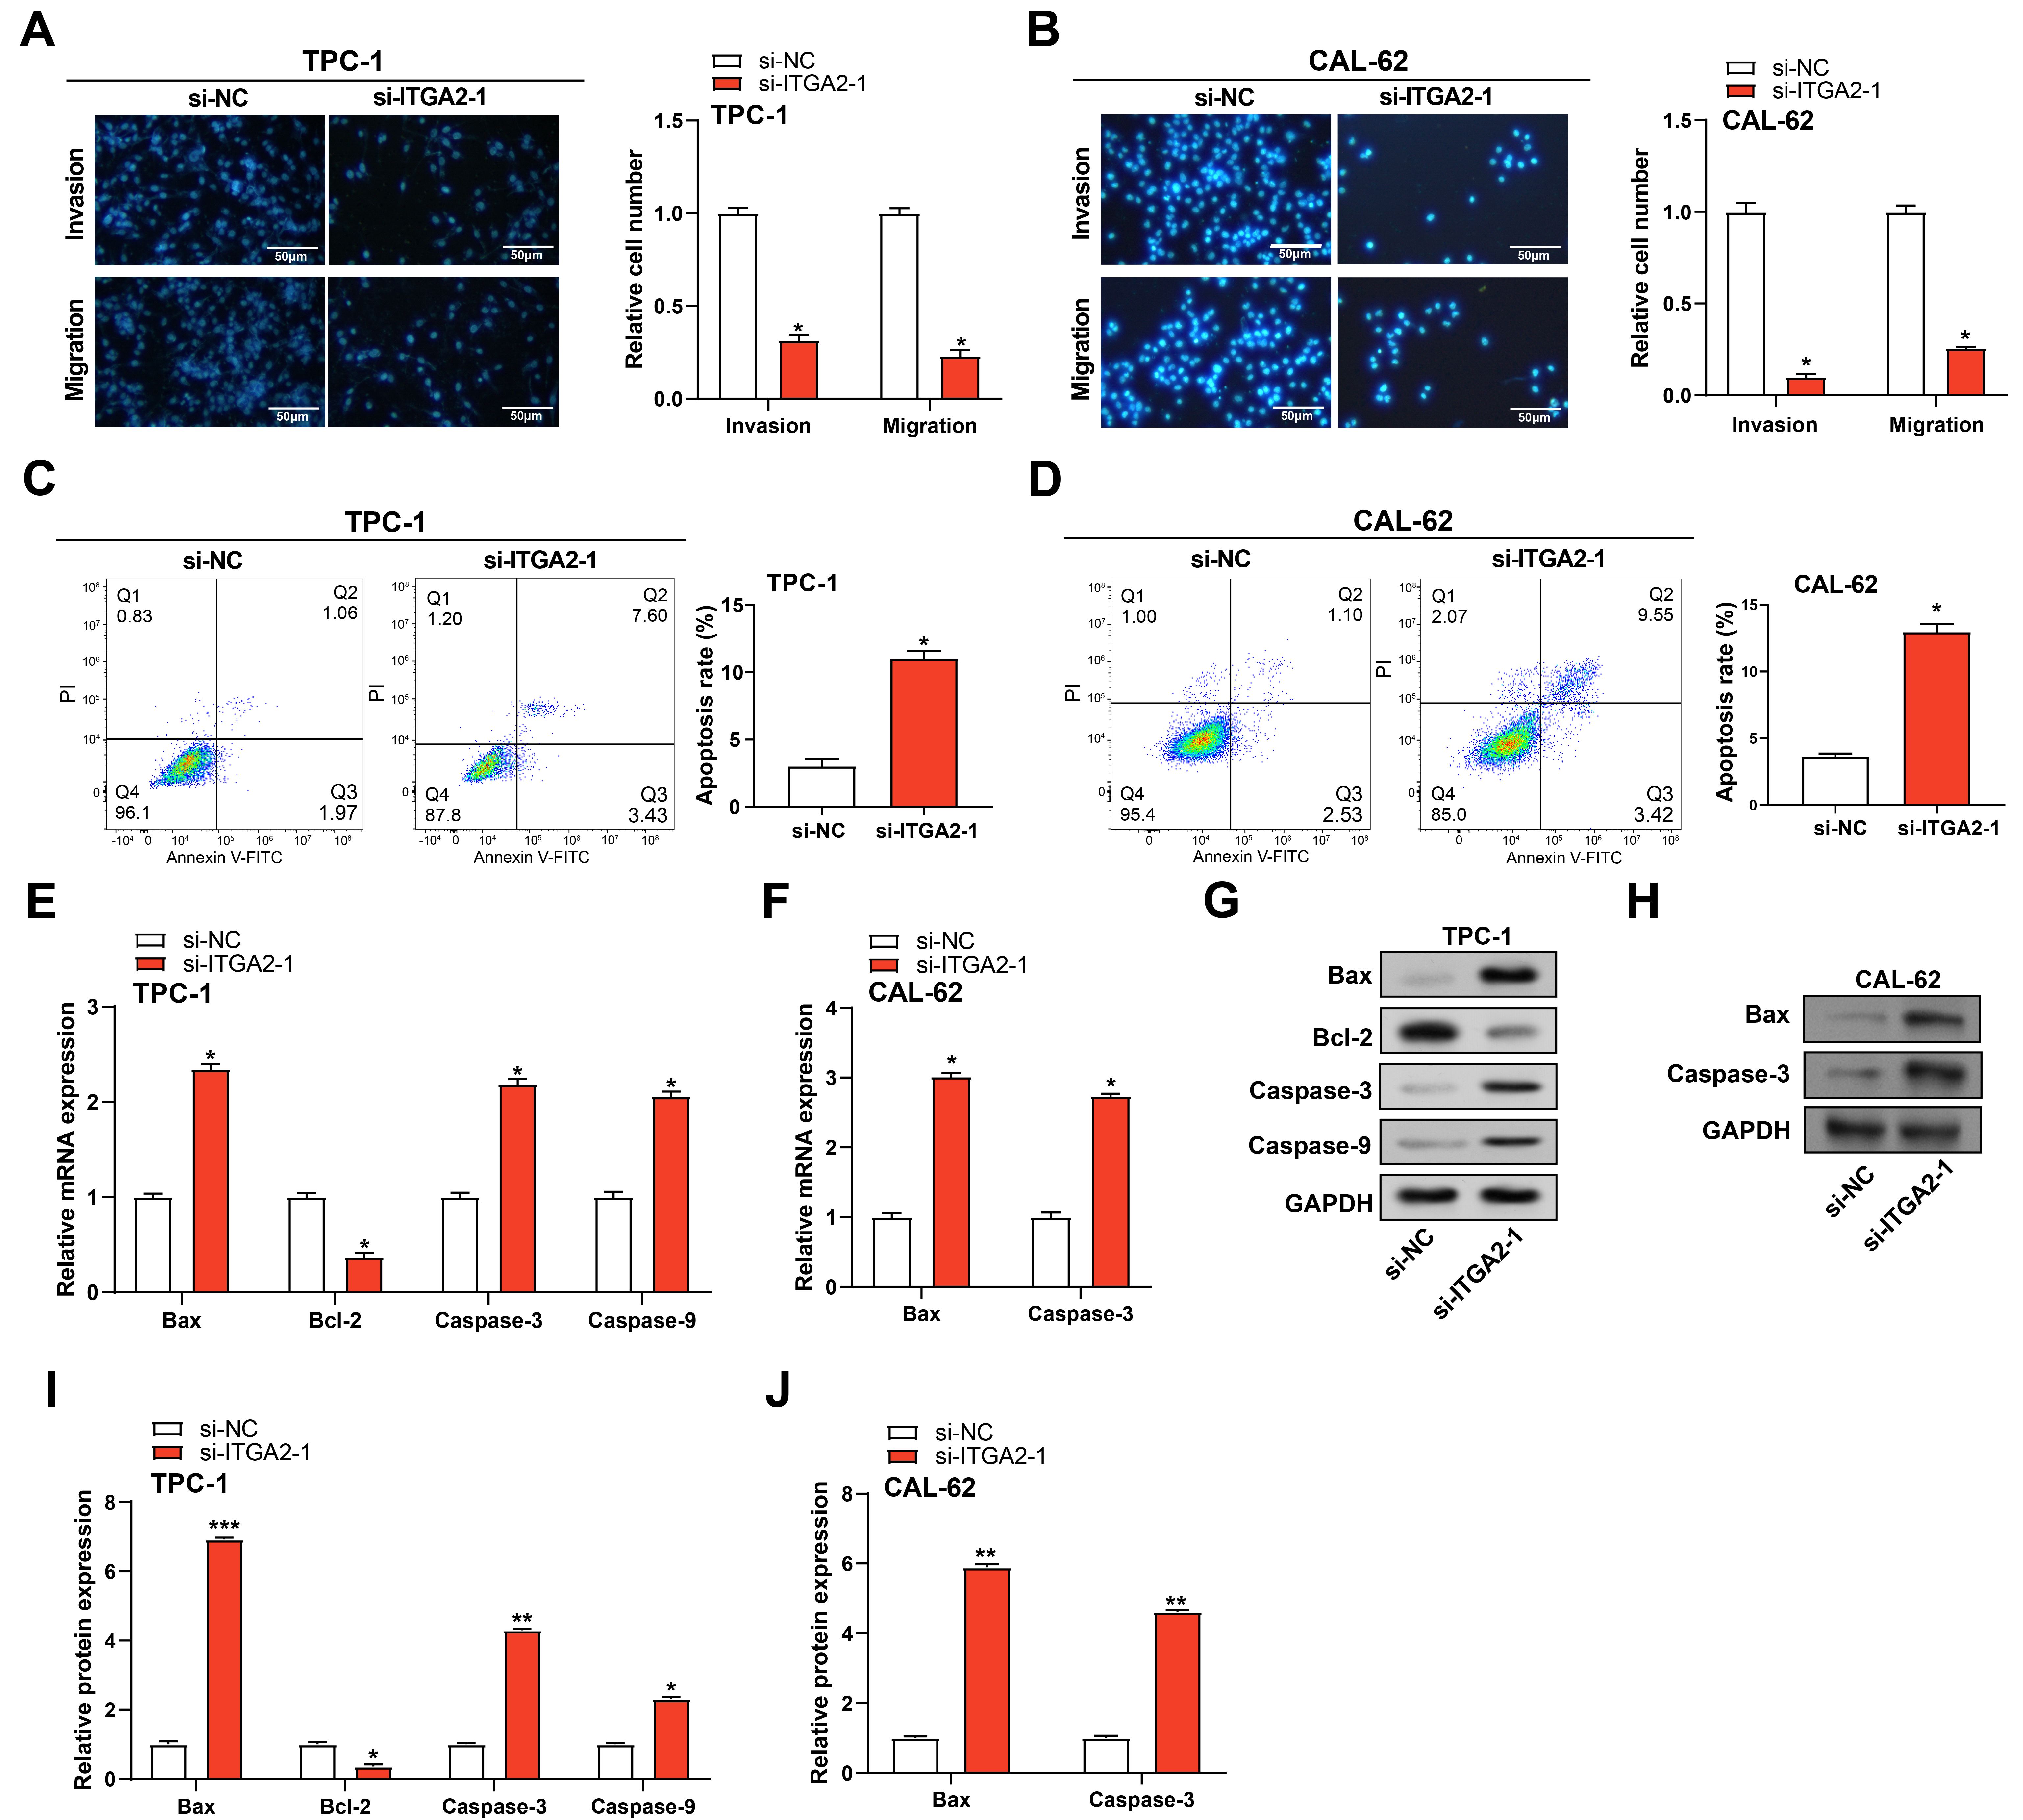 Fig. 6.
Impact of ITGA2 knockdown on cell behavior in TC cell.
(A,B) Transwell test data demonstrating the effect of ITGA2 knockdown
on the migratory and invasion capacities of TC cells (n = 3 per group). The bar
graph represents the average number of cells that migrated or invaded through the
membrane. Scale bar, 50 µm. (C,D) Flow cytometry analysis of apoptosis
rates in TC cells following ITGA2 knockdown (n = 3 per group). The left
panel shows flow cytometry plots, and the right panel presents a quantitative
analysis of the results. (E–J) qRT-PCR and WB were used to detect changes in
mRNA and protein expression of apoptosis-related genes (Bax,
Bcl-2, caspase3, and caspase9) in TPC-1 cells
after knockdown of ITGA2, and changes in mRNA and protein expression of
Bax and caspase3 in CAL-62 cells (n = 3 per group). GAPDH was used as a loading
control and was expressed as fold change relative to si-NC. si-NC, non-targeting
control siRNA; qRT-PCR, quantitative Real-Time Polymerase Chain Reaction; WB,
Western Blot. “*”, “**”, and “***” indicate p
WB analysis showed that the expression of proteins related to apoptosis,
pro-inflammatory cytokines and pyroptosis was significantly changed in TC cell
lines after ITGA2 knockdown. Specifically, the full-length (FL) forms of
PARP and GSDME were reduced. In contrast, the cleaved forms (cleaved-PARP and
GSDME-N), as well as the pro-inflammatory cytokine IL-18, were significantly
up-regulated in the si-ITGA2-1 group as compared to the control group (Fig. 7A–C). In addition, LDH activity in TC cells was notably increased after
ITGA2 knockdown, indicating increased cytotoxicity (Fig. 7D). ELISA
assay also showed that IL-1
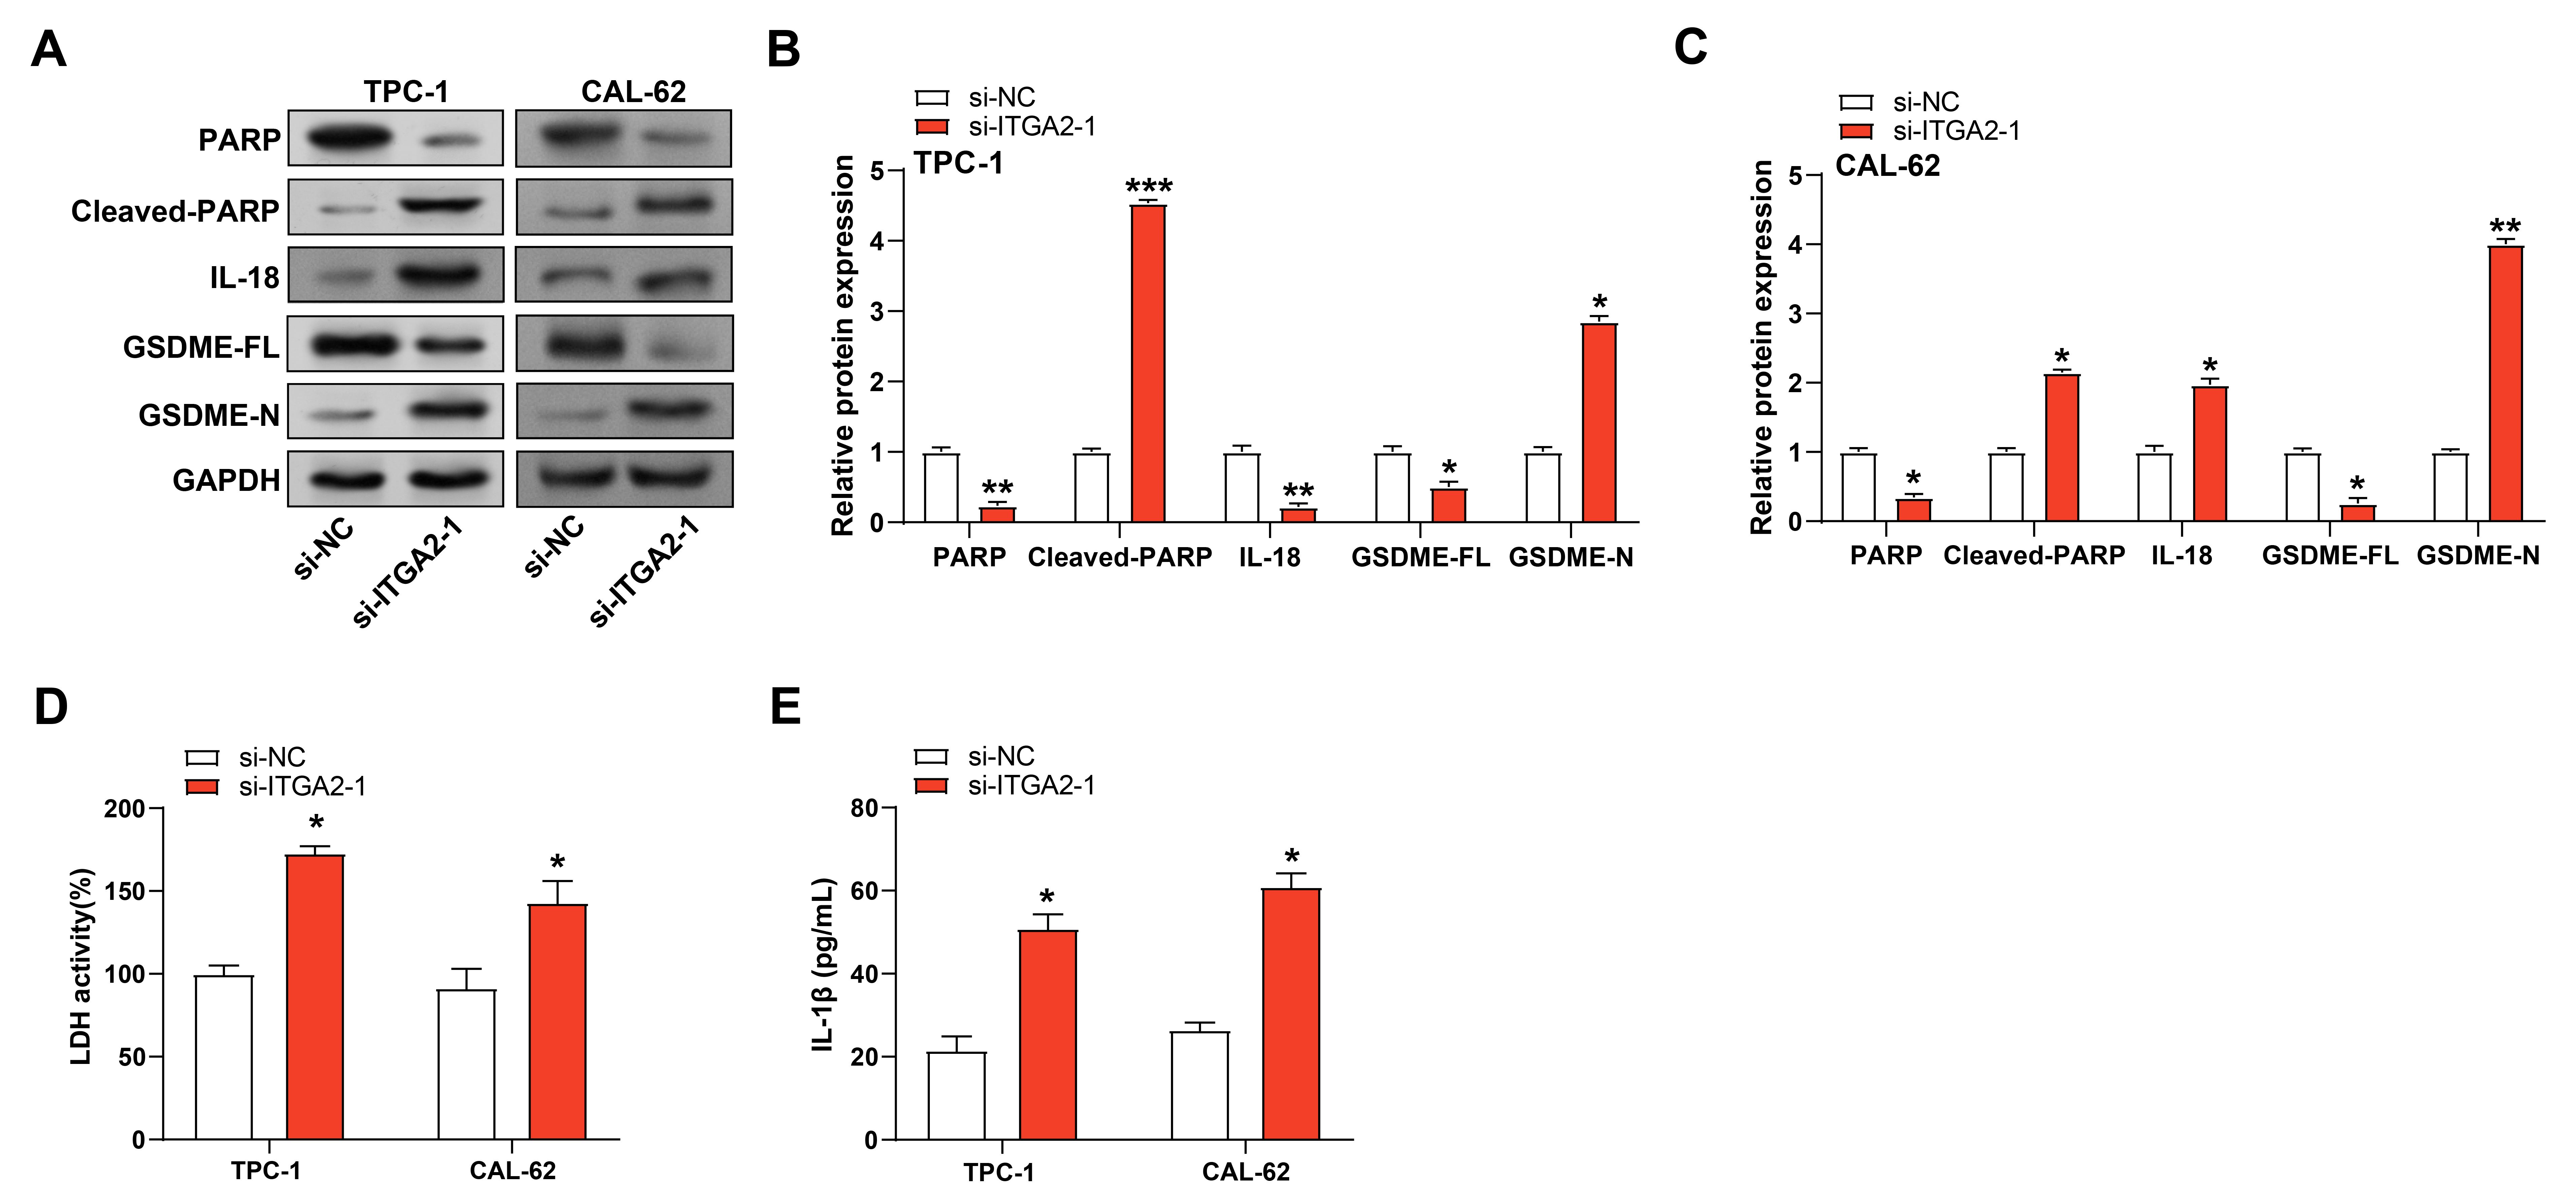 Fig. 7.
ITGA2 knockdown induces apoptosis and pyroptosis in TC
cells. (A–C) qPCR and WB were performed to detect changes in mRNA and protein
expression levels of apoptotic proteins (PARP and cleaved-PARP), pro-inflammatory
cytokines IL-18 and pyroptotic proteins (GSDME-FL and GSDME-N) in TC cells after
knockdown of ITGA2 (n = 3 per group). GAPDH was used as a loading
control. (D) LDH activity assay showing changes in cell membrane integrity and
cytotoxicity in TC cells after ITGA2 knockdown. The bar graph represents
the mean LDH level (n = 3 per group). (E) ELISA measuring IL-1
WB analysis revealed that ITGA2 knockdown significantly upregulated the
expression of key DNA damage response markers (
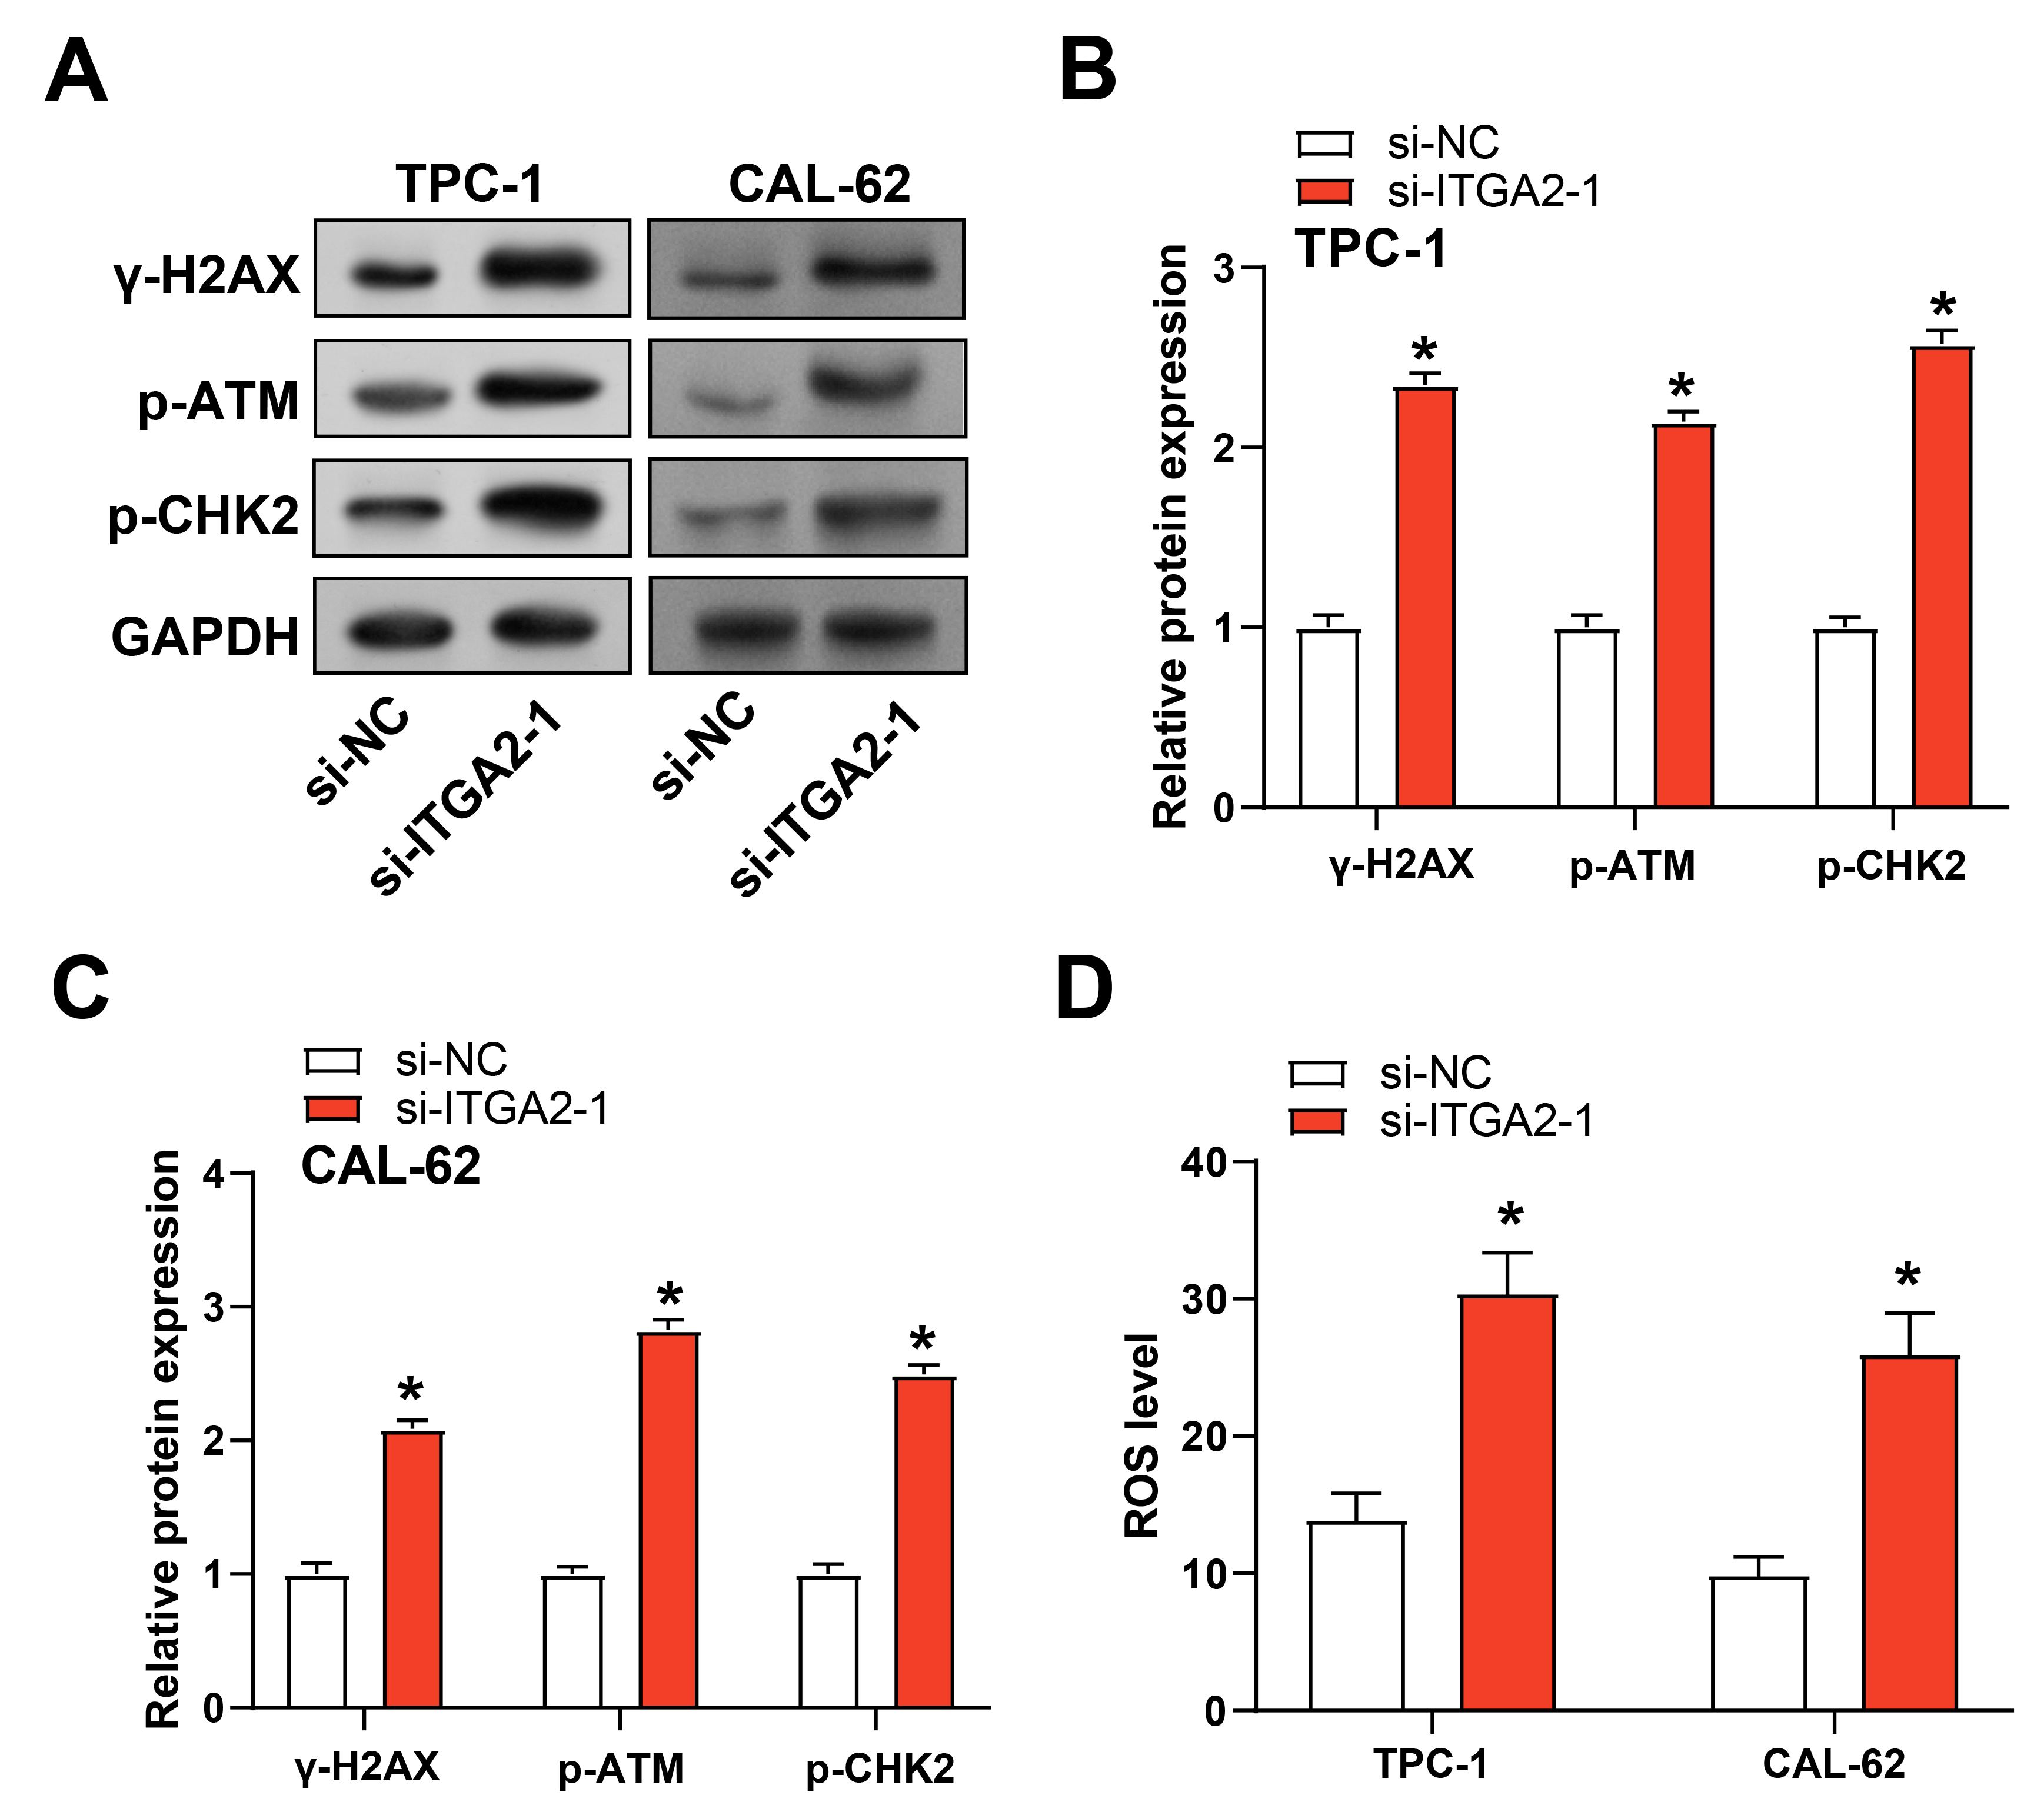 Fig. 8.
ITGA2 knockdown induces DNA damage and ROS production
in TC cells. (A–C) WB analysis of DNA damage-related protein expression
(phosphorylated ataxia telangiectasia mutated (p-ATM), phosphorylated histone
H2AX on serine 139 (
qRT-PCR analysis revealed that ITGA2 knockdown in TC cells
markedly decreased the expression of genes associated with the
Wnt/
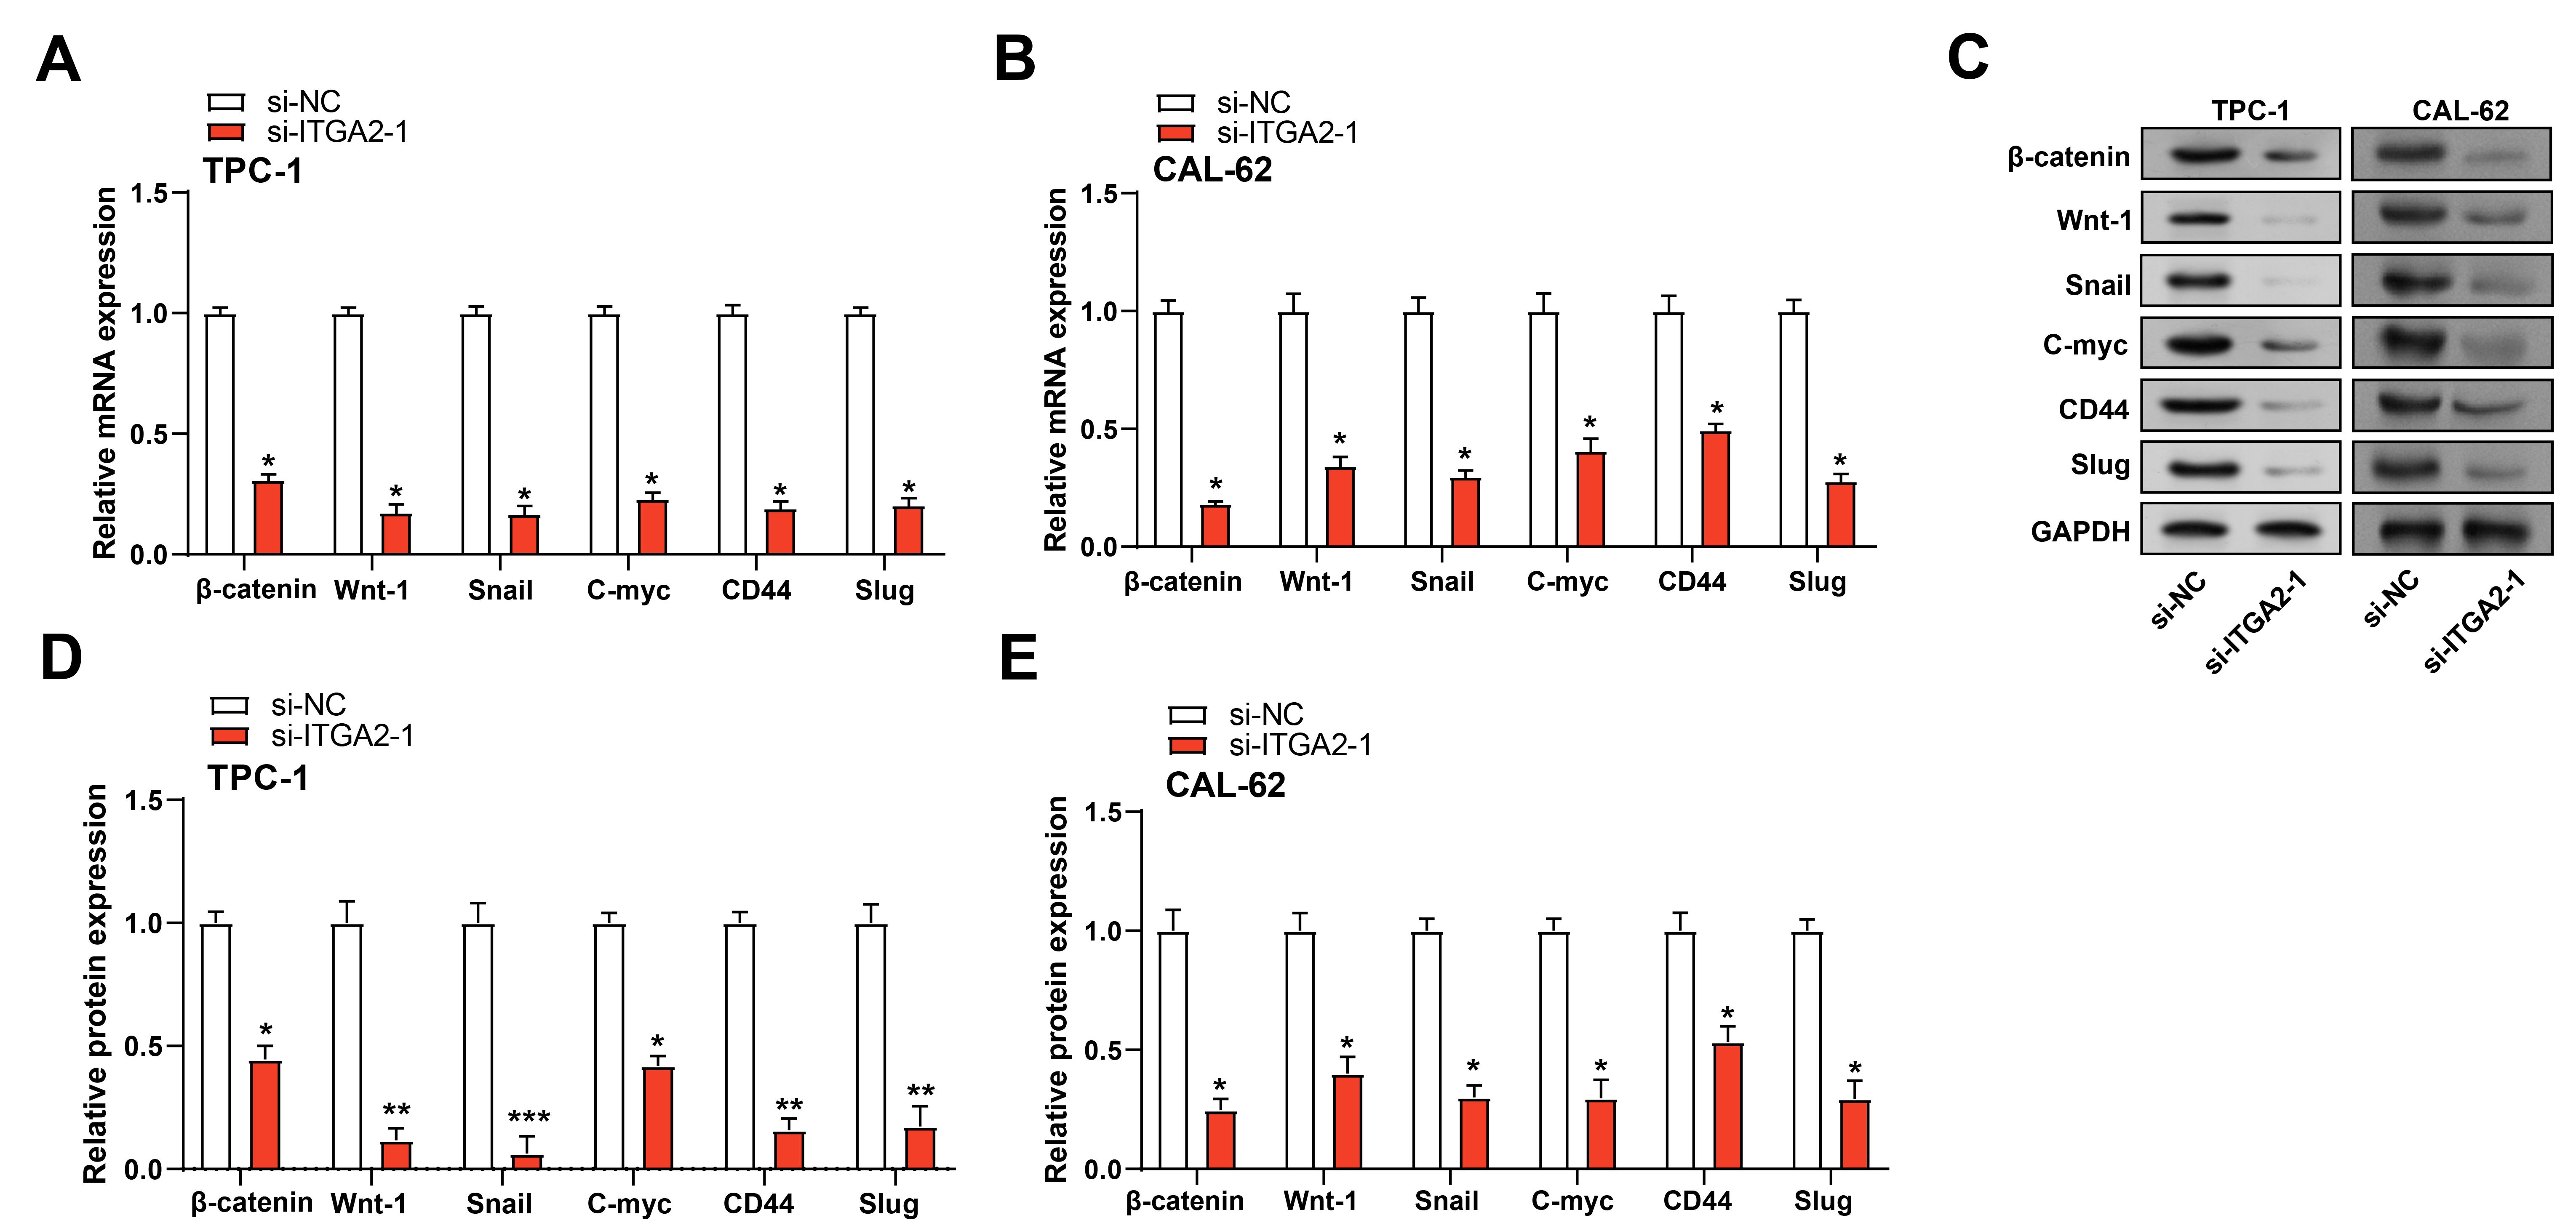 Fig. 9.
Knockdown of ITGA2 inhibits TC stemness by suppressing
the Wnt/
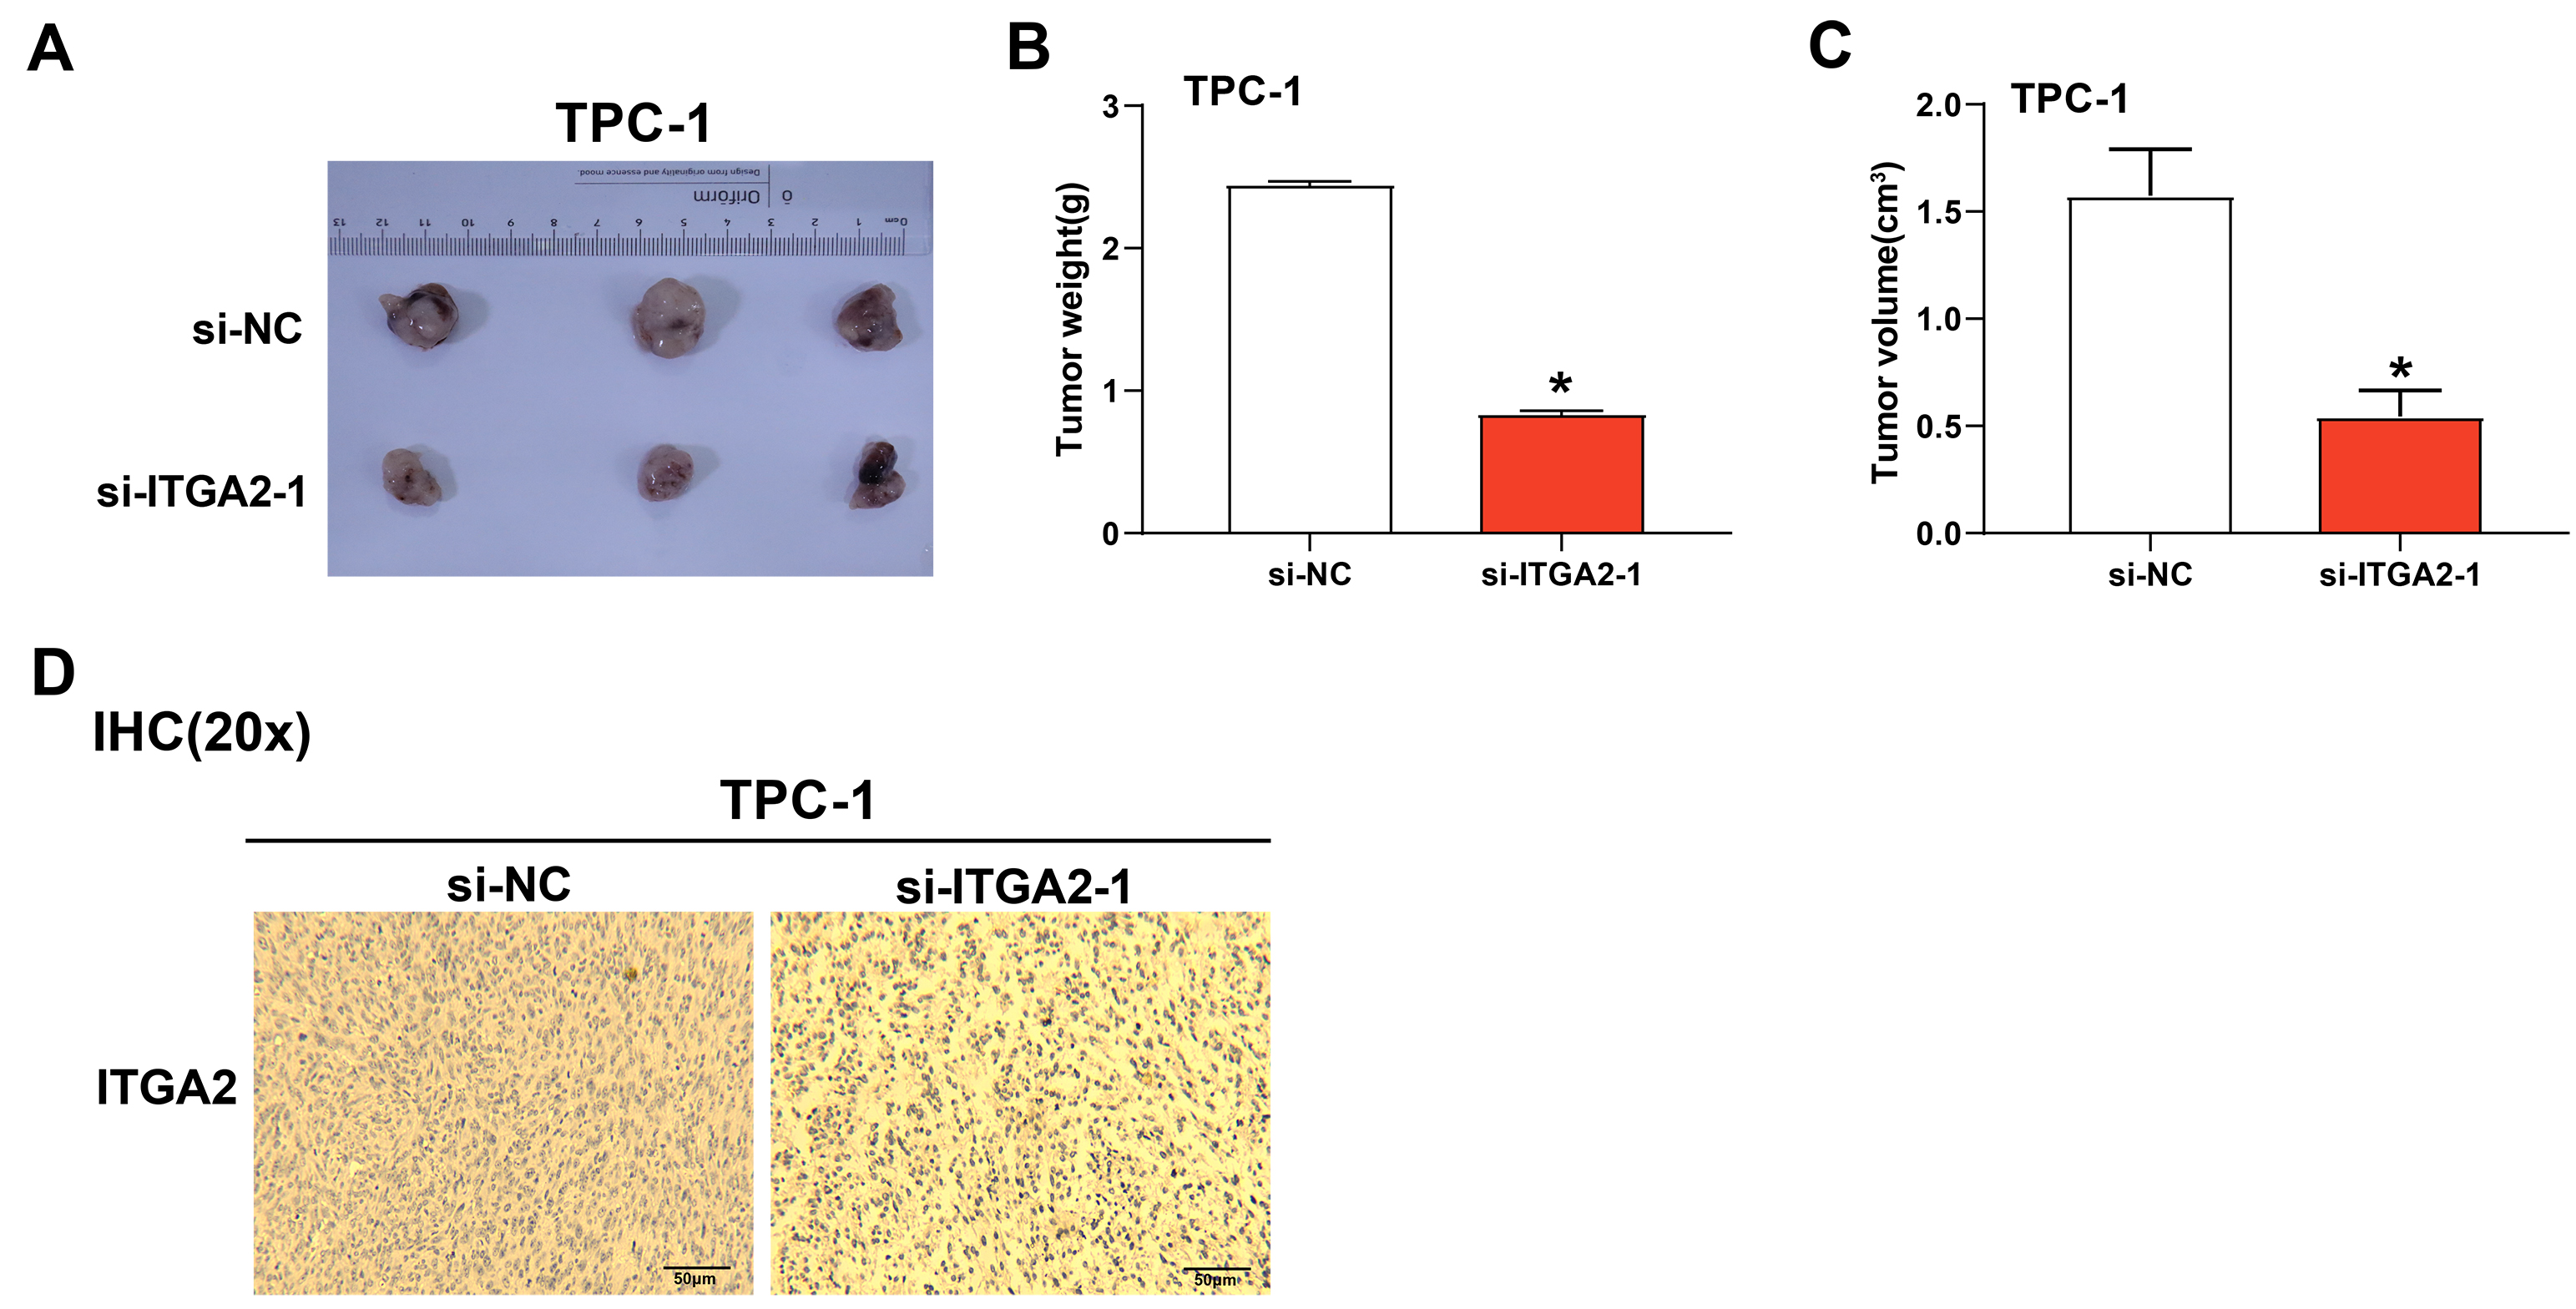 Fig. 10.
ITGA2 knockdown reduced tumor growth in vivo.
(A) Representative images of tumors harvested from nude mice bearing TPC-1 cells
transfected with either si-NC or si-ITGA2-1 (n = 3 per group). (B) Bar
graph showing tumor weights in mice injected with TPC-1 cells transfected with
si-NC or si-ITGA2-1 (n = 5 per group). (C) Bar graph displaying tumor
volumes in mice injected with TPC-1 cells transfected with si-NC or
si-ITGA2-1 (n = 5 per group). (D) IHC analysis of ITGA2 expression in
tumor sections from the in vivo tumorigenesis assay (n = 5 per group).
Scale bar, 50 µm. si-NC, non-targeting control siRNA; IHC,
Immunohistochemistry; Nude mice, immunodeficient mice. “*” indicates p
With a rising prevalence globally, TC is the most common endocrine cancer. The most common kind of TC, papillary thyroid carcinoma (PTC), has few effective treatment options for advanced or metastatic TC, despite advancements in screening and therapy. The discovery of novel therapy targets and prognostic indicators is therefore essential for improving patient survival. Through a bioinformatics analysis of the TCGA-THCA, GSE3678, GSE29265, and GSE33630 datasets, the present study identified three crucial prognostic genes in TC: EFEMP1, EGR2, and ITGA2. EGR2 has become one of the most critical tumor suppressor genes in PTC. Qiu et al. [23] reported that EGR2 shows elevated transcriptional activity in PTC tissues in comparison with normal controls, and is involved in regulating the cell cycle and degradation of the extracellular matrix. EFEMP1 was also identified as another critical player in the progression of PTC. Li et al. [24] reported that EFEMP1 was a hub protein involved in tumor development, with its upregulation correlating with disease progression. The significant expression of EFEMP1 in PTC tissues indicates that it may serve as a target for therapy. Finally, our nomogram analysis identified ITGA2 as a hub gene in TC. Expression analysis confirmed that ITGA2 was significantly overexpressed in tumor samples from the TCGA-THCA, GSE3678, GSE29265, and GSE33630 datasets, thus supporting a role in TC progression. ITGA2 is a transmembrane receptor involved in cell adhesion and migration. As such, it is a potential target for upcoming treatment approaches and may aid in tumor invasion and metastasis.
Apoptosis and pyroptosis represent two different types of programmed cell death.
Apoptosis involves the caspase-3, Bax, Bcl-2, and caspase-9 proteins, which
control mitochondrial permeability and initiate the cell death cascade [25].
Additionally, cleaved-PARP plays a critical role in DNA degradation during
apoptosis [26]. In contrast, pyroptosis is driven by gastrin proteins,
particularly GSDME. These form membrane pores, leading to inflammatory cell death
[27]. While apoptosis typically maintains cellular homeostasis, pyroptosis
triggers a robust immune response due to its inflammatory nature [28]. Several
studies have shown that both apoptotic and pyroptotic pathways can influence
tumor progression in TC. For example, Zhou J et al. [29] showed that
naringin promotes apoptosis by simultaneously increasing the levels of caspase-3,
Bax, and cleaved-caspase-3, while decreasing the levels of anti-apoptotic
proteins such as Bcl-2. Similarly, Zhou X et al. [30] discovered that
downregulating SPTBN2 causes cell cycle arrest by increasing the
expression of cleaved caspase-3 and Bax and decreasing that of Bcl-2, which
results in apoptosis. Importantly, Hu et al. [31] demonstrated that
Alantolactone triggers GSDME-dependent pyroptosis and apoptosis in anaplastic TC, thus highlighting the dual role of cell death pathways in tumor
suppression. The present study further highlights the importance of pyroptosis in
TC. We observed that silencing of ITGA2 inhibited cell growth and
simultaneously induced apoptosis. Moreover, ITGA2 knockdown induced
pyroptosis, as seen by elevated levels of cleaved-GSDME, LDH and IL-1
DNA damage is a critical event that can lead to genomic instability and promote
cancer development. It initiates a cellular response involving essential proteins
such as
Cell migration and proliferation are regulated by the Wnt/
In the discussion section of this study, we first need to address a key issue: the differences in the results of the analysis of the relationship between ITGA2 expression and disease-free survival in thyroid cancer patients by different analytical platforms. While the Clinical BioLetter House platform analysis showed that high ITGA2 expression was significantly associated with lower disease-free survival, the cBioPortal platform did not find a significant association between ITGA2 expression and disease-free survival when analyzed. This discrepancy could be due to several factors, including differences in analysis methods or platform-specific biases. This finding suggests that we must consider the effects of differences in analytical techniques and platforms when interpreting bioinformatics data.
Furthermore, the role of ITGA2 in thyroid cancer cells may be more complex than previously thought. Our results suggest that ITGA2 may play a role in multiple cell death pathways, not only apoptosis. Although WB experiments showed significant changes in the levels of apoptosis-related markers after ITGA2 inhibition, the increase in apoptosis rate was not as substantial as expected. This suggests that ITGA2 may regulate the apoptotic process by affecting multiple signaling pathways rather than direct induction. In addition, we observed that ITGA2 inhibition may involve other types of cell death, such as pyroptosis, which may somewhat mask the increase in apoptosis.
ITGA2 may play different roles in different biological contexts. In some cases, ITGA2 may promote tumor growth primarily by inhibiting apoptosis, whereas in others, it may act through mechanisms such as promoting cell migration or angiogenesis. Our findings highlight the multifaceted nature of ITGA2 in thyroid cancer and the multiple biological processes that may be involved in tumor progression. These findings provide new directions for future studies, including further exploration of the specific mechanisms of ITGA2 in apoptosis regulation and how ITGA2 interacts with other cell death pathways.
In summary, our findings suggest that ITGA2 may play a role in multiple cell death pathways and emphasize the importance of considering differences in analysis methods and platforms when interpreting bioinformatics data. Future studies should include cross-platform data validation and in-depth biological mechanism studies to ensure the accuracy and clinical relevance of the findings.
This study emphasizes the importance of ITGA2 in the development of TC,
as well as its potential as a therapy target. ITGA2 knockdown reduced TC
cell viability, migration, as well as the promotion of apoptosis and pyroptosis.
Furthermore, ITGA2 silencing enhanced the DNA damage response and
increased ROS production, contributing to elevated cellular stress.
ITGA2 knockdown also repressed the Wnt/
The datasets used and analyzed during the current study are available from the corresponding authors upon reasonable request.
Conception and design of the research: LY, DMH, RY, ZLL, and YF. Acquisition of data: LY, DMH, and RY. Analysis and interpretation of data: LY, DMH, RY, JJ, and XSL. Statistical analysis: XSL. Drafting the manuscript: LY, DMH, and RY. Revision of manuscript for important intellectual content: ZLL and YF. All authors contributed to editorial changes in the manuscript. All authors read and approved the final manuscript. All authors have participated sufficiently in the work and agreed to be accountable for all aspects of the work.
Our study is supported by the Animal Welfare and Ethics Committee of the Laboratory Animal Science Department, Fudan University (No. 2024-MHYY-304). All animal experiments were conducted in accordance with the institutional ethical guidelines and complied with the 3R (Replacement, Reduction, Refinement) principles.
Not applicable.
This study was funded by 2024 National Traditional Chinese Medicine Comprehensive Reform Pilot Zone “Advanced Talents in Integrated Traditional Chinese and Western Medicine” Project, Project Number: PDZY-2024-0708.
The authors declare no conflict of interest.
During the preparation of this work the authors used ChatGPT in order to check spell and grammar. After using this tool, the authors reviewed and edited the language of the Introduction and Discussion sections as needed and take full responsibility for the content of the publication.
Supplementary material associated with this article can be found, in the online version, at https://doi.org/10.31083/FBL27946.
References
Publisher’s Note: IMR Press stays neutral with regard to jurisdictional claims in published maps and institutional affiliations.