


1 Department of Infectious Diseases, Qilu Hospital (Qingdao), Cheeloo College of Medicine, Shandong University, 266000 Qingdao, Shandong, China
2 Department of Respiratory and Critical Care Medicine, Qilu Hospital (Qingdao), Cheeloo College Medicine, Shandong University, 266000 Qingdao, Shandong, China
Abstract
Sepsis is a prevalent disease with high mortality involving severe systemic inflammatory responses. Although the mechanisms underlying sepsis have been widely explored, the occurrence and exacerbation of sepsis remain unclear, with limited therapeutic options. Inflammation and mitochondrial oxidative stress have been proposed as primary factors in the development of sepsis.
In the present research, normal and sepsis samples were obtained from the Gene Expression Omnibus (GEO) database (GSE54514, GSE65682, and GSE95233). To identify the key mitochondrial oxidative stress-related gene (MOSRG) signature associated with sepsis, both weighted gene co-expression network analysis (WGCNA) and differential expression analysis were conducted. Least Absolute Shrinkage and Selection Operator (LASSO) analysis and univariate and multivariate Cox analysis were used to construct the prognostic risk model for sepsis. Immune infiltration characteristics were analyzed using the Estimation of STromal and Immune cells in MAlignant Tumor tissues using Expression data (ESTIMATE) and single-sample Gene Set Enrichment Analysis (ssGSEA) algorithms. Single-cell RNA sequencing and in vitro experiments provided additional evidence for the pivotal role of RNA-binding protein, ribonuclease 2 (RNASE2) in the regulation of mitochondrial oxidative stress in sepsis.
Three MOSRGs RNASE2, CX3C chemokine receptor 1 (CX3CR1), and epoxide hydrolase 2 (EPHX2) were recognized as potential diagnostic indicators for sepsis in this study. The immune infiltration analysis provides strong evidence that three biomarkers were linked to immune-related mechanisms involved in the pathogenesis of sepsis. The pivotal role of RNASE2 in regulating mitochondrial oxidative stress during sepsis was confirmed using single-cell RNA-seq analysis and validated by in vitro molecular biology experiments. Inhibition of RNASE2 was found to significantly mitigate mitochondrial oxidative stress injury in sepsis.
This research underscores the significant impact of mitochondrial oxidative stress-related genes on immune regulation in sepsis and highlights the potential therapeutic implications of candidate biomarkers.
Keywords
- sepsis
- mitochondrial oxidative stress
- immune infiltration
- RNASE2
- prognostic risk model
Sepsis is a lethal organ dysfunction syndrome that is accompanied by a systemic inflammation caused by a dysregulated host immune response [1]. It affects millions of people worldwide with high mortality and increasing incidence, representing the major cause of death in critically ill patients [2]. Sustained excessive inflammation and dysfunction across multiple organs are key contributors to the morbidity and mortality associated with sepsis. Early recognition and fluid resuscitation, empiric intravenous antibiotic therapy, source control of infection, achieving hemodynamic stability are the key cornerstones of early management in sepsis [3, 4]. Notably, these therapeutic interventions are not incredibly effective in countering the persistent dysregulation of the host immune response and the subsequent prolonged immunosuppression. There is still no broadly applicable effective clinical treatment for sepsis, and the chronic risk of mortality after sepsis in patients remains unacceptably high [5]. Thus, an improved understanding of the underlying mechanisms in sepsis is warranted to develop new therapeutic strategies for treatment.
Mitochondria are increasingly implicated as a critical factor in sepsis pathogenesis. Numerous investigations have provided insights into the mitochondrial dysfunction is tightly associated with sepsis-induced organ dysfunction [6, 7]. Mitochondria are the crucial membrane-bound organelles involved in cellular metabolism, reactive oxygen species (ROS) generation, energy generation and Ca2+ homeostasis. The excessive ROS generation by mitochondria is suggested to be a pivotal issue of the high metabolic burden during sepsis, which progressed into organ dysfunction [8]. The clinical evidence has been well established that a state of severe oxidative stress is encountered in sepsis patients, marked by elevated concentrations of free radicals and lipid peroxidation products, along with a reduction in antioxidant defenses [9]. It has been stated that mitochondria oxidative stress was the hub of innate immune signals and inflammation during sepsis [10]. Previous studies documented that mitochondrial dysfunction mediated a vicious hyperinflammation cycle through catalyzing generation of ROS, insufficient energy production, and cellular metabolic disorders to promote oxidative damage in sepsis [11, 12]. Literature showed that ROS generation by mitochondria could modulate inflammatory responses by activating multiple signal transduction cascades, which is essential for regulating immune responses against pathogens [13]. It was assumed that mitochondrial oxidative stress may modulate inflammation responses in the development of sepsis. Thus, understanding the role of mitochondrial oxidative stress and immune in the pathophysiologic mechanism of sepsis is paramount to the detection, treatment and prognosis of sepsis.
Comprehensive bioinformatics methods provide an opportunity to identify effective biomarkers for disease diagnosis, prognosis, prevention, and to better unravel the underlying molecular mechanisms of sepsis [14]. Hence, there is a compelling need to investigate the role of mitochondrial oxidative stress-related gene (MOSRG) involved in sepsis, greatly facilitating therapeutic decisions for sepsis diagnosis, treatment and prognostic prospects. In the current study, we successfully identified 59 differentially expressed MOSRG (DE-MOSRG) between normal and sepsis samples using public databases. Additionally, a prognostic risk model was constructed to indicate the clinical traits and prognostic outcomes in sepsis based on DE-MOSRG. Immune infiltration characteristics analyses and single-cell sequencing results further indicated a possible connection between the DE-MOSRG signature and immune infiltration in sepsis. This study aims to explore the accurate and faithful candidate biomarkers for sepsis early diagnosis and treatment.
Based on the Gene Expression Omnibus (GEO) database (https://www.ncbi.nlm.nih.gov/), three transcriptomic datasets (GSE54514, GSE65682, and GSE95233) including normal control (NC) and sepsis (SP) samples were retrieved and downloaded. Gene annotation was performed using the corresponding platform annotation files with Perl scripts. To correct for batch effects and normalize expression data across datasets, the “sva” package was employed within the R environment. Following the exclusion of sepsis samples lacking prognostic data, 100 NC samples and 479 SP samples remained for subsequent analyses.
To identify sepsis clinical phenotypes associated with gene modules, the “WGCNA”
R package was utilized to build a weighted gene co-expression network. First, we
selected the 5000 most significantly ranked genes with the highest variance
across all samples from the input gene expression matrix to enhance computational
efficiency. Next, we chose a soft-threshold power to ensure the scale-free
topology of the network. By following the scale-free topology criterion, an
appropriate soft threshold was determined by calculating the network topology fit
index (R2) for different power values, selecting the minimum power where
R2
Using the GeneCard database (https://www.genecards.org/), we identified a series
of MOSRG for further exploratory analysis (Supplementary Table 1). A
differential expression threshold was set at
In addition, using the STRING database, we predicted protein-protein interactions (PPI) between different genes (https://string-db.org/).
With the “survival” R package univariate Cox regression analysis was made,
based on the expression patterns of the MOSRG signature and the clinical
prognosis data of sepsis samples to identify MOSRG signatures associated with
sepsis prognosis. A Least Absolute Shrinkage and Selection Operator (LASSO)
function model was constructed using the “glmnet” R script to determine
prognostic MOSRG signature variables, followed by multivariate Cox analysis to
calculate the risk coefficients for each signature variable. Based on the
prognostic variable risk coefficients and expression levels, we built the MOSRG
score for each SP and developed the MOSRG scoring model. The MOSRG score formula
is as follows: MOSRG score = CX3C chemokine receptor 1 (CX3CR1)
Using clinical baseline data of SP and the MOSRG scoring signature, we performed both multivariate and univariate Cox analyses by “survminer” R script to assess the independent prognostic significance in predicting the clinical outcomes. By conducting “rms” R script, we constructed a diagnostic nomogram incorporating clinical-pathological characteristics and the MOSRG score to estimate survival probabilities of the samples. Calibration curves and the concordance index (C-index) were created using the “regplot” and “pec” R scripts to assess the reliability of the nomogram diagnostic model and the accuracy of each variable. Using the “ggDCA” R script, we plotted the decision curve analysis (DCA) for different clinical-pathological characteristics, the nomogram model, and the MOSRG score.
Using the “ConsensusClusterPlus” R script, we classified the sepsis samples based on the “K-means” algorithm with a classification range of k = 2 to 9. The optimal classification was determined based on the delta area curve and consensus cumulative distribution function (CDF) curve results. Clinical survival curves for the 28-day outcomes of the molecular subgroups of SP were plotted using the “survival” R script. We assessed the immune score and Estimation of STromal and Immune cells in MAlignant Tumor tissues using Expression data (ESTIMATE) score using the “estimate” R package. To quantify immune infiltration status, single-sample Gene Set Enrichment Analysis (ssGSEA) analysis was conducted using the “Gene Set Variation Analysis (GSVA)” R package, with marker genes for 23 immune cell types. Additionally, using the reference gene list for KEGG signaling pathways, we utilized the “GSVA” R script to calculate the differential regulated signaling pathways.
The single-cell RNA sequencing (scRNA-seq) dataset GSE167363, comprising data from sepsis patients, was retrieved from the GEO database for this study [15] (https://www.ncbi.nlm.nih.gov/). Following the exclusion of samples that did not meet inclusion criteria, peripheral blood mononuclear cells (PBMCs) from 2 healthy controls (HCs) and 5 SPs were selected for downstream analysis. First, the raw data underwent quality control processing using the “Seurat” package in R (v4.0.5, Satija Lab, New York, NY, USA), filtering cells with gene counts between 200 and 5000 and mitochondrial gene content below 10%, while removing low-expressed genes. The dataset was normalized via the “LogNormalize” method, followed by selection of the 2000 most variable genes. To control for batch effects across different experimental conditions, we applied the FindIntegrationAnchors and IntegrateData functions to integrate the samples. After data normalization, principal component analysis (PCA) was performed to reduce data dimensionality, selecting the top 20 principal components for cell clustering. A K-nearest neighbor (KNN) graph was constructed using the FindNeighbors and FindClusters functions for clustering, and cell population distribution was visualized using t-distributed Stochastic Neighbor Embedding (t-SNE) and Uniform Manifold Approximation and Projection (UMAP) algorithms. Cell types were annotated using the SingleR algorithm and known marker genes, leading to the cell subpopulation identification such as Natural Killer (NK) cells, platelets, monocytes, and neutrophils. Finally, we further analyzed and displayed their expression distribution of prognostic-related genes using VlnPlot and FeaturePlot.
The cell line RAW264.7 was validated through short tandem repeat (STR) profiling and confirmed to be free of mycoplasma contamination. RAW264.7 murine macrophages (obtained from the Shanghai Cell Bank, Chinese Academy of Sciences, Shanghai, China) were cultured in Dulbecco’s Modified Eagle Medium (DMEM; Cat# C11995500BT, Beyotime Biotechnology, Shanghai, China) supplemented with 10% heat-inactivated fetal bovine serum (FBS, Cat# 164210-50, Tianhang Bio, Shaoxing, China), 100 U/mL penicillin and 100 µg/mL streptomycin (Cat# C0222, Beyotime Biotechnology, Shanghai, China). Cells were incubated at 37 °C in a humidified atmosphere containing 5% CO2, and the medium was refreshed every 2–3 days to maintain optimal growth conditions.
RAW264.7 cells were cultured in DMEM and seeded in 6-well plates at a density of
2
Cells were seeded in 6-well plates at a density of 1
Cells were plated in a 6-well plate at a density of 1
Cells were harvested, homogenized with Radio-Immunoprecipitation Assay (RIPA) lysis buffer, centrifuged to collect the supernatant. Detection was performed following the instructions provided with the MDA kit (Cat# S0131S, Beyotime, Shanghai, China). Main steps included mixing samples with working solution, incubating at 37 °C, centrifuging, and measuring absorbance of the supernatant. Absorbance was quantified at a wavelength of 530 nm, and MDA concentration was determined.
The levels of IL-1
Cells were seeded at a density of 5000 cells per well in 96-well plates and incubated overnight to allow adherence. 10 µL of Cell Counting Kit-8 (CCK-8) solution (Cat# C0037, Beyotime, Shanghai, China) was added to each well followed by 2 hours incubation. Absorbance of each well was measured at 450 nm. After the blank control absorbance comparison, cell viability was calculated.
Cells were harvested and lysed using an appropriate volume of RIPA lysis buffer,
and centrifuged to collect the supernatant. Protein samples were resolved using
electrophoresis on a 10% sodium dodecyl sulfate - polyacrylamide gel electrophoresis (SDS-PAGE) gel, followed by transfer of the separated
proteins to a polyvinylidene fluoride (PVDF) membrane (Cat# IPVH00010, Millipore, Darmstadt, Germany).
After 1 hour block with 5% non-fat milk in (Tris-buffered saline containing
0.1% Tween-20 (TBS-T), Cat# P1379, Sigma-Aldrich, St. Louis, MO, USA, pH 7.4),
the membrane was incubated with RNASE2 antibody (1:1000, A9949, ABclonal, Wuhan,
China) and
Statistical analyses were conducted using Perl software (v5.30.0; The Perl
Foundation, Walnut, CA, USA), R software (v4.3.1; The R Foundation for
Statistical Computing, Vienna, Austria), GraphPad Prism (v9.5.0; GraphPad
Software, San Diego, CA, USA) and SPSS 17.0 (SPSS Inc., Chicago, IL, USA). All
experiments were independently repeated three times to ensure data accuracy and
reproducibility. For comparisons between two groups, the unpaired
Student’s t-test was used for normally distributed data, while the
Wilcoxon rank-sum test was applied for non-normally distributed data. For
comparisons among more than two groups, one-way analysis of variance (ANOVA)
followed by Tukey’s multiple comparisons test was conducted. The normality test
is performed using the “shapiro.test” function in the R language. Correlation
analysis was performed using Pearson’s correlation coefficient to assess the
relationship between MOSRG scores and immune cell infiltration levels. Multiple
testing corrections were applied using the Benjamini-Hochberg method, and
adjusted p-values
To uncover critical gene modules linked to sepsis, we integrated three GEO
datasets and extracted data from 100 NC samples and 479 SP samples with 28-day
survival prognosis information to construct the WGCNA model. According to the
gene expression matrix, we performed clustering analysis using a dendrogram to
identify and exclude outlier samples (Fig. 1A). With a soft-thresholding power
(
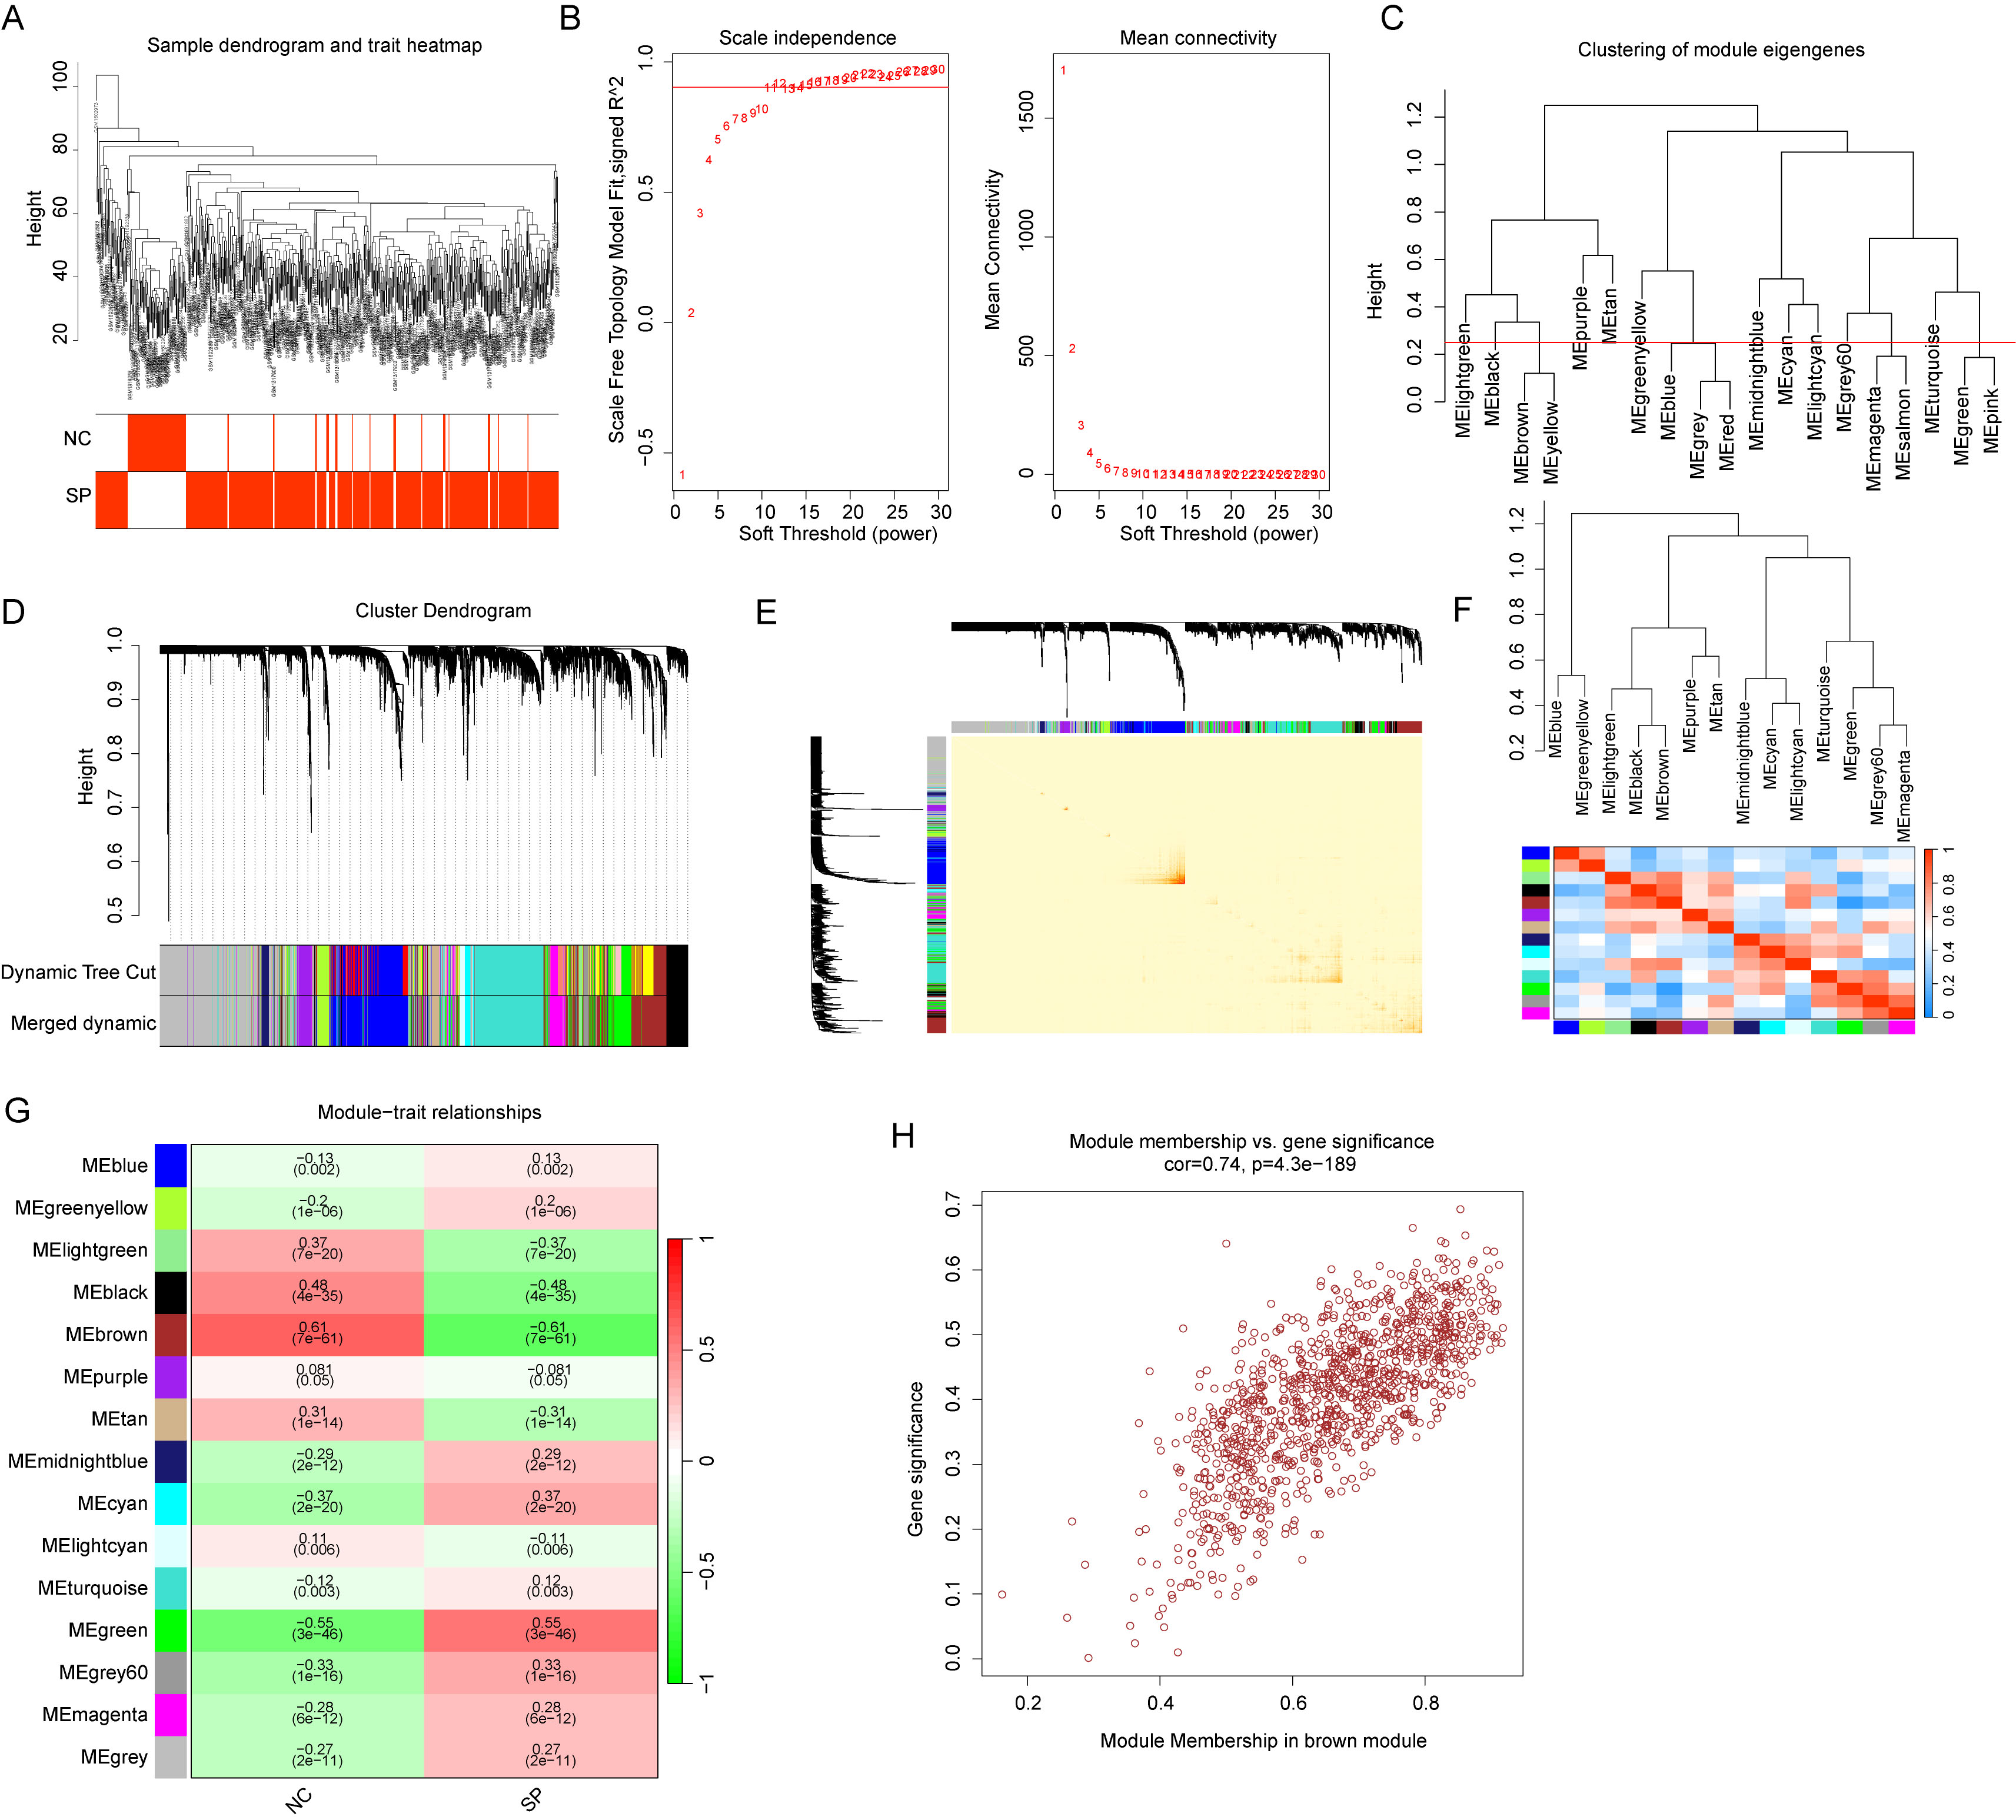 Fig. 1.
WGCNA-based identification of key gene modules correlated with
clinical traits. (A) Clustering analysis of samples. (B) Determination of the
soft-thresholding power (
Using a differential threshold of
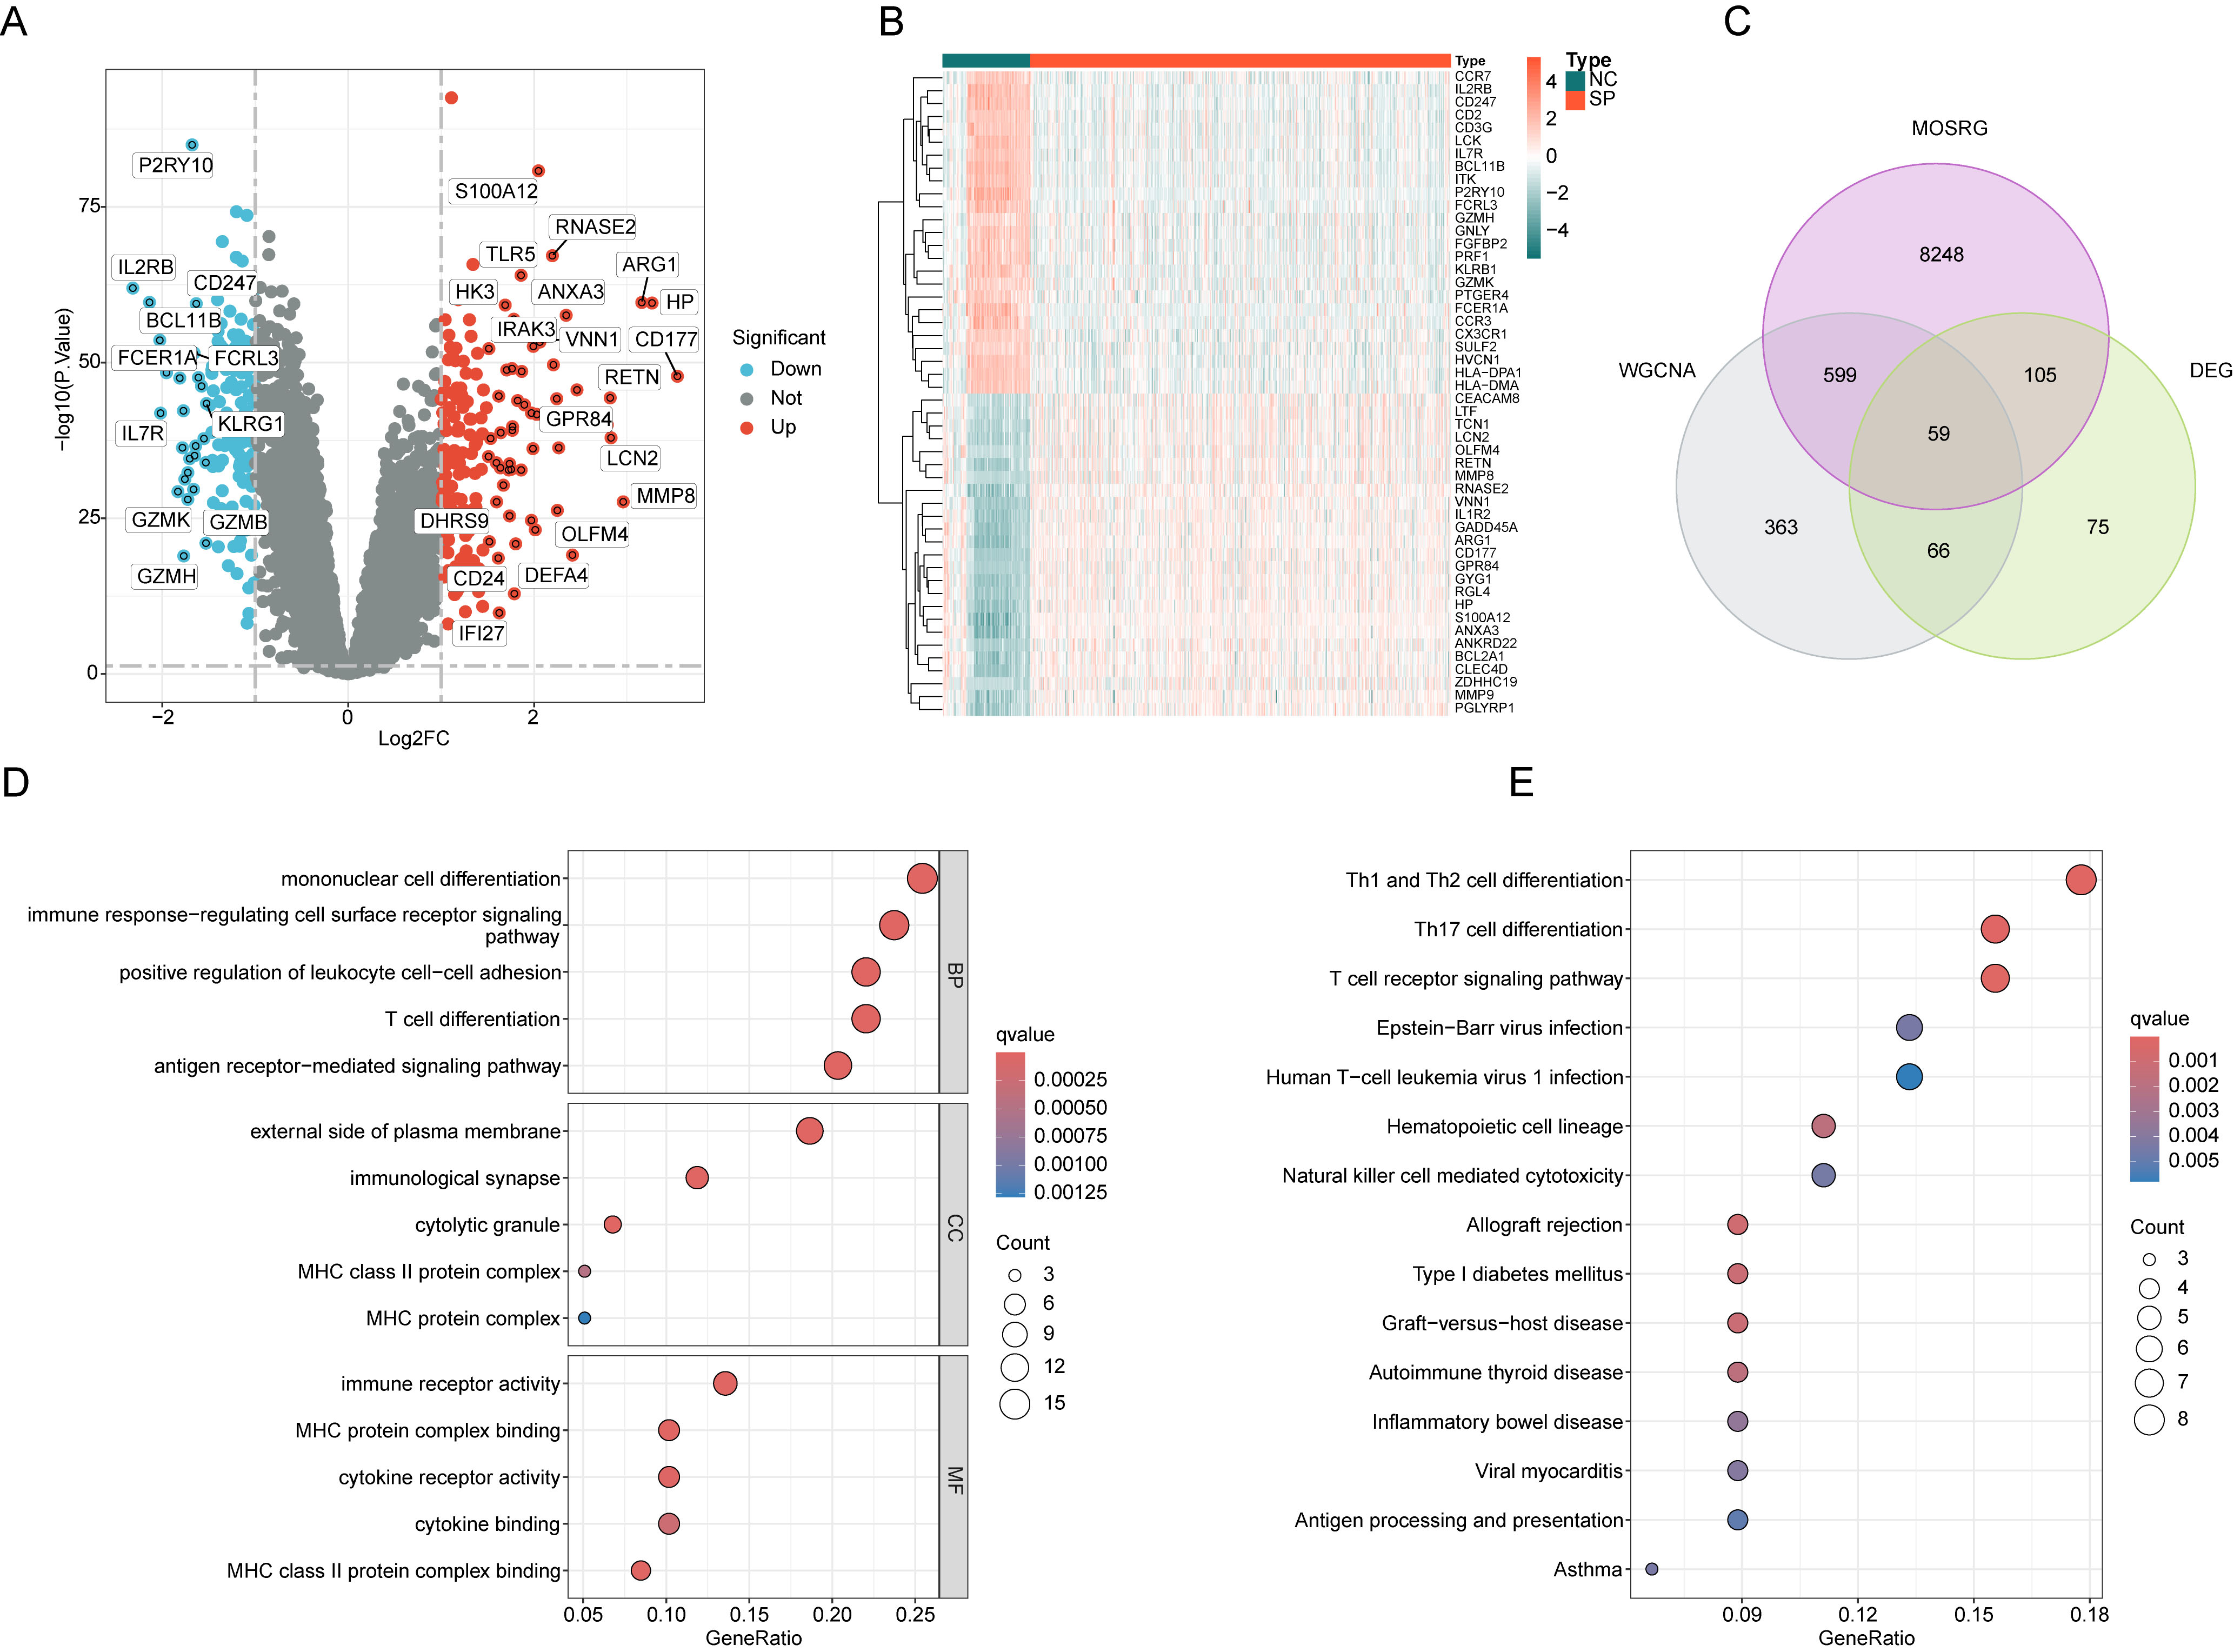 Fig. 2.
Screening and enrichment analysis of differentially expressed
MOSRG signatures. (A) Differential gene expression analysis between NC and SP
groups. Filtering thresholds:
We further assessed the prognostic value of the 59 MOSRG signatures in sepsis and constructed a prognostic risk model to indicate clinical survival outcomes. By integrating the clinical data and MOSRG signature expression features from 479 SP samples, the prognostic value of each variable in SP was assessed by univariate Cox regression analysis. This analysis identified 16 MOSRG signatures associated with SP prognosis, including 15 beneficial factors and one risk factor (Fig. 3A). Further analysis using LASSO regression identified 6 MOSRG features relevant to SP prognosis (Fig. 3B). Subsequently, to determine the independent prognostic impact of these six features, multivariate Cox regression analysis was carried out. The results indicated that RNASE2, CX3CR1, and EPHX2 were independent prognostic variables for SP clinical outcomes. Through PPI network analysis, we assessed the interactions between these three independent prognostic variables (Supplementary Fig. 1A). The results of GO enrichment showed RNASE2, CX3CR1, and EPHX2 may be associated with biological functions such as chemotaxis and neuronal cell body membrane. KEGG enrichment analysis revealed that RNASE2, CX3CR1, and EPHX2 might be involved in the regulation of signaling pathways such as arachidonic acid metabolism, peroxisome, and chemokine signaling pathway (Supplementary Fig. 1B,C). By conducting the risk coefficients and expression profiles of RNASE2, CX3CR1, and EPHX2, we developed a MOSRG scoring model for risk stratification in SP and to indicate clinical survival outcomes for different subgroups (Fig. 3C,D). PCA pattern analysis showed a distinct separation in the distribution patterns between MOSRG score subgroups, highlighting significant differences between them (Fig. 3E). Clinical survival curve analysis demonstrated that the 28-day survival rate in the low MOSRG subgroup was significantly higher, suggesting that SP samples in the low MOSRG subgroup may have better clinical survival benefits (Fig. 3F). Time-dependent ROC curve analysis showed area under the curve (AUC) values of 0.703, 0.677, and 0.666 for 7, 14, and 28 days, respectively, indicating a high diagnostic predictive ability (Fig. 3G).
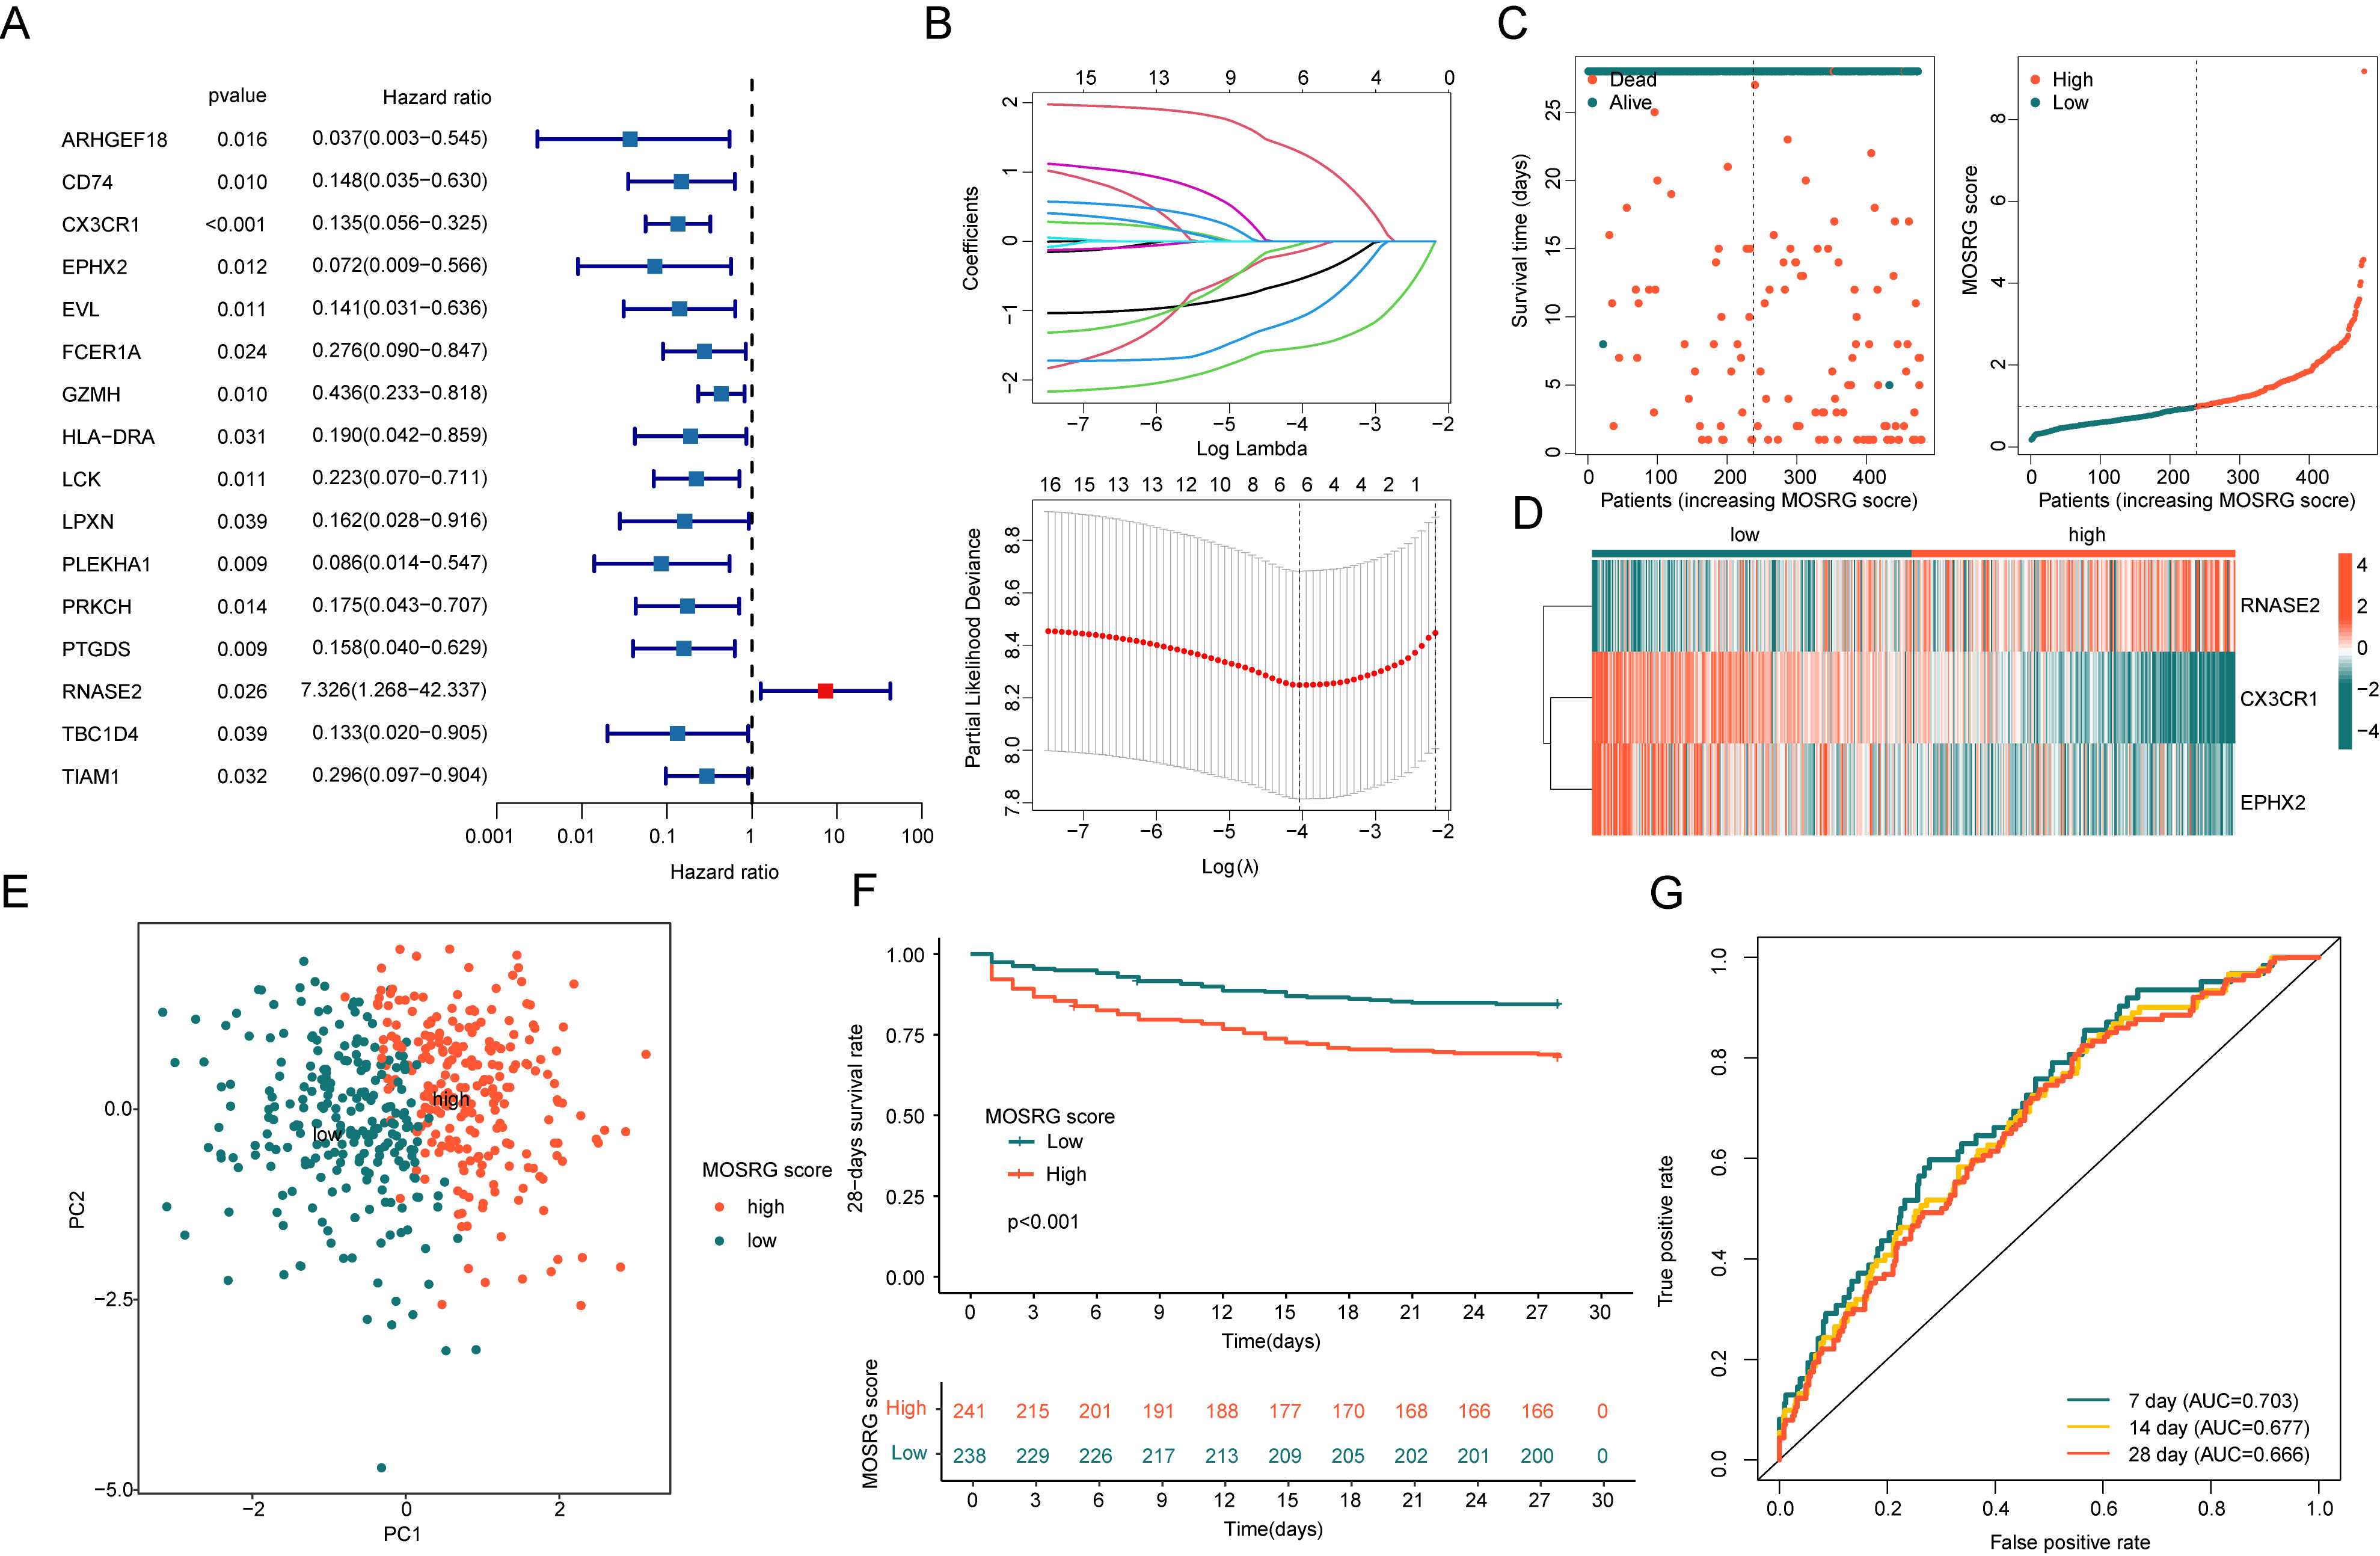 Fig. 3.
Construction of a prognostic risk model based on MOSRG signatures in sepsis. (A) Identification of MOSRG signatures associated with SP prognosis using univariate Cox analysis. (B) Construction of the LASSO model to determine MOSRG feature prognostic variables. (C,D) Development of the MOSRG scoring prognostic system. (E) Principal component analysis (PCA) plot analysis. (F) 28-day clinical survival curves analysis for MOSRG scoring subgroups. (G) Time-dependent ROC curve analysis. LASSO, Least Absolute Shrinkage and Selection Operator; ROC, receiver operating characteristic; AUC, area under the curve; RNASE2, RNA-binding protein, ribonuclease 2; CX3CR1, CX3C chemokine receptor 1; EPHX2, epoxide hydrolase 2.
Using the “caret” algorithm, we divided the 479 SP samples into training set and validation set at a 7:3 ratio and constructed the MOSRG scoring model to confirm the robustness and predictive performance of the MOSRG scoring system for clinical outcomes in sepsis patients. Based on RNASE2, CX3CR1 and EPHX2 risk coefficients and expression profiles, we developed the MOSRG scoring model in both cohorts and classified SP samples into two MOSRG scoring subgroups (Fig. 4A–D). In the training set, we observed that the 28-day clinical survival outcomes for the low MOSRG scoring subgroup were significantly better than those for the high MOSRG scoring subgroup (p = 0.002, Fig. 4E). Time-dependent ROC curve analysis indicated AUC values of 0.706, 0.678, and 0.663 for 7, 14, and 28 days, respectively (Fig. 4F). Notably, in the validation set, the 28-day survival outcomes for the low MOSRG scoring subgroup were also significantly superior to those for the high MOSRG scoring subgroup (p = 0.003, Fig. 4G). Time-dependent ROC curve analysis showed AUC values of 0.697, 0.675, and 0.677 for 7, 14, and 28 days, respectively (Fig. 4H). According to the survival analyses of both independent cohorts, we conclude that the MOSRG scoring system, constructed using MOSRG prognostic signatures, is capable of reliably predicting the 28-day survival outcomes.
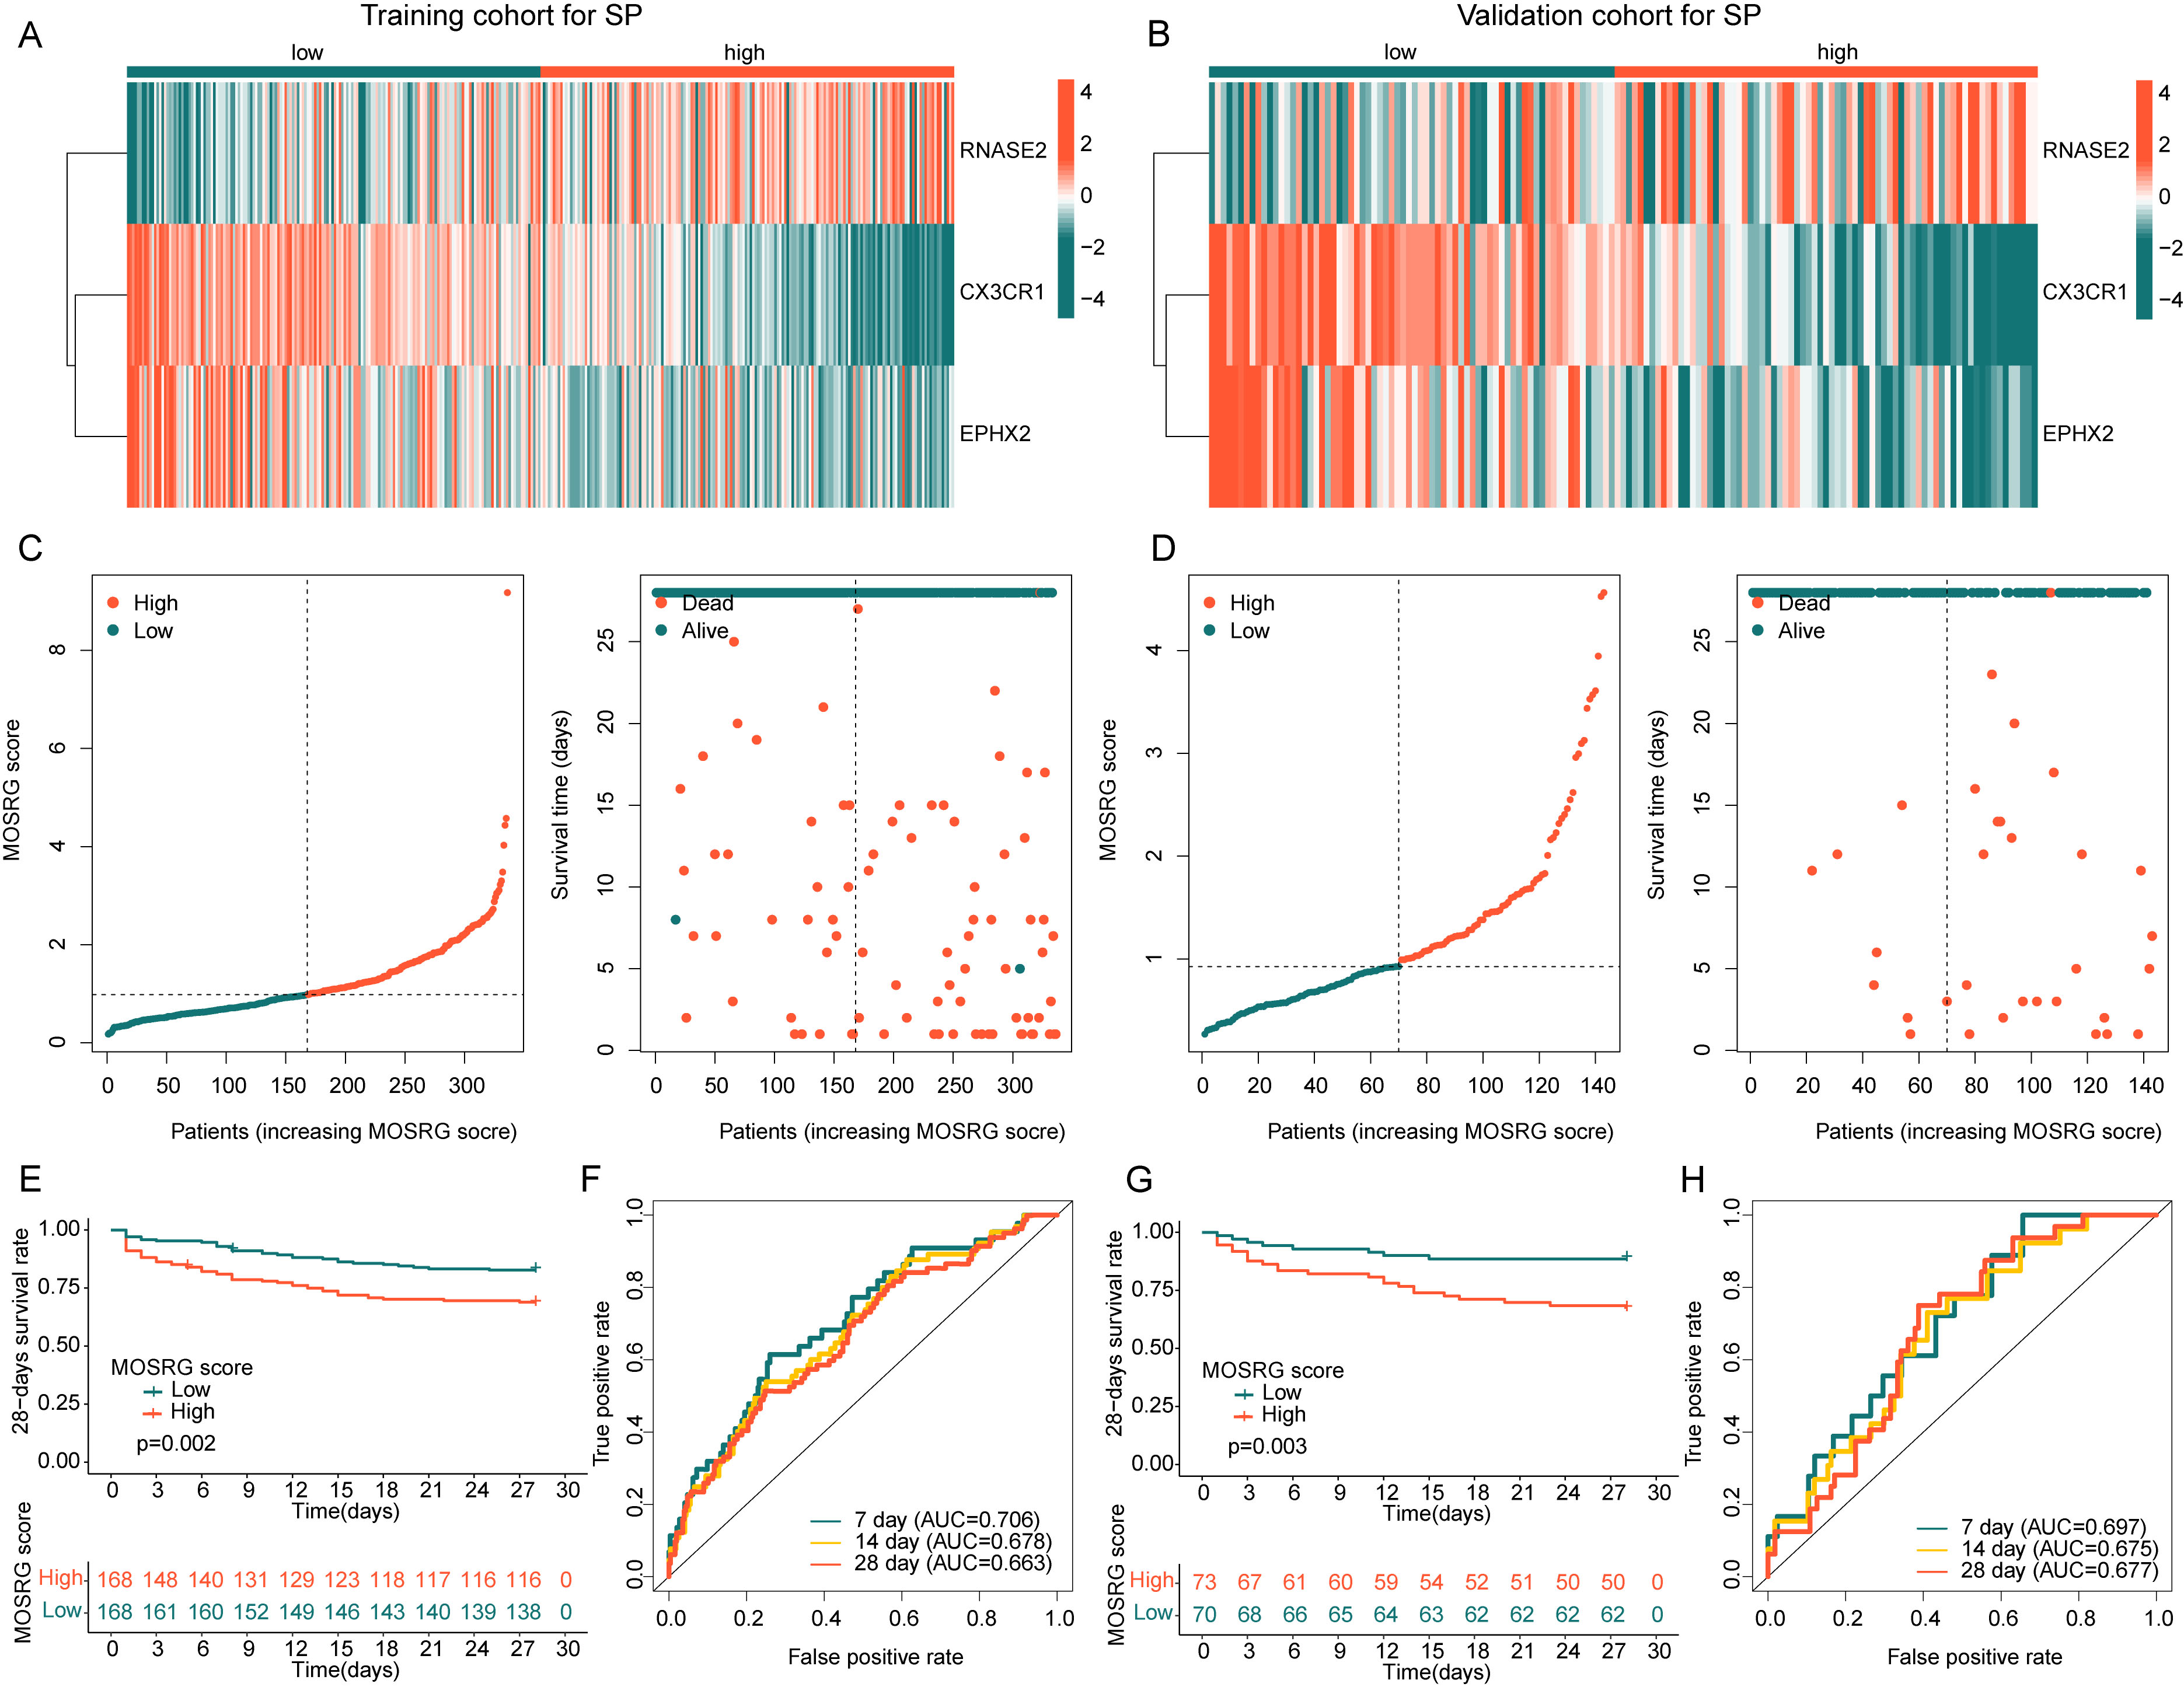 Fig. 4.
Independence and stability validation of the MOSRG prognostic scoring model. (A,B) Expression analysis of MOSRG prognostic signatures. (C,D) Construction of the MOSRG prognostic scoring model in the training and validation cohorts. (E,F) Analysis of 28-day clinical survival curves and time-dependent ROC curves for sepsis samples in the training cohort. (G,H) Analysis of 28-day clinical survival curves and time-dependent ROC curves for sepsis samples in the validation cohort.
By integrating the clinical and pathological characteristics of SP samples with the MOSRG scoring system, we evaluated the independent prognostic value. Univariate and multivariate cox regression indicated age and MOSRG score were associated with poor prognosis of SP (Fig. 5A,B). ROC curve analysis demonstrated that the AUC for the MOSRG score (0.714) was significantly higher than that for gender (AUC = 0.485) and age (AUC = 0.570), highlighting the superior prognostic capability of the MOSRG scoring system (Fig. 5C). Integrating the clinical and pathological characteristics with the MOSRG score, we constructed a nomogram to predict 7-, 14-, and 28-day survival probabilities (Fig. 5D). Calibration analysis revealed that the survival probabilities estimated by the nomogram were well-aligned with the actual survival rates of SP samples (Fig. 5E). The C-index curve results showed the accuracy of using the MOSRG scoring system to assess SP sample outcomes was significantly superior to that of age and gender (Fig. 5F). Moreover, the DCA analysis indicated that the nomogram model exhibited significantly higher accuracy in predicting clinical survival outcomes of SP compared to the MOSRG score and clinicopathological variables (Fig. 5G).
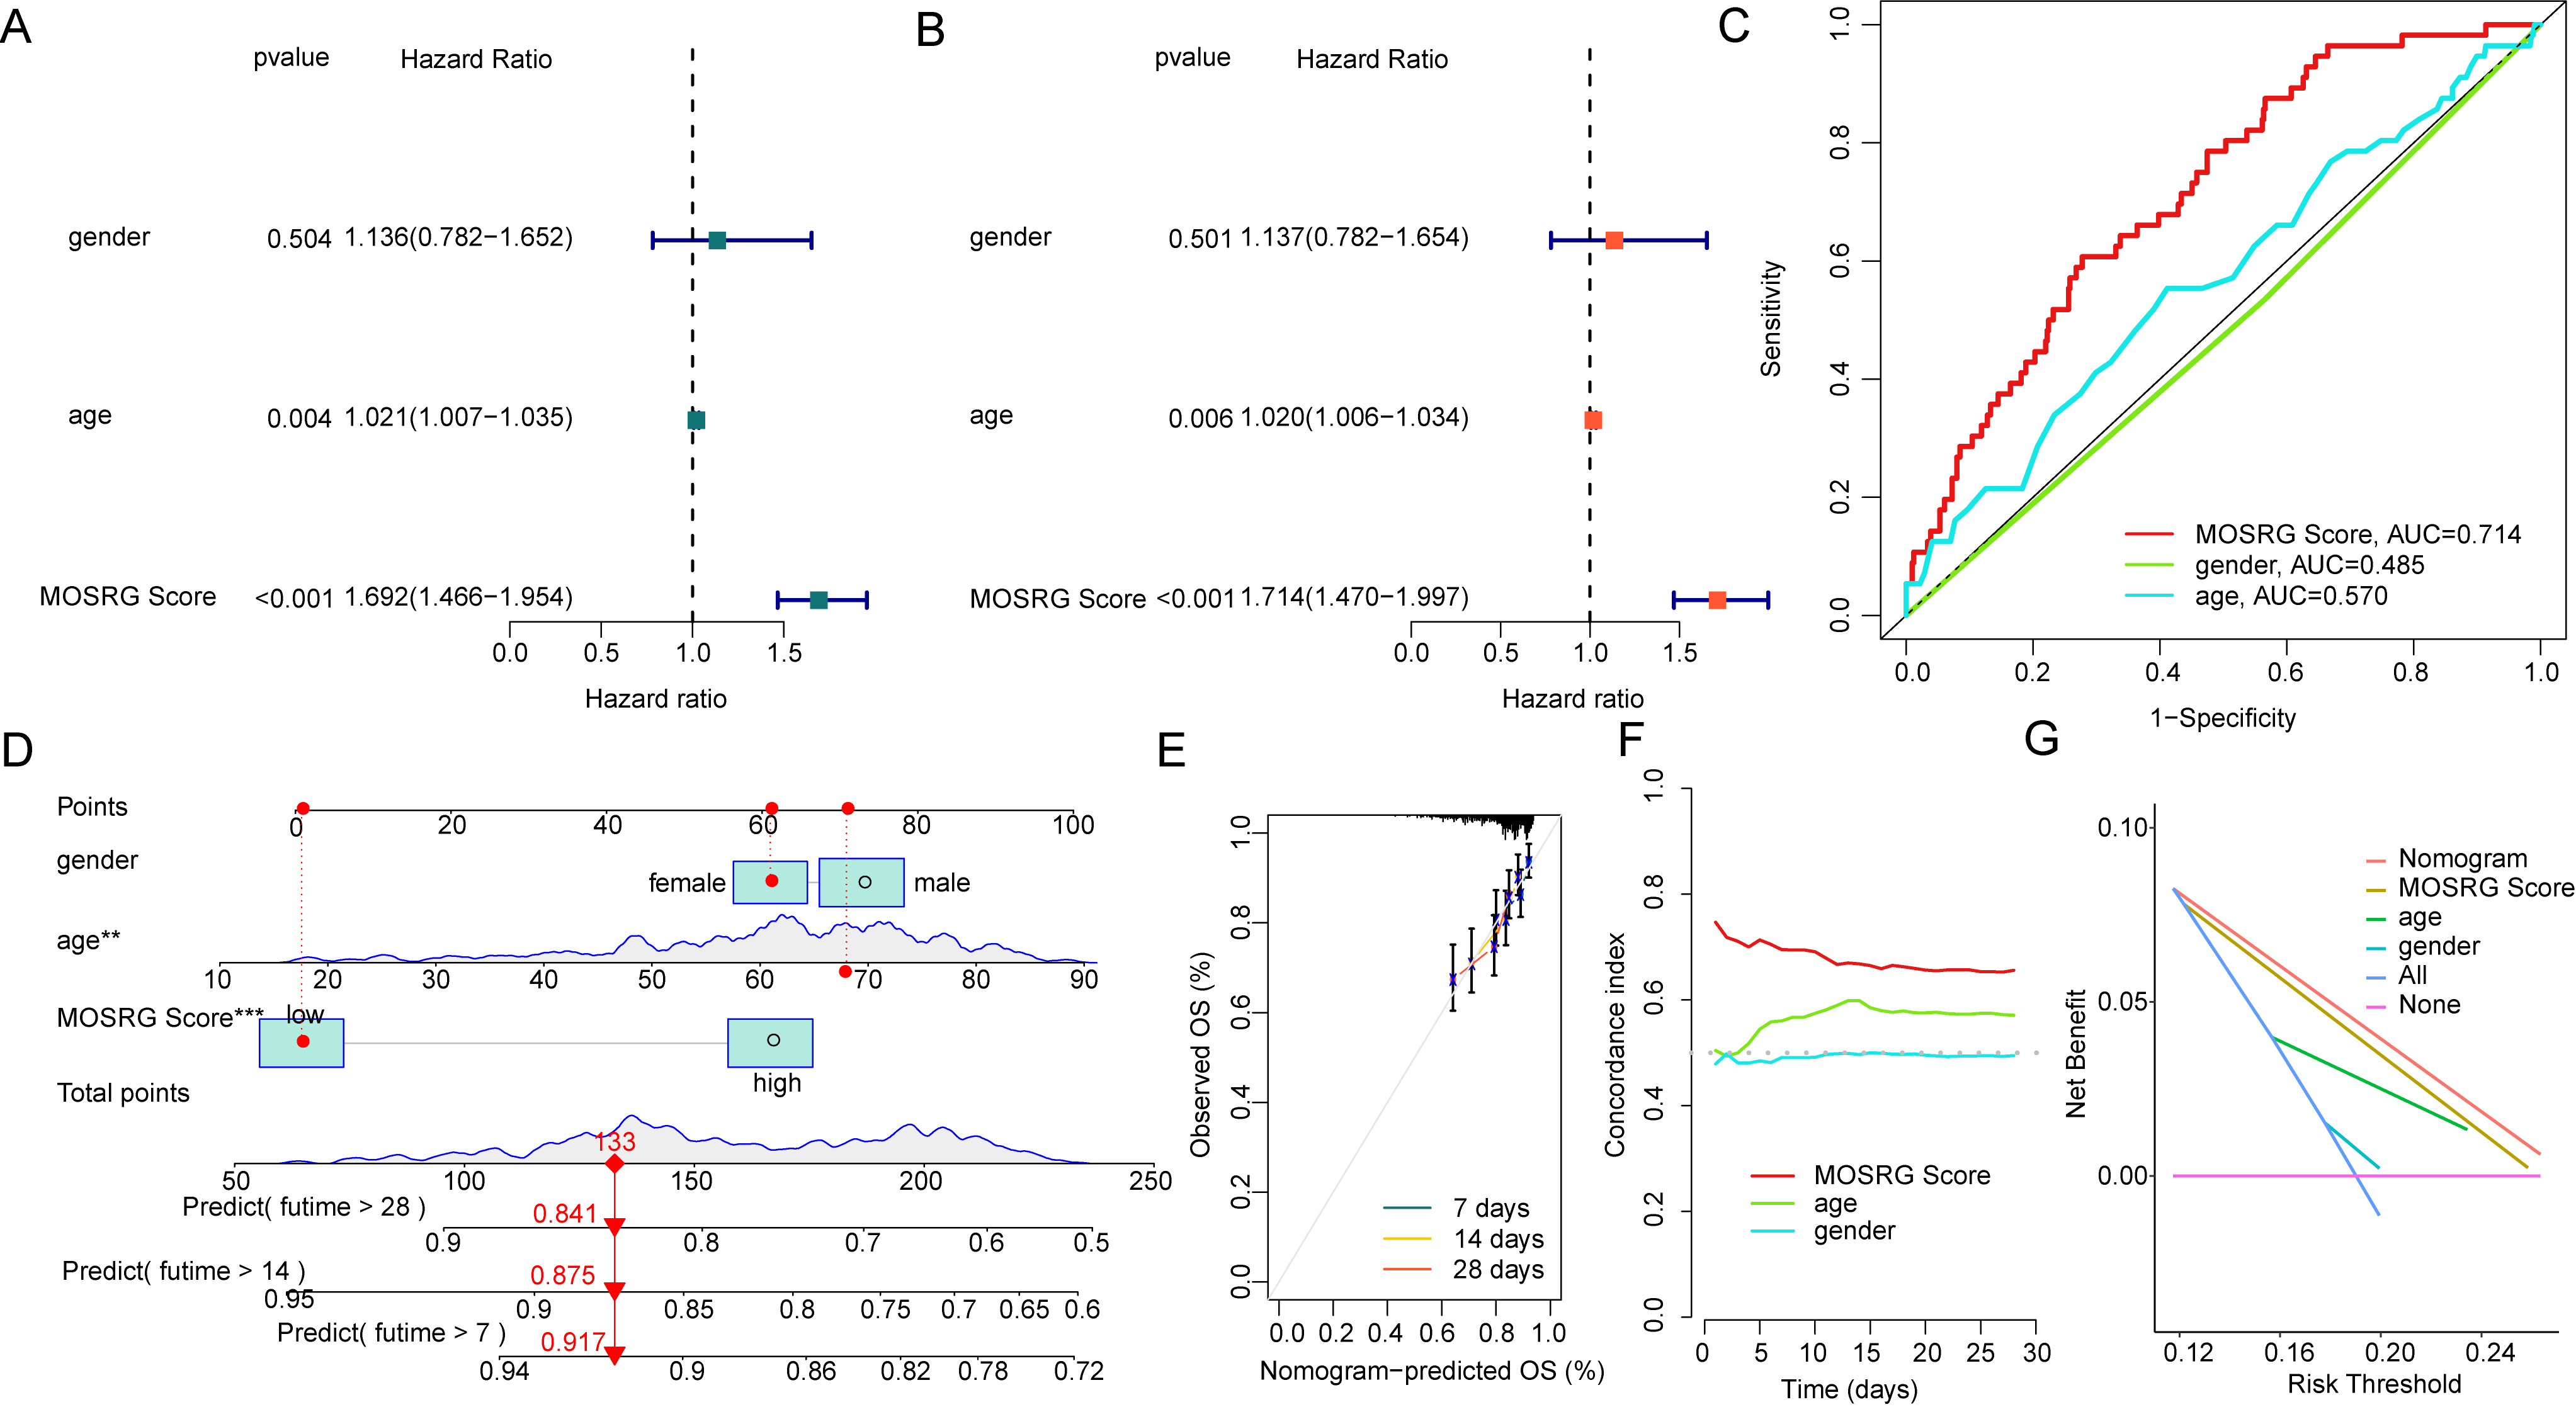 Fig. 5.
Independent prognostic analysis and nomogram diagnostic model
construction of the MOSRG scoring system. (A,B) Independent prognostic value
assessment based on clinical-pathological features and MOSRG scoring. (C) ROC
curve analysis for different variables. (D) Nomogram model construction. (E,F)
Calibration curves and concordance index (C-index) evaluation. (G) The decision
curve analysis (DCA) of different variables. **p
Using the GSVA algorithm, we assessed potential mechanisms underlying survival outcome differences. The GSVA revealed that subgroup with low MOSRG score, pathways such as O-glycan biosynthesis and terpenoid backbone biosynthesis were significantly downregulated. A significant downregulation of multiple immune function-associated pathways, including the intestinal IgA immune network, T cell receptor (TCR) signaling, and NK cell-mediated cytotoxicity, was observed in the high MOSRG score subgroup (Fig. 6A). ESTIMATE showed subgroup with the high MOSRG score, immune scores and ESTIMATE scores were significantly lower, suggesting that SP samples in the high MOSRG score subgroup may exhibit a pronounced immunosuppressive state (Fig. 6B). Pearson’s correlation analysis assessed potential links between MOSRG scores and immune microenvironment characteristics, revealing a significant positive correlation with macrophages, mast cells, and activated dendritic cells, while showing a marked negative correlation with other immune infiltrating cells such as T follicular helper cells, activated CD8+ T cells, natural killer T cells, myeloid-derived suppressor cells (MDSCs), and immature B cells (Fig. 6C). The quantitative assessment of immune cell infiltration showed that in the high MOSRG score subgroup, the infiltration levels of several immune cell types, such as activated B cells, CD4⁺ T cells, CD8⁺ T cells, and neutrophils, were significantly lower (Fig. 6D). Building on these results, we explored the possible interplay between the MOSRG score and immune microenvironmental features in sepsis, suggesting that reduced immune suppression may be linked to worse outcomes in sepsis.
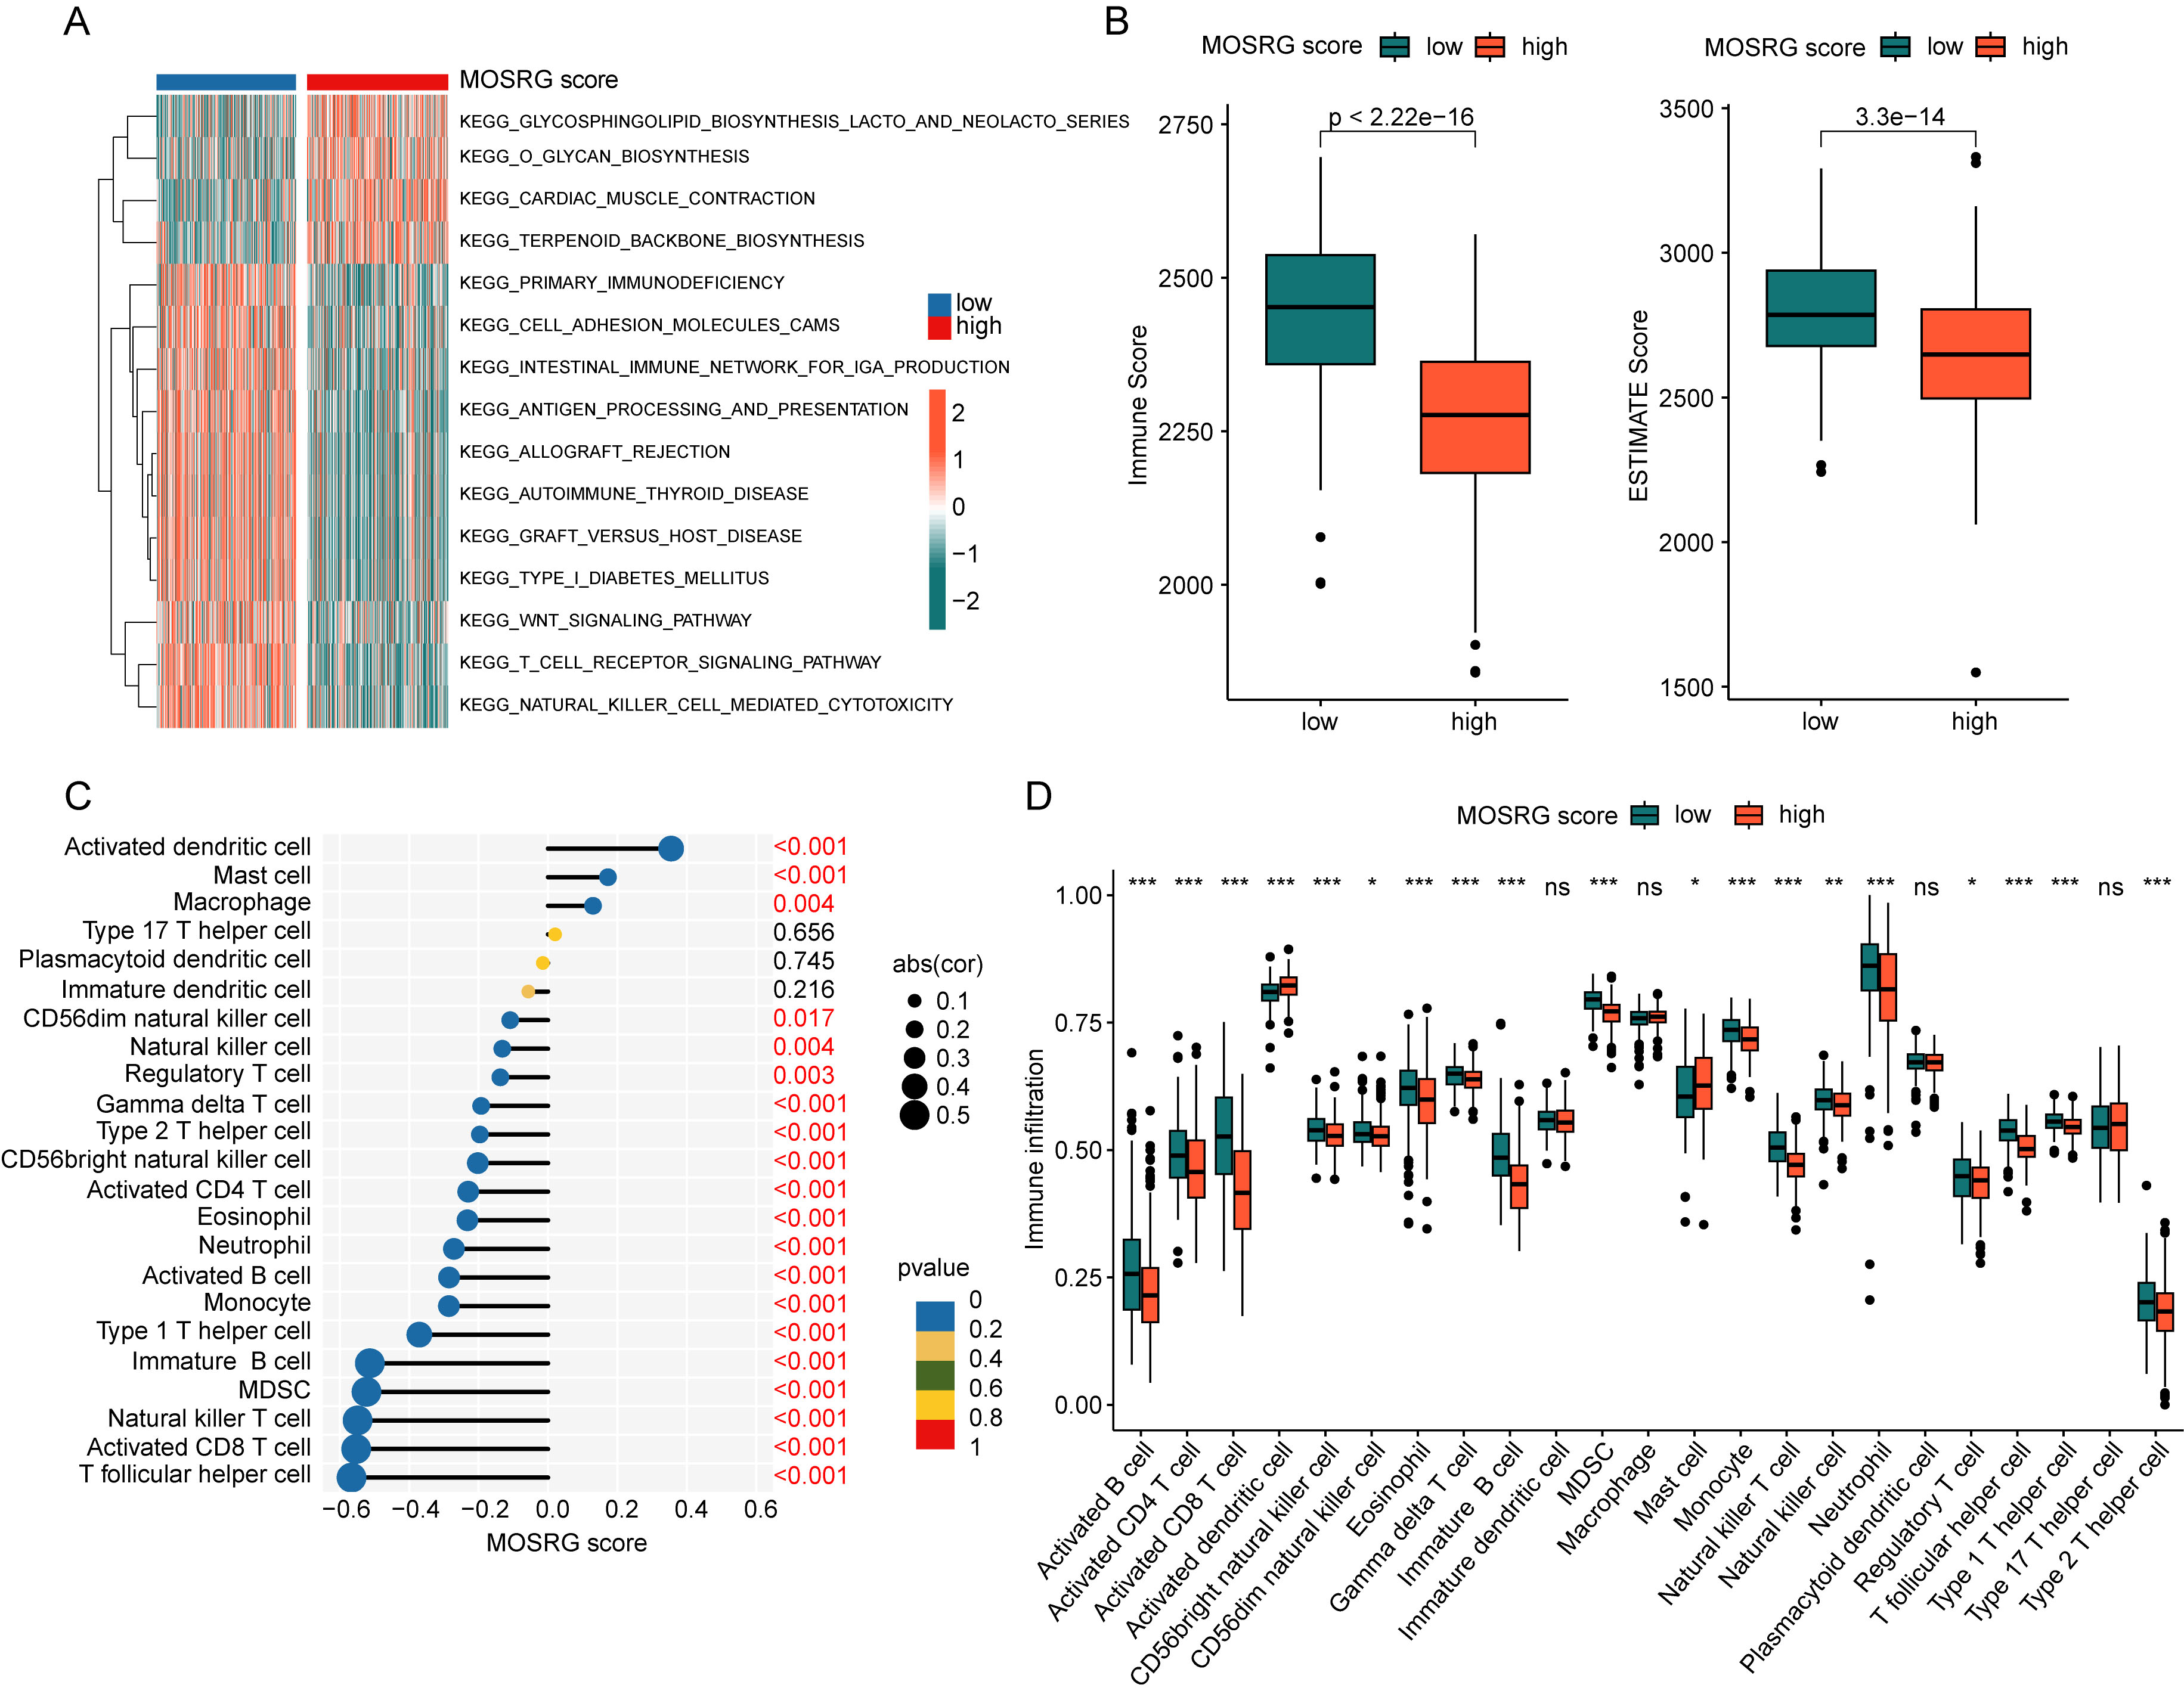 Fig. 6.
Immune microenvironment landscape analysis of MOSRG scoring
subgroups. (A) GSVA between MOSRG scoring subgroups. (B) Assessment of immune
scores and ESTIMATE scores. (C) Correlation analysis between MOSRG scoring and
immune microenvironment features. (D) Quantitative analysis of 23 types of immune
infiltrating cells within MOSRG scoring subgroups. GSVA, Gene Set Variation
Analysis; ESTIMATE, Estimation of STromal and Immune cells in MAlignant Tumor
tissues using Expression data. *p
We further identified the molecular subtyping landscape of MOSRG based on three MOSRGs prognostic variables (RNASE2, CX3CR1, and EPHX2). Using the optimal model parameters from consensus clustering analysis, we classified the sepsis samples into two distinct MOSRG molecular subgroups (k = 2). A total of 303 samples were assigned to Subgroup A, and 176 samples to Subgroup B (Fig. 7A–C). PCA revealed two clear separation patterns between the MOSRG molecular subgroups (Fig. 7D). The 28-day clinical survival curves indicated that samples in MOSRG Subgroup A had a longer overall survival time compared to those in Subgroup B (Fig. 7E). Additionally, we observed a significant increase in MOSRG scores in the poorer prognostic MOSRG subgroup, highlighting the possible interplay between the MOSRG scoring system and molecular subgroups (Fig. 7F). Using ESTIMATE and ssGSEA immune infiltration algorithms, we explored potential distinctions in immune cell infiltration patterns between MOSRG molecular subgroups. Moreover, significantly higher immune scores and ESTIMATE scores could be observed in the subgroup with better prognosis, suggesting a pronounced immune activation state in this subgroup (Fig. 7G,H). Quantitative results indicated a significant increase in the proportion of various immune cells in MOSRG subgroup A (Fig. 7I). GSVA further revealed potential regulatory KEGG signaling pathways between MOSRG molecular subgroups. In the poorer prognostic MOSRG Subgroup B, immune regulation-related pathways were significantly downregulated, whereas metabolic pathways such as sucrose, starch, sphingolipid and glycerophospholipid metabolism were notably upregulated (Fig. 7J). Based on these results, we found that MOSRG-based prognostic signatures can accurately assess the MOSRG molecular subtype landscape in sepsis and indicate the clinical prognosis outcomes and immune microenvironment infiltration of different molecular subgroups.
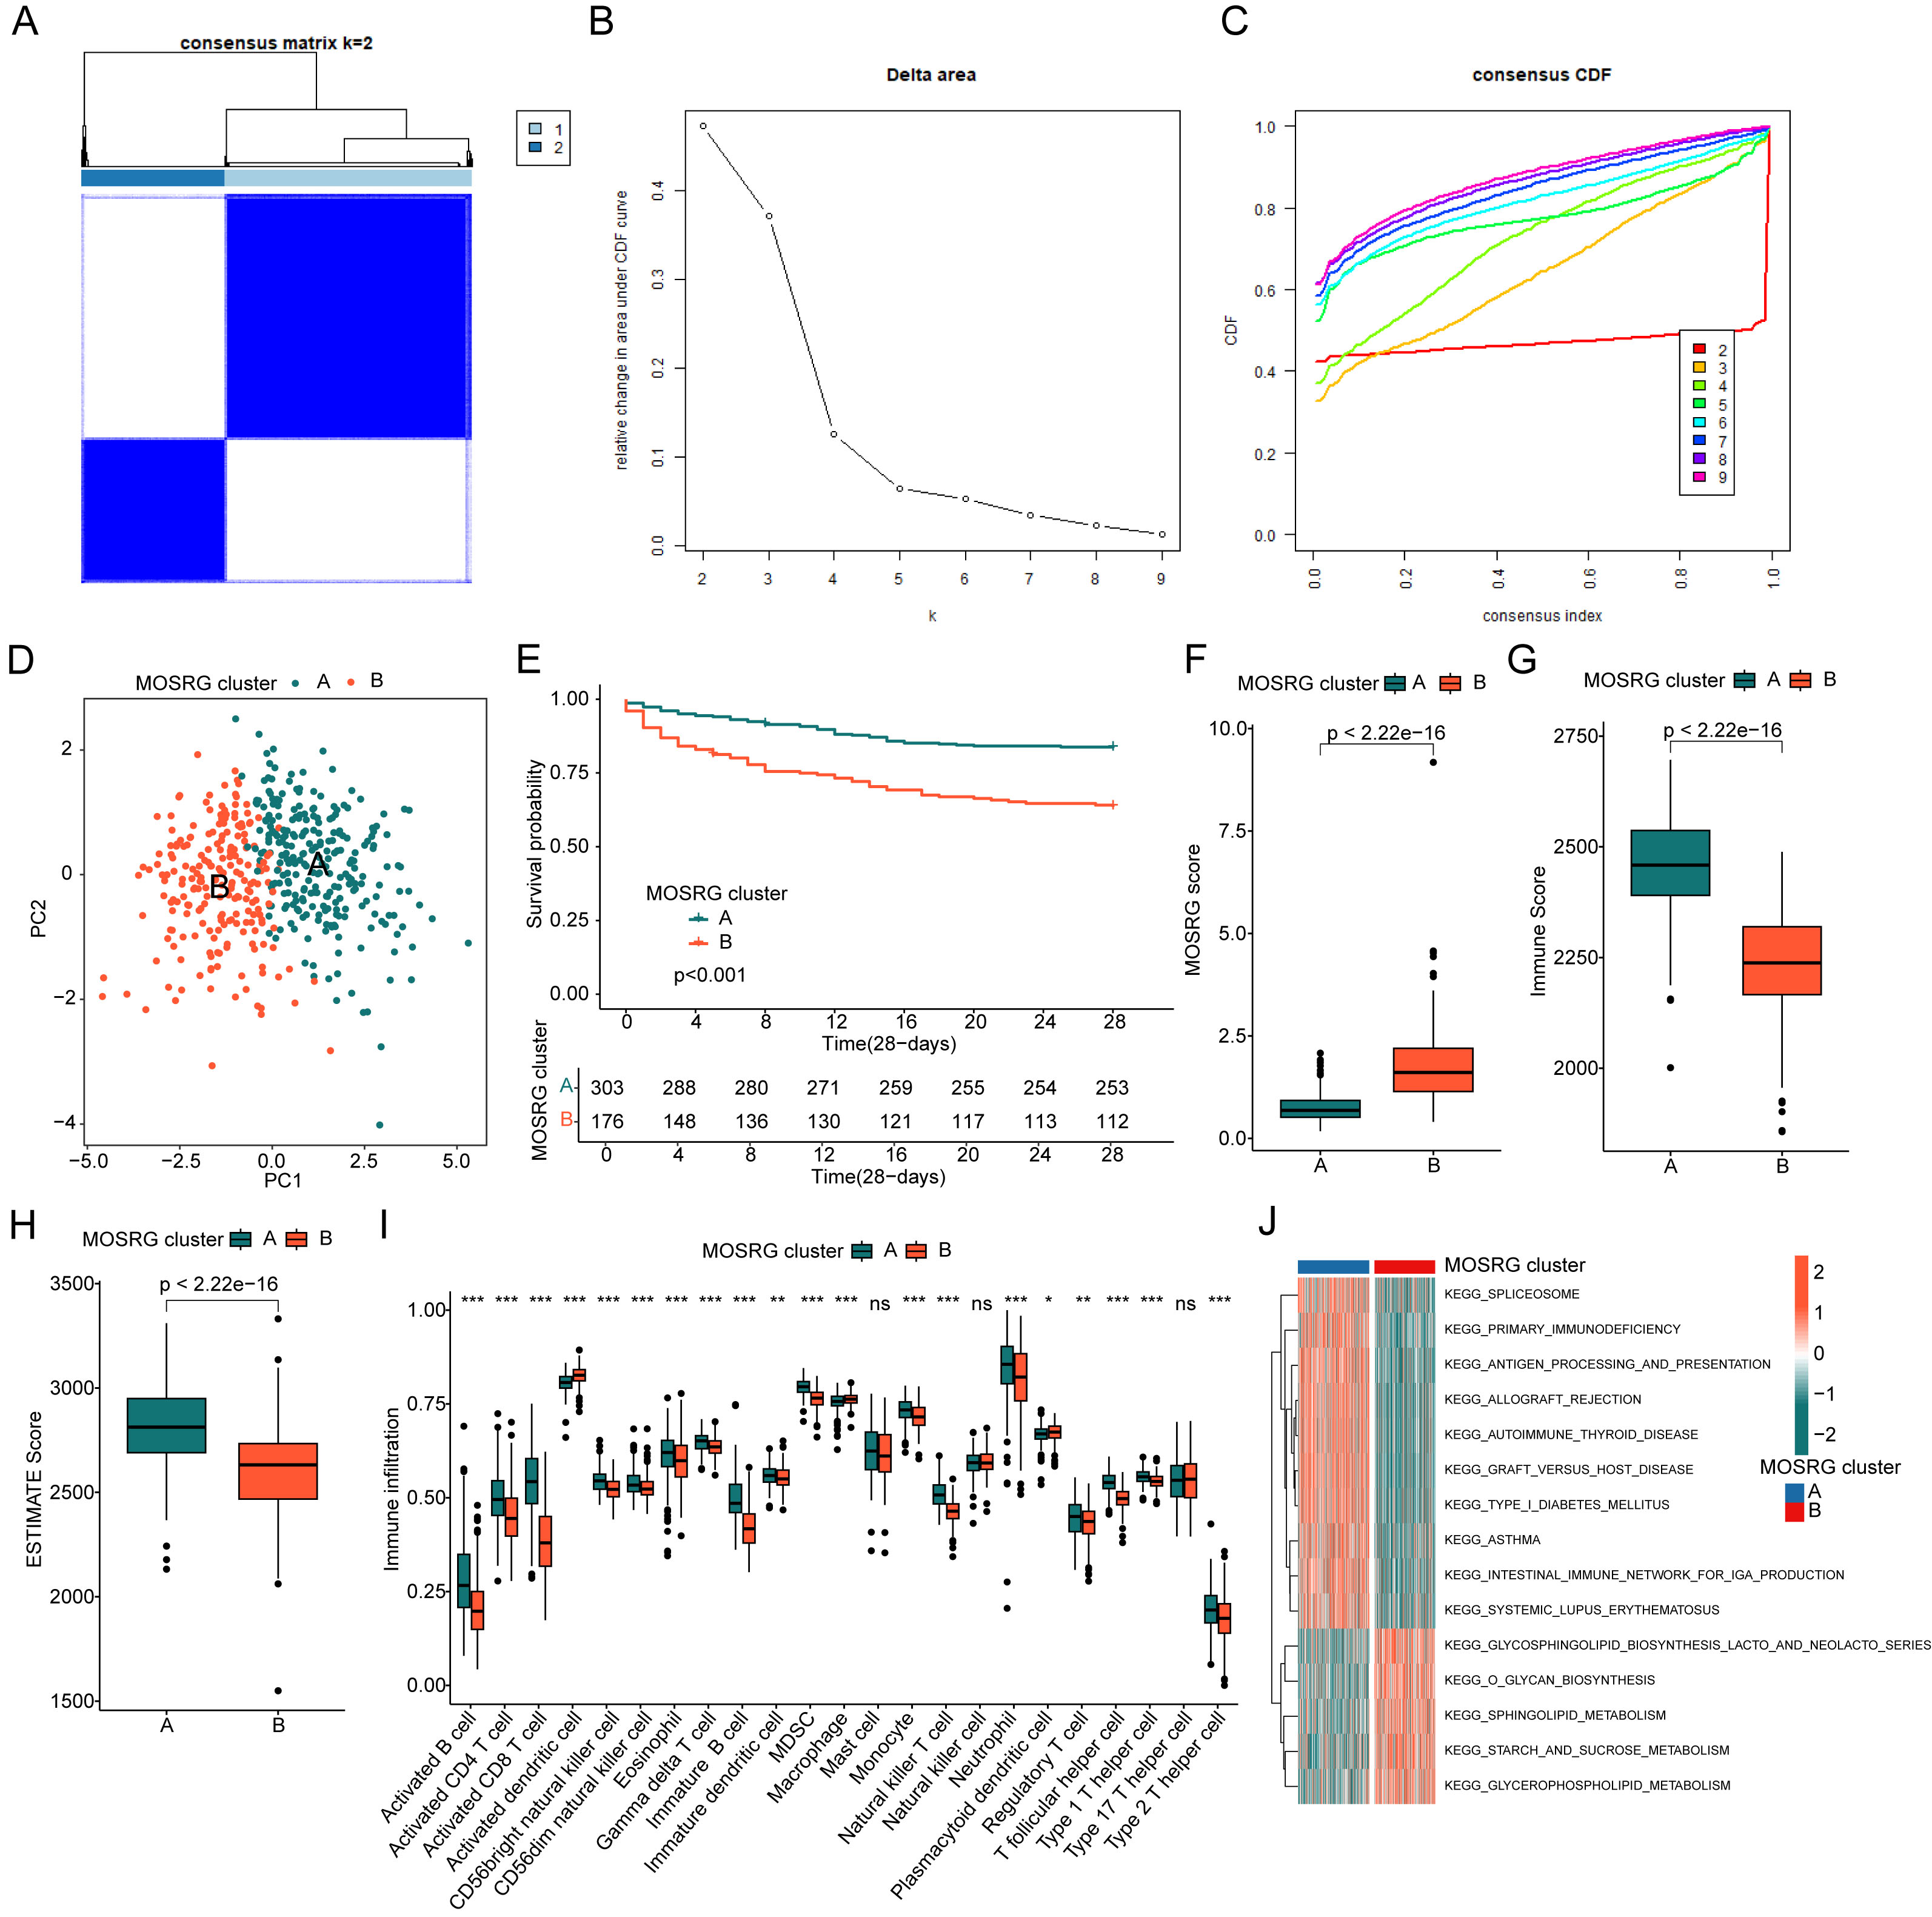 Fig. 7.
Identification and profiling of MOSRG molecular subtypes and
immune landscape in sepsis. (A–C) Identification of molecular subtype
characteristics based on prognostic MOSRG signatures. (D) PCA pattern plot
analysis. (E) Clinical prognosis curves for 28-day survival among MOSRG molecular
subtypes. (F) Comparison of MOSRG Scores Across Different MOSRG Molecular
Subtypes. (G,H) Assessment of immune scores and ESTIMATE scores within MOSRG
molecular subtypes. (I) Quantitative analysis of the proportion of 23 types of
immune cell infiltration. (J) GSVA elucidating differential regulation of KEGG
signaling pathways between MOSRG molecular subtypes. CDF, cumulative distribution
function. *p
We further analyzed the MOSRG prognostic signature characteristics within different cellular subpopulations of sepsis using single-cell sequencing analysis. By dataset GSE167363, we obtained scRNA-seq data from two HC and five SP. After quality control, we retained a sum of 38,562 high-quality cells for further analysis (Fig. 8A). Following normalization, we identified 2000 genes with high variability for dimensionality reduction analysis, including JCHAIN, IGKC, HAMP, SERPINB2, and IGHA1 (Fig. 8B). Using the “FindAllMarkers” function, we identified marker genes for each cell subpopulation and visualized the distribution of 21 cell subpopulations using UMAP/tSNE dimensionality reduction plots (Fig. 8C–E). The violin plot results indicated that RNASE2, CX3CR1, and EPHX2 were expressed in all 21 cell subpopulations, with RNASE2 showing the most prominent expression (Fig. 8F). Cell annotation using SingleR revealed five cell subtypes in sepsis: monocytes, nature killer cells, platelets, neutrophils, and erythroblasts (Fig. 8G). The distribution features of these five cell subpopulations were further illustrated by UMAP and tSNE dimensionality reduction plots (Fig. 8H,I). We then analyzed the expression profile of MOSRG prognostic signatures within each cell subpopulation. UMAP results showed that CX3CR1 was observed in monocytes and NK cells, while EPHX2 was expressed in platelets. Notably, RNASE2 exhibited the most significant expression in monocytes (Fig. 8J).
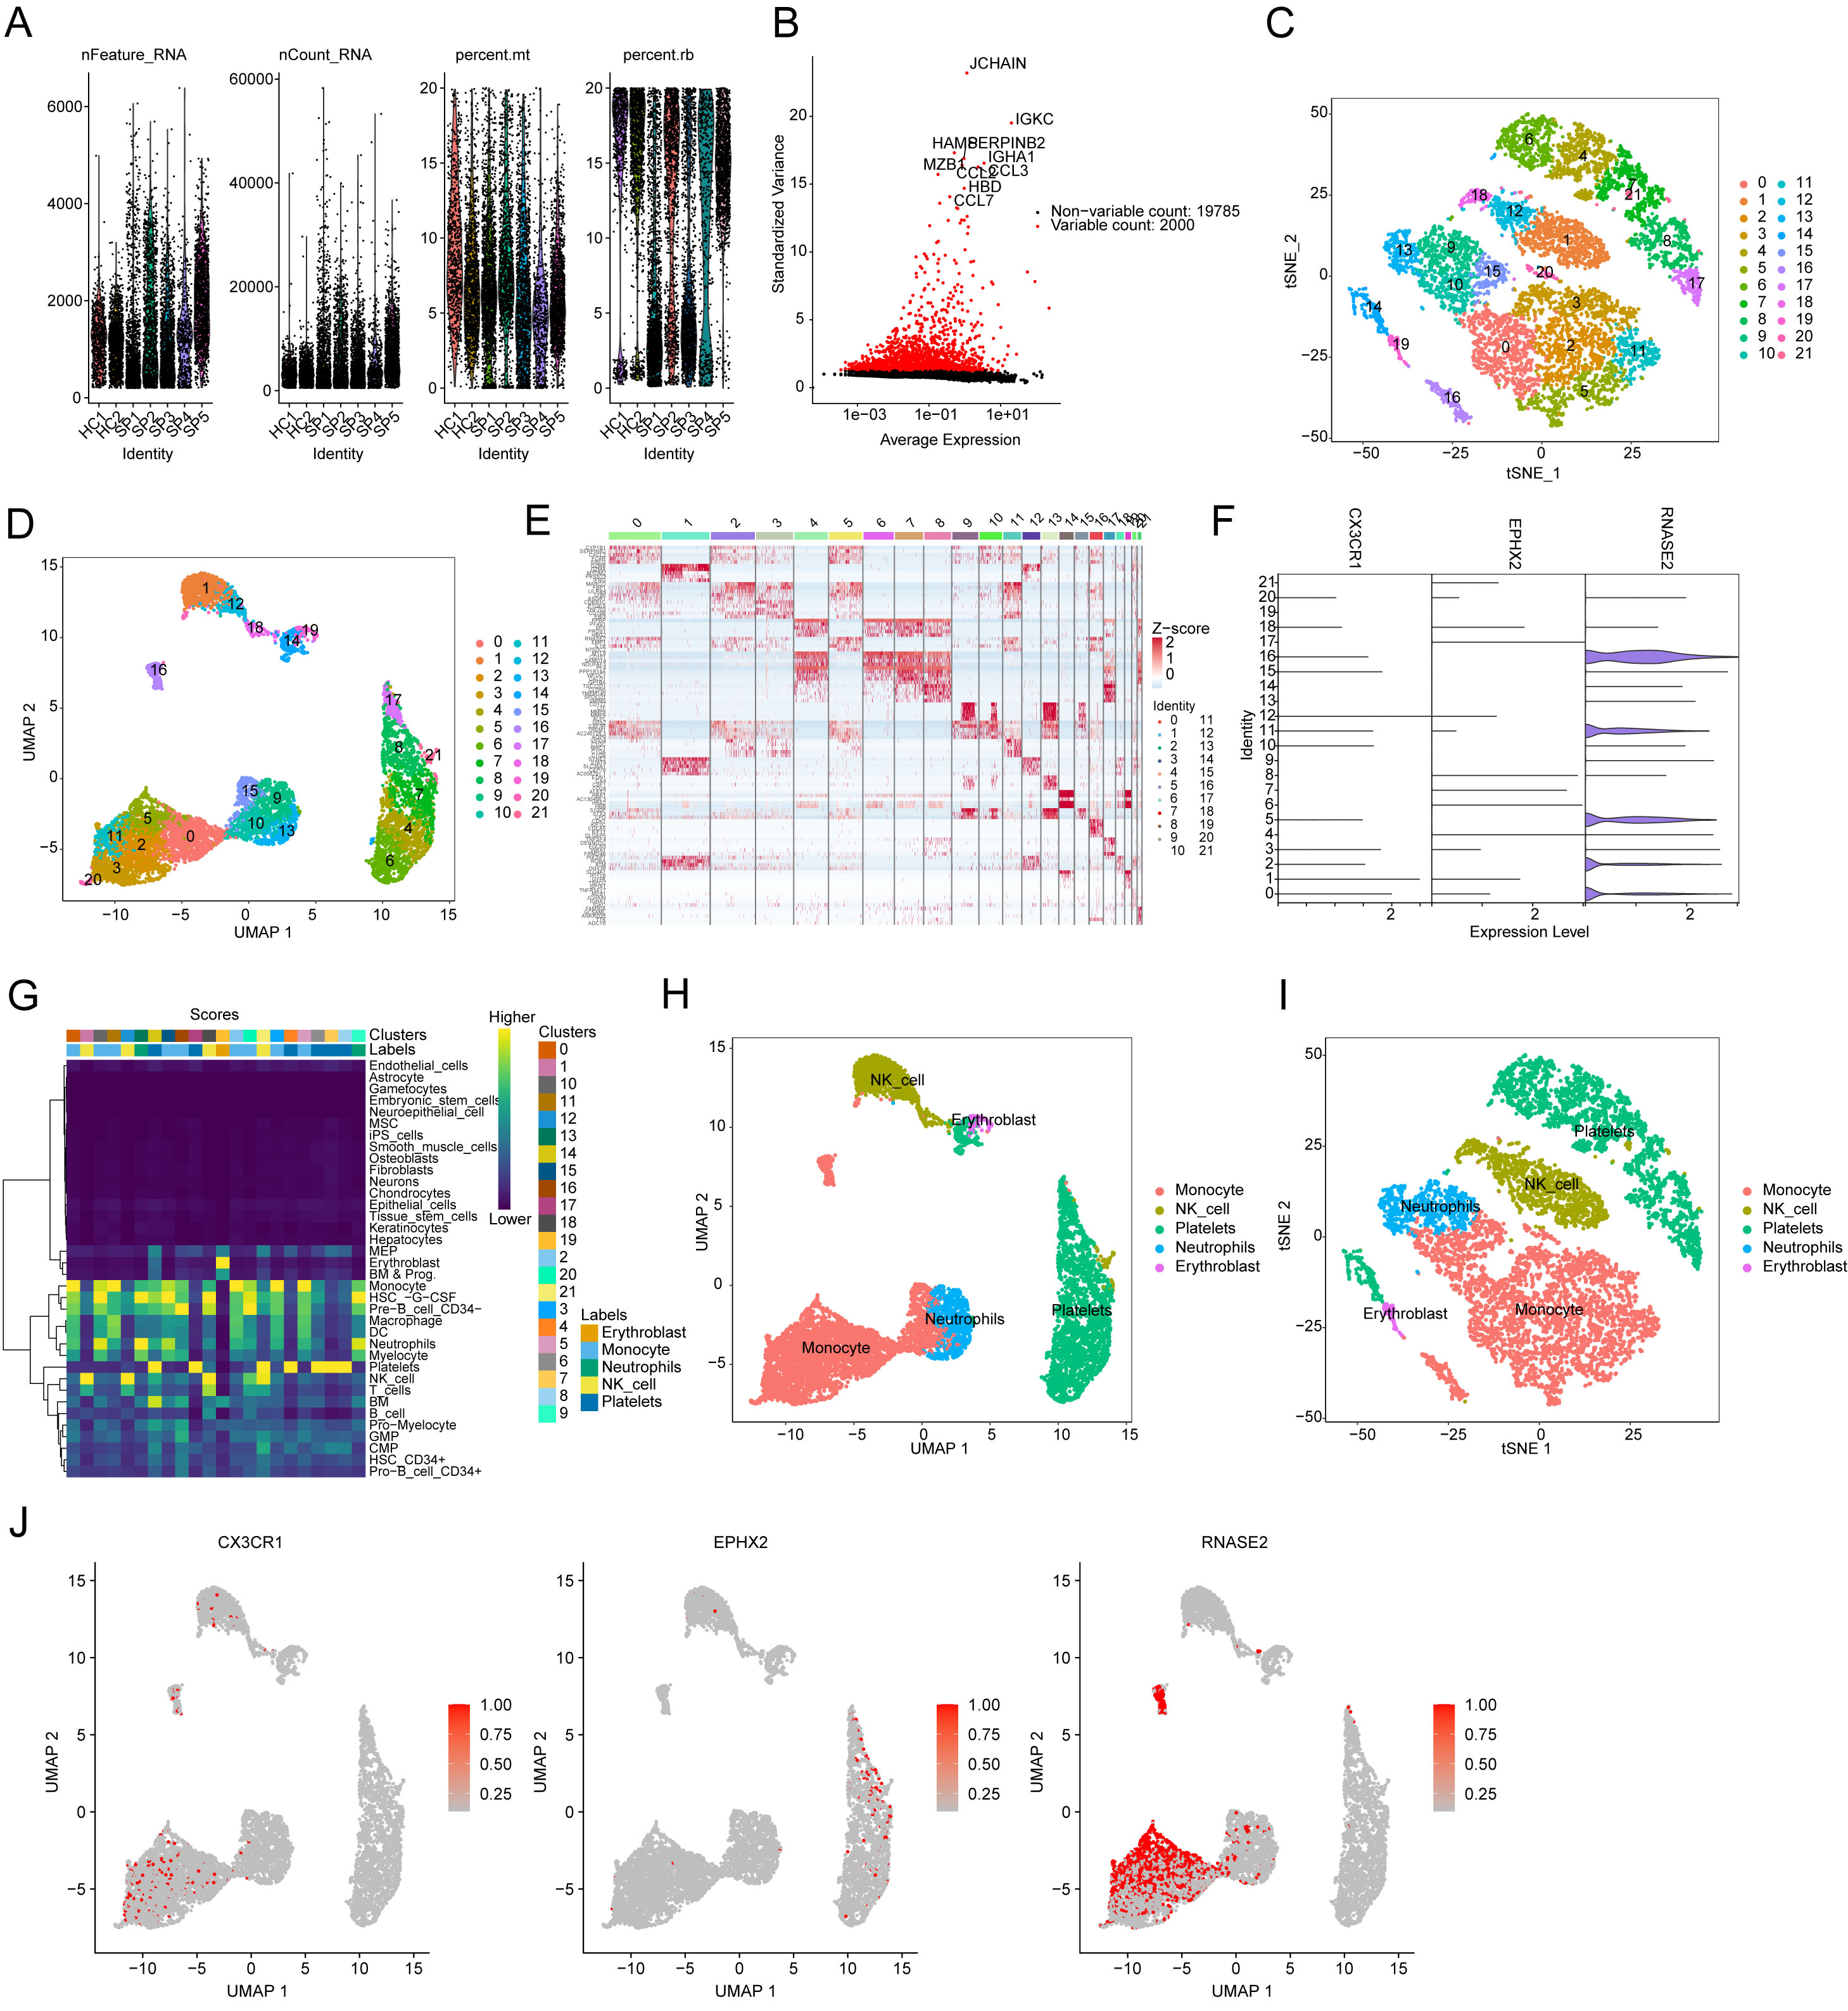 Fig. 8.
Single-cell sequencing analysis of MOSRG prognostic signatures. (A) Quality control and normalization from HC (n = 2) and SP (n = 5) samples. (B) Variable genes identification. (C,D) tSNE and UMAP plots illustrating the distribution of 21 cell subtypes. (E) Expression analysis of marker genes for the 21 cell subtypes. (F) Expression of MOSRG prognostic signatures across the 21 cell subtypes. (G) Single-cell subtype annotation. (H,I) tSNE and UMAP plots depicting the distribution characteristics of 5 cell types. (J) Expression distribution of CX3CR1, EPHX2, and RNASE2 across the 5 cell types.
To examine the impact of RNASE2 on mitochondrial oxidative stress, we cultured
macrophage cells and treated them with LPS to establish a sepsis model, utilizing
siRNA to knock down RNASE2 expression. Western blotting (WB) results showed that
compared to the Normal group, LPS stimulation upregulated RNASE2 levels, while
siRNA effectively interfered with RNASE2 expression (Fig. 9A,B). LPS exposure
significantly suppressed RAW264.7 macrophage viability, as determined by the
CCK-8 assay, whereas interfering with RNASE2 effectively improved cell viability
(Fig. 9C). In addition, we further verified the efficiency of the cell model
interference at the mRNA level, and the PCR results suggested that the expression
of RNASE2 in RAW264.7 macrophage was significantly reduced after RNASE
interference compared with the LPS group (Fig. 9D). MDA, mitochondrial membrane
potential, and ROS levels reflect cellular oxidative stress. Results indicated
that oxidative stress levels in cell mitochondria significantly increased after
LPS stimulation, manifested by elevated MDA levels, decreased mitochondrial
membrane potential, and increased ROS production. However, interfering with
RNASE2 effectively inhibited mitochondrial oxidative stress, reducing MDA and ROS
levels and increasing mitochondrial membrane potential (Fig. 9E–I). Furthermore,
we further investigated the changes in inflammatory mediators in RAW264.7
macrophages after RNASE2 interference. Compared to the model group, our result
showed lower levels of IL-1
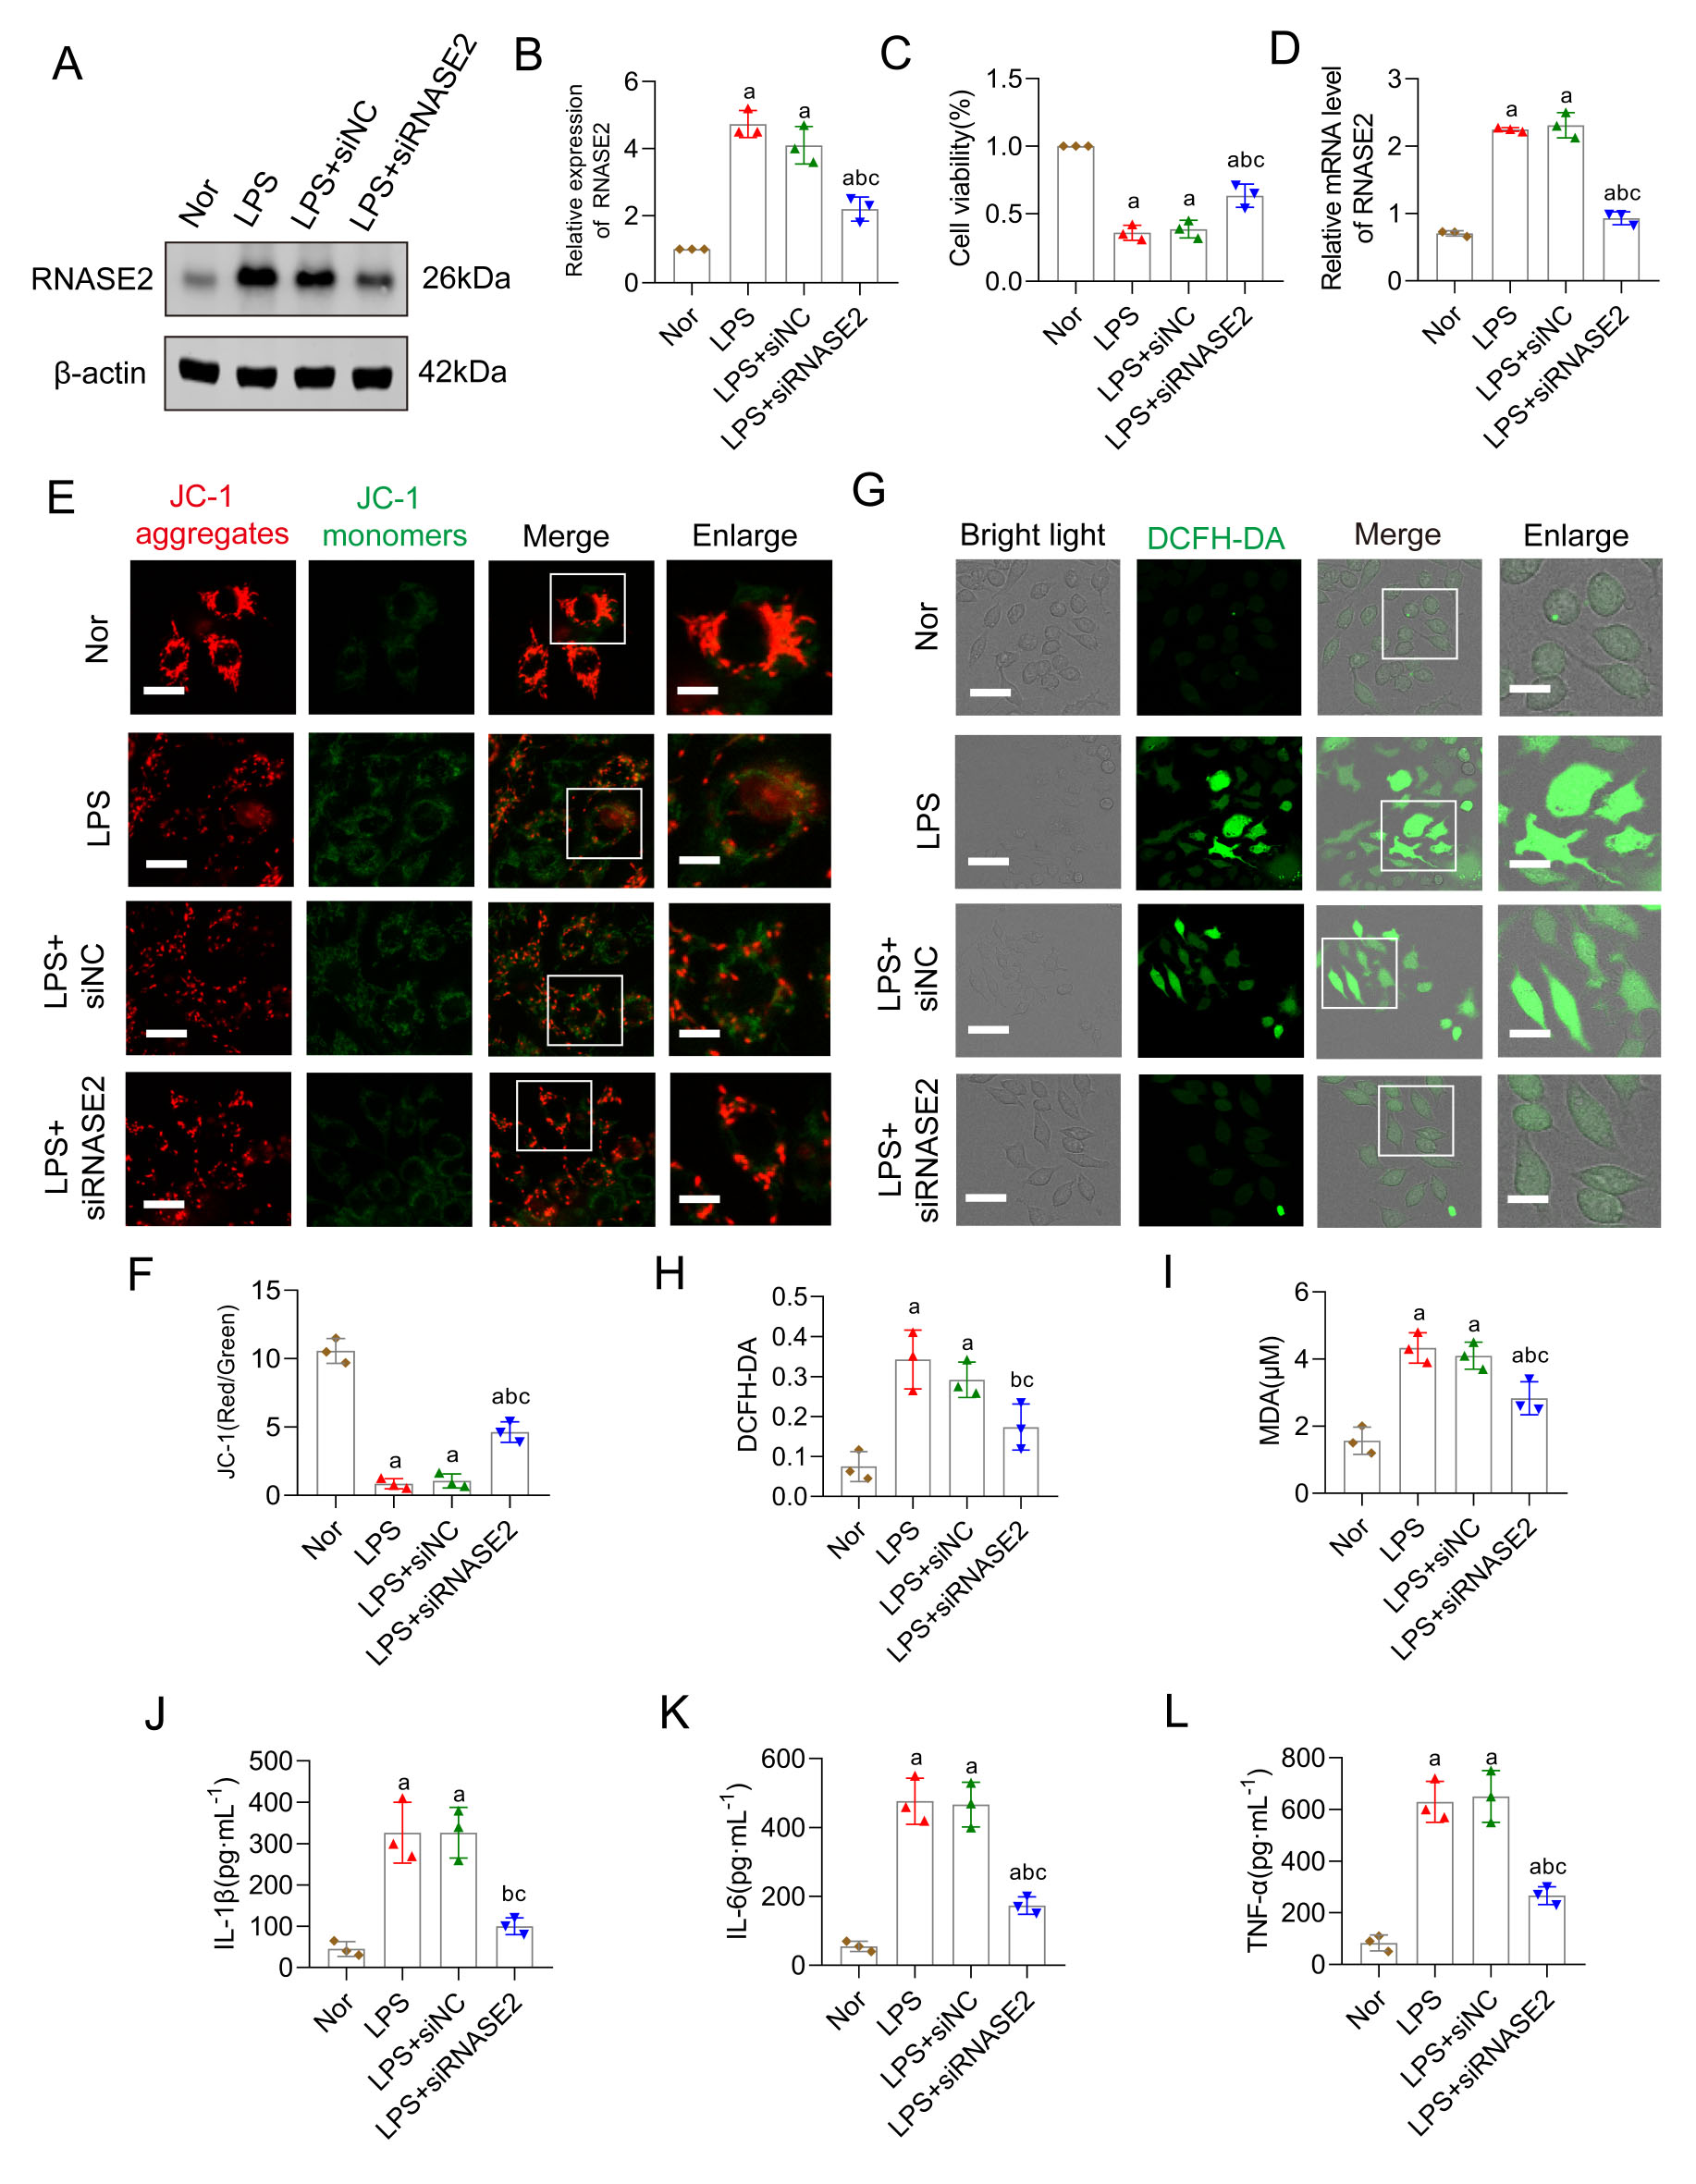 Fig. 9.
RNASE2 inhibition attenuates mitochondrial oxidative stress of
sepsis. (A,B) Western blots of RNASE2 in RAW264.7 macrophages following
treatment with LPS (n = 3). (C) CCK-8 assay of RAW264.7 macrophages (n = 3). (D)
Verification of interference efficiency of RNASE2 in RAW264.7 macrophages
following treatment with LPS and siRNASE2 groups. (E,F) Mitochondrial membrane
potential test by JC-1 aggregates and monomers, scale bars correspond to 20
µm for low-magnification images and 10 µm for high-magnification
views (n = 3). (G,H) ROS immunofluorescent staining revealed oxidative stress
levels in the cells, scale bars correspond to 40 µm for low-magnification
images and 20 µm for high-magnification views (n = 3). (I) The MDA
concentration in RAW264.7 macrophages was measured (n = 3). (J–L) Quantitative
analysis of IL-1
Sepsis is a life-threatening organ dysfunction with mortality rates reaching as high as 70% within three days of onset, which is related to a dysregulation of the immune response to pathogens [16]. Sustained hyperinflammation and immune suppression are key features of the pathophysiology of sepsis [17]. Despite the increasing understanding of the pathogenesis, clinical management of sepsis remains challenging due to antimicrobial resistance [18]. Further elucidation of the key molecular mechanisms is of great importance for finding potential clinical targets and therapeutic approaches to improve the overall prognosis of septic patients. In the present research, approximately 305 MOSRG were obtained, of which 59 MOSRG differed markedly between healthy and septic patients. Immediately afterwards, based on the DE-MOSRG, a risk prognosis model and MOSRG scoring model were constructed and validated for their excellent diagnostic value and ability to predict clinical outcomes in sepsis. Furthermore, we revealed a novel connection between MOSRG scoring model and abnormal immune infiltration in sepsis, suggesting that a lower level of immunosuppression might correlate with a poor prognosis for sepsis. The single-cell RNA sequencing results and in vitro experiments further indicated the great impact of RNASE2 on the development of mitochondrial oxidative stress during sepsis. Our study identified potential biomarkers for sepsis diagnosis, offering crucial insights for sepsis diagnosis and treatment.
Previous study has demonstrated that mitochondrial dysfunction and heightened oxidative stress contribute to the progression of sepsis [19]. Clinical study has demonstrated a great correlation between mitochondrial dysfunction and higher mortality in septic patients [20]. Profound metabolic disturbances of the redox system were observed in sepsis, leading to mitochondria oxidative stress. Acute inflammatory responses in sepsis may cause oxidative stress, contributing to microcirculatory dysfunction, tissue damage, acute respiratory failure, multi-organ failure, which may result in death [21, 22]. In this work, we mainly focused on MOSRG in sepsis. Three MOSRGs (RNASE2, CX3CR1 and EPHX2) were recognized as independent prognostic indicators for sepsis through univariate and multivariate Cox regression, as well as LASSO regression. We also established MOSRG scoring model based on three MOSRGs to accurately assess survival characteristics, which could improve clinical outcome predictions in sepsis. As an RNA-binding protein, ribonuclease 2 (RNASE2) belongs to the RNase A superfamily [23]. It was secreted by eosinophilic cytoplasmic granules, most abundant in macrophages and leukocytes [24]. Studies have documented that RNASE2 participated in human inflammatory responses, which showed immune-modulating properties against multiple pathogens [25, 26]. It also proposed that RNASE2 participated in the host response against the single-stranded RNA virus, such as adenoviruses, retroviruses and rhinoviruses, even HIV [27]. As a G-protein-coupled receptor, CX3C chemokine receptor 1 (CX3CR1) is expressed by CD8+ T lymphocytes, natural killer cells, microglial cells, neurons, mast cells and monocytes [28]. A previous study indicated the potential involvement of CX3CR1 in inflammatory disorders such as atherosclerosis and arthritis by mediating inflammation [29]. Reduced CX3CR1 expression has been identified as an independent molecular biomarker associated with both early and late mortality in critically ill patients [30]. The expression of CX3CR1 was downregulated on circulating monocytes in septic shock patients, suggesting that CX3CR1 may constitute a novel characteristic of sepsis-induced immunosuppression [31]. Soluble epoxide hydrolase 2 (EPHX2) is encoded by EPHX2 gene, which is widely distributed in tissues, particularly kidney and liver. EPHX2 has been proposed as a potential susceptibility gene for atherosclerosis and is increasingly recognized as a promising therapeutic target in various immune-metabolic disorders [32, 33]. Reduced EPHX2 expression is associated with the extent of inflammation during disease progression. EPHX2 metabolizes anti-inflammatory epoxyeicosatrienoic acids (EETs) into their less active dihydroxyeicosatrienoic acid (DHET) forms, thereby promoting pro-inflammatory effects [34]. Collectively, these studies indicate that dysregulated expression of the three MOSRGs is strongly associated with inflammation and related pathological conditions, suggesting their potential diagnostic significance in sepsis.
Immunosuppression and the excessive inflammatory response caused by reactivation of primary infections have been identified by epidemiological study as principal drivers of mortality in septic patients [35]. Previous reports have suggested that modulation of oxidative stress can effectively regulate inflammatory responses and enhance survival outcomes in sepsis [13, 36]. We found that the immune functions-related signaling pathways were considerably downregulated in the high-MOSRG score subgroup. Simultaneously, our data showed a remarkable state of immunosuppression with decreased infiltrated immune cells in high-MOSRG score sepsis sample. Collectively, our findings provide additional evidence that a lower immunosuppressive state is associated with poorer prognosis in septic patients.
Mitochondrial dysfunction is not only a hallmark of sepsis-related organ damage but also serves as a key regulator of neuroinflammation and cognitive impairment [37]. In sepsis, excessive mitochondrial ROS production triggers an oxidative stress storm, leading to widespread cellular damage and disruption of the blood-brain barrier (BBB) [38]. The disruption of the BBB is a critical pathological event linking systemic inflammation to central nervous system dysfunction in sepsis. Sepsis-induced BBB breakdown is mediated by multiple mechanisms, including oxidative stress-induced endothelial damage, increased pro-inflammatory cytokine production, and matrix metalloproteinase (MMP) activation, leading to tight junction degradation [39]. Disruption of the BBB permits the infiltration of peripheral inflammatory mediators and immune cells into the central nervous system, thereby aggravating neuroinflammation [40]. Persistent oxidative stress and mitochondrial dysfunction within the brain promote neuronal apoptosis, synaptic dysfunction, and impairments in neuroplasticity, ultimately contributing to long-term cognitive decline [41, 42]. Therefore, mitochondrial oxidative stress acts as a critical upstream event linking systemic inflammation to central nervous system damage during sepsis development. Notably, the findings of this study may also have important implications for neonatal patients. Neonates are particularly vulnerable to mitochondrial dysfunction and oxidative stress due to the immaturity of their antioxidant defense systems [43, 44]. Mitochondrial dysregulation and excessive oxidative stress contribute significantly to neurodevelopmental impairments in neonatal sepsis survivors [45, 46]. It is conceivable that targeting mitochondrial pathways could offer novel therapeutic strategies for mitigating long-term cognitive and developmental deficits in neonates affected by sepsis.
Single-cell RNA sequencing technology offers excellent opportunities for identifying biomarkers and signaling pathways in infectious diseases, thereby facilitating the elucidation of molecular mechanisms underlying immune regulation [47]. By using single-cell RNA-seq, we identified three MOSRGs as significantly differentially expressed in the 21 immune cell subpopulations, while RNASE2 exhibited the remarkable elevation, particularly in monocytes. It is well known that RNASE2 is a key contributor to host defense against pathogens and is particularly abundant in the human acute monocytic leukemia cell line (THP-1) among the blood cell types [48]. RNASE2 has a central function in the host immune response, exerting both direct antimicrobial effects against a broad spectrum of pathogens and various immunomodulatory functions [7]. Yang and colleagues have characterized that RNASE2 was a chemoattractant for CD34+ progenitor-derived dendritic cells [49]. As an alarmin, RNASE2 is an endogenous molecule that interacts with pattern recognition receptors, triggering signals of tissue and cell damage [50]. Our in vitro results showed the expression of RNASE2 was significantly elevated with markedly elevated mitochondrial oxidative stress level after the LPS stimulation, whilst interfering with the expression of RNASE2 could effectively reverse the observed effects. Based on the findings above, further investigation into the role of RNASE2 in sepsis diagnosis would be highly valuable.
In conclusion, we identified three MOSRGs as potential diagnostic biomarkers for sepsis. Immune infiltration analysis provided strong evidence that these biomarkers are closely associated with immune-related mechanisms underlying sepsis pathogenesis. Among them, RNASE2 emerged as a key regulator of mitochondrial oxidative stress, as demonstrated by single-cell RNA sequencing and in vitro molecular experiments. Specifically, RNASE2 was shown to modulate ROS and MDA levels under septic conditions. However, due to the lack of patient-level correlation data, the clinical relevance of RNASE2 in human sepsis remains speculative. Additionally, despite the multi-step feature selection process, the limited sample size relative to the number of input variables may still pose a risk of overfitting, and external validation is needed to confirm the robustness of the prognostic model. Another limitation of our study is that some continuous variables, such as age and nomogram scores, were binarized before being included in the prediction model. This binarization, while simplifying the model, led to predicted probabilities with only two possible values (0 or 1), which in turn resulted in DCA plots that appear as piecewise linear or straight lines. Although this approach may facilitate interpretation in clinical settings, it can potentially reduce the granularity and accuracy of the model’s predictive output. Future studies may benefit from incorporating continuous variables directly or exploring alternative modeling strategies to preserve predictive information and enhance the interpretability of DCA results. Overall, our findings shed light on the molecular landscape of MOSRG in sepsis and propose novel targets for its diagnosis and therapeutic intervention.
In conclusion, this study systematically elucidates the critical role of mitochondrial oxidative stress-related genes in the pathogenesis and immune regulation of sepsis through integrative bioinformatics analysis and experimental validation. RNASE2 was demonstrated to aggravate mitochondrial oxidative stress in sepsis, and its inhibition alleviated oxidative injury, suggesting a promising therapeutic target. These findings provide new insights into the molecular mechanisms underlying sepsis and offer a foundation for the development of novel diagnostic and therapeutic strategies.
All data generated or analyzed during this study are included in this published article and its supplementary information files.
YW and BZ created the study concept and design. BZ contributed to data collection, experimental design, and data analysis. JW conceived the original ideas and composed this manuscript. YW contributed to the table and figures in this manuscript. All authors contributed to editorial changes in the manuscript. All authors read and approved the final manuscript. All authors have participated sufficiently in the work and agreed to be accountable for all aspects of the work.
GEO database belongs to public databases. Users can download relevant data for free for research and publish relevant articles. Our study is based on open-source data, so there are no ethical issues and other conflicts of interest.
Not applicable.
This research received no external funding.
The authors declare no conflict of interest.
Supplementary material associated with this article can be found, in the online version, at https://doi.org/10.31083/FBL38957.
References
Publisher’s Note: IMR Press stays neutral with regard to jurisdictional claims in published maps and institutional affiliations.