


 , Liying Tu 1,2,†, Lijing Ma 1,2, Qisheng Tang 1,2, Yu Cao 1,2, Lihong Jiang 1,2,*
1 Faculty of Life Science and Technology, Kunming University of Science and Technology, 650500 Kunming, Yunnan, China
2 Regenerative Medicine Research Center, The First People’s Hospital of Yunnan Province, 650032 Kunming, Yunnan, China
†These authors contributed equally.
Abstract
Pancreatic carcinoma (PC), a severely malignant neoplasm of the digestive system, is characterized by an unfavorable prognosis. Neutrophil extracellular trap (NETosis) is a neutrophilic inflammatory form of cell death. However, it is still unknown how they relate to one another. This study aims to explore the part NETosis plays in the onset and progression of pancreatic cancer.
Expression and clinical data for patients with pancreatic carcinoma were obtained from publicly accessible databases. Multigene features were constructed using the least absolute shrinkage and selection operator (LASSO). Bioinformatics analysis was combined with in vitro experiments to determine the relevant mechanism.
Seventeen NETosis-related genes were identified. LASSO analysis finally led to the generation of six gene characteristics, which were divided into two clusters according to the expression level. The survival outcomes of the high- and low-risk groups differ significantly, and their predictive performance is good (p < 0.05). Drug sensitivity analysis confirmed that the high-risk cohort could benefit more from 5-fluorouracil, gemcitabine, and epirubicin (p < 0.01). Using survival analysis and single-cell binding quantitative real-time polymerase chain reaction (RT-qPCR), the crucial gene LGALS3 was identified (p < 0.0001). In vitro experiments demonstrated that inhibiting LGALS3 expression may significantly decrease the proliferation and movement of PANC-1 and SW1990 cells (p < 0.05).
We established a 6-gene risk scoring model and confirmed the effect of LGALS3 on the development of PC.
Keywords
- pancreatic carcinoma
- NETosis
- LASSO
- scRNA
- LGALS3
Pancreatic carcinoma is a highly aggressive neoplasm within the gastrointestinal tract. Clinically, pancreatic ductal adenocarcinoma, acinar cell carcinoma, small gland carcinoma, large eosinophilic granulocyte carcinoma, and small cell carcinoma are included in the pathological category of pancreatic carcinoma [1]. Presently, pancreatic carcinoma (PC) ranks as the fourth primary contributor to cancer-related deaths across the globe. By 2030, it is predicted to overtake all other malignant tumors as the leading cause of death worldwide [2]. In clinical practice, carbohydrate antigen 199 (CA19-9) is often considered a biomarker for the identification of PC. However, it has also been found to be elevated in benign and malignant digestive system disorders to various degrees, has poor specificity, and cannot be used as a screening tool [3]. Most individuals diagnosed with pancreatic cancer do not exhibit any symptoms during the initial stages of the disease, thereby decreasing their 5-year survival rate [4]. Currently, gemcitabine- or 5-fluorouracil-based chemotherapy is typically used in conjunction with surgery to treat PC [5]. Even with advancements in radiation and chemotherapy, the patient survival rate for PC has remained extremely low in recent years [6]. Immunotherapy, targeted treatment, and evidence-based dietary therapies have improved the prognosis of some patients affected by malignant tumors, such as those with PC with high microsatellite instability/mismatch repair errors [7, 8]. However, the safety of these medications, particularly with respect to liver damage, is a concern that should not be overlooked [9]. The extraordinarily complex genetic landscape of PC significantly influences the formation of tumor microenvironments, encouraging tumor growth, treatment resistance, and immune escape mechanisms [10]. Consequently, the occurrence and progression of pancreatic cancer have become major global public health issues, and it is imperative to determine the role immune cells play in this process.
Neutrophil extracellular trap (NETosis) is a unique mechanism of neutrophil death, which was first recognized as an immunological response to bacterial infections [11]. After engulfing pathogens, the secretion of particles containing cytotoxic enzymes can achieve host defense [12]. A number of recent research endeavors have indicated that neutrophils, along with trapping nets, contribute to the process of carcinogenesis by indirectly causing deoxyribonucleic acid (DNA) damage through inflammation and directly enhancing the tumor microenvironment [13]. Revealing novel cell death pathways in malignant tumors and their molecular underpinnings provides a prospective therapeutic approach for the specific treatment of cancerous tumors. In this study, we assessed the predictive significance of NETosis by identifying distinct cluster features in a cohort from The Cancer Genome Atlas (TCGA). In addition, we investigated the relationship between the risk score and both overall survival and immune infiltration among patients diagnosed with PC. Based on this analysis, it is possible to enhance early detection, prognosis tracking, and individualized care for these patients.
The transcriptome dataset GSE16515 comprising 52 patients with pancreatic cancer was obtained from the Gene Expression Omnibus (GEO) dataset (https://www.ncbi.nlm.nih.gov/gds/), The Gene Expression Omnibus Repository(GEO2R) tool was employed to pinpoint genes that are differentially expressed (DEGs). Using the GEIPA 2 website (http://gepia2.cancer-pku.cn/), we obtained differentially expressed genes of the The Cancer Genome Atlas - Pancreatic Adenocarcinoma (TCGA-PAAD) dataset. The GSE154778 dataset was used as the source of the single-cell dataset. Genes linked to NETosis were retrieved from the Gene Card (https://www.genecards.org/). The training set is the TCGA-PAAD queue, while the verification set is the external data set GSE57495.
Venn map was used to obtain NETosis-related DEGs. Univariate Cox analysis was employed to select NETosis-related genes linked to prognosis. The final gene signature was established using least absolute shrinkage and selection operator (LASSO) analysis [14].
The predict function determines each sample’s risk score based on the multivariate Cox model, and the median value is used to categorize the patients in the modeling and verification queue into groups with elevated risk and groups with reduced risk. To assess the disparities in the survival rates between the two cohorts, survival status was assessed using the Kaplan–Meier (KM) curve, and the receiver operating characteristic (ROC) curve was used to judge the prognostic model’s efficacy [15].
We investigated the association between infiltrating immune function and patient risk scores and utilized GSEABase and Gene Set Variation Analysis (GSVA) packages to determine the abundance of sixteen distinct varieties of infiltrating immune cells in both the high-risk and low-risk groups. The sensitivity of 196 medications was assessed for each patient risk group via the “oncoPredict” [16] package, a tool used for drug sensitivity prediction. The “calcPhenotype” function, which was trained using two datasets, GDSC2_Expr and GDSC2_Res, was used to forecast drug sensitivity based on patient data.
“Seurat”, an R package, was used for processing single-cell RNA sequencing
(scRNA-seq) data, reducing dimensionality, performing normalization, and checking
data quality. Extreme gene expression levels (nfeature RNA
The human normal pancreatic duct epithelial cell line named HPDE6-C7 (STCC11108), along with the human pancreatic cancer cell lines PANC-1 (STCC11102) and SW1990 (FH0784), were procured from Servicebio and Fuheng biology. Vivacell was the supplier from which fetal calf serum and Dulbecco’s Modified Eagle’s Medium (C3113-0500) were procured. LGALS3 human pre-designed siRNA (HY-RS07604, siRNA sequences are presented in Table 1) and Cell Counting Kit-8 (HY-K0301) were purchased from MedChemExpress. Lipofectamine2000 (11668-019) was purchased from Invitrogen. The Total RNA Extraction Kit (DP430) was purchased from Tiangen. SweScript All-in-One RT SuperMix for qPCR (G3337) and 2xUniversal Blue SYBR Green qPCR Master (G3326) are sourced from Servicebio. PCR primers were synthesized by Qingke Biologics, Inc.
| siRNA name | siRNA sequence |
| Negative Control-F | UUCUCCGAACGUGUCACGUTT |
| Negative Control-R | ACGUGACACGUUCGGAGAATT |
| LGALS3 Human Pre-designed siRNA Set A-1-F | GGGAAUUUCUGGUGACAUAUU |
| LGALS3 Human Pre-designed siRNA Set A-1-R | UAUGUCACCAGAAAUUCCCUU |
| LGALS3 Human Pre-designed siRNA Set A-2-F | GAGAACAACAGGAGAGUCAUU |
| LGALS3 Human Pre-designed siRNA Set A-2-R | UGACUCUCCUGUUGUUCUCUU |
| LGALS3 Human Pre-designed siRNA Set A-3-F | GAAGAAAGACAGUCGGUUUUU |
| LGALS3 Human Pre-designed siRNA Set A-3-R | AAACCGACUGUCUUUCUUCUU |
PANC-1 and SW1990 cells were cultured in DMEM + 10%FBS + 1%PS complete medium,
5% CO2, and 37 ° constant temperature. PANC-1 and SW1990 cells that were in the
log phase of growth were seeded into 6-well plates at a cell concentration of 1
Cells of the PANC-1 and SW1990 lines that were in the logarithmic growth stage
were seeded into 96-well plates at a cell concentration of 5
The logarithmic growth period PANC-1 and SW1990 cell lines were digested and
diluted to create 5
The total RNA was isolated from HPDE6-C7, PANC-1, and SW1990 cells. Ultra-micro spectrophotometer (NanoDrop2000, Thermo Fisher Scientific, USA) was employed to measure the concentration of the total RNA. Subsequently, the total RNA was reverse-transcribed into complementary deoxyribonucleic acid (cDNA) using the PrimeScript™ RT reagent Kit with gDNA Eraser. Following the synthesis of cDNA, amplification was carried out, and the expression levels were measured with TB Green Premix Ex Taq II. The relative expression of the core genes was computed using the 2-ΔΔCt method. The primer sequences are presented in Table 2.
| Primer name | Primer sequence |
| LGALS3-F | TTGCCTTCCACTTTAACCCAC |
| LGALS3-R | CCGACTGTCTTTCTTCCCTTC |
| S100A11-F | ACAGAACTAGCTGCCTTCACAAAGA |
| S100A11-R | GACAGAAAGGCTGGAAGGAAA |
| GAPDH-F | GGAAGCTTGTCATCAATGGAAATC |
| GAPDH-R | TGATGACCCTTTTGGCTCCC |
The dataset was subjected to analysis using R project (version 4.4.2, Lucent Technologies, Murray Hill, New Jersey, USA), specifically version 4.3.1. For survival analysis, Kaplan–Meier survival analysis along with log-rank tests were employed. When dealing with variables, if a variable followed a normal distribution, the Student’s t-test was selected for analysis. In cases where the variable did not conform to a normal distribution, the Wilcoxon test was utilized instead. To build the ROC curve, the “timeROC” package was applied. Across all investigations, statistical significance was defined as a p-value less than 0.05.
Through a comparison of the gene expression patterns of 26 tumor tissues and 26
normal tissues within the GSE16515 dataset, 2682 DEGs were identified (log2[fold
change]
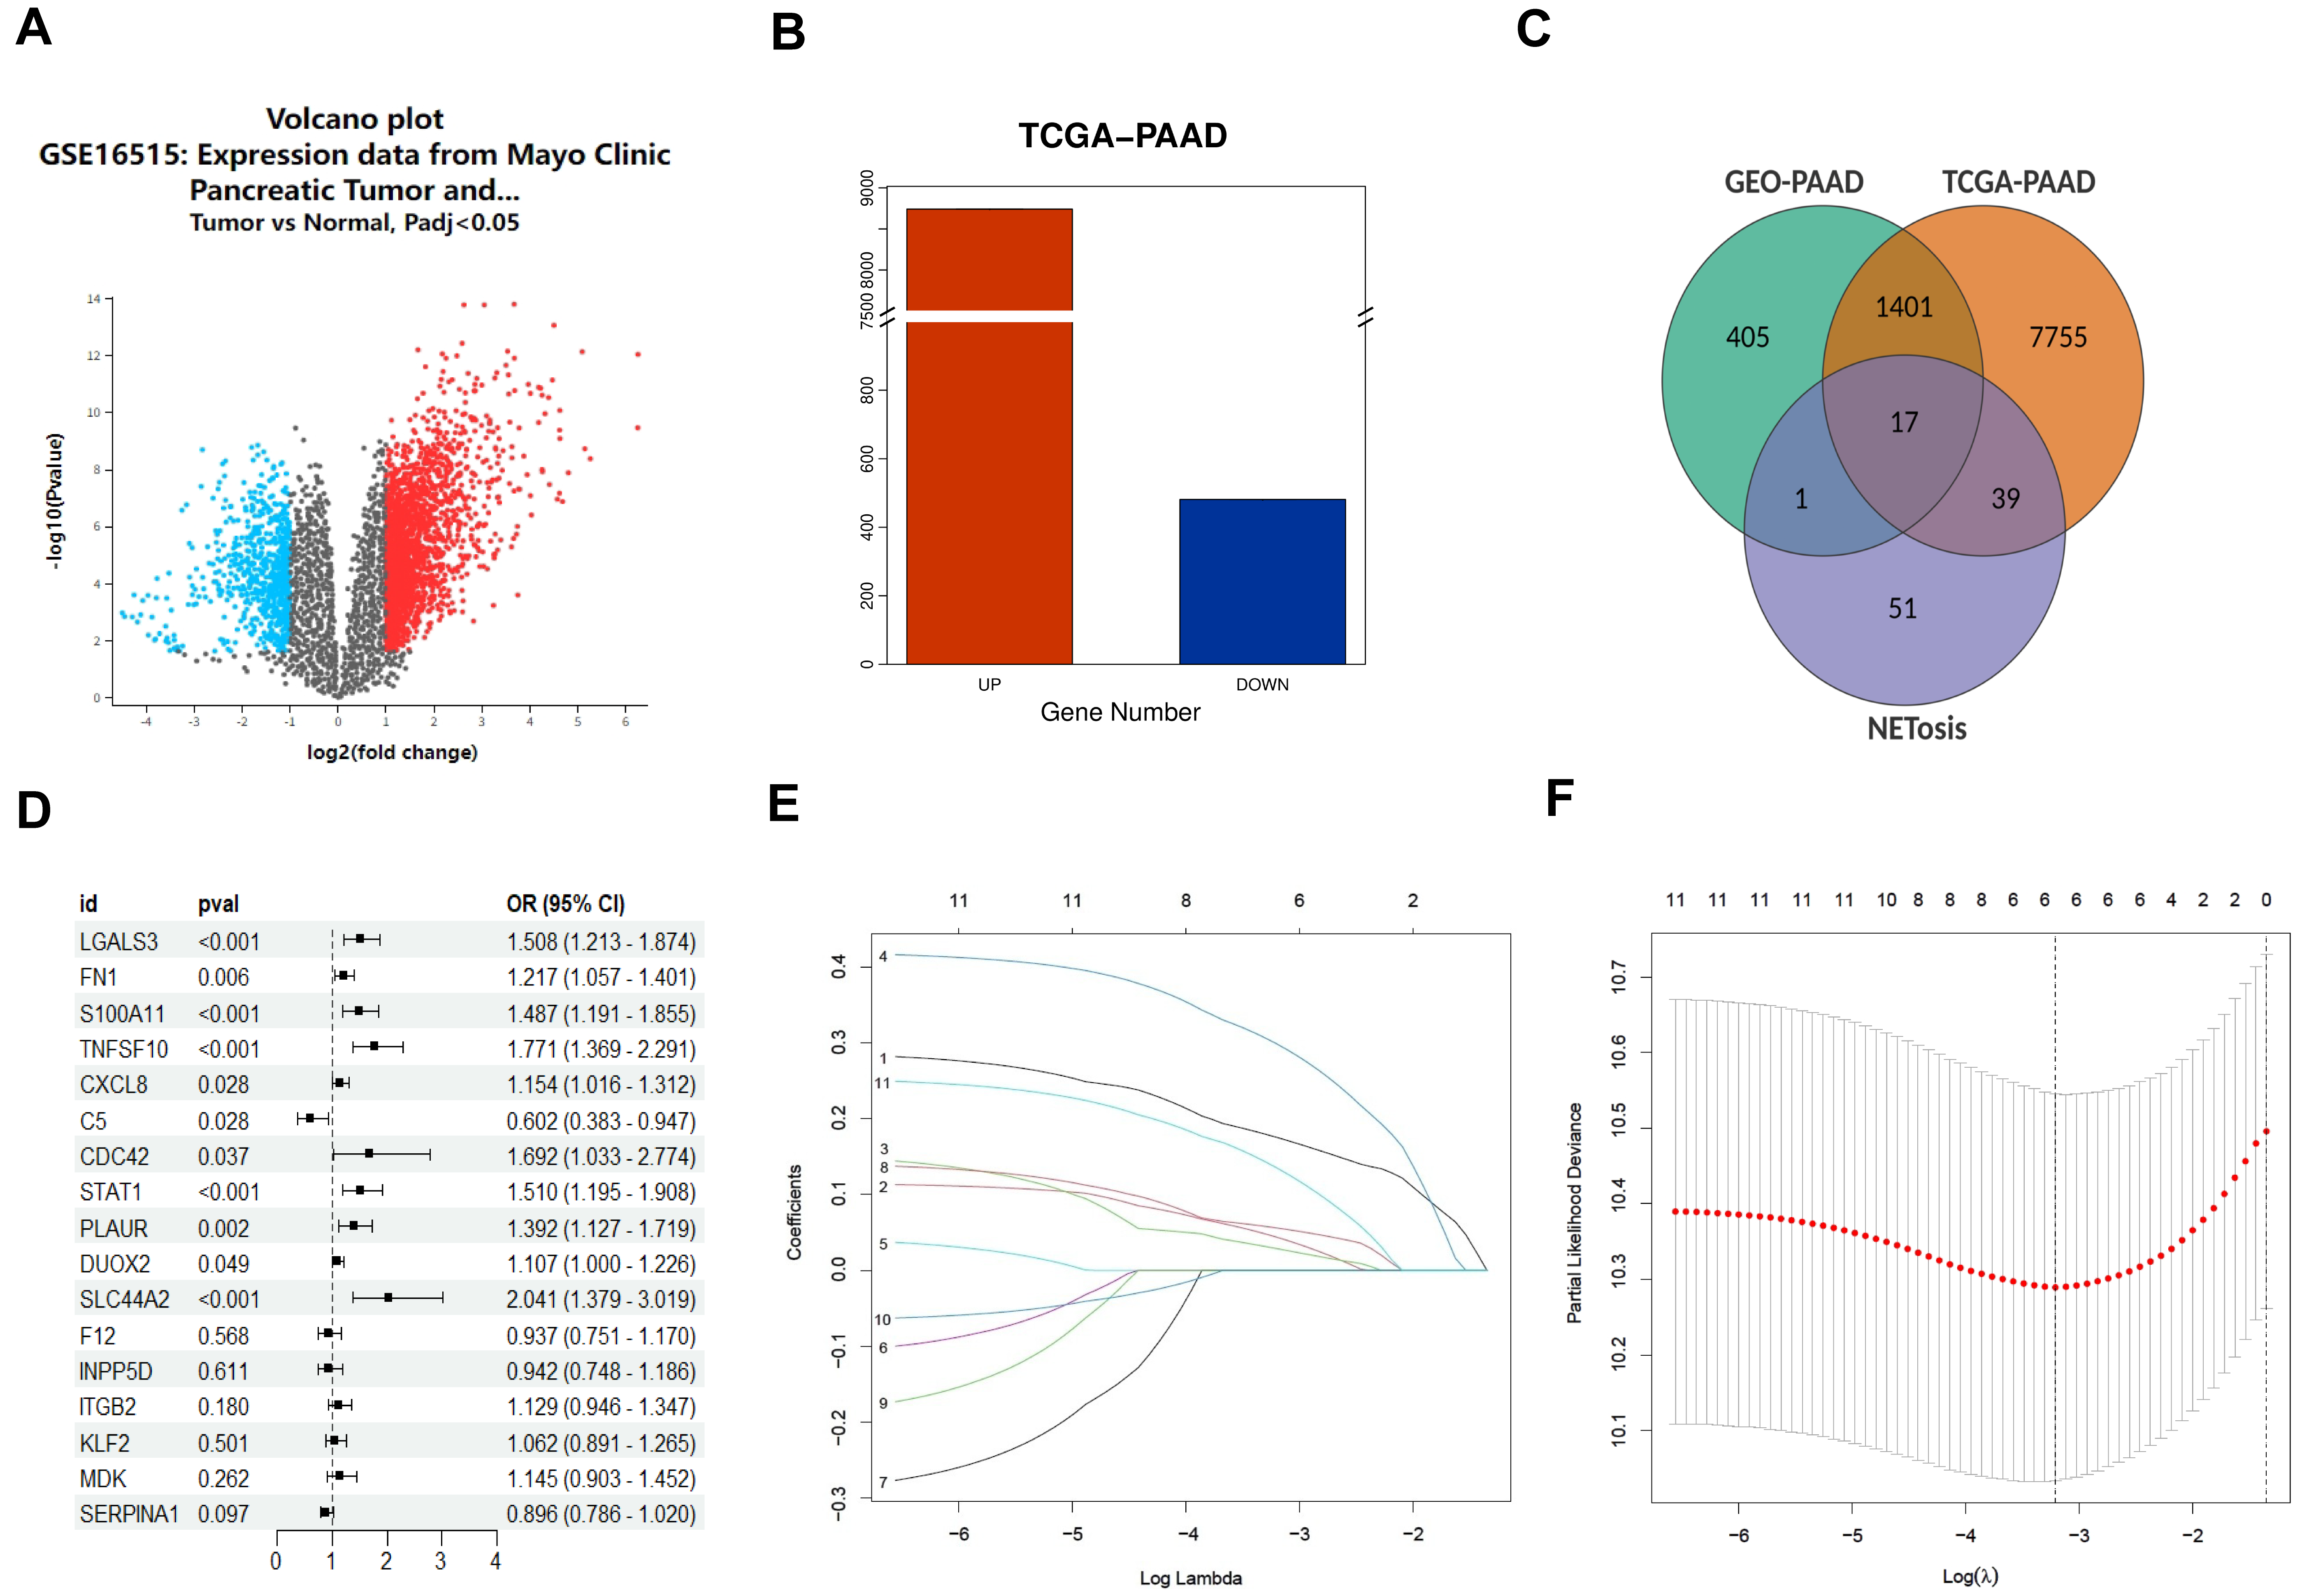 Fig. 1.
Identification of neutrophil extracellular trap related
genes signature. (A) Volcano plot of differentially expressed genes (DEGs) in
GSE16515 dataset. (B) DEGs in The Cancer Genome Atlas - Pancreatic Adenocarcinoma
(TCGA-PAAD) dataset. (C) Venn of neutrophil extracellular trap (NETosis) related
DEGs. (D) Result of univariate Cox regression analysis, and 11 genes showed
p
A predictive gene model was established using the TCGA-PAAD dataset. The queue for the modeling was divided into groups with high and low risks based on the median of the risk score (Fig. 2A). A notable disparity in overall survival (OS) was evident between the low-risk and high-risk groups (p = 0.0159, Fig. 2B). Time-dependent ROC analysis was employed to evaluate the sensitivity and specificity of the prognostic model. The outcomes indicated that the area under the ROC curve (AUC) was 0.736 for 2-year survival, 0.792 for 3-year survival, and 0.872 for 4-year survival (Fig. 2C). Validation queues were derived from the GSE57495 dataset. Fig. 2D presents the dissemination of high- and low-risk classifications. Additionally, according to the Kaplan–Meier analysis, a significant difference in survival rates was detected between the high-risk and low-risk groups (p = 0.0263, Fig. 2E). The ROC curve for the validation dataset revealed that our model performed well in terms of prediction (0.698 for 2-year survival, 0.835 for 3-year survival, and 0.847 for 4-year survival; Fig. 2F).
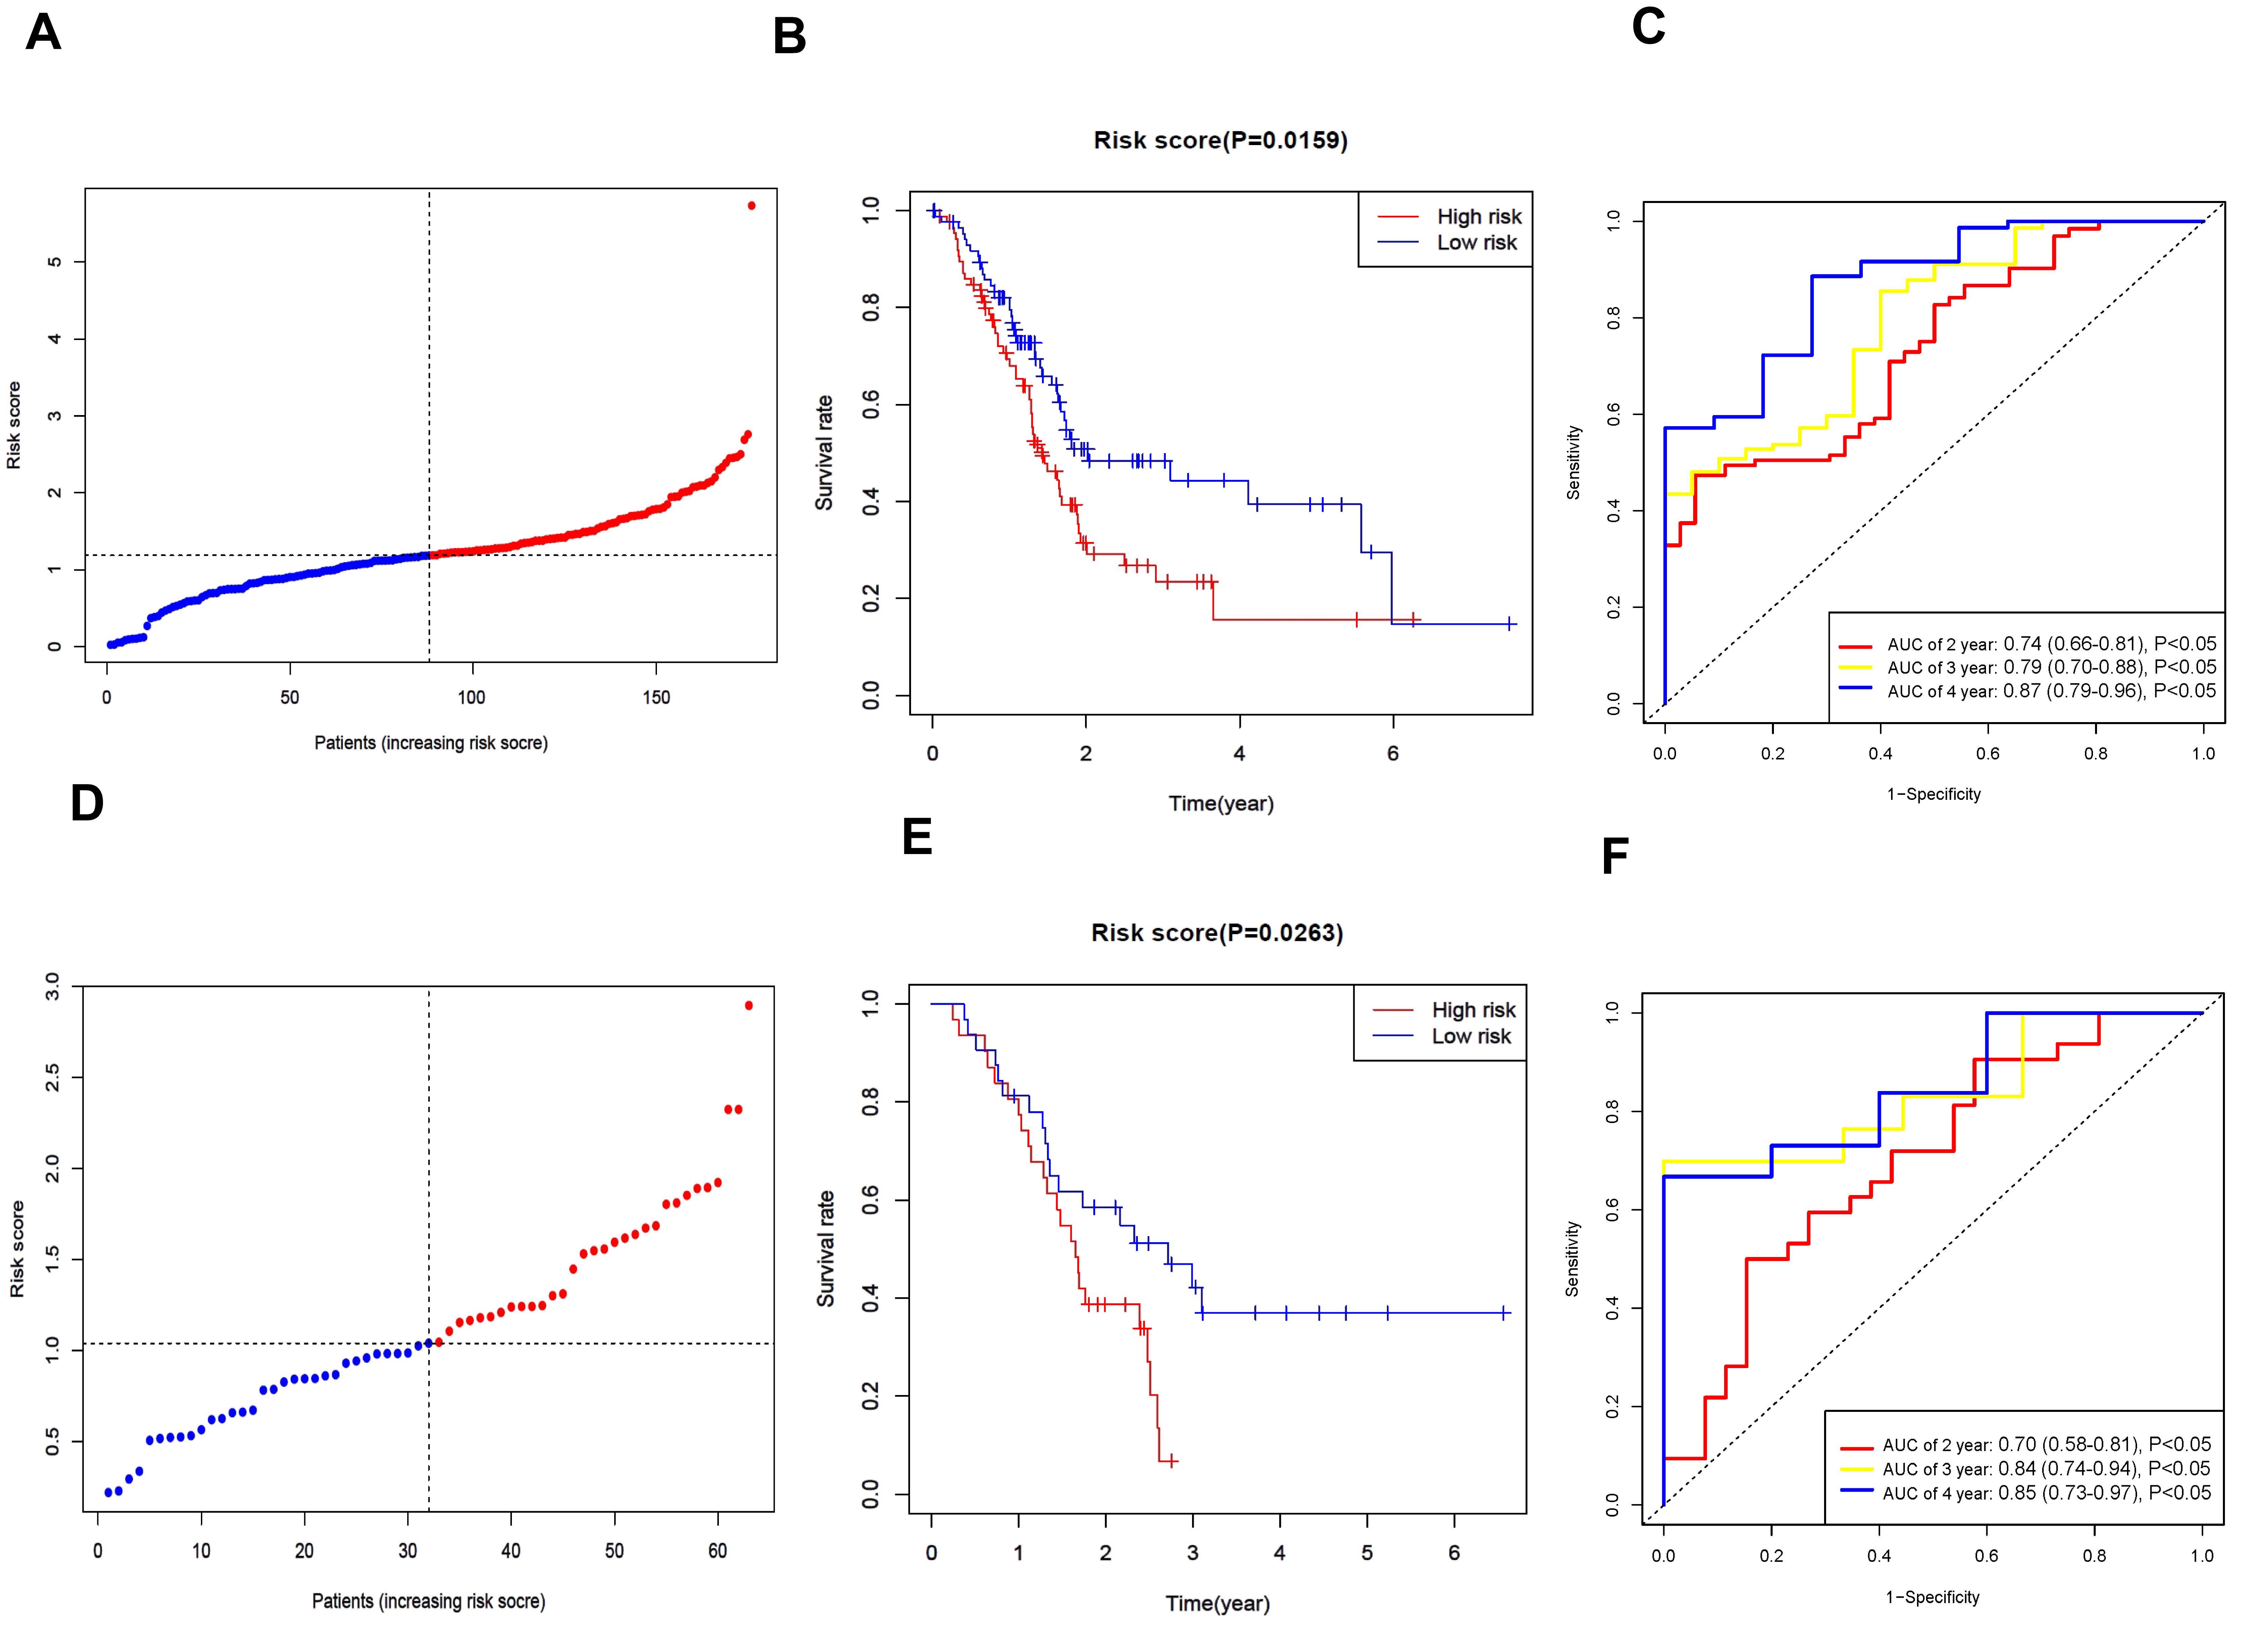 Fig. 2.
Verification of the prognostic model associated with neutrophil extracellular trap. (A) Distribution of modeling queue based on the risk score. (B) The OS for modeling queue in the subunit is represented by Kaplan-Meier (KM) curve. (C) Receiver operating characteristic (ROC) curves of modeling queue. (D) Distribution of verification queue. (E) The OS for verification queue in the subunit is represented by KM curve. (F) ROC curves of verification queue. AUC, area under the ROC curve.
We employed single-sample immune infiltration analysis (ssGSEA) to contrast the
concentration scores of sixteen distinct types of immune cells and the activity
degrees of thirteen immune-associated pathways between the high- and low-risk
cohorts. In the TCGA dataset, it was shown that the high-risk cohort generally
exhibited a greater abundance of activated dendritic cells (aDCs), macrophages,
Th1 cells, and Treg compared to the low-risk cohort (p
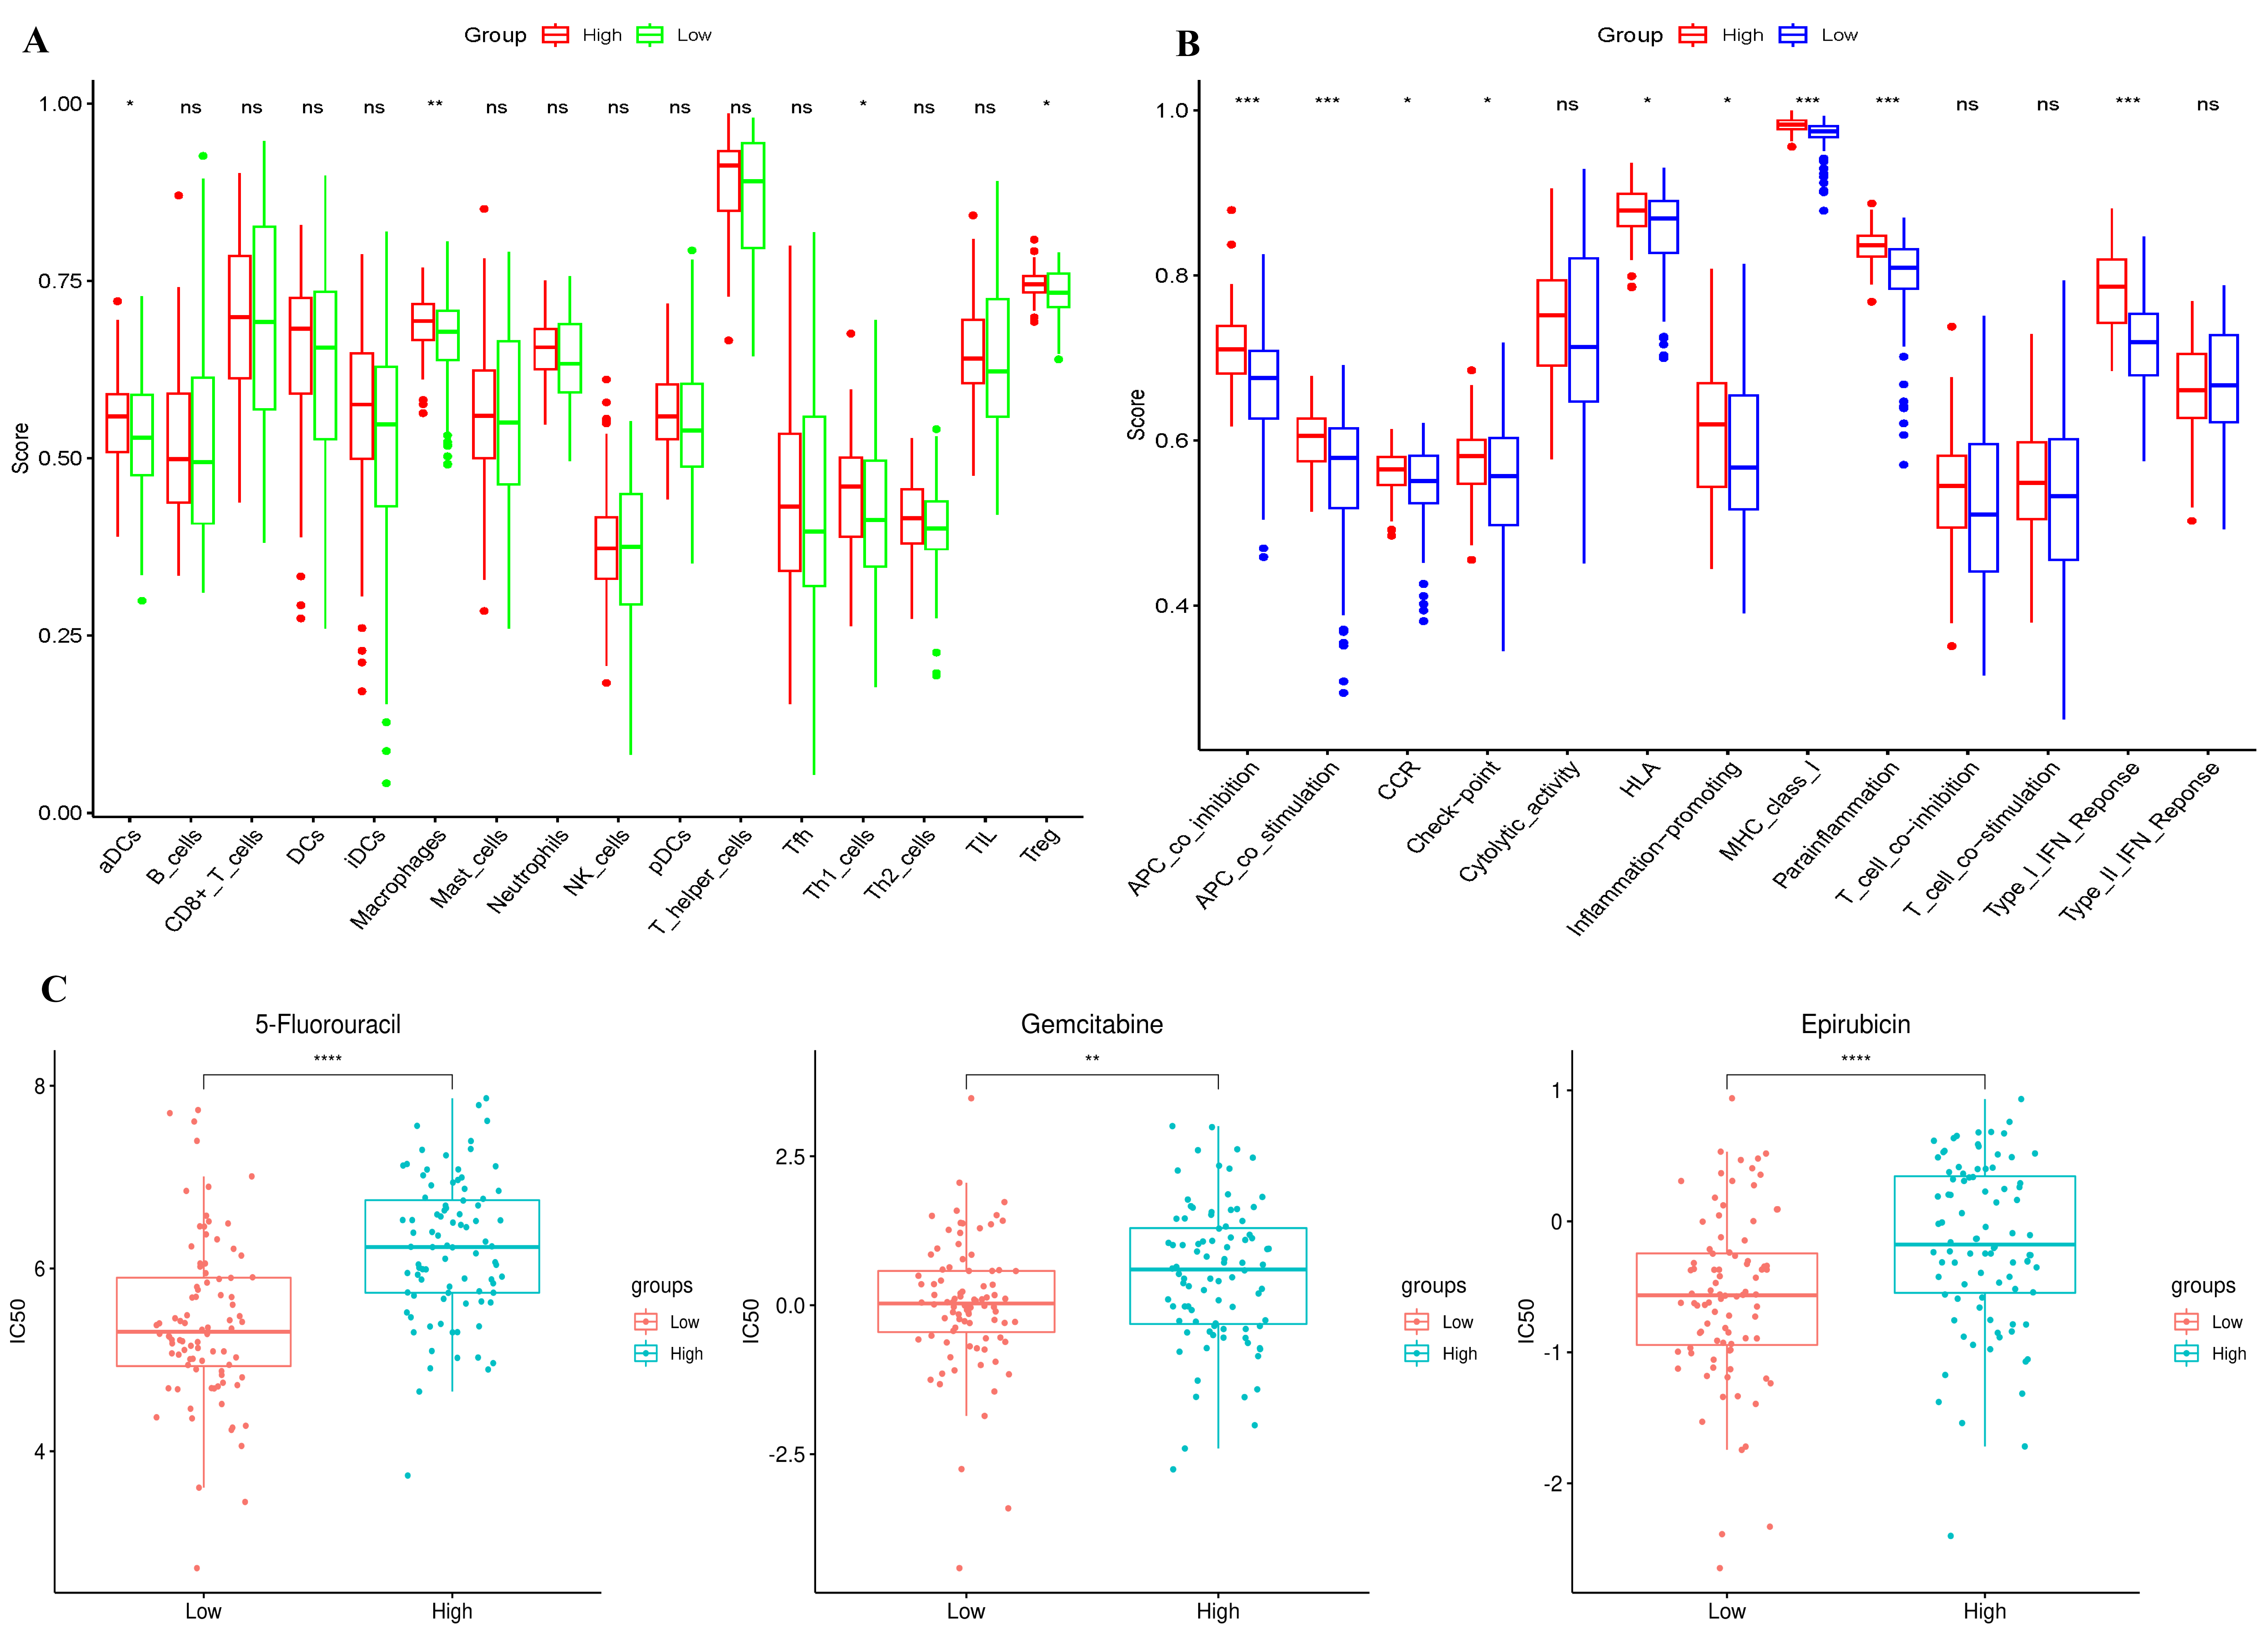 Fig. 3.
Immunoinfiltration and drug susceptibility of
subgroups. (A) In the TCGA cohort, a comparison was made of the enrichment
scores of 16 distinct types of immune cells between subgroups. (B) In the TCGA
cohort, a comparison was carried out regarding the enrichment scores of 13
immune-associated pathways between subgroups. (C) The sensitivity of the
5-fluorouracil, gemcitabine, and epirubicin in various risk groups. ns: p
Eight patients were included in the scRNA-seq dataset (Fig. 4A). A total of 49,056 genes and 6852 cells remained after removing some data with extremely low expression. Dimensionality reduction analysis was conducted using the t-SNE. Six cell clusters were identified (Fig. 4B). The bubble diagram’s results demonstrate that each cell cluster’s marker genes may be effectively distinguished (Fig. 4C). We used a t-SNE diagram to show the expression level of DEGs linked to NETosis in each cell cluster. The results demonstrated that epithelial cells exhibited high levels of LGALS3 and S100A11 (Fig. 4D). Since pancreatic cancer starts in epithelial cells, we speculate that these two genes have a crucial role in controlling the development and growth of tumor cells.
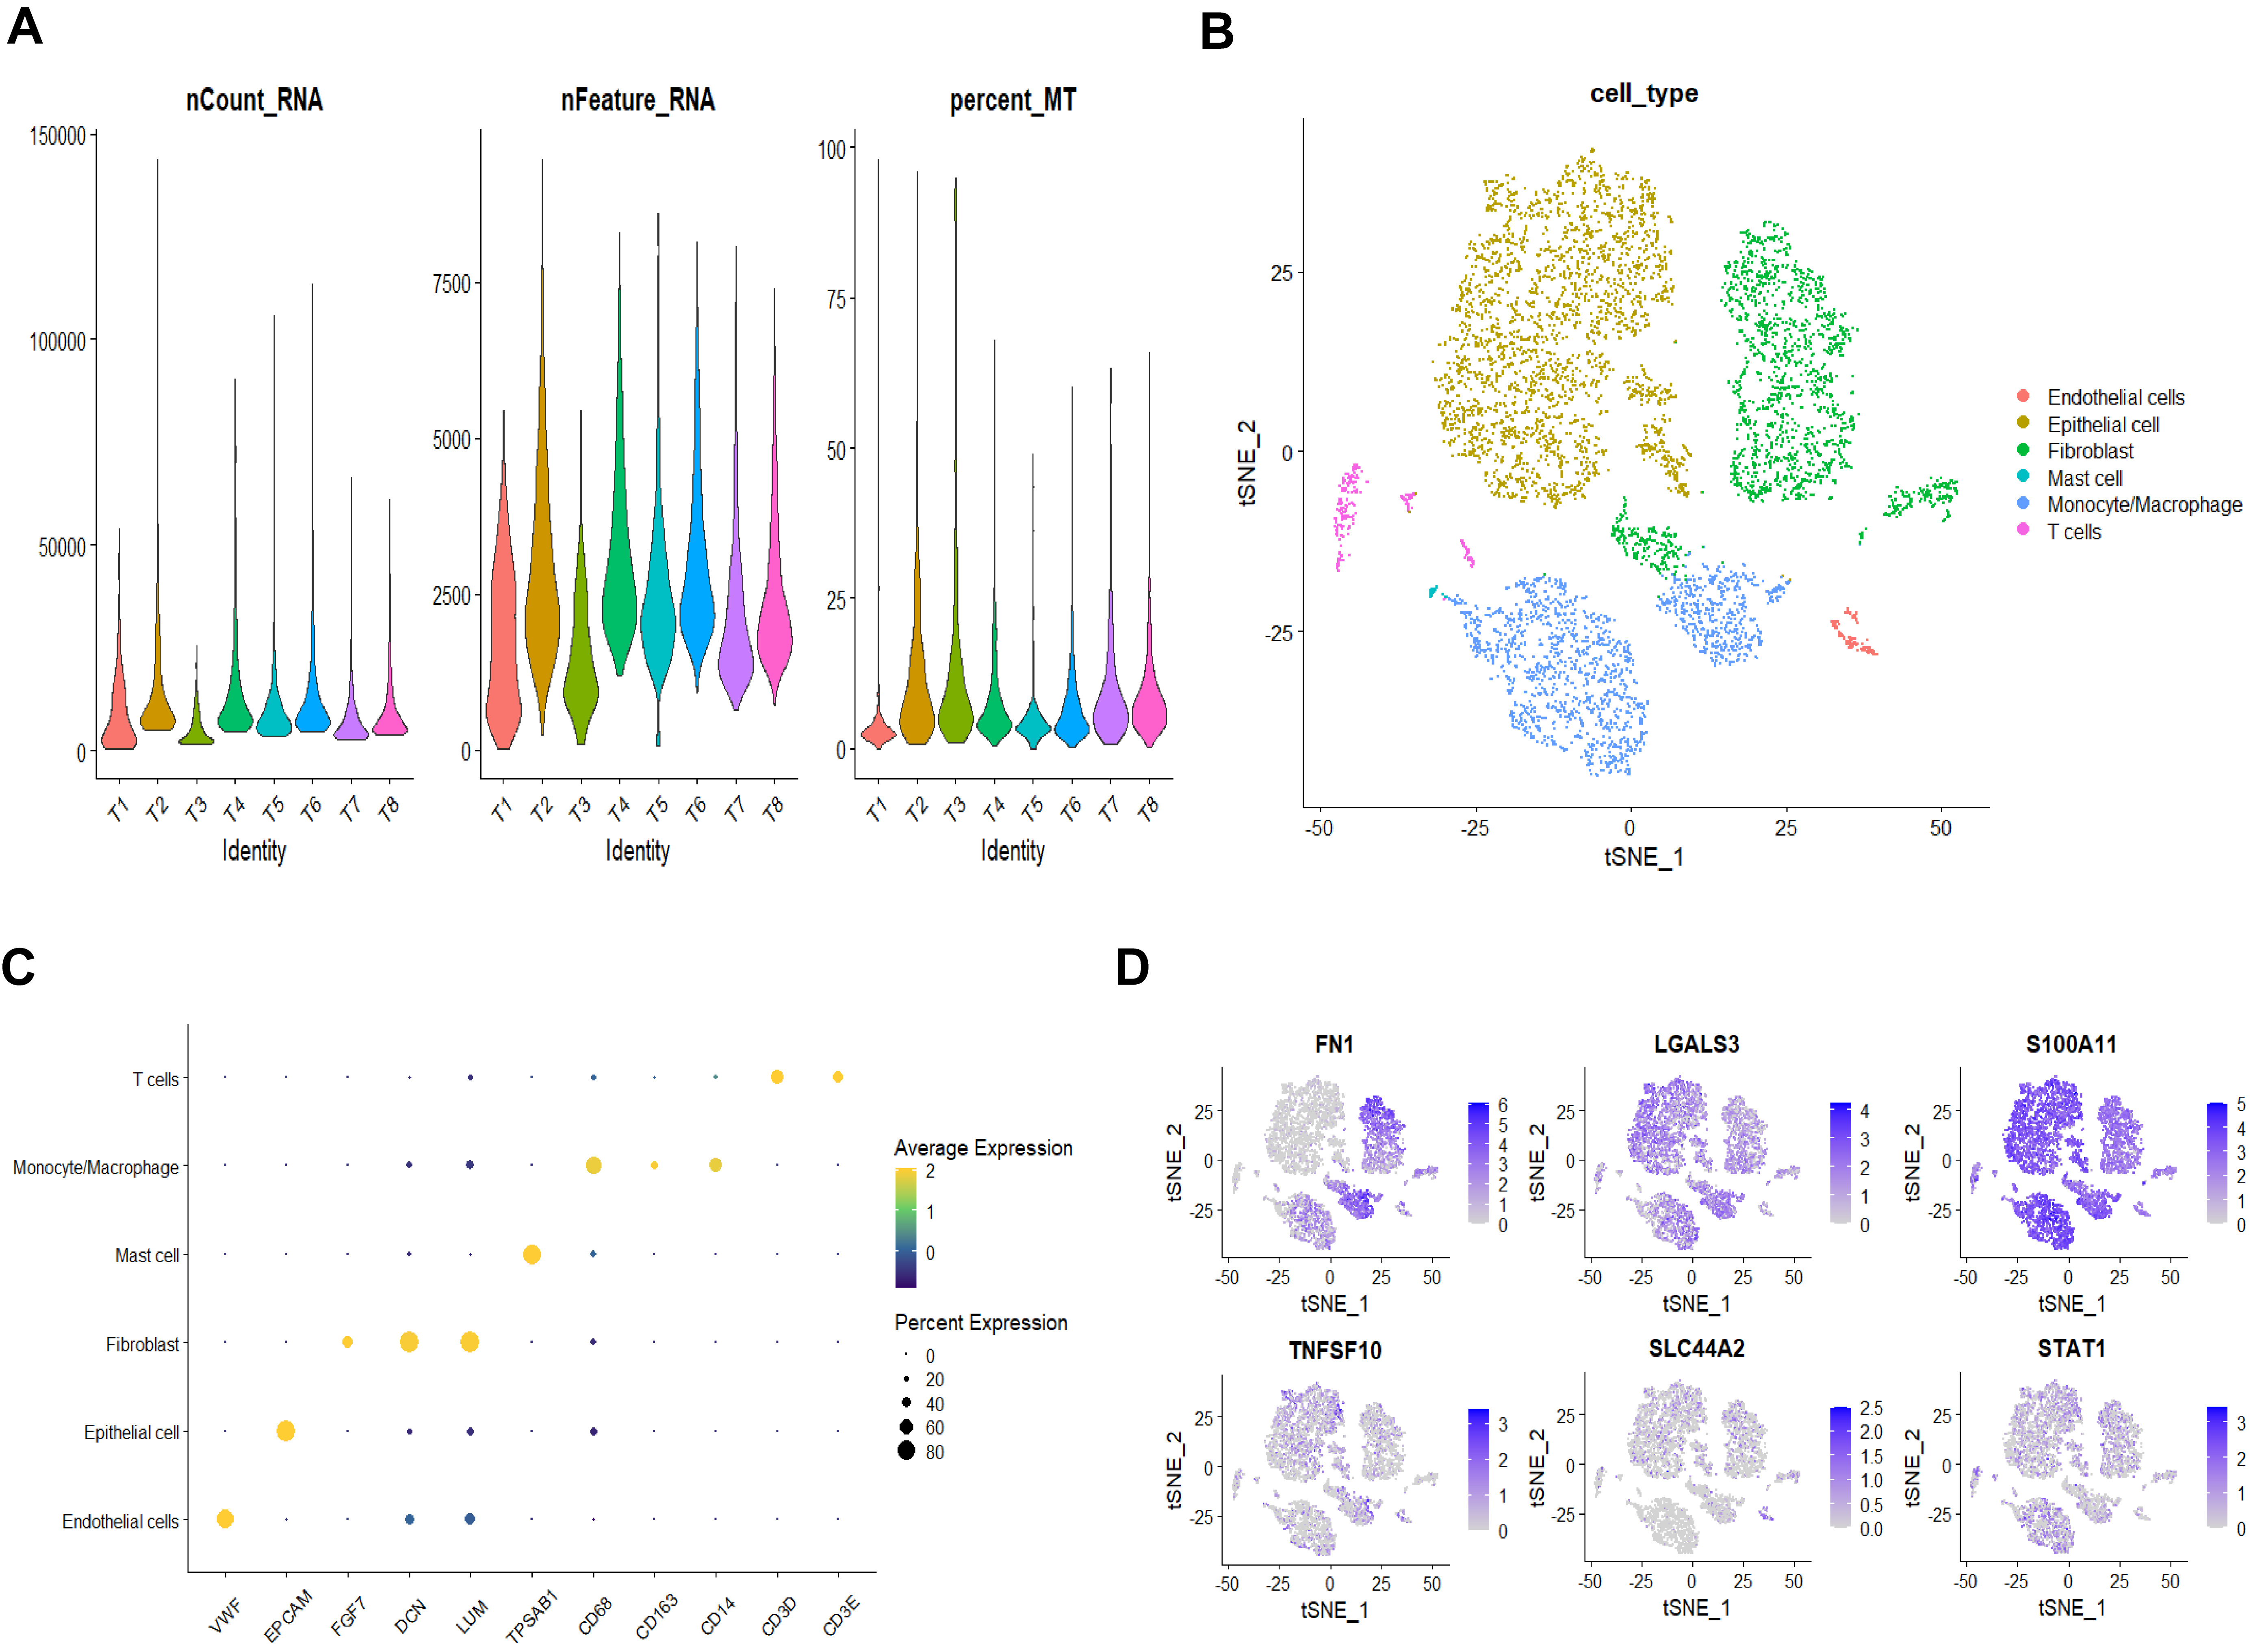 Fig. 4.
Single cell analysis results of pancreatic carcinoma. (A) Quality control results for eight patients. (B) Six clusters were identified based on the dimensionality reduction of t-distributed stochastic neighbor embedding (t-SNE). (C) Bubble diagram showing each cell cluster’s marker gene expression distribution. (D) The expression of NETosis-related DEGs in various cell clusters.
We verified the expression of LGALS3 and S100A11 in HPDE6-C7
and PANC-1 cells by RT-qPCR. The results demonstrated that pancreatic cancer
cells had greater levels of LGALS3, and S100A11 expression than
normal pancreatic duct epithelial cells (p
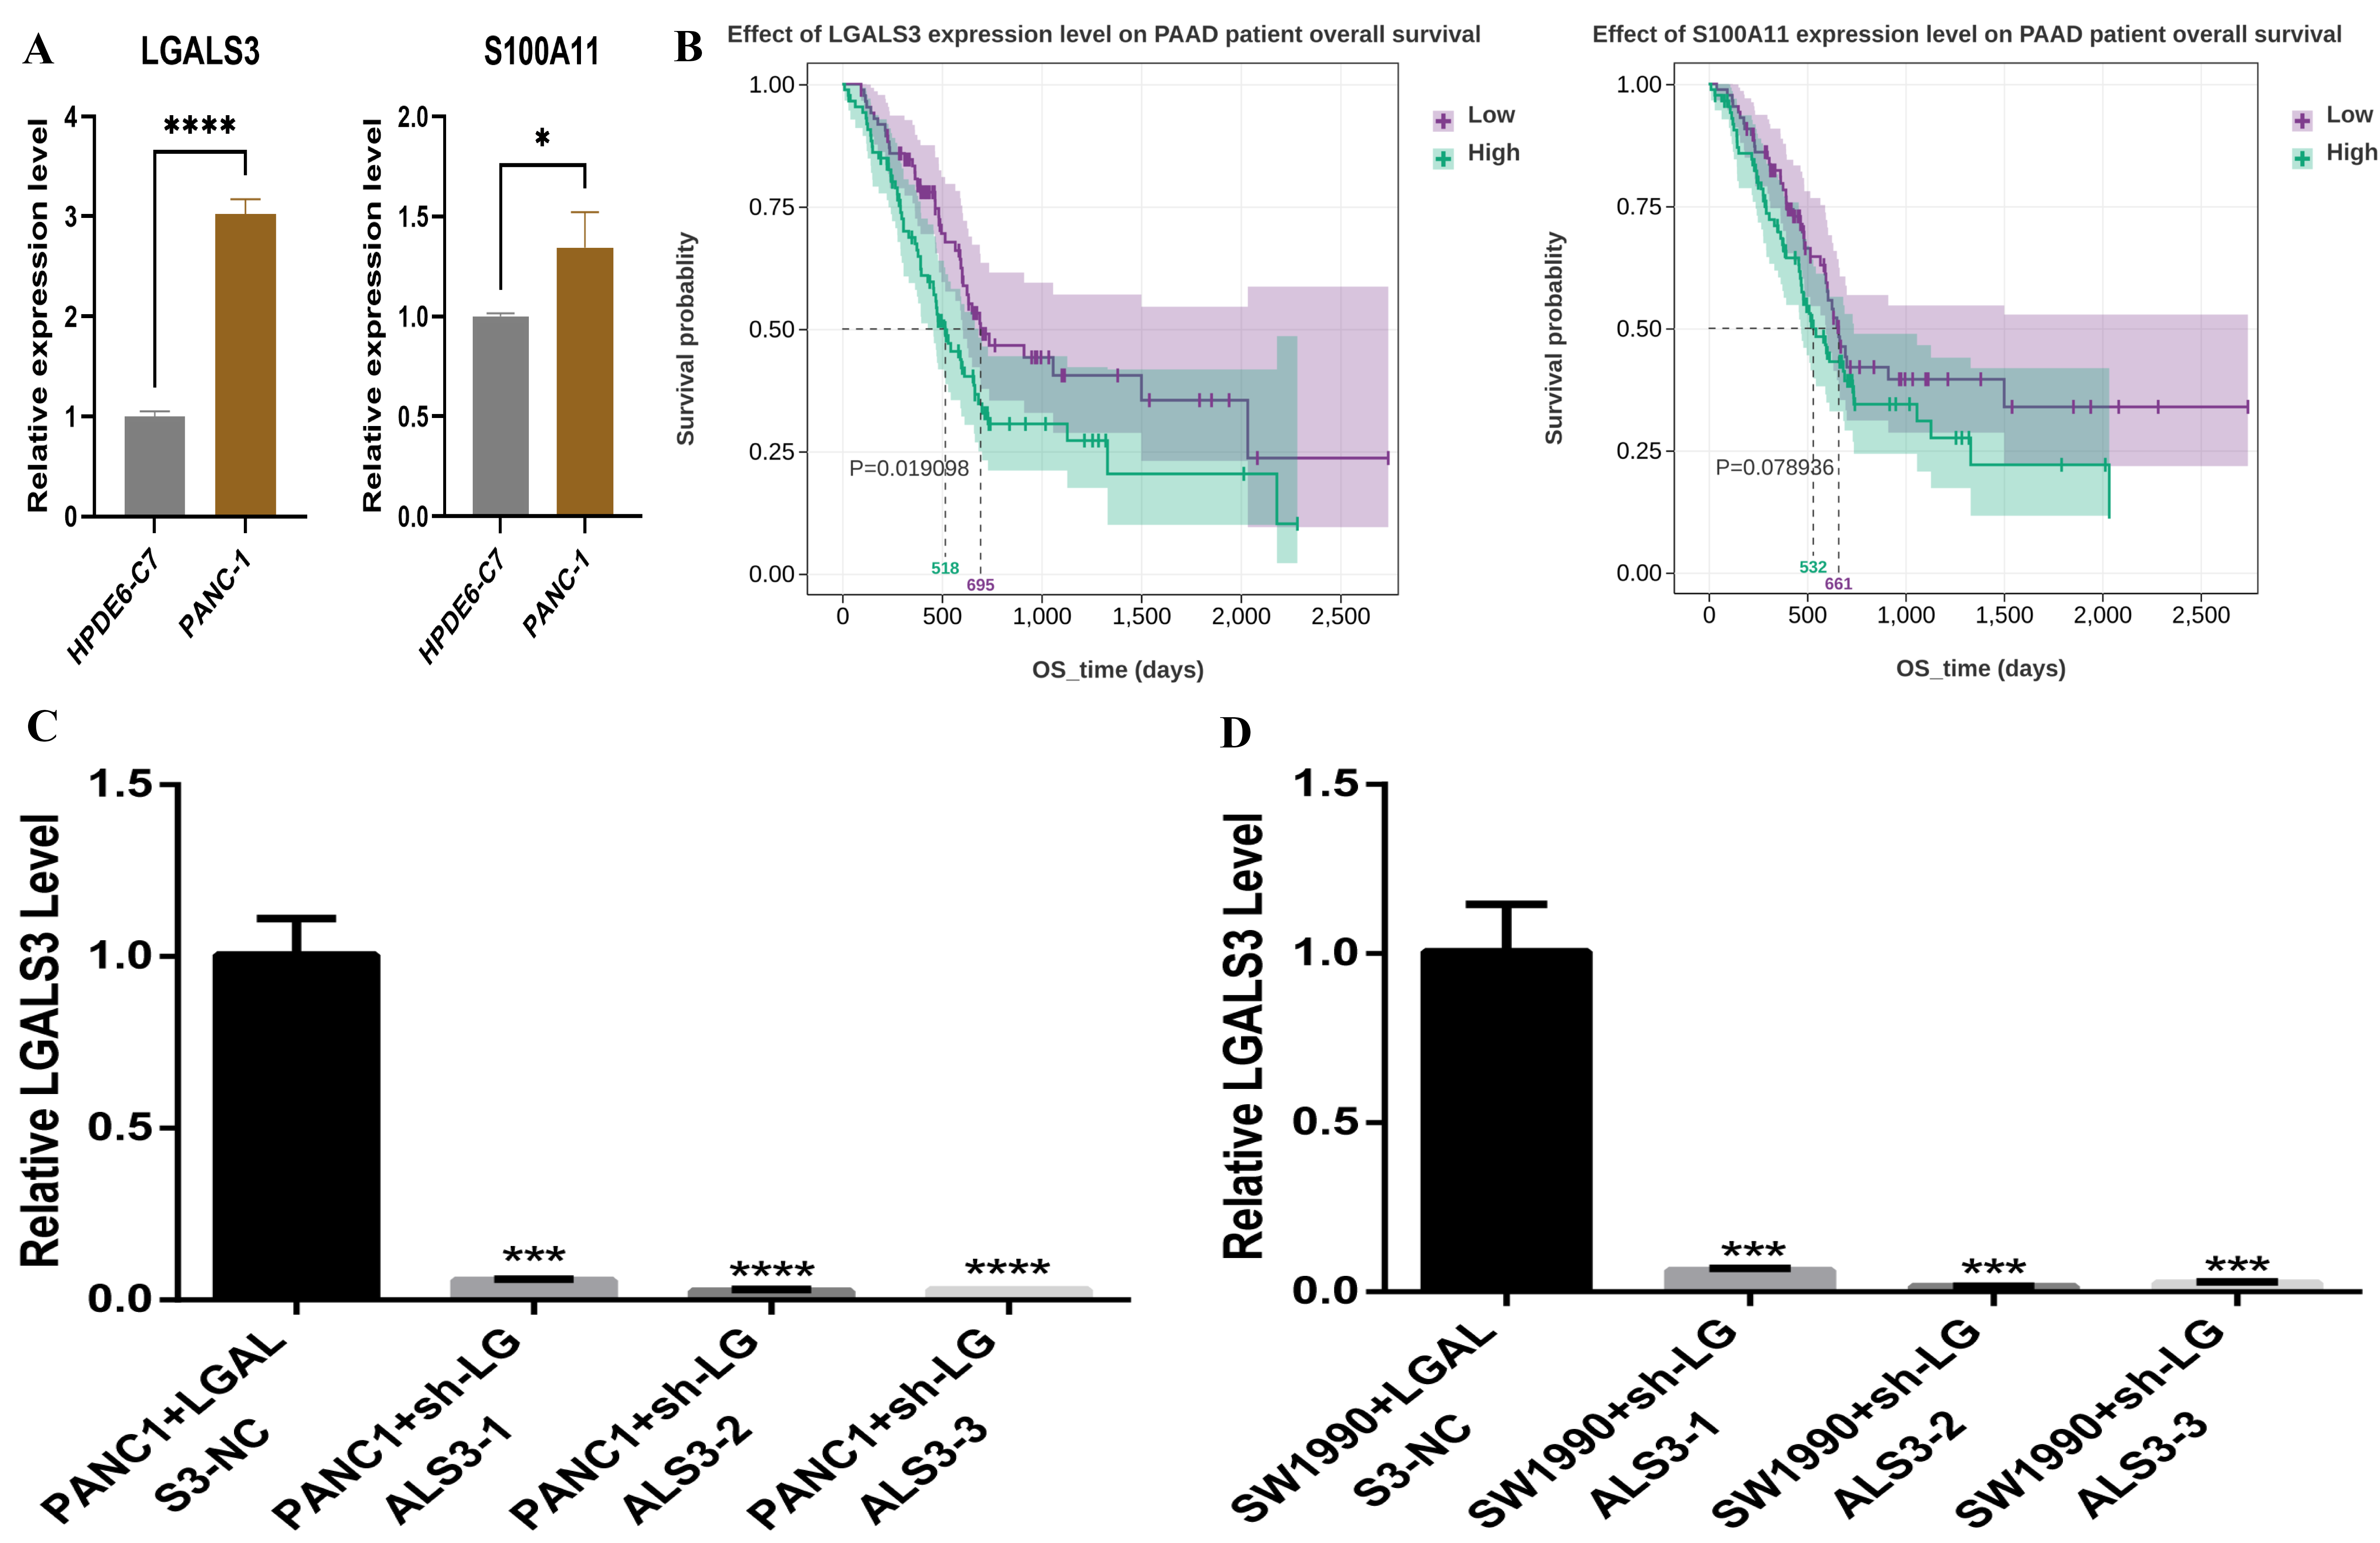 Fig. 5.
Verification of LGALS3 expression level. (A) Reverse
Transcription Quantitative Real-Time Polymerase Chain Reaction verification of
expression levels of LGALS3 and S100A11. (B) Survival analysis
of S100A11 (p = 0.019) and LGALS3 (p =
0.079). (C) Results of interference efficiency of PANC-1 cells. (D) Results of
interference efficiency of SW1990 cells. *: p
To further elucidate the mechanism by which LGALS3 modulates pancreatic
cancer cells, we assessed the proliferative activity and migratory capacity of
two types of pancreatic cancer cells subsequent to transfection with siRNA. The
outcomes of the Cell Counting Kit-8 (CCK8) assay indicated that the proliferative capacity of PANC-1
and SW1990 cells in the Sh-LGALS3-1, Sh-LGALS3-2, and
Sh-LGALS3-3 groups was notably reduced compared to that in the
Sh-LGALS3-NC group (p
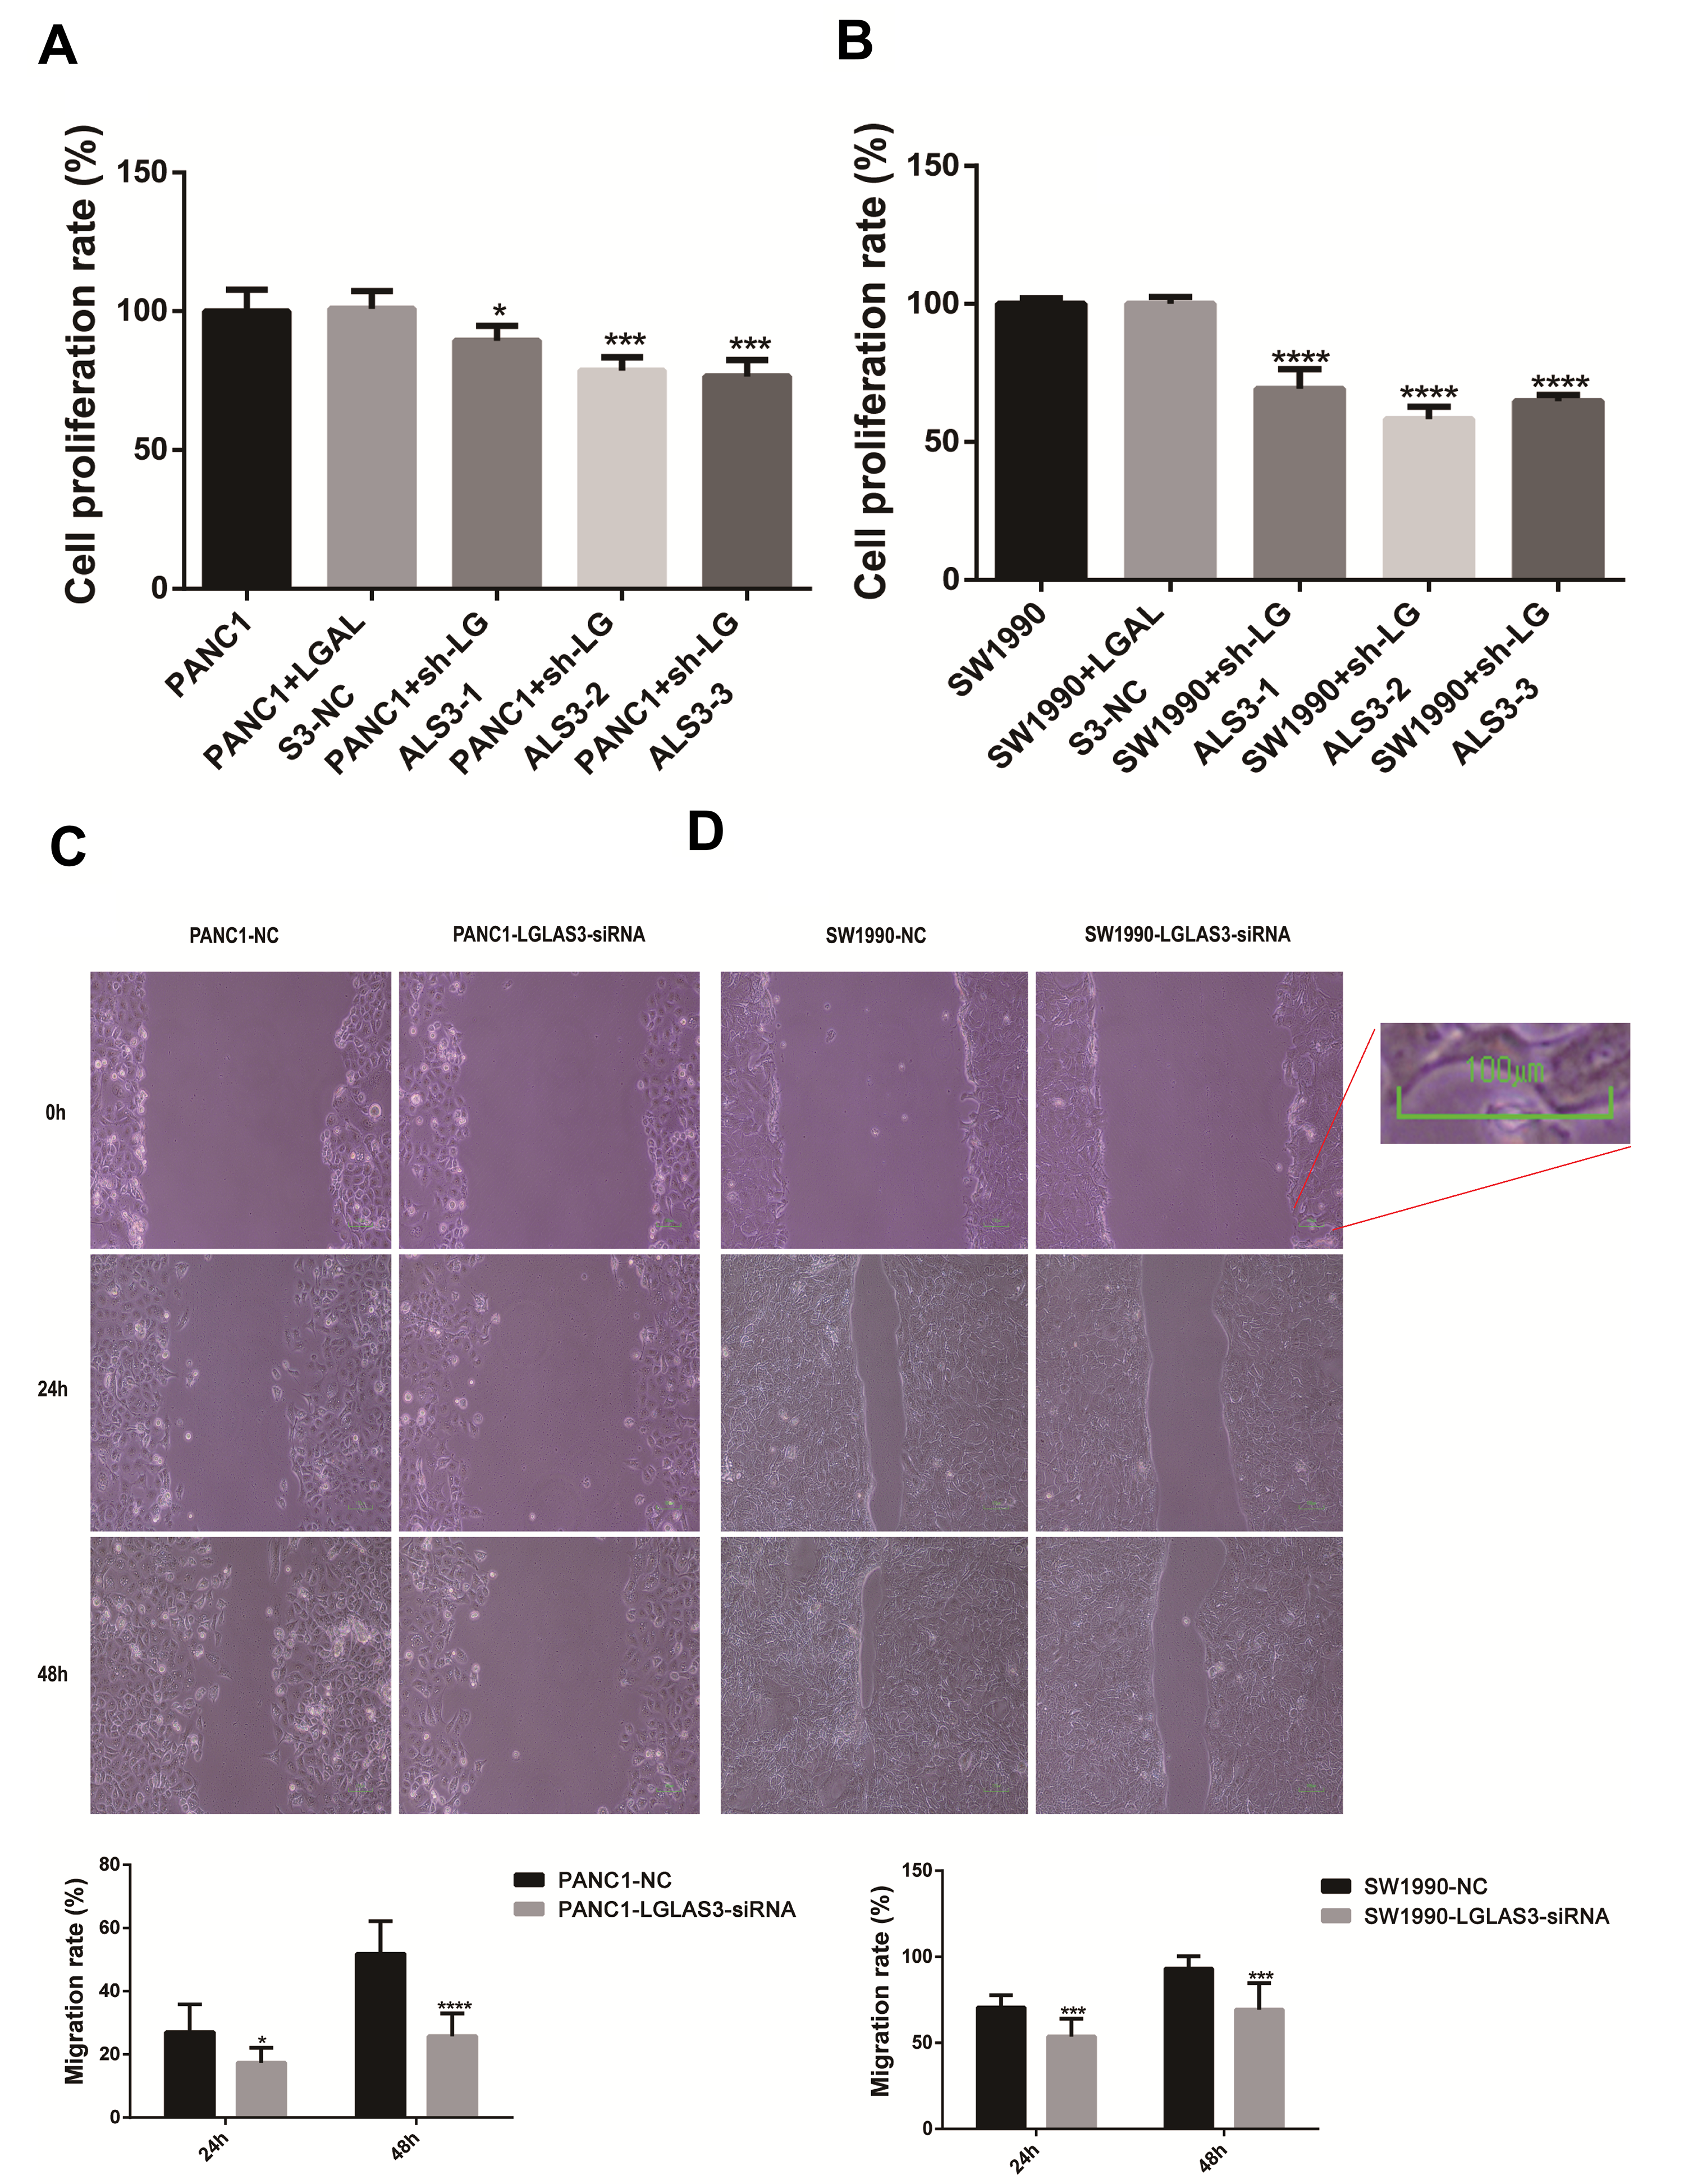 Fig. 6.
Interference with LGALS3 expression prevented PANC-1
and SW1990 cells from proliferating and migrating. (A) Cell Counting Kit-8
(CCK8) results of PANC-1 cells (p
PC is a common type of malignant tumor. It shows rapid progression, a high mortality rate, and a poor prognosis. Recent studies have revealed that NETosis is an innovative form of cell death crucial for the development of malignancies and therapeutic approaches [13]. The tumor microenvironment releases neutrophil extracellular traps that shield tumor cells from cytotoxic immunity, thereby compromising tumor clearance. However, arteries also can be penetrated by tumor cells collected by neutrophil extracellular traps, which can then be seeded into distant organs [11]. In both PC and normal organizations, we initially acquired 17 DEGs associated with NETosis. Six genes (FN1, STAT1, TNFSF10, SLC44A2, LGALS3, and S100A11) prognosis models were created by LASSO, and their predictive value was assessed. NETosis-related gene features were identified in this study, offering theoretical support for further studies.
In malignant tumors, cell motility, epithelial–mesenchymal transition, and
tight junctions between cells may be associated with NETosis. For instance, by
activating m6A, the up-regulation of IGF2BP3 expression in malignant gliomas
regulates the release of CSF3, causes NETosis, and subsequently stimulates tumor
growth [17]. By attracting immune cells and increasing vascular permeability,
Epithelial-Mesenchymal Transition (EMT) of malignant tumors also contributes to
the development of NETosis, which causes distant areas to metastasize [18].
Furthermore, immune cells use a variety of mechanisms, including the production
and release of NETosis, to take part in both innate and adaptive immune responses
[19]. As a result, the process by which NETosis forms is complicated, and in
addition to certain substances that the tumor itself releases, the immunological
microenvironment is also crucial. Fibronectin 1 (FN1) is distributed
across the extracellular matrix [20]. FN1 has the ability to control
signal transduction, migration, and cell adhesion [21]. By controlling
inflammation and cancer cell motility, FN1 can facilitate NETosis in the
tumor microenvironment and facilitate contact with NETs, hence influencing the
progression of cancer. In the nucleus, STAT1 transduces signals from
type I and type II interferons, serves as the primary mediator of the cellular
response to interferons, and is a critical player in the immunological response
[22]. Neutrophils with STAT1 gain-of-function (GOF) mutations are young
and highly activated, and they are highly susceptible to platelet-neutrophil
aggregation, NETosis, and degranulation [23]. Apart from the tumor itself,
STAT1 activation affects the immunological milieu in a variety of ways.
It can also indirectly cause NETosis by controlling inflammatory factors, which
in turn influence tumor growth [24]. TNFSF10 is a factor responsible for
tumor necrosis. It belongs to the tumor necrosis factor superfamily [25]. The
“death receptor” TNFSF10 is mostly expressed by immune cells.
Apoptosis can be triggered and different cell activities can be controlled by
activating these receptors [26]. By triggering associated signal pathways,
TNFSF10 can influence neutrophil activity and function, controlling
NETosis and influencing the course of cancer. SLC44A2, the second member
of solute carrier family 44, has been shown by Constantinescu-Bercu et
al. [27] to mediate venous thromboembolism (VTE) and NETosis, and these two
pathological conditions promote each other [28]. Substances released following
platelet activation can activate neutrophils in the tumor microenvironment
through receptors such as SLC44A2, forming a platelet–neutrophil
complex and causing NETosis [29]. This has an impact on the angiogenesis,
metastasis, and proliferation of tumor cells. Galectin 3 belongs to the family of
proteins that bind to
In summary, these six genes are crucial for regulating the immune system and the growth of tumors. Certain genes (including LGALS3, S100A11, etc.) can directly influence the migration and proliferation of tumor cells in addition to controlling the immunological milieu and the development of NETosis, which will have a significant impact on the prognosis of patients. Our research also verified that the two groups separated by this gene cluster had significantly different survival outcomes. Furthermore, we discovered that the immune cells in subgroups, which were separated by the prognostic model, differed considerably by the examination of immune infiltration: ADCs, macrophages, TH1 cells, Treg, and a variety of immunological activities, including APC_co_inhibition, APC_co_stimulation, CCR and so on. These abnormal immunological processes may encourage tumor immune escape and alter medication sensitivity [34]. According to the results of our investigation, 5-fluorouracil, gemcitabine, and epirubicin may benefit the high-risk group, which will enhance the individualized and accurate treatment of more patients with pancreatic cancer.
Epithelial cells are the source of pancreatic cancer cells. The highly expressed genes (LGALS3 and S100A11) in the tumor cells may be found by single-cell analysis. By combining RT-qPCR and survival analysis, we can find the crucial core gene LGALS3. Lastly, we used siRNA to disrupt LGALS3 expression in PANC-1 and SW1990, and we discovered that the gene was crucial in controlling tumor migration and proliferation. These research results will assist in building gene detection assays in the future, predicting the outcome of patients suffering from PC during the initial phase, and providing novel treatment options to patients through focused intervention in the NETosis immune response.
There are some limitations to this study: (1) The magnitude of the sample in scRNA-seq data is extremely limited, and future efforts to expand the sample size are necessary. (2) The present study aims to reveal the relationship between NETosis and the occurrence and progression of pancreatic cancer, further investigation is required to determine the precise pathway of important genes.
In this research, a characteristic model involving six genes associated with NETosis was developed. This model exhibits excellent discriminatory capabilities and can offer guidance for the personalized and more precise treatment of high-risk populations. LGALS3 has the ability to modulate the proliferation and migration of pancreatic cancer cells, subsequently triggering tumor progression. The identification of these genes holds the promise of serving as novel therapeutic targets for pancreatic cancer.
The analyzed data sets generated during the study are available from the corresponding author on reasonable request.
Conception and design: JXX, LYT, YC, LHJ. Provision of study materials and methodology: LHJ, JXX and LJM. Collection and assembly of data: JXX, LYT, LJM and QST. Data analysis and interpretation: YC, JXX and LYT. Manuscript writing: All authors. All authors have participated sufficiently in the work to take public responsibility for appropriate portions of the content and agreed to be accountable for all aspects of the work in ensuring that questions related to its accuracy or integrity. All authors read and approved the final manuscript. All authors contributed to editorial changes in the manuscript.
Not applicable.
Not applicable.
This research is supported by Yunnan Provincial Key Laboratory for Innovative Application of Traditional Chinese Medicine (202205AG070005), National Natural Science Foundation (82460095, 82460096) and Major scientific and technological projects in Yunnan Province (202402AA310006).
The authors declare no conflict of interest.
References
Publisher’s Note: IMR Press stays neutral with regard to jurisdictional claims in published maps and institutional affiliations.