


 , Meng-yao Song 2,†, Xing Hu 1, Xue-hua Sun 1, Tao Zhang 1, Lu Zhang 1, Ying-xiong Wang 3, Qian Zhang 2, Chun-dong Zhang 1,*
 , Lian Zhang 4,*
1 Department of Biochemistry and Molecular Biology, School of Basic Medical Sciences, Chongqing Medical University, 400016 Chongqing, China
2 Laboratory Animal Center, Chongqing Medical University, 400016 Chongqing, China
3 The Joint International Research Laboratory of Reproduction and Development, Department of Reproductive Biology School of Public Health, Chongqing Medical University, 400016 Chongqing, China
4 Department of Histology and Embryology, School of Basic Medical Sciences, Chongqing Medical University, 400016 Chongqing, China
†These authors contributed equally.
Abstract
Lung cancer is the primary cause of cancer-related mortality, but the molecular mechanisms behind this malignancy remain unclear.
The Cancer Genome Atlas (TCGA) online database and tissue chips were used to analyze the expression levels of tumor necrosis factor receptor-associated factor 2 (TRAF2)- and non-catalytic region of tyrosine kinase adaptor protein (NCK)- interacting kinase (TNIK) protein in lung cancer. A549 and PC-9 lung adenocarcinoma (LUAD) cells with stable TNIK knockdown were generated by lentivirus infection. The tumor phenotypes were subsequently examined both in vitro and in vivo. The TCGA online database and RNA-sequencing of TNIK-knockdown cells were used to study the molecular mechanism underlying the TNIK-mediated phenotype of LUAD cells. The effects of TNIK knockdown on focal adhesion dynamics and mitosis were examined by indirect immunofluorescence and Western blot, on the sensitivity to chemotherapy drugs by cell counting kit-8 (CCK-8) assay, on apoptosis by flow cytometry, and on cell proliferation by 5-ethynyl-2′-deoxyuridine (EDU).
TNIK was highly expressed in LUAD (p < 0.0001), predominantly in the cytosol. Phenotype assays revealed that TNIK knockdown in LUAD cells led to a significant increase in cell spreading (p < 0.0001), but also inhibition of cell growth and movement (p < 0.01). Mechanistically, TNIK was found to regulate F-actin and microtubule organization, as well as the Ras homolog gene family (RHO)/RHO-associated kinase 2 (ROCK2)/LIM motif-containing protein kinase 1 (LIMK1) signaling pathway, thereby playing a crucial role in the control of focal adhesion turnover and mitosis. Additionally, the silencing of TNIK enhanced the sensitivity of LUAD cells to chemotherapeutic drugs.
Our findings suggest that TNIK regulates focal adhesion turnover and mitosis to promote tumor malignancy via the RHO/ROCK2/LIMK1 pathway. The combination of TNIK targeting with chemotherapeutic drugs could be an effective strategy to overcome resistance in LUAD.
Keywords
- TNIK
- LIMK1
- actins
- microtubules
- adenocarcinoma of lung
Lung cancer is one of the most common malignancies and the leading cause of cancer-related deaths globally [1]. For the majority of these patients, chemotherapy is no longer the best treatment option. Future improvements are likely to come from better ways to combine immunotherapy, chemotherapy and targeted therapy through the identification of the tumors’ molecular characteristics [2, 3]. Therefore, acquiring a deeper understanding of the molecular mechanisms that underlie lung cancer should help in the development of more effective combination therapies.
Cells undergo changes in shape during movement and mitosis. In cancer cells grown in culture, flat and adherent cells during interphase and quiescence can transform into spherical and weakly adherent cells during mitosis and movement [4]. Focal adhesions (FAs) play an important role in regulating cell shape, migration, division and therapy resistance [5, 6, 7]. FAs are micron-sized, actin-based structures that connect cells to the extracellular matrix (ECM). They are made up of different signaling, catalytic (e.g., protein kinases, phosphatases, proteases), cytoskeletal, adaptor and scaffold proteins [8]. The key component of FAs is focal adhesion kinase (FAK), which is also present at other sites in the cell where it performs crucial tasks [9]. Nuclear localization of FAK has been demonstrated to enhance cancer cell survival [10]. The spatiotemporal modulation of FA dynamics is coordinated by actin–microtubule crosstalk [4]. Disruption of F-actin and microtubule organization can inhibit the disassembly of FAs, thereby disrupting downstream signaling [6, 8]. Members of the Ras homolog gene family (RHO) family of small GTPases are key participants in actin–microtubule crosstalk. The best characterized RHO GTPases are RHO, Rac and Cdc42. LIM motif-containing protein kinase 1 (LIMK1) is a downstream signaling target of the RHO/RHO-associated kinase (ROCK) pathway and is essential in cytoskeletal rearrangement by remodeling both actin filaments and microtubules [11, 12].
Traf2- and Nck-interacting kinase (TNIK) is a member of the germinal center kinase (GCK) family. It is localized in the cytoplasm where it interacts with and phosphorylates cytoskeletal structures [13]. Human TNIK is comprised of three domains: a C-terminal region, an intermediate domain and an N-terminal kinase domain with the ATP-binding site. The latter serves as a target for the development of small-molecule inhibitors [14]. The C-terminal domain is known as the citron homology (CNH) domain, is conserved in GCK kinases, and has been shown to activate the c-Jun N-terminal kinase (JNK) pathway [15]. In addition, this domain regulates the actin cytoskeleton through its interaction with Rap2, a small GTPase member of the Ras family [16].
TNIK is an oncogenic “driver” kinase that has been targeted by several small inhibitors in a variety of cancer types [17, 18, 19]. Therefore, in the present work, we sought to investigate the role and underlying mechanisms by which TNIK regulates lung cancer development and progression, and to explore the potential of TNIK inhibition in combination with chemotherapy as a novel therapeutic strategy to enhance lung cancer treatment efficacy.
The TCGA-lung adenocarcinoma (LUAD) (Firehose Legacy, 586 samples) and TCGA-lung squamous cell carcinoma (LUSC) (Firehose Legacy, 511 samples) reverse-phase protein array (RPPA) datasets were sourced from cBioPortal (https://www.cbioportal.org/) for Cancer Genomics. Samples with higher expression of TNIK protein as indicated by z-scores in RPPA were collected: 14 LUAD samples with high expression of TNIK, and 140 LUSC samples with high expression of TNIK. The gene expression profiles of LUAD and LUSC RNAseq (Firehose Legacy) were downloaded from xenabrowser.net (https://xenabrowser.net/datapages/). Gene set enrichment analysis (GSEA) (https://www.gsea-msigdb.org/gsea/index.jsp) was used to compare the mRNA profile of tumor tissues with high expression of TNIK in the RPPA to that of 59 adjacent normal samples.
Two tissue chips were purchased from Shanghai OUTDO Biotech: HLugA150CS03 containing 75 LUAD samples, and HLugS120CS01 containing 60 LUSC samples. Immunohistochemical (IHC) staining for TNIK (HPA0121128, 1:100 dilution, Sigma, St. Louis, MO, USA) was performed on the tissue chips, with Image-J software (version 1.48; National Institute of Health, Bethesda, MD, USA) used to measure the signal density. Integrated optical density (IOD) value/cell was calculated to quantify the IHC score. Shanghai OUTDO Biotech committees approved this study on clinical samples, and all applicable ethical regulations were followed (protocol code SHYJS-CP-1901006, approved on 1st January 2019 for HLugS120CS01; protocol code SHYJS-CP-1901005, approved on 1st January 2019 for HLugA150CS03).
A549 cells were cultured in DMEM-F12 (SH30023.01, Hyclone, Waltham, MA, USA) and PC-9 cells in DMEM (SH30243, Hyclone) containing 10% heat-inactivated fetal bovine serum (FSP500, ExCell, Uruguay) and penicillin (100 IU/mL)/streptomycin (100 mf/mL) (SV30010, Hyclone). Cells were grown at 37 °C in a water-saturated atmosphere containing 5% CO2. Both cell lines were validated by short tandem repeat (STR) profiling and tested negative for mycoplasma.
Two shRNA sequences of the TNIK gene (shT-1#:
5′-CCATCTCATATTCAGGGCAA-3′; shT-2#: 5′-GCCTCAAAGAACAACTTCTAT-3′)
and a shRNA control sequence (shCtrl: 5′-TTCTCCGAACGTGTCACGT-3′) were
designed and constructed into a plko.1-puro lentivirus vector (#8453, Addgene, Watertown, MA, USA). As per the
manufacturer’s instructions, 60%~70% of 293T cells in a 10 cm
plate were transfected with either the control vector or TNIK-shRNA
vector, along with Neofect™ DNA transfection reagent (TF20121201,
NEOFECT, Beijing, China) to generate recombinant lentiviruses. Fresh culture
medium was added to the cells 24 h after transfection. The cell supernatant was
collected 48 h after transfection, concentrated using polyethylene glycol
precipitation, filtered through 0.45 µm cellulose acetate filters (SLHV033RB, Merck Millipore, San Jose, CA, USA), and
centrifuged for 40 minutes at 4 °C and 3500 rpm. For infection with
lentivirus, A549 and PC-9 cells were first seeded at a density of 3
Two siRNA sequences for LIMK1 (siL-1#: 5′-CCATGGGTGCTCTGAGCAAAT-3′; siL-2#: 5′-GATCGTCCTGTGCGAGATCAT-3′) and two for ROCK2 (siR-1#: 5′-GCACAGTTTGAGAAGCAGCTA-3′; siR-2#: 5′-GCCTTGCATATTGGTCTGGAT-3′) were designed (Shanghai GenePharma, Shanghai, China). The siRNAs were transfected into the indicated cells using Lipofectamine RNAiMAX reagent (13778150, Invitrogen, Waltham, MA, USA) according to the manufacturer’s instructions. Cells were collected 48–72 h after transfection and subjected to analysis.
For the clone formation assay, cells were resuspended at a density of 200 cells/mL in a single-cell suspension and 400 cells per well were then seeded into a 6-well plate. The cells were cultured for 14 days before being fixed in absolute ethanol for 10 min, followed by staining with 0.1% crystal violet (A600331, Sangon, Shanghai, China) for 30 minutes. Colonies with more than 50 cells were counted, and the relative number of colonies was calculated for each group.
For the cell migration trajectory assay, A549 and PC-9 cells were seeded (2
A total of 3
Following stable TNIK knockdown, cells were photographed using a Leica light
microscope (Leica SP8 Confocal Microscope, Wetzlar, Germany) at different locations on the coverslips (40
Ten male BALB/c nude Mice (4–6 weeks old, 18–22 g) were purchased from Beijing
Vital River Laboratory Animal Technology Co., Ltd. (Beijing, China). The mice
were bred and housed in a specific pathogen-free (SPF) facility under controlled
conditions: constant temperature (21
For tumor xenograft experiments, 6
Cells with stable TNIK knockdown and control cells underwent RNA-seq analysis.
Total RNA was extracted and sequencing was performed by BGI (Shenzhen, China).
Differentially expressed genes (DEGs) were screened using the criteria of
Total RNA was isolated from lung cancer cells using trizol (15596026, Invitrogen). Next, reverse transcription was performed with 1 µg of RNA using the PrimeScript™ RT Master Mix (RR036A, Takara, Kusatsu, Shiga, Japan) in a 20-microliter reaction volume. Quantitative PCR was carried out using the SYBR Green qPCR Master Mix (B21202, Bimake, Houston, TX, USA). Gene expression was normalized to GAPDH and analyzed using the 2⁻ΔΔCT method. Primers were synthesized by BGI-Write (Beijing, China) and the primer sequences utilized in this study are presented in Supplementary Table 1.
For immunoblot experiments, the cells were lysed in RIPA buffer containing a protease inhibitor cocktail (B14001 and B15001, Bimake). The protein concentration in each lysate was measured, followed by denaturation at 100 °C for 5 min. Equal volumes of the lysates (30 µg of protein) were separated by 8% or 10% standard SDS-PAGE, and then electro-transferred onto polyvinylidene difluoride membranes (IPVH00010, Merck Millipore). The membranes were blocked with 5% non-fat dry milk in TBST at room temperature for 2 h, probed with the indicated primary antibodies at 4 °C overnight, followed by incubation with matching secondary antibodies at 37 °C for 2 h. The antibodies used for immunoblot were as follows: TNIK (HPA0121128, 1:1000 dilution, Sigma), RHOA (2117, 1:1000 dilution, CST), RHOB (2098, 1:1000 dilution, CST), ROCK1 (28999, 1:1000 dilution, CST), ROCK2 (47012, 1:1000 dilution, CST), LIMK1 (3842, 1:1000 dilution, CST), GAPDH (AB-P-R001, 1:1000 dilution, Xianzhi Bio, Hangzhou, China), vinculin (V9264, 1:2000 dilution, Sigma), p-FAK397 (8556, 1:1000 dilution, CST) and FAK (3285, 1:1000 dilution, CST). The membranes were washed three times with Tris Buffered Saline with Tween (TBST) (10 min per wash) between antibody incubations. For secondary antibody incubation, horseradish peroxidase (HRP)-conjugated goat anti-rabbit IgG (H+L) (A0208, 1:1000 dilution, Beyotime, Shanghai, China) or goat anti-mouse IgG (H+L) (A0216, Beyotime, 1:1000 dilution) was used, depending on the species origin of the primary antibodies. The membranes were incubated with secondary antibodies at 37 °C for 2 h, followed by three additional TBST washes (10 min each). Protein bands were visualized using an enhanced chemiluminescence (ECL) detection system.
For immunofluorescence, cells were fixed and then incubated with phalloidin–TRITC (P1951, 1:1600 dilution, Sigma), vinculin (V9264, 1:200 dilution, Sigma) or tubulin (AT819, 1:200 dilution, Beyotime). They were subsequently incubated with Alexa 488/568-conjugated secondary antibodies (A32766/A32790, 1:1000 dilution, Invitrogen) and then mounted with medium containing 4′,6-diamidino-2-phenylindole (DAPI, D9564, 1:1000 dilution, Sigma). A Leica confocal microscope was used to view the preparations.
Cells with stable knockdown of TNIK and control cells were incubated with the chemotherapy agents paclitaxel (PTX) (S1150, Selleck, Houston, TX, USA), cisplatin (also known as cis-Diaminodichloroplatinum, DDP) (S1166, Selleck) and adriamycin (ADR) (S1280, Selleck) at the dosage and duration shown in the figure legend. Cell viability was then quantified by cell counting kit-8 (CCK-8) assay (B34304, Bimake, Houston, TX, USA). The optical density (OD) at 490 nm was measured using a microplate reader (51119100, Thermo, Waltham, MA, USA), and the 50% inhibition of cell proliferation (IC50) value was calculated with GraphPad Prism software (version 9; GraphPad Software, Boston, MA, USA).
Briefly, cells with stable knockdown of TNIK and control cells were incubated with chemotherapy agents for 48 h, stained with Annexin V-FITC and propidium iodide (PI) (MA0220, meilunbio, Dalian, China) for 30 minutes in the dark, and then analyzed by FACS.
GraphPad Prism software was used for statistical analysis. Two-tailed Student’s
t test was used for the analysis and comparison of data from two groups.
Statistical data were presented as the mean
To evaluate TNIK protein expression in lung cancer, we analyzed TNIK protein
expression data obtained using reverse-phase protein array (RPPA) and available
from The Cancer Genome Atlas (https://www.cbioportal.org). TNIK protein
expression was found to be elevated in 2.3% of LUAD cases and 27.4% of LUSC
samples (Fig. 1A). Next, we used IHC to evaluate TNIK protein expression in
clinical samples of LUAD and LUSC. Tissue chip analysis revealed that TNIK
protein expression was upregulated in both LUAD and LUSC samples compared to
adjacent normal tissues (p
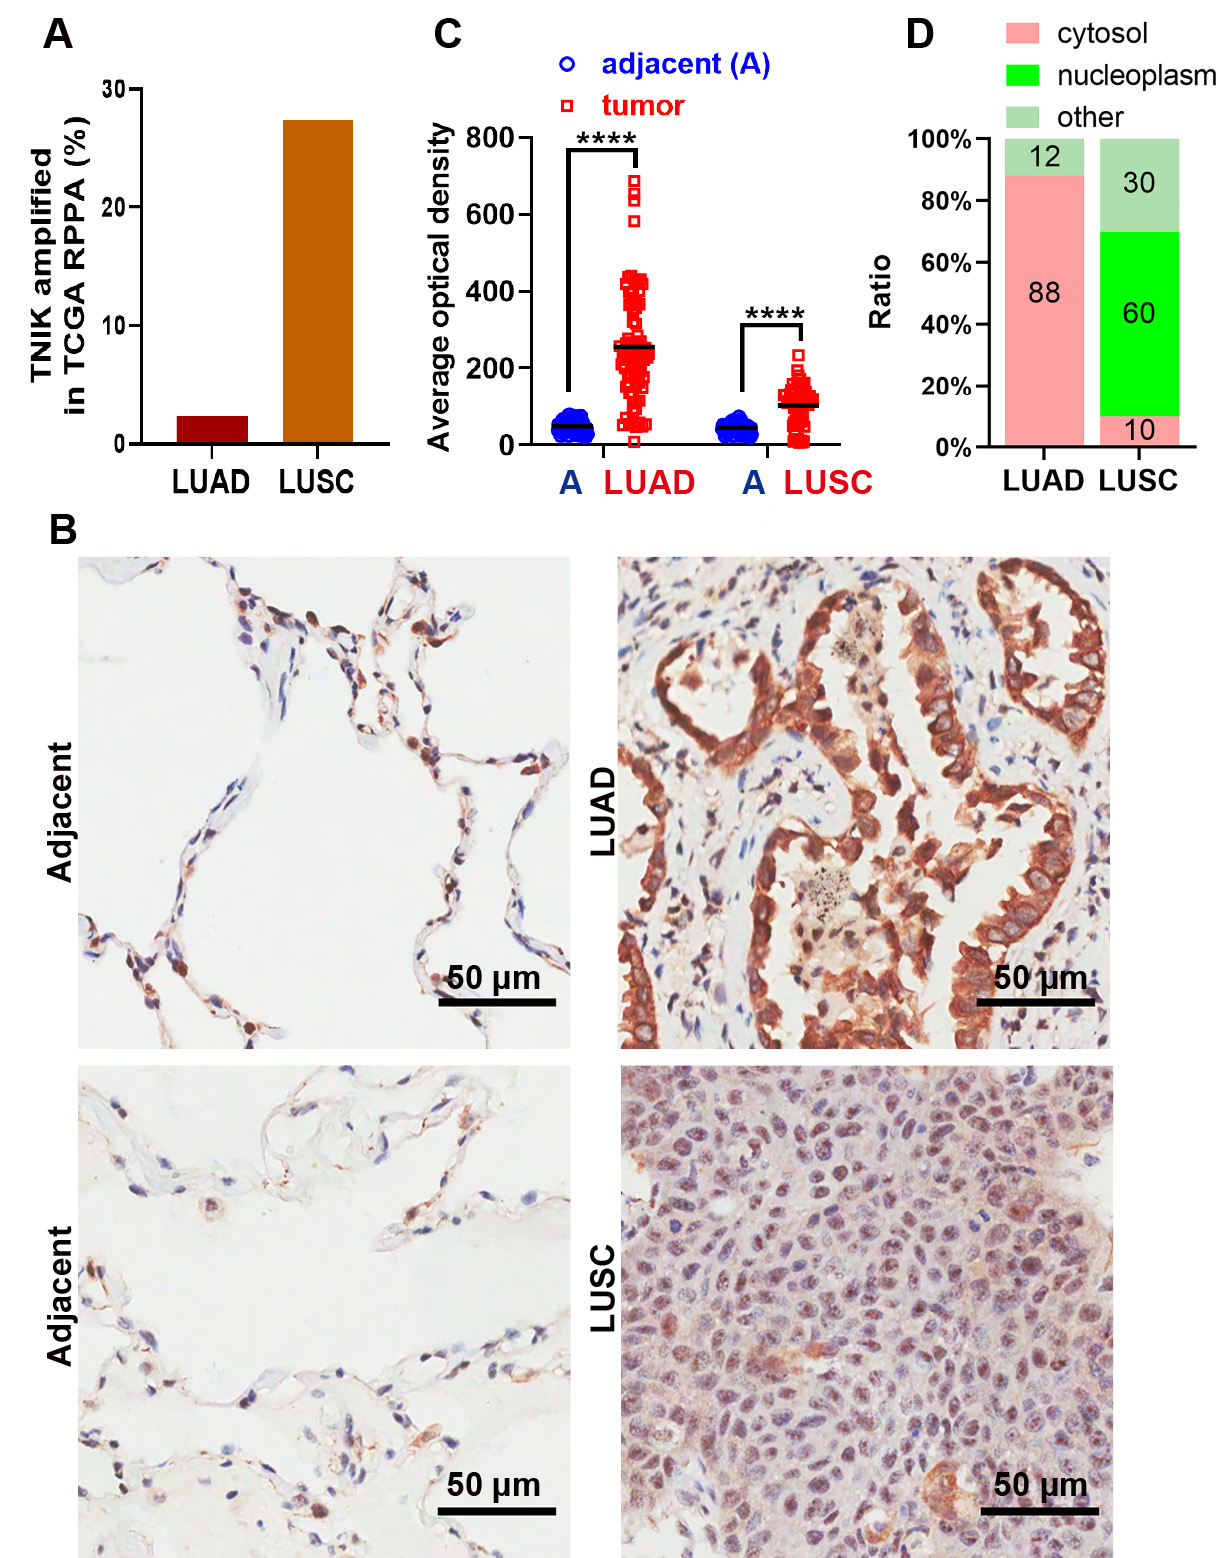 Fig. 1.
Upregulation of TNIK protein is associated with the progression
of LUAD. (A) The ratio of TNIK expression in the TCGA RPPA datasets for LUAD and
LUSC. (B) Representative IHC staining of TNIK protein showing subcellular
localization in adjacent normal tissue (left), LUAD (upper right) and LUSC (lower
right). Scale bar, 50 µm. (C,D) Statistical analysis of TNIK expression and
subcellular distribution in adjacent normal and tumor tissue of 75 LUAD and 60
LUSC cases. Cytosol: TNIK is mainly localized to the cytosol; nucleoplasm: TNIK
is mainly localized to the nucleoplasm; others: no TNIK is expressed in either
the cytosol or nucleoplasm. **** p
To evaluate the role of TNIK in LUAD progression, we generated cells with stable
TNIK knockdown using the two LUAD cell lines A549 and PC-9. The knockdown effects
were verified by qRT-PCR and immunoblotting analysis (p
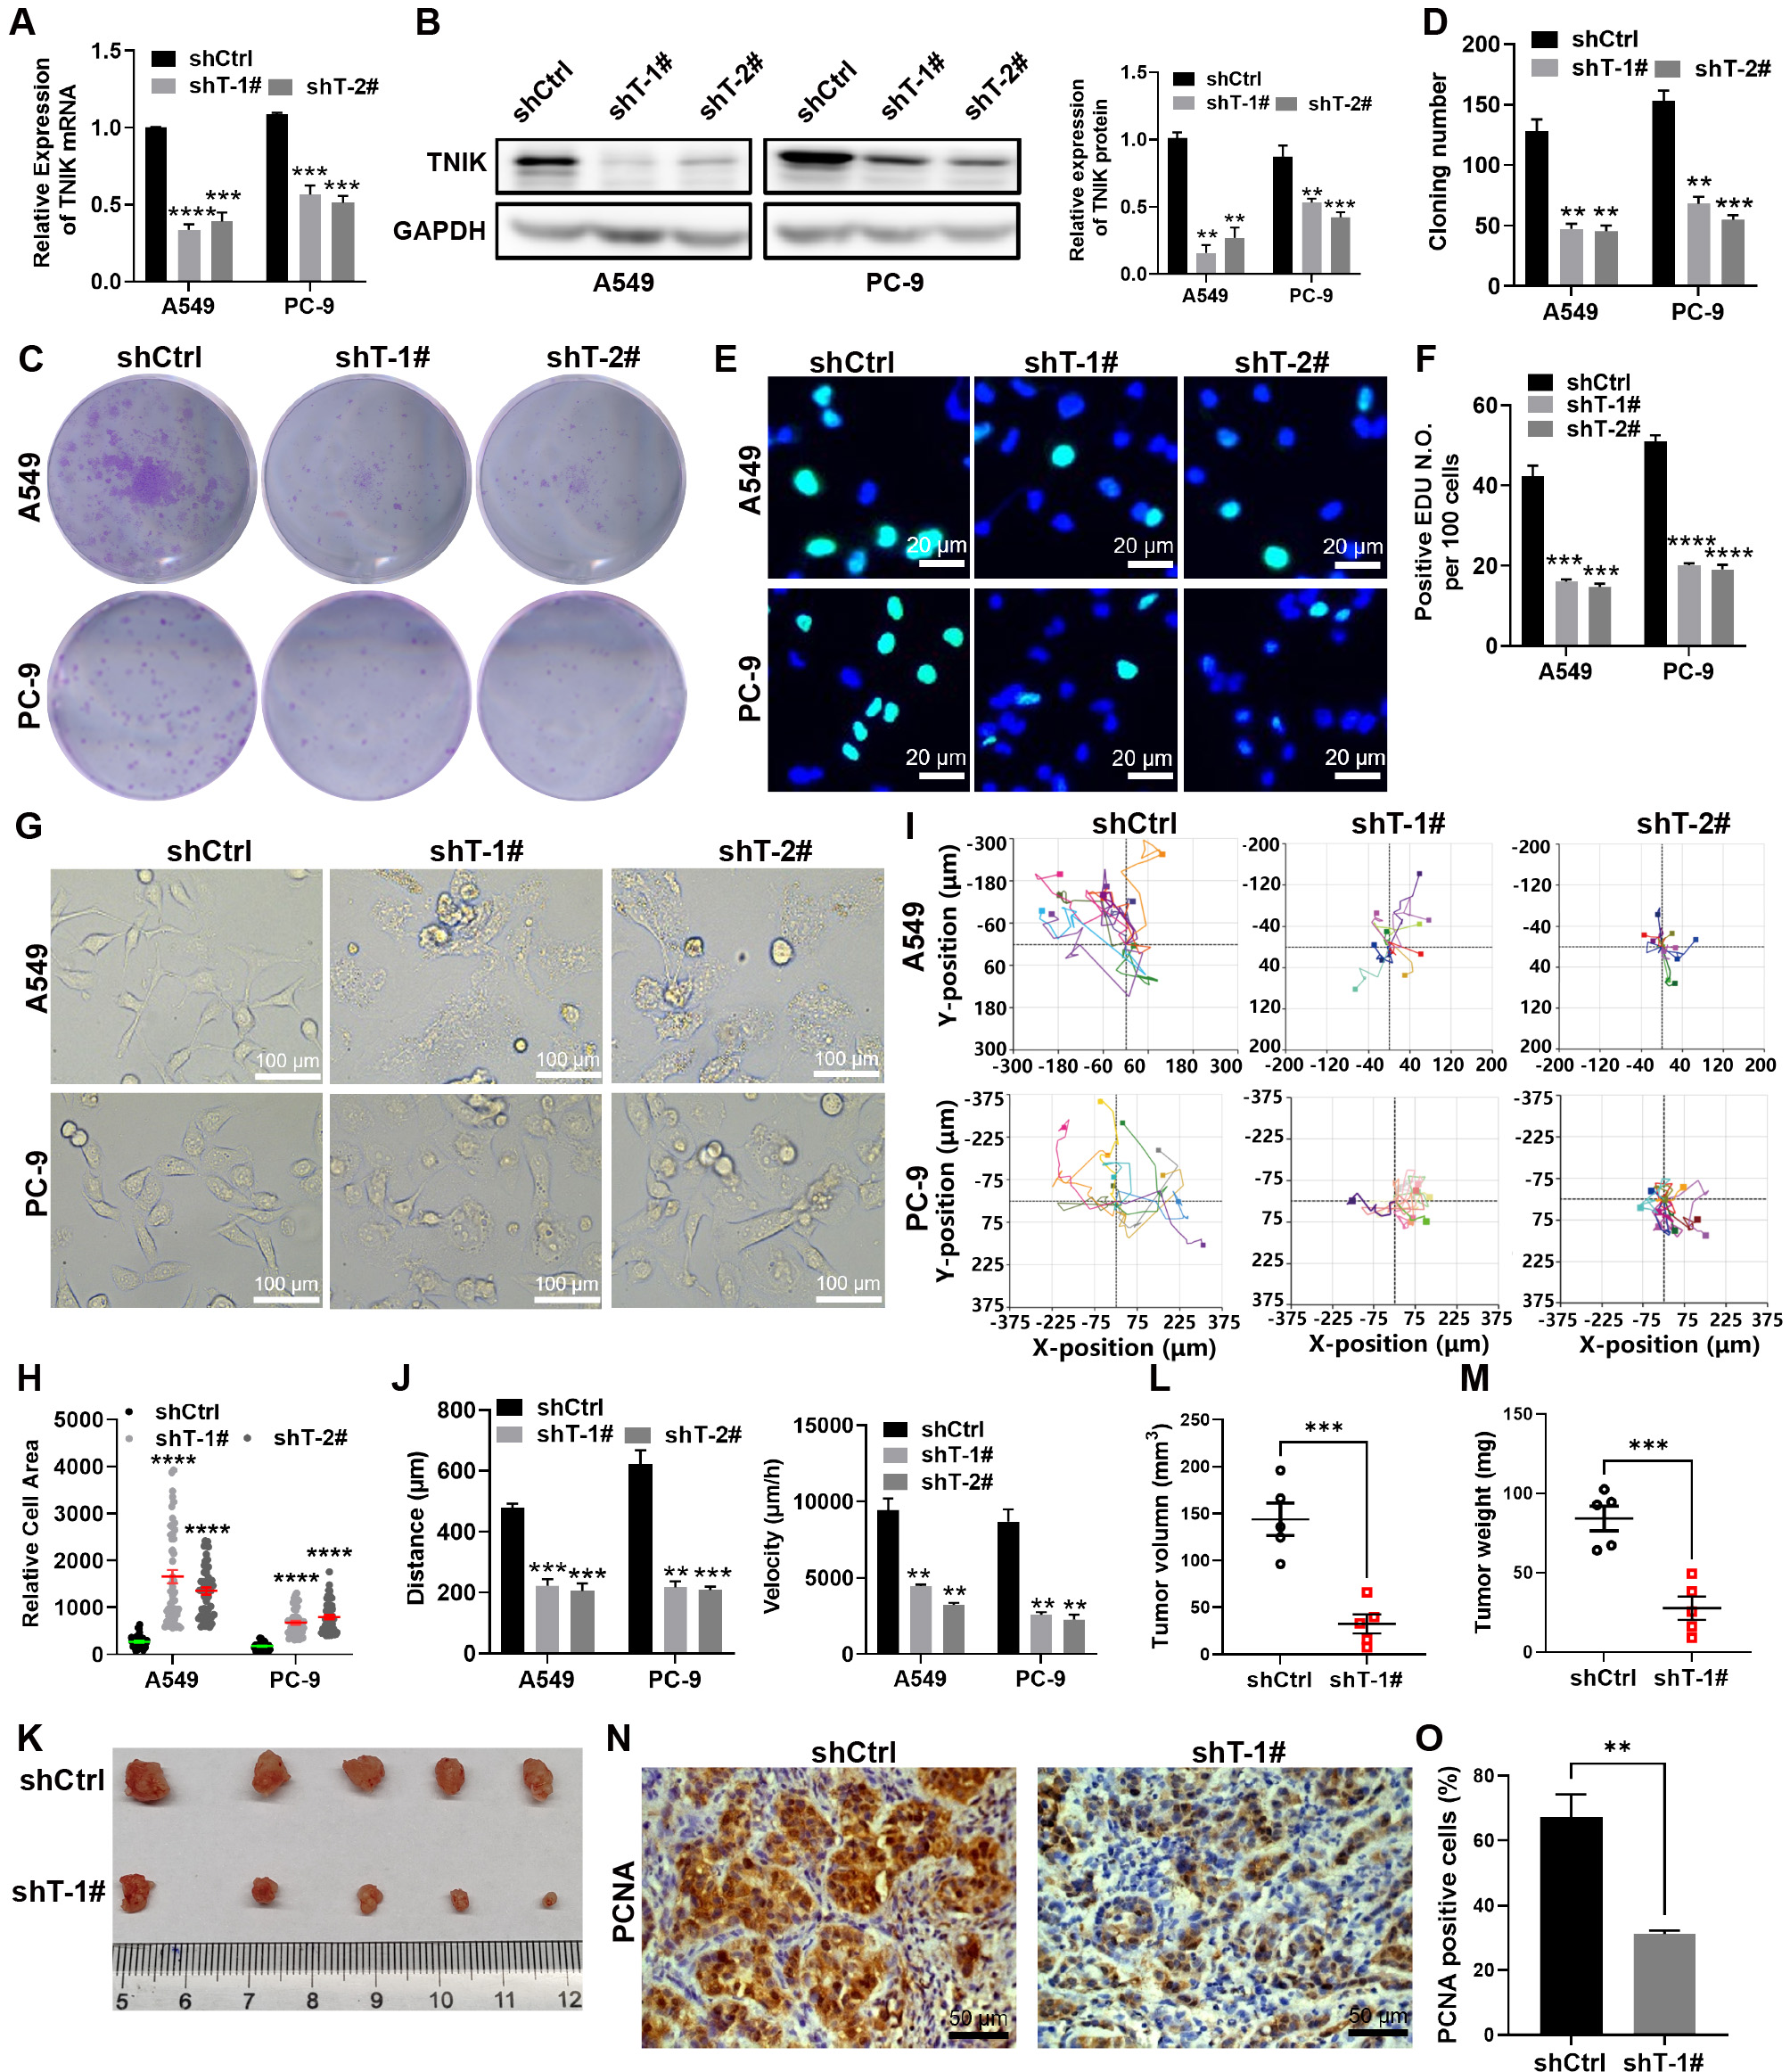 Fig. 2.
TNIK knockdown suppresses the malignant phenotype of lung
adenocarcinoma cells. (A) qRT-PCR analysis of TNIK knockdown efficacy. (B)
Immunoblot analysis of the indicated proteins in control and TNIK knockdown A549
and PC-9 cells. The loading control was GAPDH. The TNIK expression level relative
to GAPDH was standardized to control cells (n = 3 per group). (C,D)
Representative images of control and TNIK knockdown A549 and PC-9 colonies and
the relative colony number (n = 3 per group). (E,F) Representative images of
control and TNIK knockdown A549 and PC-9 cells with EDU labeling, and the
positive EDU count. Merge panels include DAPI (blue, nuclei). Scale bar, 20
µm. (G) The morphology of control and TNIK knockdown A549 and PC-9 cells.
Scale bar, 100 µm. (H) The cell area was measured with Image J software,
with 50 cells counted per condition. (I,J) Representative images of the migration
trajectories of control and TNIK knockdown cells, and the calculated velocity and
distance of cell migration. (K) Tumor xenografts from control and TNIK knockdown
A549 cells. (L,M) The growth curve and weight of xenografts from control and TNIK
knockdown A549 cells. (N,O) IHC staining of PCNA in control and TNIK knockdown
A549 tissues, and the PCNA-positive cell count. Scale bar, 50 µm. **
p
IHC analysis showed that TNIK was localized mainly in the cytoplasm of LUAD cells, but also in the nucleus. This indicates a critical function for cytoplasmic TNIK in the progression of LUAD. To study the molecular mechanism underlying the TNIK-associated malignant phenotype in LUAD, RNAseq analysis was performed to ascertain changes in the gene expression profile at the whole genome level in A549 cells with stable TNIK knockdown. A total of 2543 genes were dysregulated in TNIK knockdown cells compared to control cells. GSEA revealed that TNIK depletion significantly inhibited the mitosis-related biological process (Fig. 3A). KEGG pathway analysis showed that dysregulated genes were involved in the cell cycle and in several cancer-related pathways, including p53 and the HIF-1 signaling pathway (Fig. 3B). Moreover, GSEA analysis showed that high TNIK expression detected by RPPA in TCGA LUAD samples promoted the mitosis-associated biological process (Fig. 3C). In addition, light microscopy revealed increased cell spreading in the TNIK knockdown group compared to the control group (Fig. 2G). Previous research has suggested that TNIK overexpression regulates actin assembly, thereby inducing cell spreading and causing adherent cells to round up and lose adhesion to the culture plate [13]. Cell spreading is dependent on actin filament dynamics and force generation by the FA contacts on the surface [21]. We therefore focused on the cytoskeleton-related biological process. As shown in Fig. 3A–C, the three biological processes highlighted in the red box were associated with the cytoskeleton: microtubule organization involved in mitosis, cytoskeleton-dependent cytokinesis and FA. Furthermore, we analyzed the top-ranked GSEA gene sets identified in the TNIK knockdown transcriptome of A549 cells and in LUAD samples from the TCGA database with high expression of TNIK. Other processes related to cytoskeleton organization were found, including microtubule organization and stress fiber assembly (Fig. 3D,E). The control of cell polarity and shape during cell movement and division depends on crosstalk between actin and microtubules [4], of which the RHO family of small GTPases (RHO, Rac, Cdc42) and their effectors are central players [4]. Analysis of the transcriptome profile revealed significantly lower levels of RHOA/B, ROCK 1/2 and LIMK1 in cells with TNIK silencing (Fig. 3F). In contrast, there was no difference in the level of two other small GTPases, Rac and Cdc42, between cells with TNIK knockdown and control cells (Fig. 3G). Further analysis of the RHO family and their effectors by qRT-PCR confirmed that TNIK knockdown decreased the mRNA expression of RHO/ROCK/LIMK1 (Fig. 3H,I). Moreover, Western blot analysis confirmed that RHOA/B, ROCK2 and LIMK1 protein expression were reduced upon TNIK silencing (Fig. 3J). These data strongly suggest that TNIK controls F-actin and microtubule dynamics via the RHO/ROCK2/LIMK1 signaling pathway.
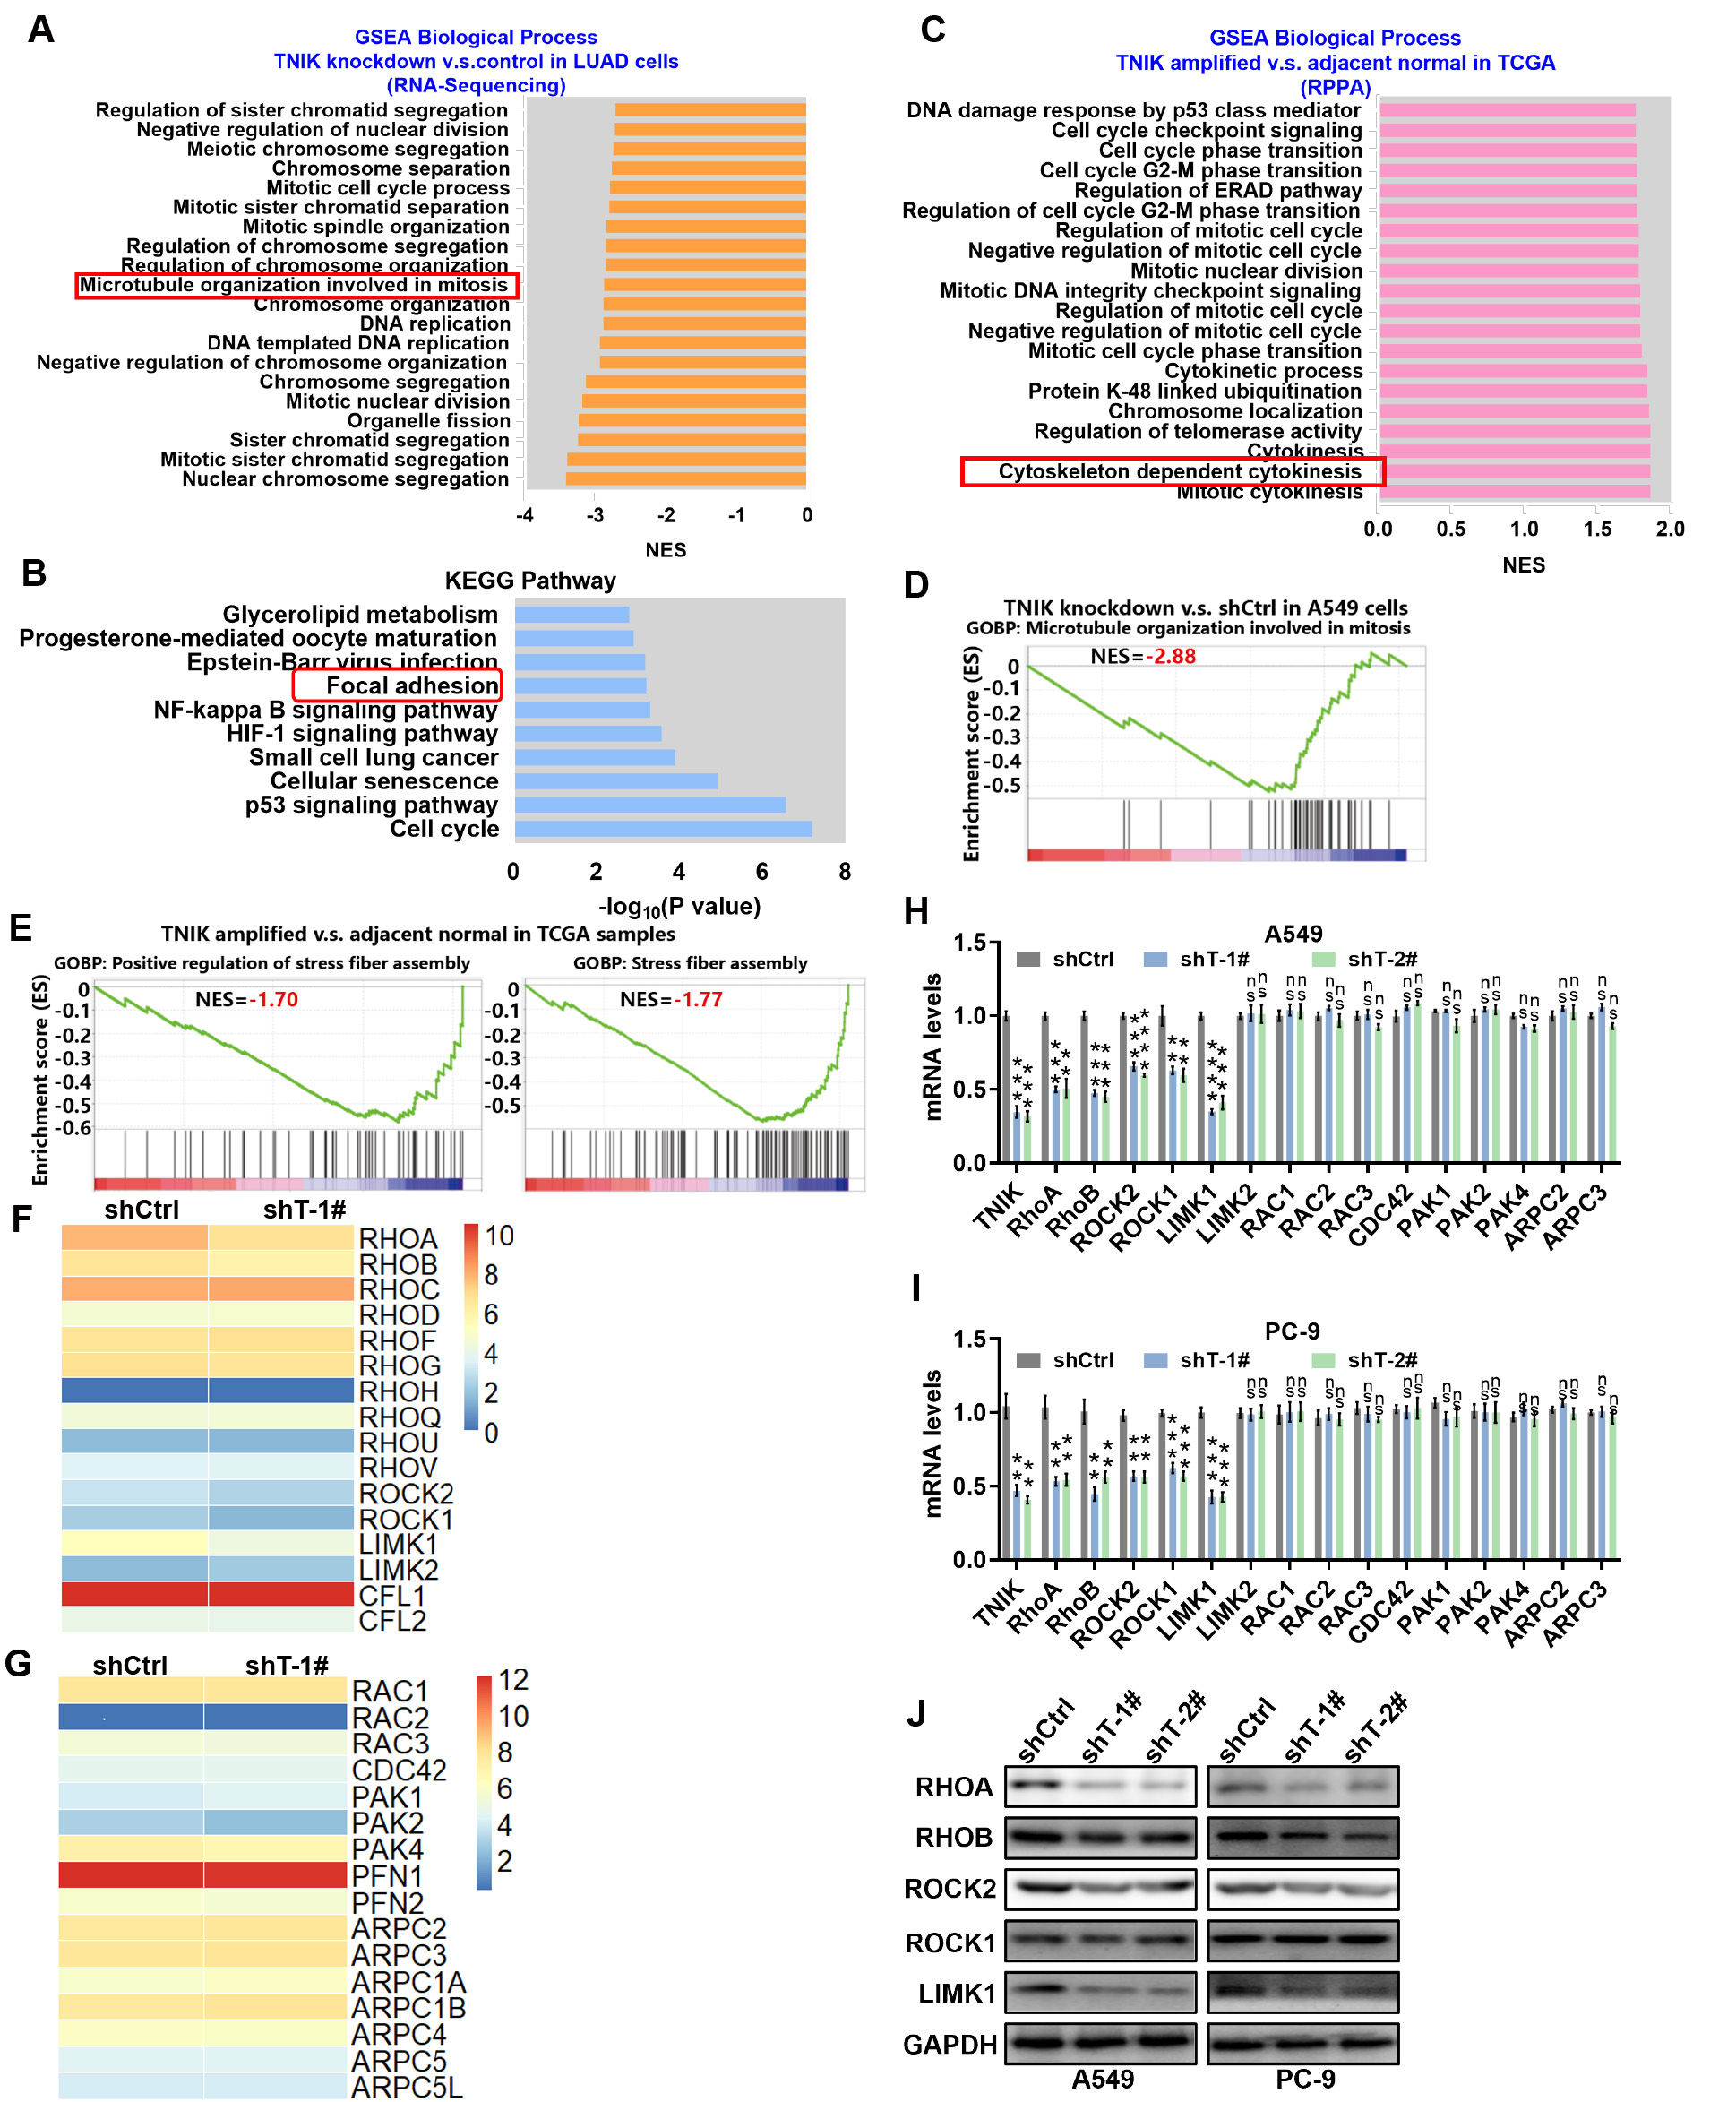 Fig. 3.
TNIK regulates F-actin and microtubule cytoskeletal organization
via the RHO/ROCK/LIMK1 signaling pathway. (A) The top 20 enriched gene sets
identified by GSEA analysis based on the differentially expressed genes between
A549 cells with stable TNIK knockdown and the control. The biological processes highlighted in the red box were associated with the cytoskeleton: microtubule organization invovled in mitosis. (B) KEGG pathway analysis
based on the differentially expressed genes between A549 cells with stable TNIK
knockdown and the control. The biological processes highlighted in the red box were associated with the cytoskeleton: focal adhesion. (C) Top 20 enriched gene sets identified by GSEA
analysis based on the differentially expressed genes between 14 LUAD samples with
high expression of TNIK detected by RPPA and 59 adjacent normal samples from the
TCGA database. The biological processes highlighted in the red box were associated with the cytoskeleton: cytoskeleton dependent cytokinesis. (D) GSEA plot showing RNA-seq data from cells with stable TNIK
knockdown relative to control cells. (E) GSEA plot showing TCGA data from 14 LUAD
samples with high TNIK expression detected by RPPA relative to 59 adjacent normal
samples from the TCGA database. (F,G) Heatmap displaying the transcript levels of
indicated genes. (H,I) qRT-PCR verification of the expression of small GTPase
RHO-related genes in control (shCtrl) and stable TNIK knockdown cells. Data
represent the mean
Microtubules and actins are essential for cell division and movement [4]. Chromosome segregation during cell division relies on properly arranged microtubules and cytokinesis during the last stages of cell division and is driven by actin filaments. However, microtubules and actin filaments also provide forces to drive changes in cell shape and migration. During these processes, FAs act as a bridge between the cytoskeleton and the ECM to direct mechano-transduction, cell migration and division [8]. The assembly and disassembly of FAs depend on microtubules and actins [6]. Active pFAK-Y397 present in FAs controls several biological processes, including cell survival, proliferation, FA turnover and migration [22]. Vinculin regulates and promotes FA assembly, but FA disassembly requires the loss or inactivation of vinculin [23].
We examined the role of TNIK in the FA dynamics of LUAD cells. Phalloidin–TRITC
staining was used to identify F-actin, while vinculin immunostaining was used to
mark the FAs. Stable knockdown of TNIK significantly increased the number and
area of FAs (p
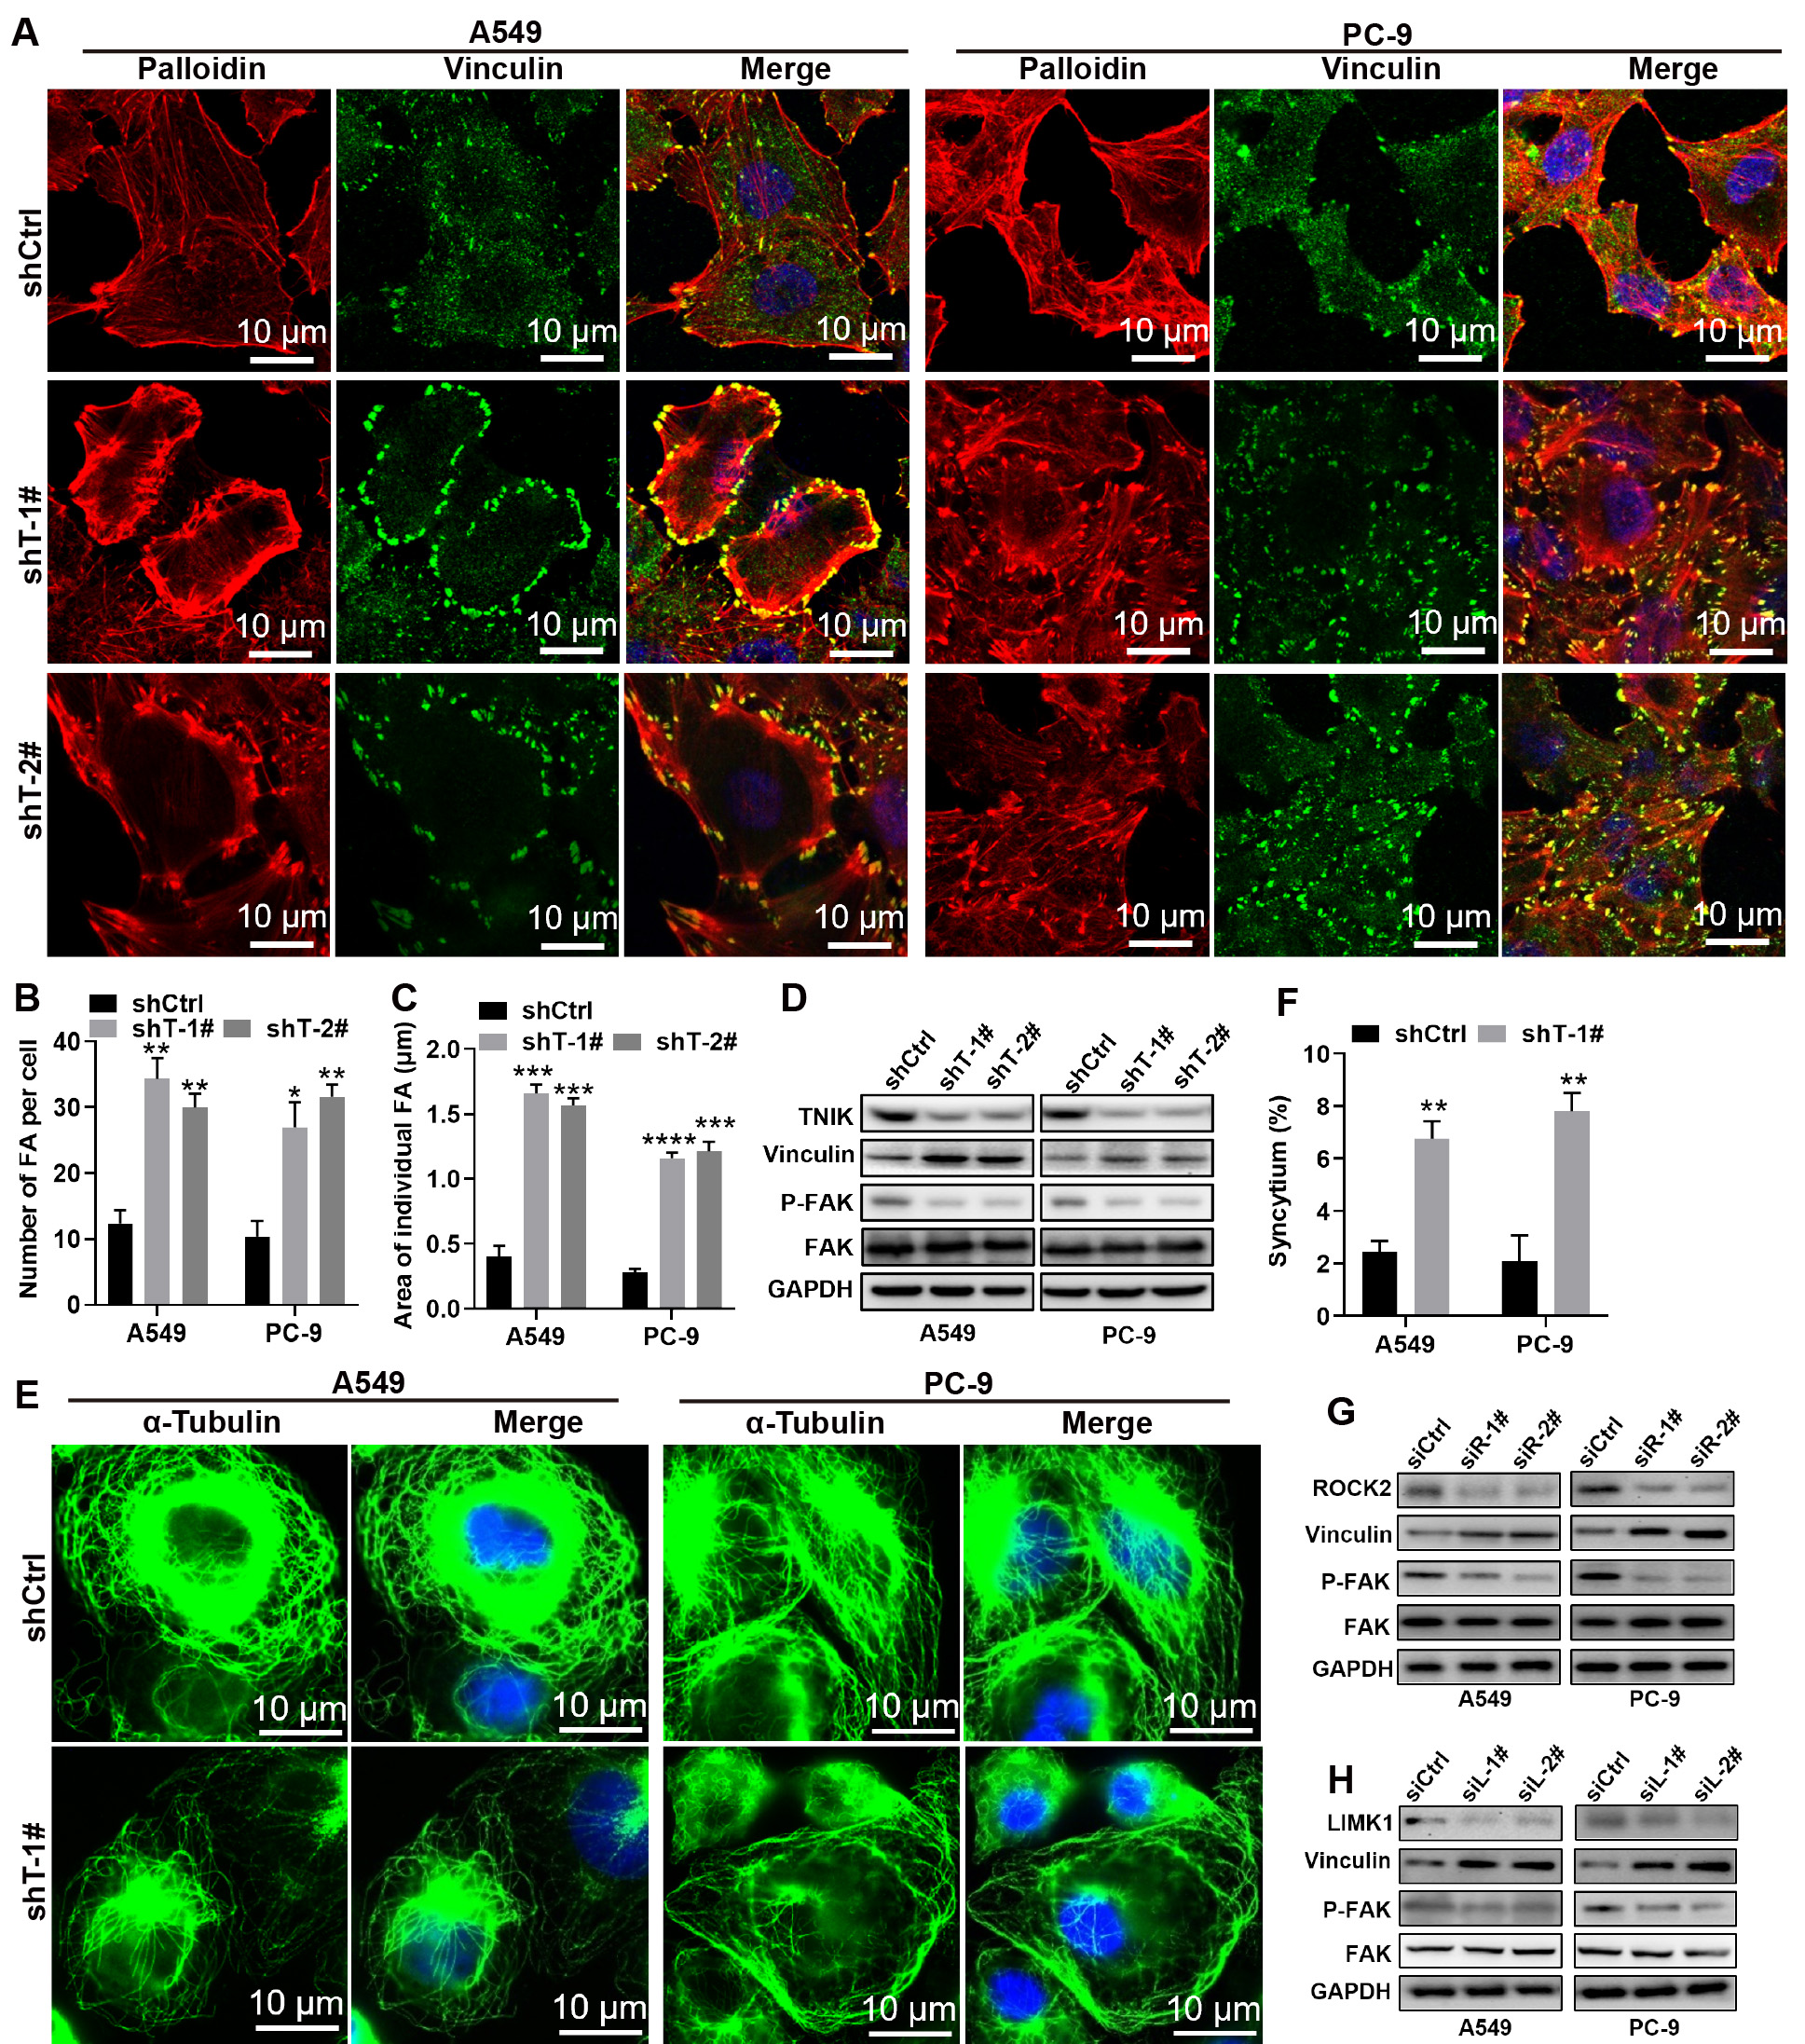 Fig. 4.
TNIK regulates focal adhesion turnover and mitosis. (A)
Representative images of vinculin (green) and F-actin (red) in A549 and PC-9
control and TNIK knockdown cells. Merge panels include DAPI (blue, nuclei). Scale
bar, 10 µm. (B,C) Quantification of the number and average area of FAs in
A549 and PC-9 control and TNIK knockdown cells. (D) Immunoblot analysis of the
indicated proteins in A549 and PC-9 control and TNIK knockdown cells. (E)
Immunofluorescence staining of tubulin in A549 and PC-9 control and TNIK
knockdown cells. Merge panels include DAPI (blue, nuclei). Scale bar, 10
µm. (F) Statistical analysis of the syncytium ratio in the results from
(E). More than 50 cells were counted per condition in each repeat. Data represent
the mean
Next, we hypothesized that FA dynamics would be disrupted by inhibition of the RHO/ROCK/LIMK1 signaling pathway. TNIK knockdown was found to induce a low level of ROCK2 protein expression, but not ROCK1 (Fig. 3J). To test our hypothesis, we assessed the levels of p-FAK397 and vinculin protein in LUAD cells treated with siRNA targeting ROCK2 or LIMK1, respectively. Immunoblot analysis revealed that ROCK2 expression was silenced by siRNA, while ROCK2 knockdown enhanced the expression of vinculin and decreased the level of p-FAK397 (Fig. 4G and Supplementary Fig. 1A). Consistent with these findings, LIMK1 silencing resulted in low expression of p-FAKY397 and high expression of vinculin (Fig. 4H and Supplementary Fig. 1B). Additionally, LIMK1 knockdown was observed to increase the number and area of FAs (Supplementary Fig. 2). Taken together, these findings indicate that TNIK may control FA turnover and mitosis by affecting the dynamics of F-actin and microtubules via the RHO/ROCK2/LIMK1 signaling pathway.
Paclitaxel (PTX), cisplatin (DDP) and adriamycin (ADR) are common and
conventional anti-cancer drugs. However, drug resistance is still a major reason
for chemotherapy failure in cancer [24]. Cell adhesion to the ECM is one of the
critical micro-environmental elements that drives cancer cell resistance.
Multifunctional and multiprotein FA complexes are essential mechanical components
that functionally and structurally regulate the cell shape and cytoplasmic
signaling for cell survival, proliferation, differentiation and motility [7]. The
effectiveness of any specific molecular therapy is challenging due to the
considerable redundancy, intricacy and interaction between downstream signaling
and FA-related receptors. In the present study, we found that TNIK silencing
affected FA dynamics and cytoskeletal organization, including microtubules and
F-actin. The targeting of TNIK in combination with chemotherapeutic agents may
overcome drug resistance. CCK-8 assays revealed that TNIK knockdown increased the
sensitivity of A549 and PC-9 cells to PTX, DDP and ADR (Fig. 5A–C). PTX had IC50
values of 3.044 µM and 1.4 µM/1.108 µM in control and TNIK
knockdown A549 cells, respectively (Fig. 5A), and 2.025 nM and 1.058 nM/0.805 nM
in control and TNIK knockdown PC-9 cells, respectively (Fig. 5A). DDP had IC50
values of 2.801 µM and 1.102 µM/1.381 µM in control and TNIK
knockdown A549 cells, respectively (Fig. 5B), and 1.188 µM and 0.893
µM/0.767 µM in control and TNIK knockdown PC-9 cells, respectively
(Fig. 5B). ADR had IC50 values of 0.785 µM and 0.347 µM/0.284
µM in control and TNIK knockdown A549 cells, respectively (Fig. 5C), and
0.515 µM and 0.209 µM/0.140 µM in control and TNIK knockdown
PC-9 cells, respectively (Fig. 5C). To determine whether the cytotoxicity of
these drugs against A549 and PC-9 cells with TNIK knockdown was related to
apoptosis, we utilized flow cytometry to measure the proportion of apoptotic
cells. TNIK knockdown in A549 and PC-9 cells markedly increased the rate of
apoptosis in comparison to the control group (p
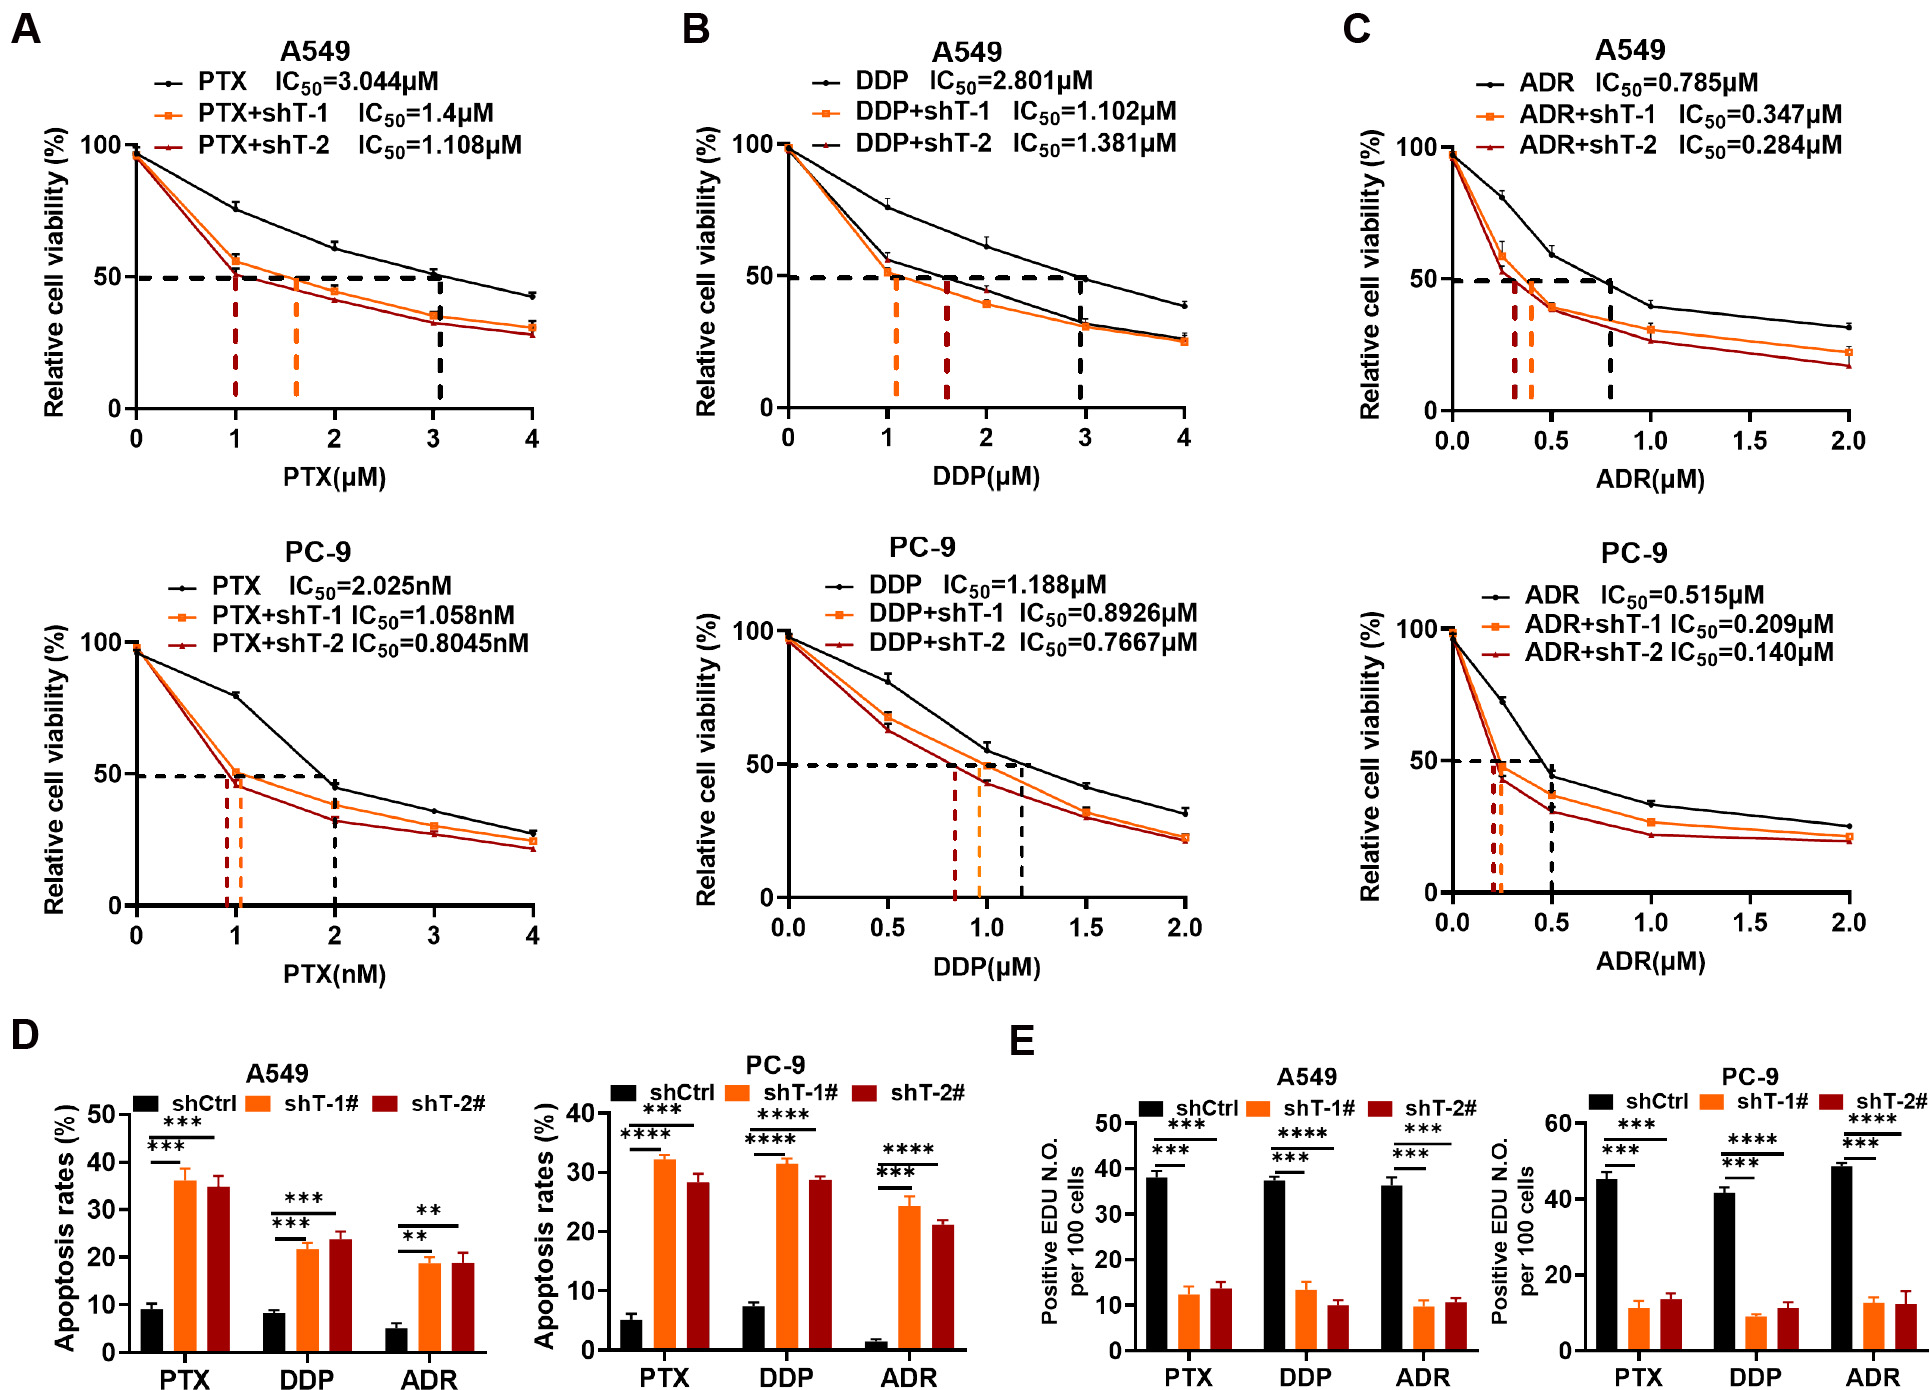 Fig. 5.
TNIK knockdown improves the tumor-suppressive efficacy of
chemotherapeutic drugs in vitro. (A–C) CCK-8 assays were used to
evaluate cell viability in A549 and PC-9 cells with either stable TNIK knockdown
or control vector following treatment with PTX (A), DDP (B) or ADR (C) for 48 h
(n = 3 per group). (D) Cell apoptosis was analyzed by Annexin V-FITC/PI double
staining of A549 and PC-9 control and stable TNIK knockdown cells after treatment
with PTX (1.108 µM for A549, 0.8045 nm for PC-9), DDP (1.102 µM for
A549, 0.7667 µM for PC-9), or ADR (0.284 µM for A549, 0.14 µM
for PC-9) for 48 h. Results are representative of three independent experiments.
(E) Cell proliferation was assessed by EDU labeling of A549 and PC-9 control and
stable TNIK knockdown cells after treatment with PTX (1.108 µM for A549,
0.8045 nm for PC-9), DDP (1.102 µM for A549, 0.7667 µM for PC-9), or
ADR (0.284 µM for A549, 0.14 µM for PC-9) for 48 h. ** p
The MAP4K protein from the Ste20 family is involved in various physiological and pathological processes [25]. Within this family, p21-activated kinases (PAKs) and GCKs have been shown to mediate multifaceted intracellular processes such as cell shape, cell motility and cytoskeletal rearrangement [26, 27, 28, 29, 30]. TNIK is a serine/threonine kinase of the GCK family. As a member of the oncogenic “driver” kinome, TNIK could also serve as a potential therapeutic target [17]. Previous studies have shown that TNIK is involved in the development of gastric cancer, mammary carcinoma, colorectal cancer and LUSC [20, 31, 32, 33]. In the present study, tissue chip analysis revealed that TNIK was overexpressed in LUAD and LUSC compared to adjacent normal lung tissues (Fig. 1A,B). TNIK has been documented to localize in the nucleus where it is a crucial, specific activator of the Wnt transcriptional pathway, and has therefore been proposed as a potential anticancer target [34]. Our study found that TNIK was mainly localized to the cytosol in LUAD cells, and to the nucleoplasm in adjacent normal cells and LUSC cells. We also elucidated various roles of TNIK in LUAD, including cell proliferation, movement and chemotherapy. Moreover, the mechanism by which TNIK controls FA dynamics and mitosis is through the regulation of F-actin and microtubule dynamics via the RHO/ROCK2/LIMK1 signaling pathway.
A recently published structural model offers some insight into the scaffold
function of full-length TNIK [15]. The kinase domain serves as a molecular
switch, while the C-terminal CNH domain has the conserved function of binding
small GTPases, consistent with its role in cytoskeletal organization [13, 16, 35, 36]. Microtubules and the actin cytoskeleton must be coordinately regulated for
the cell to perform intricate biological processes, such as cell movement and
division [4]. The crosstalk between microtubules and actin can be direct, or it
can be mediated by signaling molecules and intermediate proteins, such as RHO
GTPases [4]. These small GTPases control LIMK1 activity with the help of their
effector kinase, ROCK and PAK 1 and 4 [37]. LIMK1 contributes to cytoskeletal
dynamics by independently modifying actin filaments and microtubules [11, 38]. In
the current study, we observed that TNIK knockdown in LUAD cells resulted in an
increased number and area of FAs, as well as increased area of cell spreading and
inhibition of cell proliferation. Further research demonstrated that TNIK
regulates microtubule organization as well as actin filaments. In addition, we
found that TNIK regulates the expression of RHOA/B, ROCK2 and LIMK1 in the RHO
signaling pathway. Thus, it is possible that TNIK recruits RHO, ROCK2 and LIMK1,
and that its kinase domain serves as a molecular regulator of these proteins by
switching them on and off [39]. RHOA has been demonstrated to contribute
positively to tumor development in almost all cancer types, whereas RHOB appears
to play a dual role in cancer [40]. Luis-Ravelo et al. [41] suggested
that high RHOB levels promote metastasis and chemoresistance in LUAD. Calvayrac
et al. [42] reported that low levels of RHOB expression in
non-small-cell lung cancer correlated with a good response to EGFR-TKI treatment,
whereas high levels of RHOB expression corresponded to a poor response.
Consistent with these findings, we found that TNIK knockdown resulted in lower
levels of RHOA and RHOB expression, as well as decreased chemoresistance. Our
study uncovered a striking divergence in the subcellular localization of TNIK
between LUAD and LUSC. In LUAD, TNIK predominantly localizes to the cytoplasm,
whereas in LUSC, TNIK is primarily nuclear. This subtype-specific localization
pattern likely reflects distinct signaling requirements critical for tumor
progression. In LUAD, cytoplasmic TNIK is likely engaging cytoskeletal pathways
(e.g., RHOA/ROCK2) to promote migration. Conversely, nuclear TNIK in LUSC may
exert the oncogenic roles analogous to its function in colorectal cancer, where
it regulates components of the
Chemotherapy is the traditional cancer treatment used for all types of cancer. However, chemoresistance remains a major obstacle to effective cancer treatment. More advanced cancer treatments now combine traditional chemotherapy with targeted therapy [3, 7]. Our study showed that TNIK regulates F-actin and microtubule organization to control FA turnover and mitosis, suggesting that TNIK is a potential target for inhibiting cancer cell proliferation and migration. As shown in Fig. 5, targeting TNIK in combination with conventional chemotherapeutic agents significantly decreased cell viability and increased the apoptosis of LUAD cells. On the other hand, it is well known that FAK is frequently overexpressed in cancer, with several FAK inhibitors currently under development. Targeting of FAK could be especially effective in combination with other agents to reverse the serious side effects of chemotherapies or targeted therapies [8]. In conjunction with our finding that TNIK is mainly localized in the cytoplasm of LUAD cells and regulates p-FAK397 expression, the targeting of both FAK and TNIK could be an effective strategy for future molecular targeted therapies against LUAD.
Taken together, the results of this study demonstrate that TNIK regulates the dynamics of actin filaments and microtubules via the RHO/ROCK2/LIMK1 signaling axis to promote FA turnover and cell division in LUAD. Functionally, the silencing of TNIK inhibits cell movement and cell viability in LUAD. Our findings offer new insights into the development of novel treatment approaches for LUAD by combining TNIK targeting with chemotherapeutic agents.
The datasets used and/or analyzed during the present study are available from the corresponding authors on reasonable request.
LianZ, CZ, YW and QZ designed the research study. YL and MS contributed to the experiments and YL, MS, XH, TZ, XS, LuZ analyzed the data. LianZ wrote the manuscript. All authors contributed to editorial changes in the manuscript. All authors read and approved the final manuscript. All authors have participated sufficiently in the work and agreed to be accountable for all aspects of the work.
Shanghai OUTDO Biotech committees approved of the informed consent and the patient sample study, which followed with all applicable ethical regulations (protocol code SHYJS-CP-1901006, approved on 1st January 2019 for HLugS120CS01; protocol code SHYJS-CP-1901005, approved on 1st January 2019 for HLugA150CS03). The study was carried out in accordance with the guidelines of the Declaration of Helsinki. The Chongqing Medical University Institutional Animal Care and Treatment Committee’s rules were followed in the humane treatment of all animals (Ethic Approval Number: IACUC-CQMU-2024-0593).
Not applicable.
This work was supported in part by National Natural Science Foundation of China Grants-in-aid 82173243 (to CZ), Natural Science Foundation of Chongqing Municipality Grant cstc2021jcyj-msxmX0190 (to CZ); Chongqing Postdoctoral Science Foundation Grant CSTB2023NSCQ-BHX0014 (to LZ), Chongqing Medical University, Postdoctoral start-up Foundation Grant R1063 (to LZ).
The authors declare no conflict of interest.
Supplementary material associated with this article can be found, in the online version, at https://doi.org/10.31083/FBL38875.
References
Publisher’s Note: IMR Press stays neutral with regard to jurisdictional claims in published maps and institutional affiliations.