


 , Katharina Steiner 1, Josef Marksteiner 3, Klaus Faserl 4, Bettina Sarg 4, Christian Humpel 1,*
1 Laboratory of Psychiatry and Experimental Alzheimer’s Research, Medical University of Innsbruck, 6020 Innsbruck, Austria
2 Department of Histology and Embryology, Faculty of Medicine, Mersin University, 33343 Mersin, Turkey
3 Department of Psychiatry and Psychotherapy A, Hall State Hospital, 6060 Hall in Tirol, Austria
4 Protein Core Facility, Institute of Medical Biochemistry, CCB-Biocenter, Medical University of Innsbruck, 6020 Innsbruck, Austria
Abstract
Alzheimer’s disease (AD) is a severe neurodegenerative disorder characterized by beta-amyloid plaques and tau neurofibrillary tangles. The diagnosis of AD is complex, with the analysis of beta-amyloid and tau in cerebrospinal fluid being a well-established diagnostic approach. However, currently no blood biomarkers have been identified or validated for clinical use. In the present study, we will identify novel plasma biomarkers for AD using our well-established organotypic mouse brain slice model connected to microcontact prints. We hypothesize that AD plasma contains factors that affect endothelial cell migration and new vessel formation.
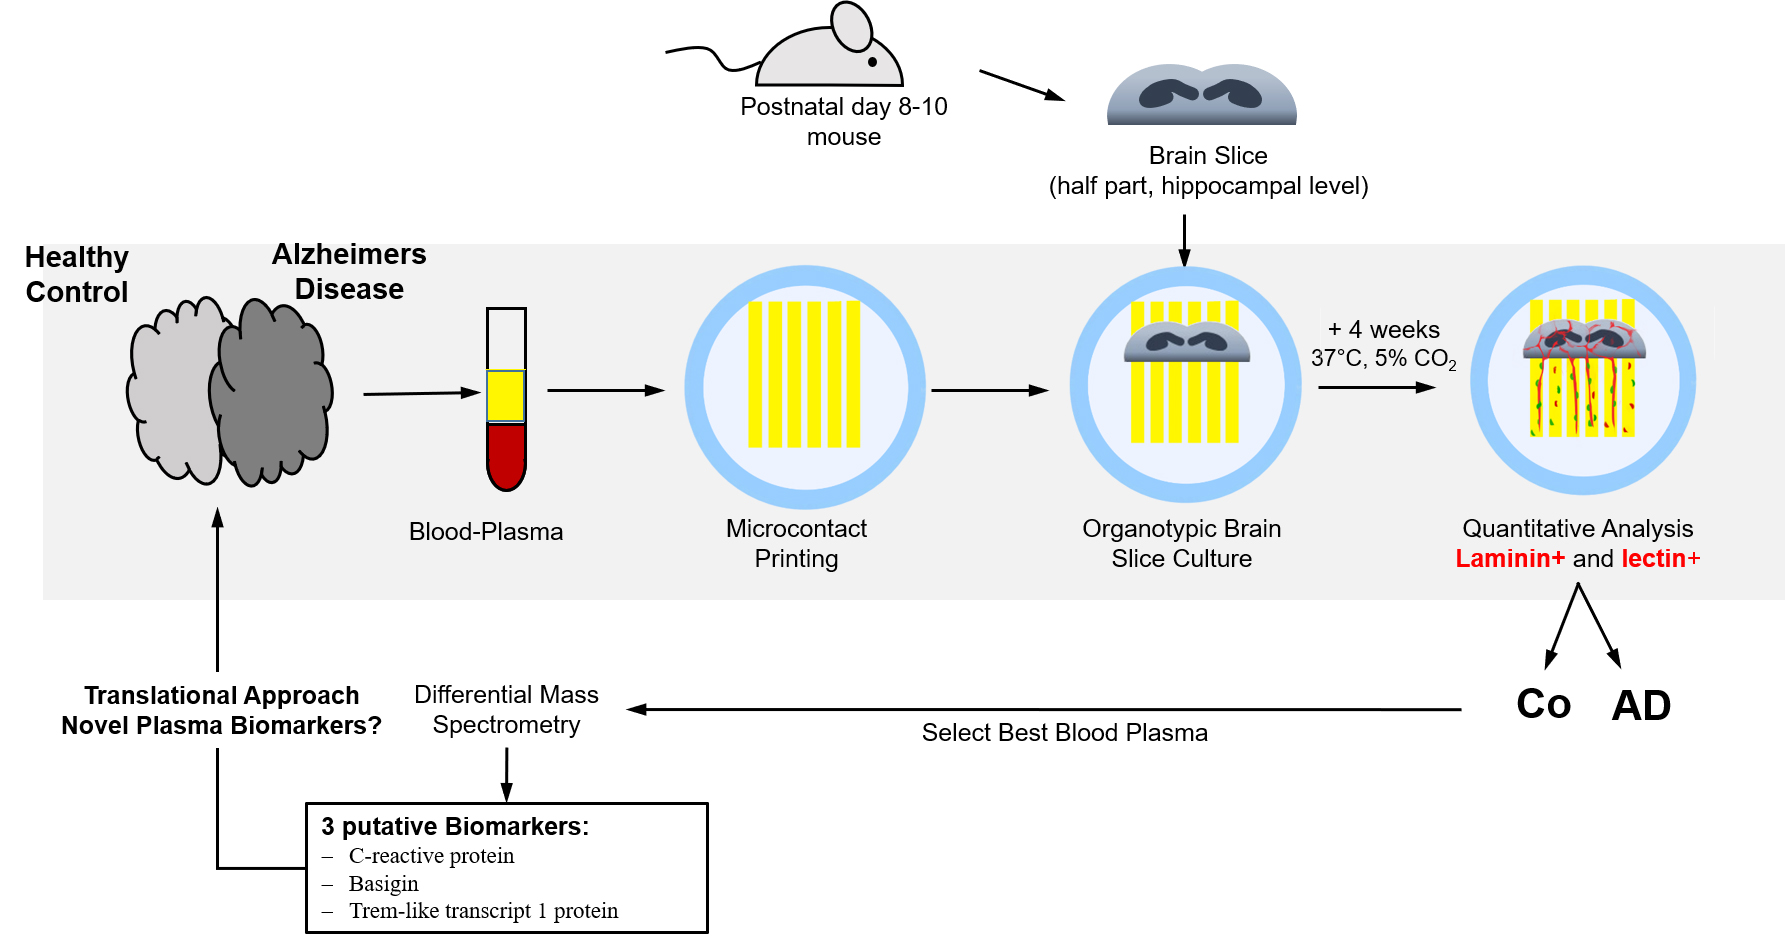
In the present study, plasma from human patients is microcontact printed and connected to mouse brain slices. After 4 weeks in culture, laminin+ and lectin+ endothelial cells (ECs) and vessels are analyzed by immunostaining techniques. The most promising samples were processed by differential mass spectrometry.
Our data show that AD plasma significantly increased the migration length of laminin+ and lectin+ ECs along the microcontact prints. Using differential mass spectrometry, we could identify three potential biomarkers: C-reactive protein, basigin, and trem-like transcript 1 protein.
Here we show that brain slices connected to human plasma prints allow the identification of novel human AD biomarkers with subsequent mass spectrometry. This technique represents a novel and innovative approach to translate research findings from mouse models to human applications.
Graphical Abstract
Keywords
- Alzheimer’s disease
- biomarker
- plasma
- organotypic brain slice
- vessel
- microcontact printing
- basigin
- trem-like transcript 1 protein
Alzheimer’s disease (AD) is a severe neurodegenerative disorder of advanced age
that is characterized by progressive loss of cognitive abilities. It has been
reported that more than 55 million people worldwide suffer from dementia, and
60–70% of them have AD [1, 2]. Definitive diagnosis can be made by
histopathological demonstration of beta-amyloid (A
Researchers have been working for many years to identify plasma biomarkers that
can be used for diagnostic purposes in AD. The National Institute on Aging and
Alzheimer’s Association (NIA-AA) published a guideline on this subject in 2011,
updated it in 2018 under the name “research framework”, and finally revised
this guideline on June 27, 2024 [4]. Many different candidate plasma molecules
have been proposed, ranging from single biomarkers to multiple biomarker panels
[5], but their reliability has been considered controversial [6]. In a remarkable
study, amyloid precursor protein (APP) and A
There is evidence that AD is associated with dramatic vascular changes in the
brain [17] and it is unclear whether vasculopathies are a cause or a consequence
of the disease [18]. The most prominent changes observed in the cerebral vessels
in Alzheimer’s disease are cerebral amyloid angiopathy (CAA) and morphological
and degenerative changes in the affected areas. It has been shown that small
vessels, including capillaries, have a deep association with A
Endothelial cells (EC) form the BBB and regulate the neuronal viability, as they
synthesize and secrete angiogenic factors. EC also clear toxic substances such as
A
Organotypic brain slice cultures are a revolutionary technique that has been used for over 40 years and provides the advantages of in vivo experiments in an in vitro setting [51] and are a bridge between in vivo and in vitro [51]. In order to apply substance directly onto brain slices, we developed the microcontact printing technique (µCP) [52, 53, 54, 55]. Organotypic culture models are very useful to investigate brain vessels to study their functions and pathologies [56, 57, 58, 59, 60, 61, 62]. EC are the basic epithelial cells of blood vessels and form the BBB and they have important functions in many physiological and pathological processes. Organotypic brain slice cultures are a very suitable model for the study of EC because the histological structure of blood vessels is largely preserved and has been used for this purpose in many studies [54, 60, 63]. Using this method, we used brain slices coupled to µCPs, and showed that blood vessels developed and extended specifically along the collagen-loaded lanes, suggesting that the combination of the two techniques could be a very suitable model for brain vessels [54].
In the current study, we aim to print human plasma samples onto semipermeable membranes using the µCP method and to evaluate the differences in angiogenesis and vascular cell function between organotypic brain slices cultured on these prints. According to our hypothesis, we suggest that plasma contains factors that can affect angiogenesis and migration of EC and subsequent formation of vessel. Our data show that plasma of AD patients affects mouse-derived EC and using mass spectrometry we identified 3 novel putative biomarkers in plasma.
In the present study we used organotypic brain slices, coupled them with microcontact prints and used immunostainings to detect EC and vessels. The most promising samples were used for differential mass spectometry to identify novel human biomarkers.
Plasma samples from three different groups, including healthy controls (n = 23), mild cognitive impairment (MCI) (n = 23) and AD patients (n = 22), were used in our study. Only Caucasian individuals aged 60 and over were included. Approval was received for the study from the Ethics Committee of Medical University of Innsbruck (AN2015.0159 351/4.7 405/5.5 (4484a), granted to Prim. Univ.-Prof. Dr. Josef Marksteiner) and all procedures were carried out according to the Helsinki Declaration. Written informed consent was obtained from all patients. Subjects were selected from the patients or their families/legal guardians under the care of Prim. Univ.-Prof. Dr. Josef Marksteiner in Landeskrankenhaus Hall/Tirol, Austria. Plasma samples were collected since 2014 and stored at –80 °C. The samples were never thawed during this period. To ensure sample standardization and eliminate the degradation effect, plasma samples collected in the same years were used in the study. The diagnostic processes of the patients were described in detail in a previous study [64]. Briefly, all subjects were administered the geriatric depression scale (GDS) and the minimental state examination (MMSE) for a comprehensive neuropsychological assessment. According to the results of these assessments, only patients diagnosed with AD and MCI were included in the study. Structural magnetic resonance imaging (MRI) of all patients was carried out with a 1.5 Tesla Siemens Symphony MRI device (Siemens Medical Solutions Inc. Malvern, PA, USA). Care was taken to exclude patients with other medical or neurological disorders that could lead to cognitive deficits. After the groups were determined, 10 mL of blood from each patient was taken into EDTA tubes. After these samples were centrifuged (2300 g, 5 min), the upper plasma phase was collected and stored at –80 °C (Fig. 1).
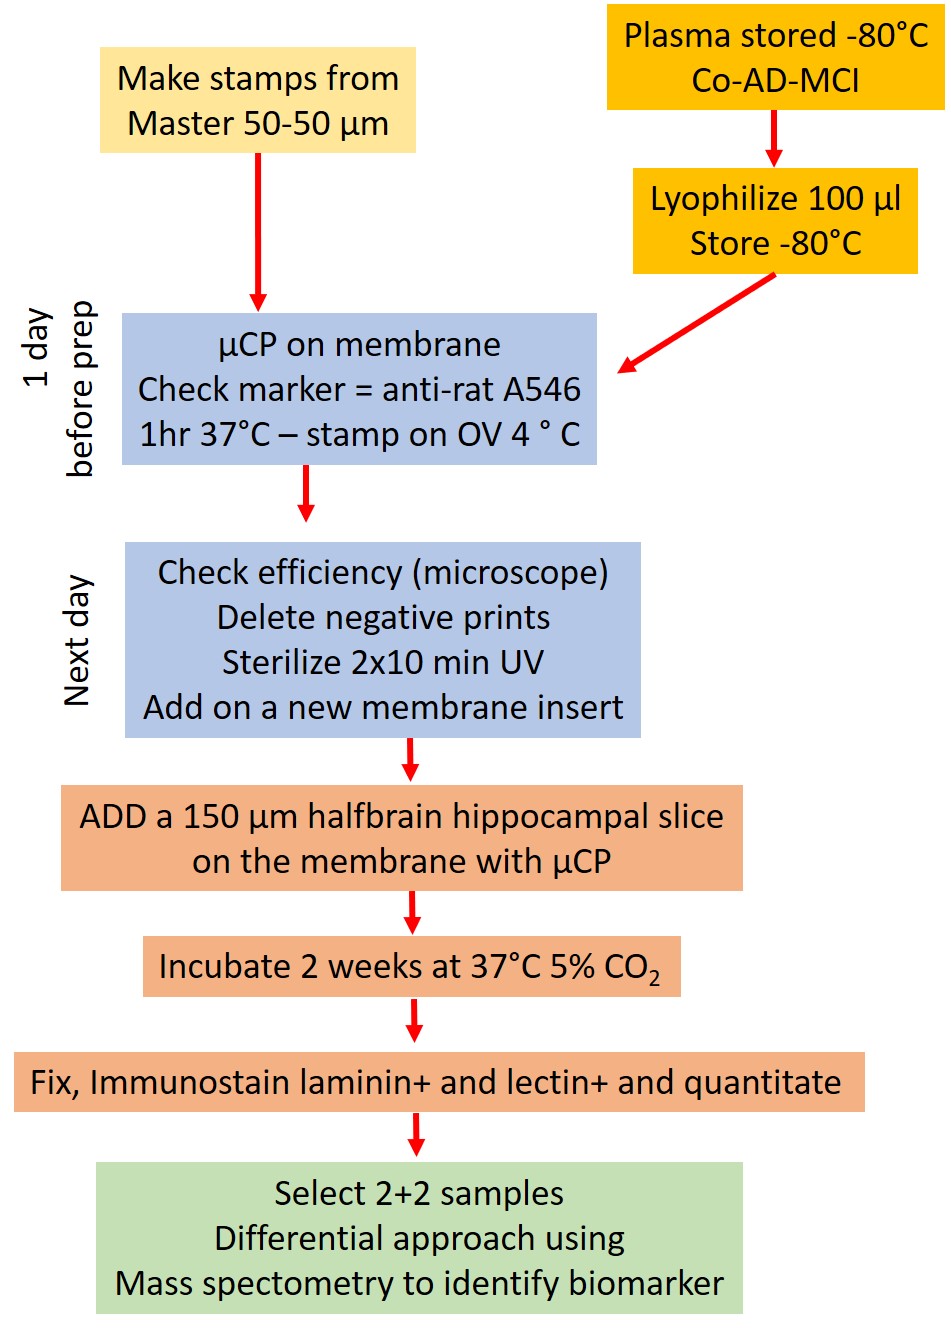 Fig. 1.
Experimental design. Plasma was collected from Alzheimer’s disease (AD), mild cognitive impairment (MCI) patients and healthy control (Co) individuals. Lyophilized plasma was printed onto membranes using microcontact-print technique (µCP). Mouse organotypic brain slices were placed on the prints and cultured for 4 weeks. At the end of the culture period, slices were fixed and fluorescently labeled with laminin antibody and tomato lectin for quantification. Mass spectrometry analysis was performed by selecting the samples that best represent their groups. OV, overnight.
The µCP method with collagen hydrogel was described in detail in a
methodological review we published previously [65]. The master template was
containing a total of 50 lanes, 8000 µm long, 50 µm
wide with 50 µm spacing, and purchased from GeSiM www.gesim.de
(accessed on 18.08.2024) (Fig. 1). Stamps were fabricated from
polydimethylsiloxane (PDMS, Sylgard 184 Silicone Elastomer Kit, Dow, Seneffe,
Belgium) using this template, as described in our previous methodological review
[65]. µCP processes of plasma were carried out briefly as follows:
100 µL of lyophilized plasma sample (Fig. 1) was dissolved with 67
µL of type I bovine collagen solution (11179179001, Roche,
Sigma-Aldrich, St. Louis, MO, USA). Subsequently, 10 µL of 100 mM
(10
The mixture (15 µL) was dropped onto the patterned sides of the stamps and a coverslip was placed on top to ensure even distribution. After waiting at 37 °C for 15 minutes, the coverslips were removed and the excess solution was scraped off the stamp surface with the edge of the coverslip. After the surface of the stamps was completely dry, they were placed on a semi-permeable membrane (HTTP02500, Isopore, Merck Millipore, Darmstadt, Germany) and 18 g of weight was added to the stamps to transfer the mixture to the membrane and kept at room temperature (RT) for 1 h. After the weights were removed, the stamps were left on the membranes O/N at +4 °C. The stamps were carefully removed from the membranes the next morning and the printing efficiency was checked by viewing the Alexa Fluor 546 anti-rat antibody under a fluorescent microscope (Olympus BX61, Tokyo, Japan). Membranes with insufficient printing efficiency were discarded and only membranes with appropriate printing were used in the study (Fig. 1). Then, in order to place the brain slices correctly aligned, a small dot was placed on the same side of all the prints with a marker pen. Membranes were sterilized under UV light for 20 min and kept in sterile medium in a 37 °C incubator at least for 15 min to equilibrate (Fig. 1).
Organotypic half brain slices were obtained according to the protocol we
described in detail previously [65]. Briefly, 8–10-day old C57BL/6 mouse pups
were quickly decapitated and their brains were removed under aseptic conditions.
With care of sterility, brains were glued with a cyanoacrylate adhesive (Loctite
401, Henkel, Düsseldorf, Germany) onto the tissue holder with their frontal
part facing up. The brains were trimmed in the coronal plane up to the
hippocampus and 150 µm thick coronal slices were taken from the
hippocampal level in sterile medium using a water-cooled vibratome (Leica,
VT1000S, Nussloch, Germany). The slices were divided horizontally into two with a
razor blade in the medium, and the upper part containing the hippocampus was
placed on a microcontact printed semi-permeable extra membrane with 0.4
µm pore size (HTTP02500, Isopore, Merck Millipore, Darmstadt,
Germany) in cell culture inserts (PICM03050, Millicell, Merck Millipore,
Darmstadt, Germany) (Fig. 1). Slice cultures were carried out in 6-well plates
(83.3920, Sarstedt, Nümbrecht, Germany) containing 1 mL of pH 7.2 minimum
essential medium (MEM) (11012044, Gibco, Thermo Fisher Scientific, Waltham, MA,
USA). To the medium, 5.12 mM NaHCO3 (106329, Merck Millipore, Darmstadt,
Germany), 31.5 mM glucose (49159, Merck Millipore, Darmstadt, Germany), 2 mM
glutamine (100289, Merck Millipore, Darmstadt, Germany), 10% heat-inactivated
horse serum (16050-122, HS, Gibco, Thermo Fisher Scientific, Waltham, MA, USA),
0.25
For immunofluorescence labeling, we used the method we published previously
[66]. For permeabilization, the slices were kept in 0.1% T-PBS (Triton X100-PBS)
for 30 min at RT with gentle shaking and then washed with 10 mM PBS for 3
Confocal microscopic imaging and analysis were performed with a confocal
microscope (Zeiss LSM 980, Carl Zeiss Microscopy Deutschland GmbH, 73447
Oberkochen, Germany) using the 20
To prepare the samples for analysis, plasma was first processed to deplete 14 of
its most abundant proteins. Following the manufacturer’s protocol, this depletion
was carried out using High Select™ Depletion Spin Columns (P/N:
A36369, Thermo Scientific, Rockford, IL, USA). The proteins in the 400
µL sample flow-through were then reduced by adding 40
µL of dithiothreitol at a concentration of 100 mM in PBS buffer,
incubated for 30 minutes. Next, to alkylate the free cysteines, 40
µL of 550 mM iodoacetamide prepared in PBS buffer was added, with
samples kept in the dark at room temperature for 20 minutes. After being
lyophilized to a volume of 200 µL, samples were diluted fivefold
with acetonitrile, mixed by vortexing, and centrifuged at 16,000
For the liquid chromatography-tandem mass spectrometry (nanoLC-MS/MS) analysis,
the digested peptides were injected into a nano-HPLC system (UltiMate 3000,
Thermo Scientific, Waltham, MA, USA) interfaced with an Orbitrap Eclipse mass
spectrometer (Thermo Scientific, Waltham, MA, USA), in line with a prior protocol
[67]. Briefly, the peptides were separated using an acetonitrile gradient over a
142-minute total gradient on a homemade column (100 µm i.d.
For MS data analysis, Proteome Discoverer software (version 3.1, Thermo Scientific, Waltham, MA, USA) was used. MS/MS spectra were searched against the Uniprot human reference proteome database (EMBL-EBI, Cambridgeshire, UK) (last updated on 27/03/2024) using the Sequest HT search engine (The University of Washington’s Proteomics Resource, Seattle, WA, USA). Parameters were set as follows: trypsin specificity allowing up to two missed cleavages, fixed carbamidomethyl modification on cysteine, and variable oxidation on methionine. The precursor mass tolerance was 10 ppm, with a fragment mass tolerance of 20 mmu. A maximum false discovery rate (FDR) of 1% was applied to both protein and peptide identifications. Protein quantification was performed by calculating fold changes based on TMTpro reporter ion intensities in MS2 spectra. Additionally, sequence similarity between human and mouse was examined using the NCBI BLAST+ software (Version 2.16.0, National Library of Medicine, Bethesda, MD, USA) and database (EMBL’s European Bioinformatics Institute Hinxton, Cambridgeshire) [68].
Using the method described by Cohen [69], it was calculated that in order for the effect size suggested as 0.40 between the 3 groups to be statistically significant, a minimum of 66 cases should be studied, with a Type I error of 5% and a Test Power of 80%.
Quantitative analyzes were performed in a blinded manner. Counts included only
cells that had migrated, as well as new vessel-like formation that had extended
significantly beyond the brain slice and were positioned on the lanes. Long, thin
structures formed by tightly connected cells that labeled strongly positive for
laminin and had small and flattened nuclei morphologically similar to those in EC
were accepted as vessel-like structures (Fig. 2). Counts and measurements were
made in an area of 300 µm length and 6 lanes width in all samples
using the ImageJ software (version 1.54; National Institute of Health, Bethesda,
MD, USA). Pixel-to-µm ratio was calculated using a micrometric ruler
and the software was calibrated according to this result. After calibration, the
average migration distance of the cells was measured with the segmented line tool
of the software. Using the cell counter tool of the software, the averages of
laminin and lectin positive cells in all groups were calculated. All data were
presented as mean
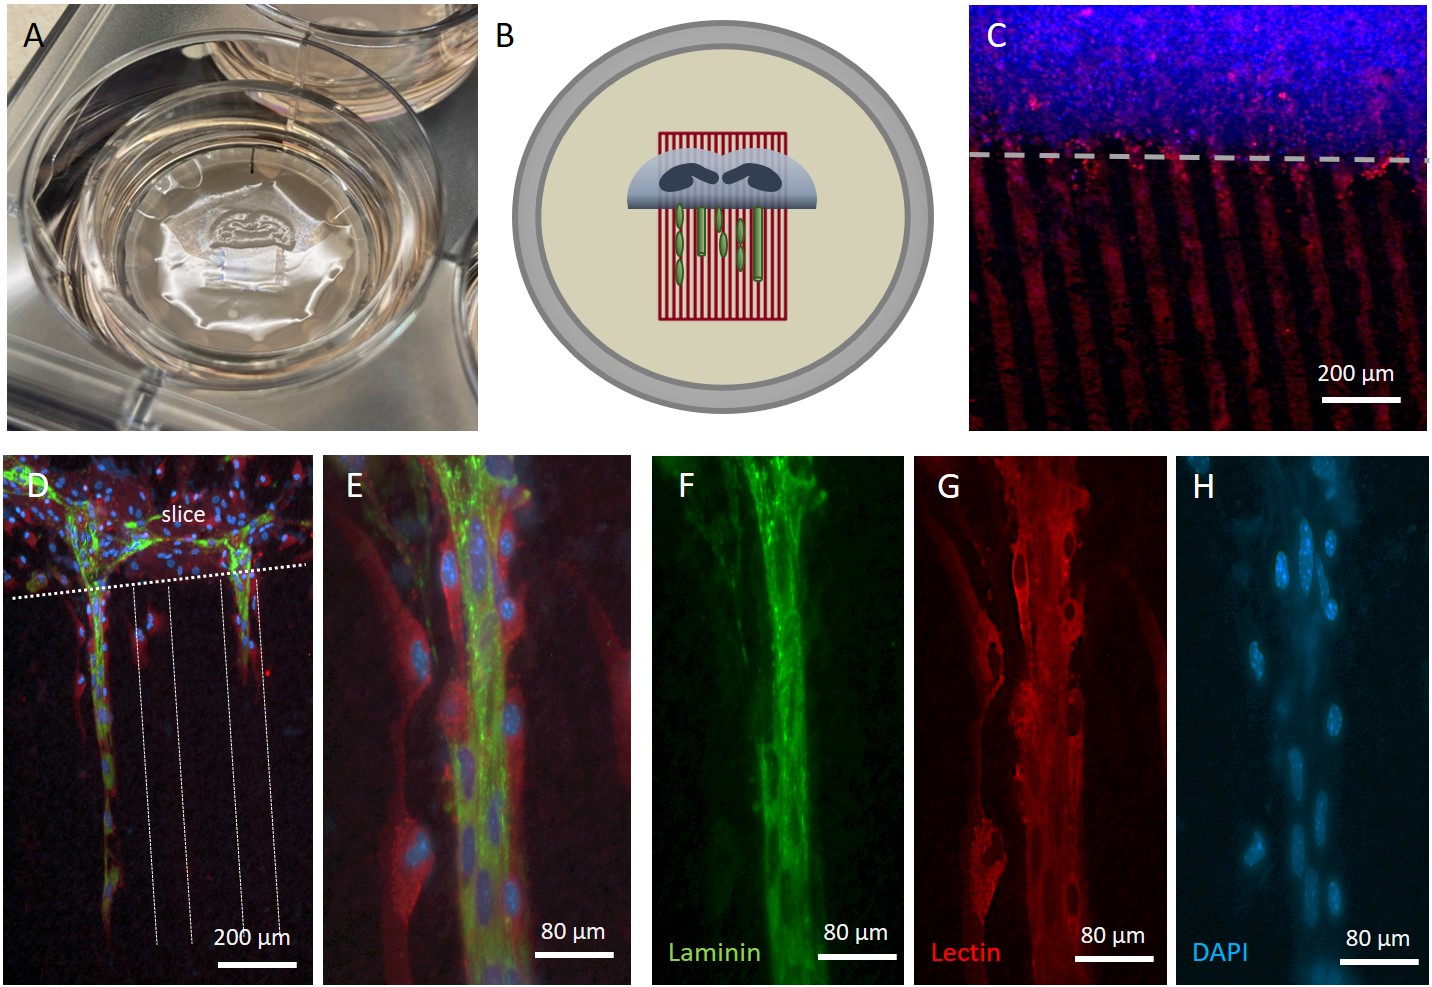 Fig. 2.
Culturing of organotypic brain slices and immunostainings for endothelial cells (EC). Half brain slices at the hippocampal level were cultured on semipermeable membranes (A) and coupled to microcontact printed lanes, where cells can migrate and form vessel like structures (B). (C) shows a staining of red fluorescent prints (loaded with a checking anti-rat 546 antibody) and counterstained with blue fluorescent nuclear DAPI (C; the white dotted line gives the border of the brain slice). Brain EC and respectively vessels were stained with laminin (green fluorescent A488; (F), red fluorescent Lectin (G) and blue fluorescent nuclear DAPI (H)). (D,E) give merged pictures with an overview (D) and at a higher magnification (E). In (D), the dotted lines give the location of the microcontacted print lines and the border of the slice. In (E), Lectin+ cells (arrow) are in close proximity to the vessel-like structure formed by cells that are double positive for laminin and lectin. Scale bar in (C,D) = 200 µm, (E–H) = 80 µm.
Plasma from 23 healthy controls, 23 MCI and 22 AD patients, including more females, was used to ensure gender balance (Table 1). The mean age of the subjects was approximately 73 years and was significantly higher in the AD group (Table 1). The mean MMSE scores were 29.7 in the control group, 27.8 in the MCI group, and 19.7, which was significantly lower in the AD group. While no significant difference was found between the groups for the GDS score averages, they were 2.2 for the control group, 4.3 for the MCI group, and 3 for the AD group (Table 1).
| Patient | n | Male | Age | MMSE | GDS |
| Control | 23 | 7 | 73 |
29.7 |
2.2 |
| MCI | 23 | 7 | 76 |
27.8 |
4.3 |
| AD | 22 | 5 | 82 |
19.7 |
3.0 |
In the present study plasma from healthy controls, patients with mild cognitive
impairment (MCI), and patients with Alzheimer’s disease (AD) were used. Values
are shown as mean
Immunolabeling with laminin and lectin was performed to EC and vessels in the brain slices and double co-labeling was applied with these two markers. It was observed that the blood vessels in the brain slice and the EC migrating out of the slice were labeled with both laminin and lectin (Fig. 2). In addition to these cells, it was observed that there was another cell population that migrated out of the slices along the lanes and was observed as only lectin+ and these cells surrounded the vessel-like structures (Fig. 2). Almost all of the cells migrating out of the brain slices were localized on the µCP lanes (Figs. 2,3). These cells were observed either as single cells, in groups that came together and began to compact, or as tightly connected cells.
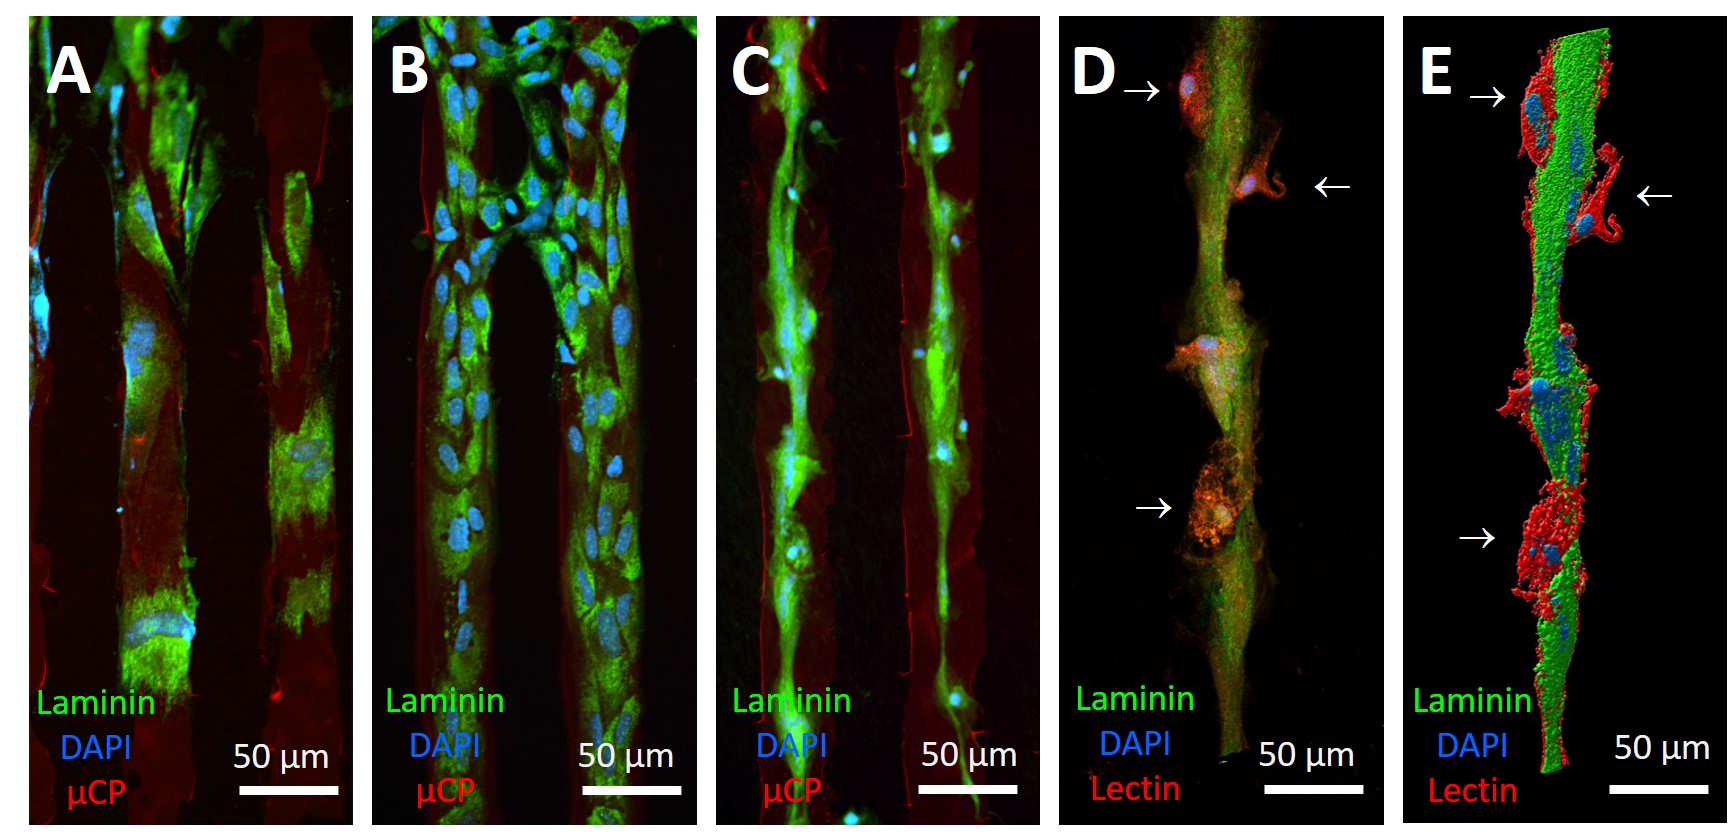 Fig. 3.
Formation of vessel-like tubes. (A) shows migration of a few laminin+ (green fluorescent Alexa-488) EC. (B) shows a dense network of these laminin+ EC and (C) shows that these dense EC form tube-like structures. The location of the red fluorescent control microcontact prints is shown in (A–C). Since the red stained lanes with Alexa-546 conjugated antibody degraded during the four-week culture period, the lanes and the structures on them in (A–C) were obtained by overlapping different photographs. A confocal micrograph of these structures is shown in (D). Lectin+ cells surround the vessel-like structures (arrows). Reconstructed image of vessel like-structures shown in (E). Close relationship of Lectin+ cells with vessel-like structures is observed. All slices were counterstained with blue fluorescent nuclear DAPI. Scale bar = 50 µm.
Our data show that single EC migrated along the µCP lanes (Fig. 3A), but with the time of prolonged culturing these EC became denser and more compacted, their size decreased and cells flattened (Fig. 3B). This is consistent with the morphology of the endothelial cell, finally forming vessel-like structures (Fig. 3C). Confocal microscopic imaging showed that the vessel-like structures consisted mainly of laminin+ cells and that these cells were tightly interlocked and formed solid cellular cords (Fig. 3D,E). A lectin+ cell population was also observed around these vessel-like structures. These cells appeared to surround the vessel-like structures from the outside and have a close connection with them (Fig. 3E, arrows).
Quantification shows that plasma alone significantly reduced the number of laminin+ (Fig. 4A) and lectin+ (Fig. 4B) cells, when compared to PBS-loaded collagen. No effect on EC was seen when plasma was loaded from healthy controls, MCI patients or AD patients (Fig. 4A,B). However, when we compared the migration lengths of the cells, then plasma from AD patients significantly increased the migration of laminin+ (Fig. 4C) and lectin+ (Fig. 4D) cells along the µCPs. Plasma alone did not affect the migration capacity. compared to a PBS-loaded control.
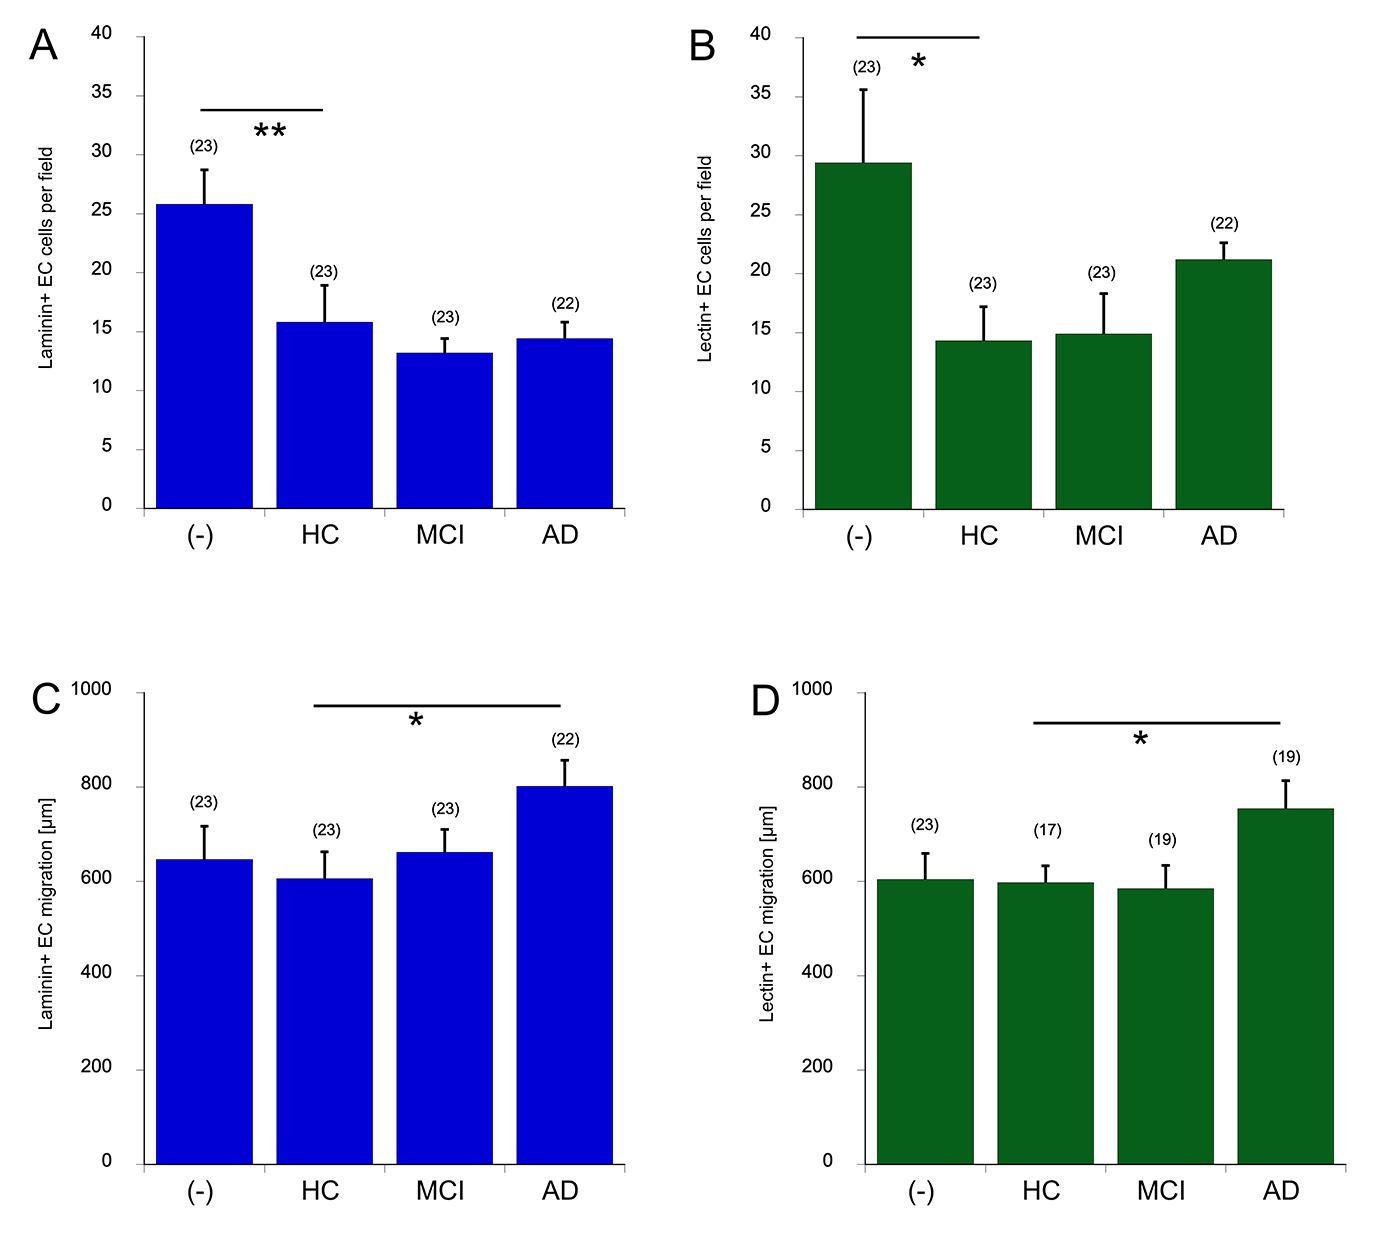 Fig. 4.
Quantitative evaluation of laminin+ (A&C, blue bars) or lectin+
(B&D, green bars) endothelial cell number (A,B) or migration length (C,D).
Collagen with PBS only (-), plasma from healthy controls (HC), patients with MCI
or AD were microcontact printed onto membranes. Then, brain slices were added and
cultured for 4 weeks. Brain slices were fixed and immunohistochemically stained
for laminin and lectin and counted. Values are given as mean
In the next step, the newly formed vessels were quantified. It was unexpected that only some of the slices reacted and formed new vessels (17.4–31.8% of the slices; Fig. 5). When quantified all slices approx. 0.3–0.5 new formed vessels were seen (Fig. 5, red bar), when only those slices were counted where new vessels were found, then this number increased to 1.0–1.4 vessels per slice (Fig. 5, blue bar). No difference was seen in the new formed vessels between the groups (Fig. 5).
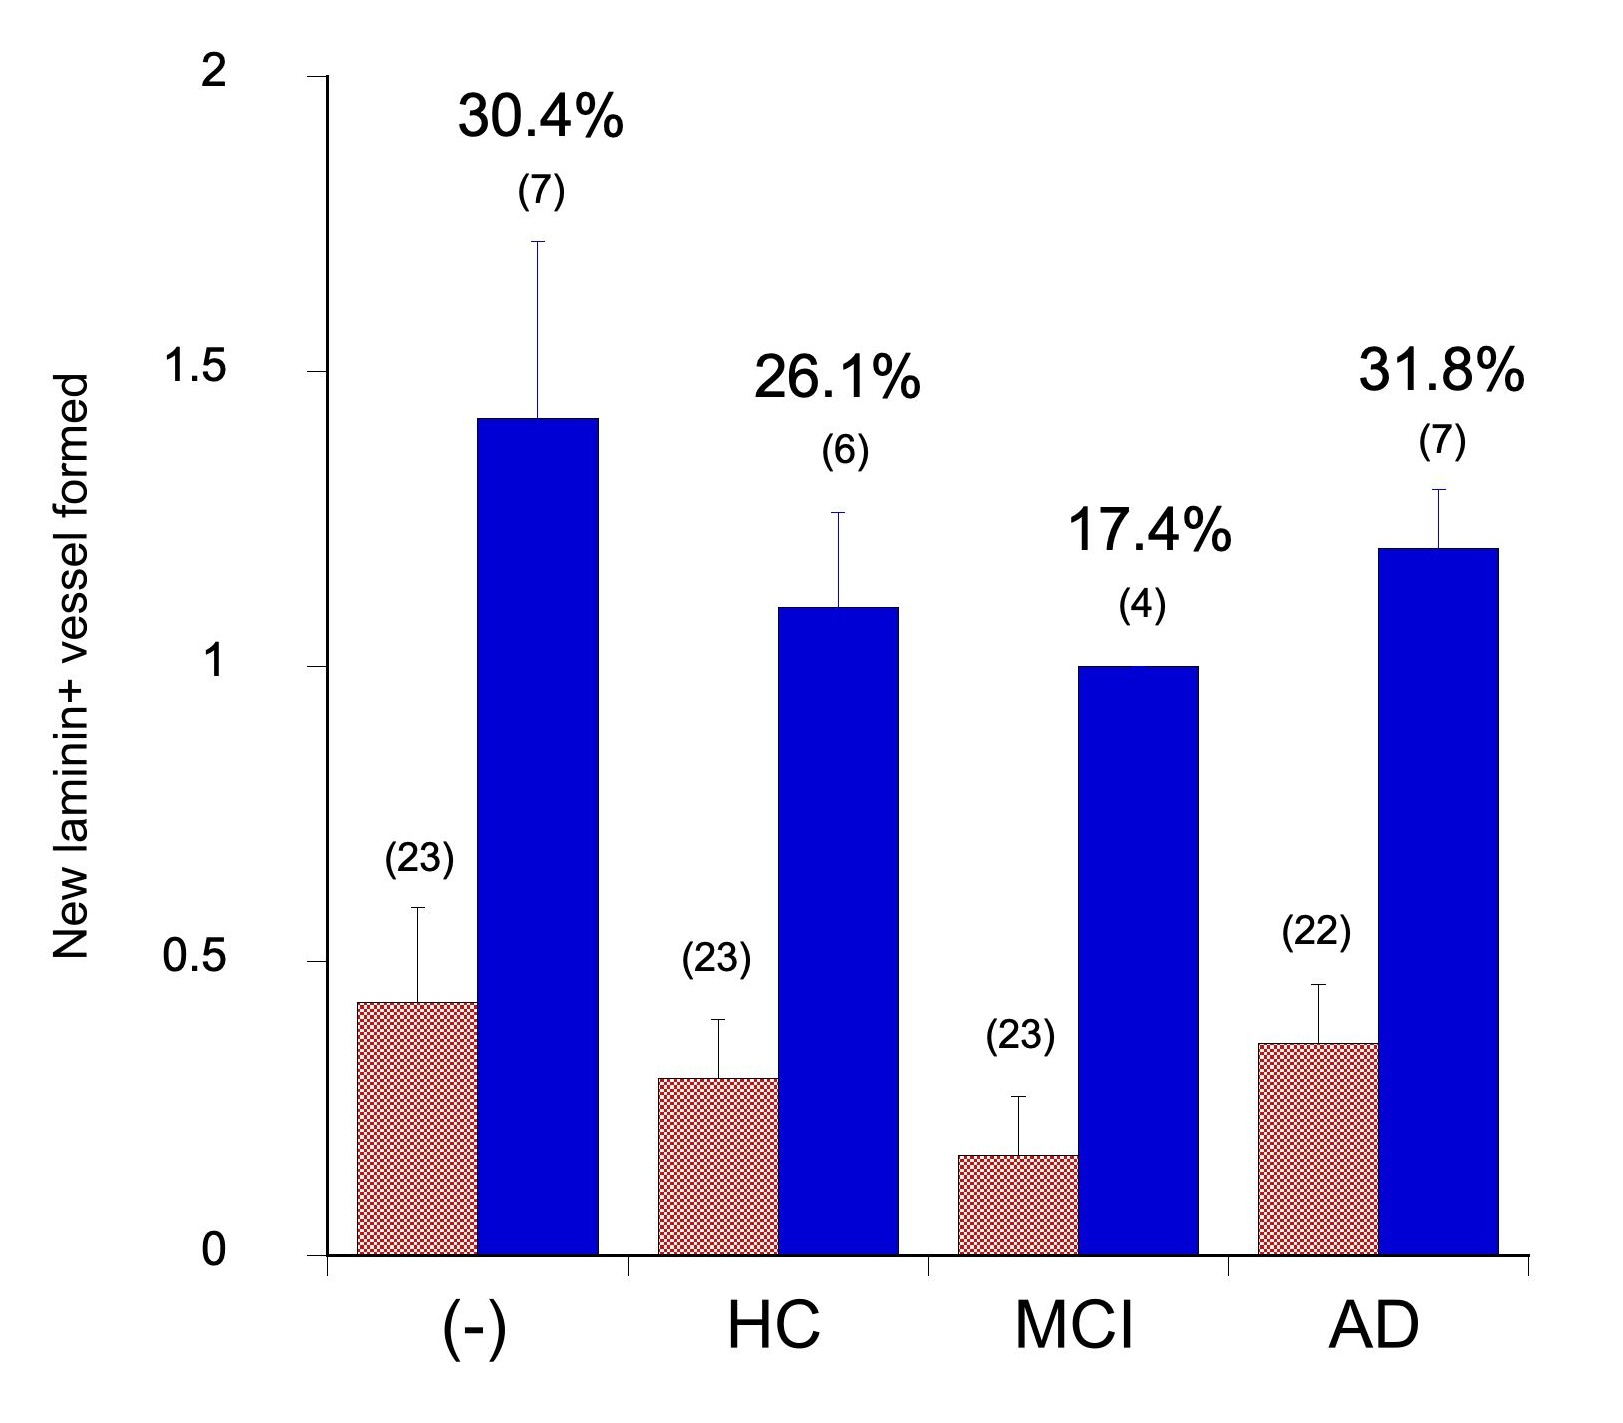 Fig. 5.
Quantification of newly formed vessels. Collagen was loaded
with PBS only (-) or plasma from healthy controls (HC), patients with MCI or AD
and microcontact printed onto membranes. Then, a brain slice was added and the
slices cultured for 4 weeks. Brain slices were fixed and immunohistochemically
stained for laminin and the newly formed vessels were counted. Values are given
as mean
Based on the results in Table 2, we selected the top two controls and top two AD samples (Fig. 6) and performed mass spectrometry. After depletion of the 14 most prominent proteins in plasma (e.g., albumin, immunoglobulins, fibrinogen, transferrin, …), we quantified approximately 1400 proteins in plasma with an overlap of 1396 proteins (Fig. 6).
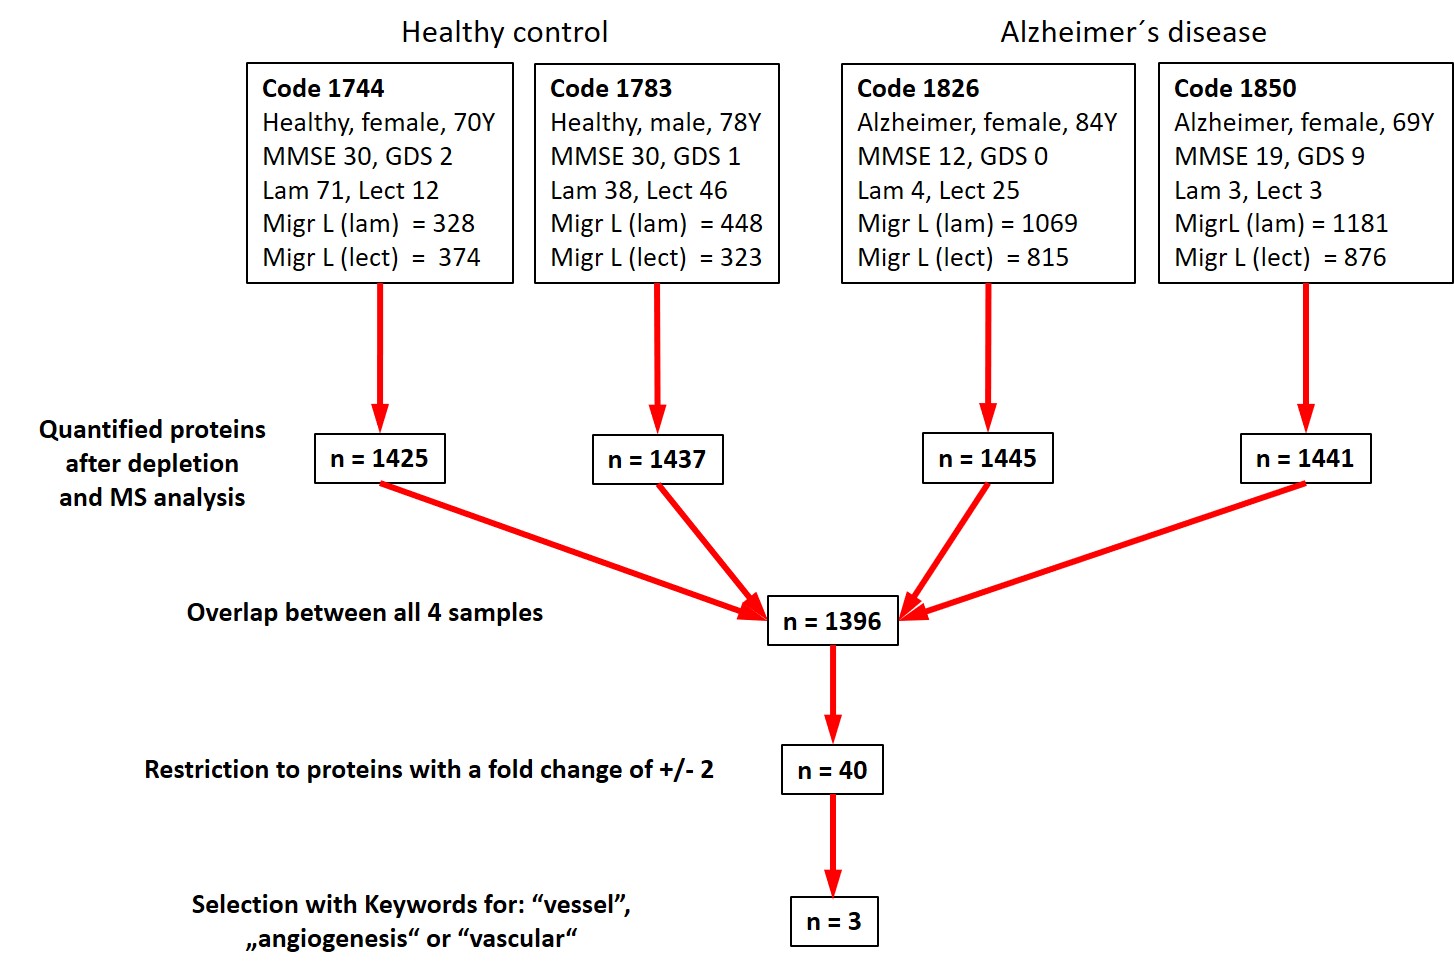 Fig. 6.
The best 4 plasma samples were selected based on their effects on angiogenesis or EC migration (2 control and 2 AD). The number of identified proteins after depletion of 14 proteins is shown. Differential mass spectrometry and linking to the keywords “vessel” or “angiogenesis” or “vascular” finally resulted in 3 identified putative biomarkers.
| Putative biomarker identified | Symbol | AccNr. | MW [kDa] | #Unique peptides | Change in AD | Identity [%] | Similarity [%] |
| C-reactive protein | CRP | P02741 | 25 | 6 | 0.3 |
70.1 | 83.0 |
| Basigin | BSG | P35613 | 42.2 | 3 | 2.5 |
65.0 | 80.5 |
| Trem-like transcript-1 protein | TREML1 | Q86YW5 | 32.7 | 3 | 2.2 |
67.1 | 75.9 |
Putative biomarkers in this table were determined according to the experimental
results summarized in Fig. 6. This table also gives the gene symbol, the
accession number in the data bank (AccNr.), the molecular weight (MW), the number
of unique peptides and the changes up or down in x-fold between controls and AD.
Homology levels were calculated via NCBI BLAST+ and are given as the percentage
amount of characters that match exactly (Identity) and regions that may indicate
functional, structural or evolutionary relationships (Similarity) between human
and mouse. Increases in the amount of proteins are indicated by the
“
Based on these results we further restricted the number of proteins by the keywords “vessel” or “angiogenesis” or “vascular”, 3 putative biomarkers were identified: C-reactive protein, basigin and trem-like transcript 1 protein (Table 2).
Taken together, our data show that plasma from Alzheimer patients significantly increased the migration length of laminin+ and lectin+ EC along the plasma microcontact prints, but not the number of EC. Based on these findings, we selected the best representing plasma samples and performed mass spectrometry using a differential approach and we identified 3 potential biomarkers: C-reactive protein, basigin and trem-like transcript 1 protein.
In the present study, we coupled organotypic mouse brain slices to microcontact prints loaded with human plasma. We found that plasma from AD patients enhanced the migration of laminin+ and lectin+ EC. Using the most promising samples, we identified three potential biomarkers using differential mass spectrometry: C-reactive protein, basigin and trem-like transcript 1 protein.
There is only one study investigating the effects of plasma directly on EC [70]
and have mostly been conducted by evaluating the effects of isolated plasma
factors [71, 72]. In an early study, when plasma and serum were compared to
cultured endothelial cells, it was reported that plasma application reduced
proliferation compared to serum [73]. In our study in brain slices, we concluded
that plasma reduced proliferation regardless of whether it was taken from healthy
or diseased individuals and we hypothesized that plasma-derived factors inhibit
EC proliferation or have toxic properties. Such a toxic response was seen when
thrombotic thrombocytopenic patient plasma was applied to cultured EC [74].
Although we cannot exclude toxic effects, this is unlikely, and we believe that
human-derived factors inhibit the migration of mouse EC. Indeed, there are many
factors in plasma that support (vascular endothelial growth factor (VEGF),
fibroblast growth factor (FGF), platelet derived growth factor (PDGF), and
epidermal growth factor (EGF)) or inhibit (transforming growth factor beta
(TGF-
Laminin is an extracellular multi-adhesive glycoprotein that polymerizes in the basement membrane (BM) of blood vessels and, together with type IV collagen, forms its major skeletal structure [81]. Laminin also has important functions in cell proliferation and differentiation, which is largely mediated through integrin receptors on the cell surface [82, 83]. Laminin has important functions in the formation and maintenance of the BBB and angiogenesis and in our study, we used the laminin antibody to directly label EC and newly formed vessel-like structures. We observed that the vessel-like structures along the lanes were specifically and intensely labeled with the laminin antibody [84]. Collagen-containing matrix structures have been used in in vitro angiogenesis studies for many years and EC show vessel formation within days or weeks [85, 86]. However, it has been shown that this effect is markedly reduced when laminin is used as the extracellular matrix component [81]. Thus, laminin is one of the most essential proteins required for new vessel formation under physiological and pathological conditions and is highly suitable to analyze EC and subsequent vessel formation.
Lectins are a class of proteins responsible for cell-cell interaction, signaling pathways, and several innate immune responses [87]. It is well known that the vasculature can be immunohistochemically stained with lectin specific antibodies, but also with lectins coupled to fluorescent dyes, such as, e.g., lectins of plant origin with fluorescent properties, such as red fluorescent tomato lectin [88]. Fluorescently conjugated lectin is a protein that shows high affinity to carbohydrates, and binds to macromolecules on the surface of EC [89]. While, laminin labels mostly the basement membrane of EC, lectin can be considered as an additional specific marker for EC. Thus, in our study, we used fluorescently conjugated lectin to strengthen our data with 2 independent markers for EC. It was very interesting to see, that two different cell populations were found. While some cells were both laminin+ and lectin+, the second group of cells was observed as only lectin+. This is clearly shown by a higher number of lectin+ EC, compared to laminin+ cells. Our data show that vessel-like structures were composed of laminin+/lectin+ double positive cells. On the other hand, only lectin+ cells were attached to these structures and surrounded them, which we could verify using confocal microscopy. It seems possibly that the only lectin+ cells on the surface of EC may represent pericytes [90, 91, 92]. Pericytes play a role in angiogenesis, BBB formation and maintenance [93, 94] and many studies show that pericytes play a role in AD vasculopathy [95, 96, 97, 98]. A previous study has shown that the number of pericytes in the cerebral vessels increases in progression of AD and that pericyte damage is seen as one of the early signs in dementia [99]. Thus, the use of both markers, laminin and lectin, provide better and more accurate stainings of EC and vessel.
EC migration is a process during vasculogenesis and angiogenesis, as well as in the healing of damaged vessels [100]. Vascular alterations in AD cause hypoxia and the up-regulation of proangiogenic mediators [101], such as altered enhanced or dysfunctional vascularization [102] and formation of new blood vessels [33]. In our study, we observed an increase in migration of vascular cells in the AD group, but not an increase in the number of new vessel-like formations. It can be suggested that the pro-angiogenic factors present in AD plasma stimulate the migration and angiogenesis in vitro, but this is not sufficient for the completion of new vessel formation. In the present study we investigated vessel by immunostainings, but we cannot fully prove that these vessels are tubes and fully active, thus we term them “vessel-like structures”. Our data may provide evidence that the 4-week period is too short for the formation of new “vessel-like structures” and it may be necessary to culture slices for a longer time period. It will be interesting to study also NOTCH and VEGF receptors, as they may play a role in the formation of new vessels [103, 104, 105].
In order to find new biomarkers, we selected the best samples, based on the migration capacity of laminin+ cells and compared controls with AD using differential mass spectrometry and proteomics and we identified 3 potential biomarkers for AD selective for the keywords “vessel” or “angiogenesis” or “vascular”: C-reactive protein, basigin and trem-like transcript-1 protein.
C-reactive protein (CRP) is an acute phase reactant protein primarily
synthesized in hepatocytes and is elevated in the blood after neuroinflammation
[106]. There are numerous studies suggesting that this protein is associated with
APOE
Basigin (CD147) is a transmembrane glycoprotein that belongs to the IgG
superfamily and has been shown to stimulate the synthesis of many different types
of matrix metalloproteinases (MMP). Basigin has also an important role in tumor
invasion and metastasis [119, 120]. In AD, basigin is an integral regulatory
subunit of the
Trem-like transcript-1 protein (TLT-1, TREML1) is a transmembrane receptor protein that is a member of the Triggering receptor expressed on myeloid cells family. It is expressed in various immune cells, megakaryocytes and platelet alpha granules and plays an essential role in platelet aggregation and hemostasis [125, 126]. Soluble TLT-1 found in plasma plays a protective role in AD and has anti-inflammatory properties [127]. In our PubMed search, we could not find any studies directly addressing the relationship between TLT-1 and AD pathogenesis or plasma biomarkers. However, it is extremely interesting to note, that activated platelets express TLT-1 and release it into the plasma. First, TLT-1 colocalizes with VEGF in platelets and it stimulates angiogenesis by affecting EC and platelet activation and possibly angiogenic processes [128]. Second, TLT-1 is also involved in cell adhesion and migration processes [129]. And finally, and most importantly, there are several reports that activated platelets migrate into the brain and contribute to the progression of AD. In our lab, we have shown that platelets migrate into the human AD brain [130] and damage cortical vessel causing inflammation [62]. It seems possible that activated platelets cross the damaged BBB in AD and release platelet-derived beta-amyloid(40), which may contribute to the plaque development (see review [131]). Platelet-derived TLT-1 may play a potent role in this process.
There are some definite limitations (weaknesses) in our study: (a) Printing
plasma onto polycarbonate membranes is a process that requires knowledge and
experience and has a high probability of error as print results can sometimes be
inconsistent. To prevent this, we prepared multiple prints from each plasma
sample. To assess the quality of the prints, we added a fluorescently conjugated
antibody (Alexa 546) to the loading mixture and only selected the best samples
that met our quality standards for study. (b) AD is a disorder seen in elderly
individuals. Therefore, the 8–10-day old animals we used in our study cannot
fully represent the AD group. Conducting the study with adult animal brain slices
will largely eliminate this disadvantage. However, the success rate of long-term
culture methods with brain slices from adult animal subjects is still quite low.
(c) Since we used mouse brain tissue in our experiments, the differences between
species reduce the reliability of the results to some extent. However, we assume
that the factors in human plasma are effective due to the homological similarity
between mouse and human. (d) Obtaining organotypic brain slices suitable for
culture is a process that requires experience and manipulation skills. Sometimes,
even in the results of subjects in the same group, deviations can be seen,
although we pay utmost attention to obtain slices with similar quality standards.
(e) In our study, we used immunolabeling methods to show vascular cells with
laminin and lectin. Although protein expressions provide very useful information
in showing functional and pathological changes in experimental groups, the
results can be evaluated semi-quantitatively. In our future studies, quantitative
evaluation of gene expression as well as protein production will provide more
accurate confirmation of our findings and hypotheses. (f) Although histological
structure and cell-to-cell interactions are largely preserved in brain slices,
blood circulation and axons of some neurons are lost due to the cutting process.
These disadvantages, together with the inadequacies of the in vitro
environment, limit the ability of the experiment to represent in vivo
conditions. (g) AD is a disease that develops over a long period of time and
progresses over many years. Therefore, a 4-week culture period may not be
sufficient to represent the effects of the disease. Additionally, this period may
not be long enough for the development of new blood vessels and significant
differences in their numbers to be detected. (h) The plasma we used in the study
were collected many years ago and are well-preserved samples. However, we do not
have the genetic data of these subjects that may be relevant to our study (such
as APOE
In the present study, we coupled organotypic mouse brain slices to microcontact prints loaded with human plasma. We found that plasma from AD patients enhanced the migration of laminin+ and lectin+ EC. Using the most promising samples, we identified three potential biomarkers using differential mass spectrometry: C-reactive protein, basigin and trem-like transcript-1 protein. Based on our results we hypothesize that inhibition or the activation of one of these 3 molecules may influence endothelial cell migration and possibly formation of new vessel. The next steps to identify the potential role of these 3 plasma biomarkers in AD will be: (1) we will develop a sensitive human ELISA to analyze these 3 factors in plasma to demonstrate a significant difference between healthy controls and AD and (2) we will also generate recombinant human proteins and load these proteins into the µCP lanes to proof that indeed migration of EC and vessel formation is modified. Our present study is an innovative novel approach to find new human biomarkers in a mouse cell culture model.
In conclusion for a broader readership: AD is a severe neurodegenerative
disorder and it would be helpful for the patients to get an early and accurate
diagnosis. So far only CSF biomarkers are available, but we need non-invasive
blood-plasma biomarkers. There is an extensive search worldwide to identify new
biomarkers in blood, but none has yet entered clinical routine. In this study we
connected our extensive experience on brain slices (more than 20 years) with our
novel innovative method of microcontact printing and aimed to find new biomarkers
in plasma. We identified 3 novel human AD biomarkers, which could have a
potential to diagnose AD. It will be essential to use very sensitive and fast
assays (e.g., ELISAs, chemiluminescence, single molecule array services (SIMOA),
PCR) to detect these 3 biomarkers and compare controls versus AD with a high
number of patients (
All data reported in this paper will be shared by the corresponding author upon request.
Conceptualization, CH; methodology, KS, SNY, BS, KF and JM; software, KS and SNY; validation, KS and SNY; formal analysis, BS, KF, CH; investigation, KS, SNY; resources, CH; data curation, KS, SNY and JM; writing—original draft preparation, KS and SNY; writing—review and editing, CH and JM; visualization, KS and CH; supervision, CH; project administration, CH; funding acquisition, SNY and CH. All authors have read and agreed to the published version of the manuscript. All authors contributed to editorial changes in the manuscript. All authors have participated sufficiently in the work and agreed to be accountable for all aspects of the work.
The study was conducted in accordance with the Declaration of Helsinki, and approved by the Ethics Committee of Medical University of Innsbruck (AN2015.0159 351/4.7 405/5.5 (4484a), 29.01.2020) to Prim. Univ.-Prof. Dr. Josef Marksteiner. A written consent was signed by the patients or their families/legal guardians. The animal study protocol was approved by the Ethics Committee of Austrian Ministry of Science and Research (2021-0.150.227, approval date 26 August 2021) and adhered to Austrian guidelines on animal welfare and experimentation. Our study involving mice followed ethical guidelines for animal sacrifice, and all animal work complied with international and national regulations. We adhered to the 3Rs principles (reduce, refine, replace) for animal experiments. It should be noted that all our slice experiments are classified as ‘organ removal’ and not as ‘animal experiments’.
We thank Anna Draxl, Mohadeseh Ragerdikashani, Mathias Villunger and Andreas Kuen for excellent technical assistance and Gulhan Orekici Temel for her help in calculating the sample size biostatistically.
This study was supported by the Scientific and Technological Research Council of Türkiye, grant number 1059B192300559; TUBITAK-2219-International Postdoctoral Research Fellowship Program for Turkish Citizens.
The authors declare no conflict of interest.
References
Publisher’s Note: IMR Press stays neutral with regard to jurisdictional claims in published maps and institutional affiliations.