


1 Department of Endocrinology, the Third People’s Hospital of Changzhou, 213001 Changzhou, Jiangsu, China
2 Department of Ophthalmology, the Third People’s Hospital of Changzhou, 213001 Changzhou, Jiangsu, China
Abstract
Diabetes retinopathy (DR) represents a microvascular disease in diabetes. Growth arrest-specific 1 (GAS1) is differentially expressed in rat retinal Müller cells under high glucose (HG) conditions, and its promotion of ferroptosis contributes to retinal cell death. However, the influence of GAS1 in DR is elusive. Herein, we aimed to investigate the effect and potential mechanism based on GAS1-mediated ferroptosis on DR.
After HG treatment, the differentially expressed genes in rat retinal Müller cells were analyzed by transcriptome sequencing followed by Kyoto Encyclopedia of Genes and Genomes (KEGG) and Gene Ontology (GO) analyses; finally, GAS1 was selected. The effects of GAS1 knockdown/overexpression and nuclear factor erythroid 2-related factor (Nrf2) silencing on viability, apoptosis, lipid peroxidation, Fe2+, and oxidative stress levels in HG-induced/transfected Müller cells were measured by Cell Counting Kit-8 (CCK-8) assay, flow cytometry, and commercial reagent kits. The potential effects of GAS1 and Nrf2, especially on GAS1, Nrf2, and Kelch-like ECH-associated protein 1 (Keap1) expressions in cells, were determined by quantitative real-time polymerase chain reaction (qRT-PCR) or Western blot.
HG treatment decreased cell viability and glutathione (GSH) levels and increased apoptosis, lipid reactive oxygen species (ROS), glutathione disulfide (GSSG), malondialdehyde (MDA), oxidative stress, and Fe2+ levels in Müller cells (p < 0.01). HG treatment also upregulated GAS1, Keap1, and total Nrf2 expressions while downregulating nuclear Nrf2 in Müller cells (p < 0.001). GAS1 downregulation enhanced cell viability, GSH levels, and nuclear Nrf2 expression while reducing the levels of apoptosis, lipid ROS, GSSG, MDA, Fe2+, Keap1, and total Nrf2 in HG-treated Müller cells (p < 0.001), whereas GAS1 overexpression had the opposite effects. Additionally, Nrf2 silencing reversed the impact of GAS1 overexpression in HG-treated Müller cells (p < 0.05).
GAS1 inhibits Keap1/Nrf2 signaling transduction in activating ferroptosis in retinal Müller cells; thus, this study can aid in setting the stage for novel treatment methods against DR.
Keywords
- diabetes retinopathy
- GAS1
- Keap1/Nrf2
- ferroptosis
- Müller cells
Diabetes retinopathy (DR), a vision-impairing ocular disease, stands as a leading contributor of blindness in diabetes patients [1, 2]. The onset of DR is attributed to chronic hyperglycemia that inflicts damage on the retinal capillaries, hindering light perception and signal transmission [1]. Working-age population constitutes the most sufferers of DR, with projections estimating 191 million DR cases by 2023 [3]. Notwithstanding the improvements in new treatment and metabolic control of diabetes patients, effective early screening and diagnostic techniques are still urgently needed [4, 5, 6]. Therefore, in-depth research on the pathogenesis of DR and exploration of potential biomarkers is of great significance to preventing, screening, and treating DR.
Ferroptosis, a newly characterized form of cell death under induction of iron-dependent lipid peroxidation, is distinguished from other forms of cell death, incorporating necrosis, pyroptosis, apoptosis, and autophagy [7, 8]. Ferroptosis has demonstrated effects on the pathophysiology and pathogenesis of diabetes and its complications containing DR [9]. Ferroptosis inhibitor prevents the early DR and sustains normal visual function [10], and repressing ferroptosis mitigates the lipid peroxidation and oxidative stress injury of DR [11], implying the potential of targeting ferroptosis in treating DR. Growth arrest-specific 1 (GAS1), a multifunctional protein initially pertinent to cell cycle arrest, is also an active regulator of cell proliferation during development [12]. GAS1 induces cell death by an intrinsic apoptotic pathway [13]. Besides, GAS1 is a ferroptosis-related gene [14], and its upregulation aggravates acute liver injury through enhancing ferroptosis-mediated lipid peroxides accumulation [15]. However, the role of GAS1 in DR has been poorly researched. Herein, through transcriptome sequencing, GAS1 was discovered to be highly expressed in high glucose (HG)-treated Müller cells, prompting our investigation into the role of GAS1 in DR.
Previous research proved that GAS1 obstructs the transduction of the PI3K/AKT pathway [16, 17] which interacts with the Kelch-like ECH-associated protein 1 (Keap1)/nuclear factor erythroid 2-related factor (Nrf2) signaling [18]. Nrf2 is a key regulator of the antioxidant response, whose low level is primarily maintained by Keap1-mediated proteasomal degradation under unstressed conditions [19]. Under oxidative stress conditions, Nrf2 protein is stabilized and initiates a multistep pathway of activation that includes nuclear translocation [20]. Nrf2 dissociates from Keap1 and translocates into the nucleus, where it binds to antioxidant response elements, thereby upregulating expressions of downstream antioxidant genes [21]. Moreover, there are evidences that the Keap1/Nrf2 signal prevents the progression of ferroptosis [19, 22]. The Keap1/Nrf2 signal activation may protect the retina and alleviate oxidative stress damage during diabetes [23]. Nonetheless, the influence of Keap1/Nrf2 pathway on DR and the participation of GAS1 need further verification.
Accordingly, the current study delved into the effect and potential mechanism based on GAS1-mediated ferroptosis on DR, aiming to provide novel foundations and unravel new biomarkers for DR.
Rat retinal Müller cells (CP-R117, Procell, Wuhan, China) were cultured in specific DMEM (CM-R117, Procell, Wuhan, China). For high glucose (HG) treatment, the Müller cells were cultured (24 h) in a complete culture medium with 25 mM glucose (G8150, Solarbio, Beijing, China) [24]. After HG/normal glucose (NG) induction, the rat retinal Müller cells were collected and used for transcriptome sequencing. All cell lines were validated by Glutamine Synthetase (GS) immunofluorescence and tested negative for mycoplasma. Cells were all cultured in a humidified incubator (37 °C, 5% CO2).
Transcriptome sequencing was performed by the Novogene Company (Novogene, Beijing, China). Sequencing libraries were built using NEBNext® Ultra™ Directional RNA Library Prep Kit (NEB, Ipswich, MA, USA). Briefly, the mRNA was fragmented and purified with poly-T oligo-attached magnetic beads (Beckman Coulter, Brea, CA, USA). Then, first-strand and second-strand cDNAs were synthesized. Polymerase chain reaction (PCR) was performed using universal PCR primers and Index (x) Primer. Finally, the Library preparations were sequenced on an Illumina Hiseq 2000 platform (https://support.illumina.com/sequencing/sequencing_instruments/hiseq_2000/documentation.html). Differential expression analysis, Gene Ontology (GO) enrichment analysis (https://geneontology.org/) and Kyoto Encyclopedia of Genes and Genomes (KEGG) enrichment analysis (https://www.kegg.jp/) were conducted.
Short hairpin RNA (shRNA) for GAS1 (shGAS1; target sequence: 5′-ACGACTACTACGACGAAGAATAT-3′)/negative control (shNC; target sequence: 5′-AATTCTCCGAACGTGTCACGT-3′), small interference RNA (siRNA) for Nrf2 (siNrf2; si1 target sequence: 5′-CAGCATGATGGACTTGGAATTGC-3′; si2 target sequence: 5′-GGGGTAAGTCGAGAAGTGTTTGA-3′; si3 target sequence: 5′-GGCCTTTTTCGCTCAGTTACAAC-3′), and siNC (target sequence: 5′-TTCTCCGAACGTGTCACGT-3′) were obtained from VectorBuilder (Guangzhou, China). Overexpression plasmids for GAS1 and NC plasmids were synthesized by Sino Biological, Inc. Supplementary Materia exhibits coding sequence (CDS) of GAS1. The shRNA, siRNA, or plasmids were transfected (48 h) into Müller cells with 80% density in 6-well plates with transfection reagent (L3000008, Bluefbio, Shanghai, China), followed by cell collection.
Total RNA from Müller cells (a RNA isolation kit; R0017M, Beyotime,
Shanghai, China) was detected using the UV spectrophotometer (NanoDrop, Thermo,
Waltham, MA, USA) and synthesized into cDNA using First-strand cDNA synthesis kit
(D7168M, Beyotime, Shanghai, China), followed by mixing with SYBR green (ALH185,
Baiaolaibo, Beijing, China) and primers of a relative gene. The gene expressions
were examined by a QuantStudio 6 System (Applied Biosystems, Waltham, MA, USA).
Primers’ information was as follows: GAS1 forward (F):
5′-GACCCCGTTTGCCTGTTTTC-3′, reverse (R):
5′-CAGTGCTCCCGATCATCTCC-3′; Nrf2 F:
5′-TCACACGAGATGAGCTTAGGGCAA-3′, R:
5′-TACAGTTCTGGGCGGCGACTTTAT-3′;
Transfected/HG-triggered Müller cells (5
The Annexin V-FITC/propidium iodide (PI) kit (40302ES60, YEASEN, Shanghai, China) was used in this assay. Briefly, transfected/HG-triggered Müller cells were suspended in 100 µL binding buffer, and then incubated with 5 µL Annexin V-FITC and 10 µL PI staining buffer (40302ES60, YEASEN, Shanghai, China) (20 min). Following cell incubation with 400 µL binding buffer, cell apoptosis signal was examined using a flow cytometer (Attune NxT, Thermo, Waltham, MA, USA).
Post culture of transfected/HG-exposed Müller cells with BODIPY 581/591 C11 (S0043S, Beyotime, Shanghai, China) (20 min, 37 °C) and phosphate buffered saline (PBS) (C0221A, Beyotime, Shanghai, China) washing, lipid ROS levels were assessed using fluorescence microplate reader (GloMax® Discover Microplate Reader, Promega, Madison, WI, USA) (excitation: 581 nm; emission: 591 nm).
GSH and GSSG levels in transfected/HG-exposed Müller cells were evaluated using a total glutathione/oxidized glutathione assay kit (A061-1-2, Nanjing Jiancheng Bioengineering Institute, Nanjing, China). Concretely, the collected Müller cells were ground to pieces, and 10 µL cell samples were mixed with 100 µL reagent 1 and 10 µL reagent 2 (2 min), as well as with 50 µL reagent 3. Then, the OD value was evaluated using a microplate reader (405 nm wavelength) for the calculation of total GSH. Meanwhile, 100 µL cell samples were mixed with 2 µL reagent 5 and 5 µL reagent 6, after which 10 µL mixed solution was further blended with 100 µL reagent 1 and 10 µL reagent 2 (2 min), followed by addition of 50 µL reagent 3. Next, the OD value was evaluated using a microplate reader (405 nm wavelength) for the calculation of GSSG level. Finally, the level of GSH was further calculated as the formula provided by the manufacturer’s manual.
MDA levels in transfected/HG-exposed Müller cells were evaluated employing
an MDA assay kit (ab118970, Abcam, Cambridge, UK). In brief, the collected
Müller cells were mixed with 300 µL MDA lysis buffer
and 3 µL BHT stock/BHT, and then underwent centrifugation (13000
Fe2+ levels in transfected/HG-exposed Müller cells were evaluated using an Iron assay kit (ab83366, Abcam Cambridge, UK). Briefly, the homogenate of Müller cells (50 µL) experienced incubation with 5 µL iron reducer and 5 µL assay buffer (30 min, 37 °C), followed by culture with 100 µL iron probe (1 h, 37 °C). The OD value was read by a microplate reader (593 nm) for Fe2+ level calculation.
Quantification of GST, HO-1, and NQO1 in transfected/HG-exposed Müller cells was performed employing GST (ab65326, Abcam, Cambridge, UK), HO-1 (ab279414, Abcam, Cambridge, UK), and NQO1 (ab184867, Abcam, Cambridge, UK) assay kits as per the manual.
Total protein in transfected/HG-exposed Müller cells was extracted by a RIPA
buffer (R0020, Solarbio, Beijing, China) containing a protease inhibitor cocktail
(GCPI0015, Vokai Biotechnology, Beijing, China) and PMSF (D16793, Vokai
Biotechnology, Beijing, China). The cell nuclear proteins were isolated using a
kit (P0027, Beyotime, Shanghai, China) and underwent quantification using a BCA
detection kit (KGP903, KeyGEN BioTECH, Nanjing, China). The proteins were
incubated with loading buffer (D16796, Vokai Biotechnology, Beijing, China) (5
min, 100 °C), further separated by SDS-PAGE gel (GCPE0017, Vokai Biotechnology,
Beijing, China), and transferred to PVDF membrane (YA1701, Solarbio, Beijing,
China). The membrane was then incubated with blocking buffer (P0023B, Beyotime,
Shanghai, China) overnight, primary antibody overnight (4 °C), and secondary
antibody (2 h). By means of ECL luminescent liquid (GCPW0121, Vokai
Biotechnology, Beijing, China), the protein bands were detected by a ChemiDoc
MP-specific system (Bio-Rad, Hercules, California, USA). The primary and
secondary (Beyotime, Shanghai, China) antibodies included Keap1
(60027-1-Ig, 1:4000, Proteintech, Wuhan, China), Nrf2 (20733, 1:1000, CST,
Boston, MA, USA), LaminB (66095-1-Ig, 1:20000, Proteintech, Wuhan, China), GAS1
(PA5-101615, 1:1000, Invitrogen, Waltham, MA, USA),
Data from two groups experienced dissection using independent-sample
t-test, and those from multiple groups were analyzed using one-way ANOVA
by Tukey’s post-hoc test using GraphPad 8.0 software (GraphPad Software, San
Diego, CA, USA). Measurement data were expressed as mean
HG treatment resulted in decreased viability of Müller cells (p
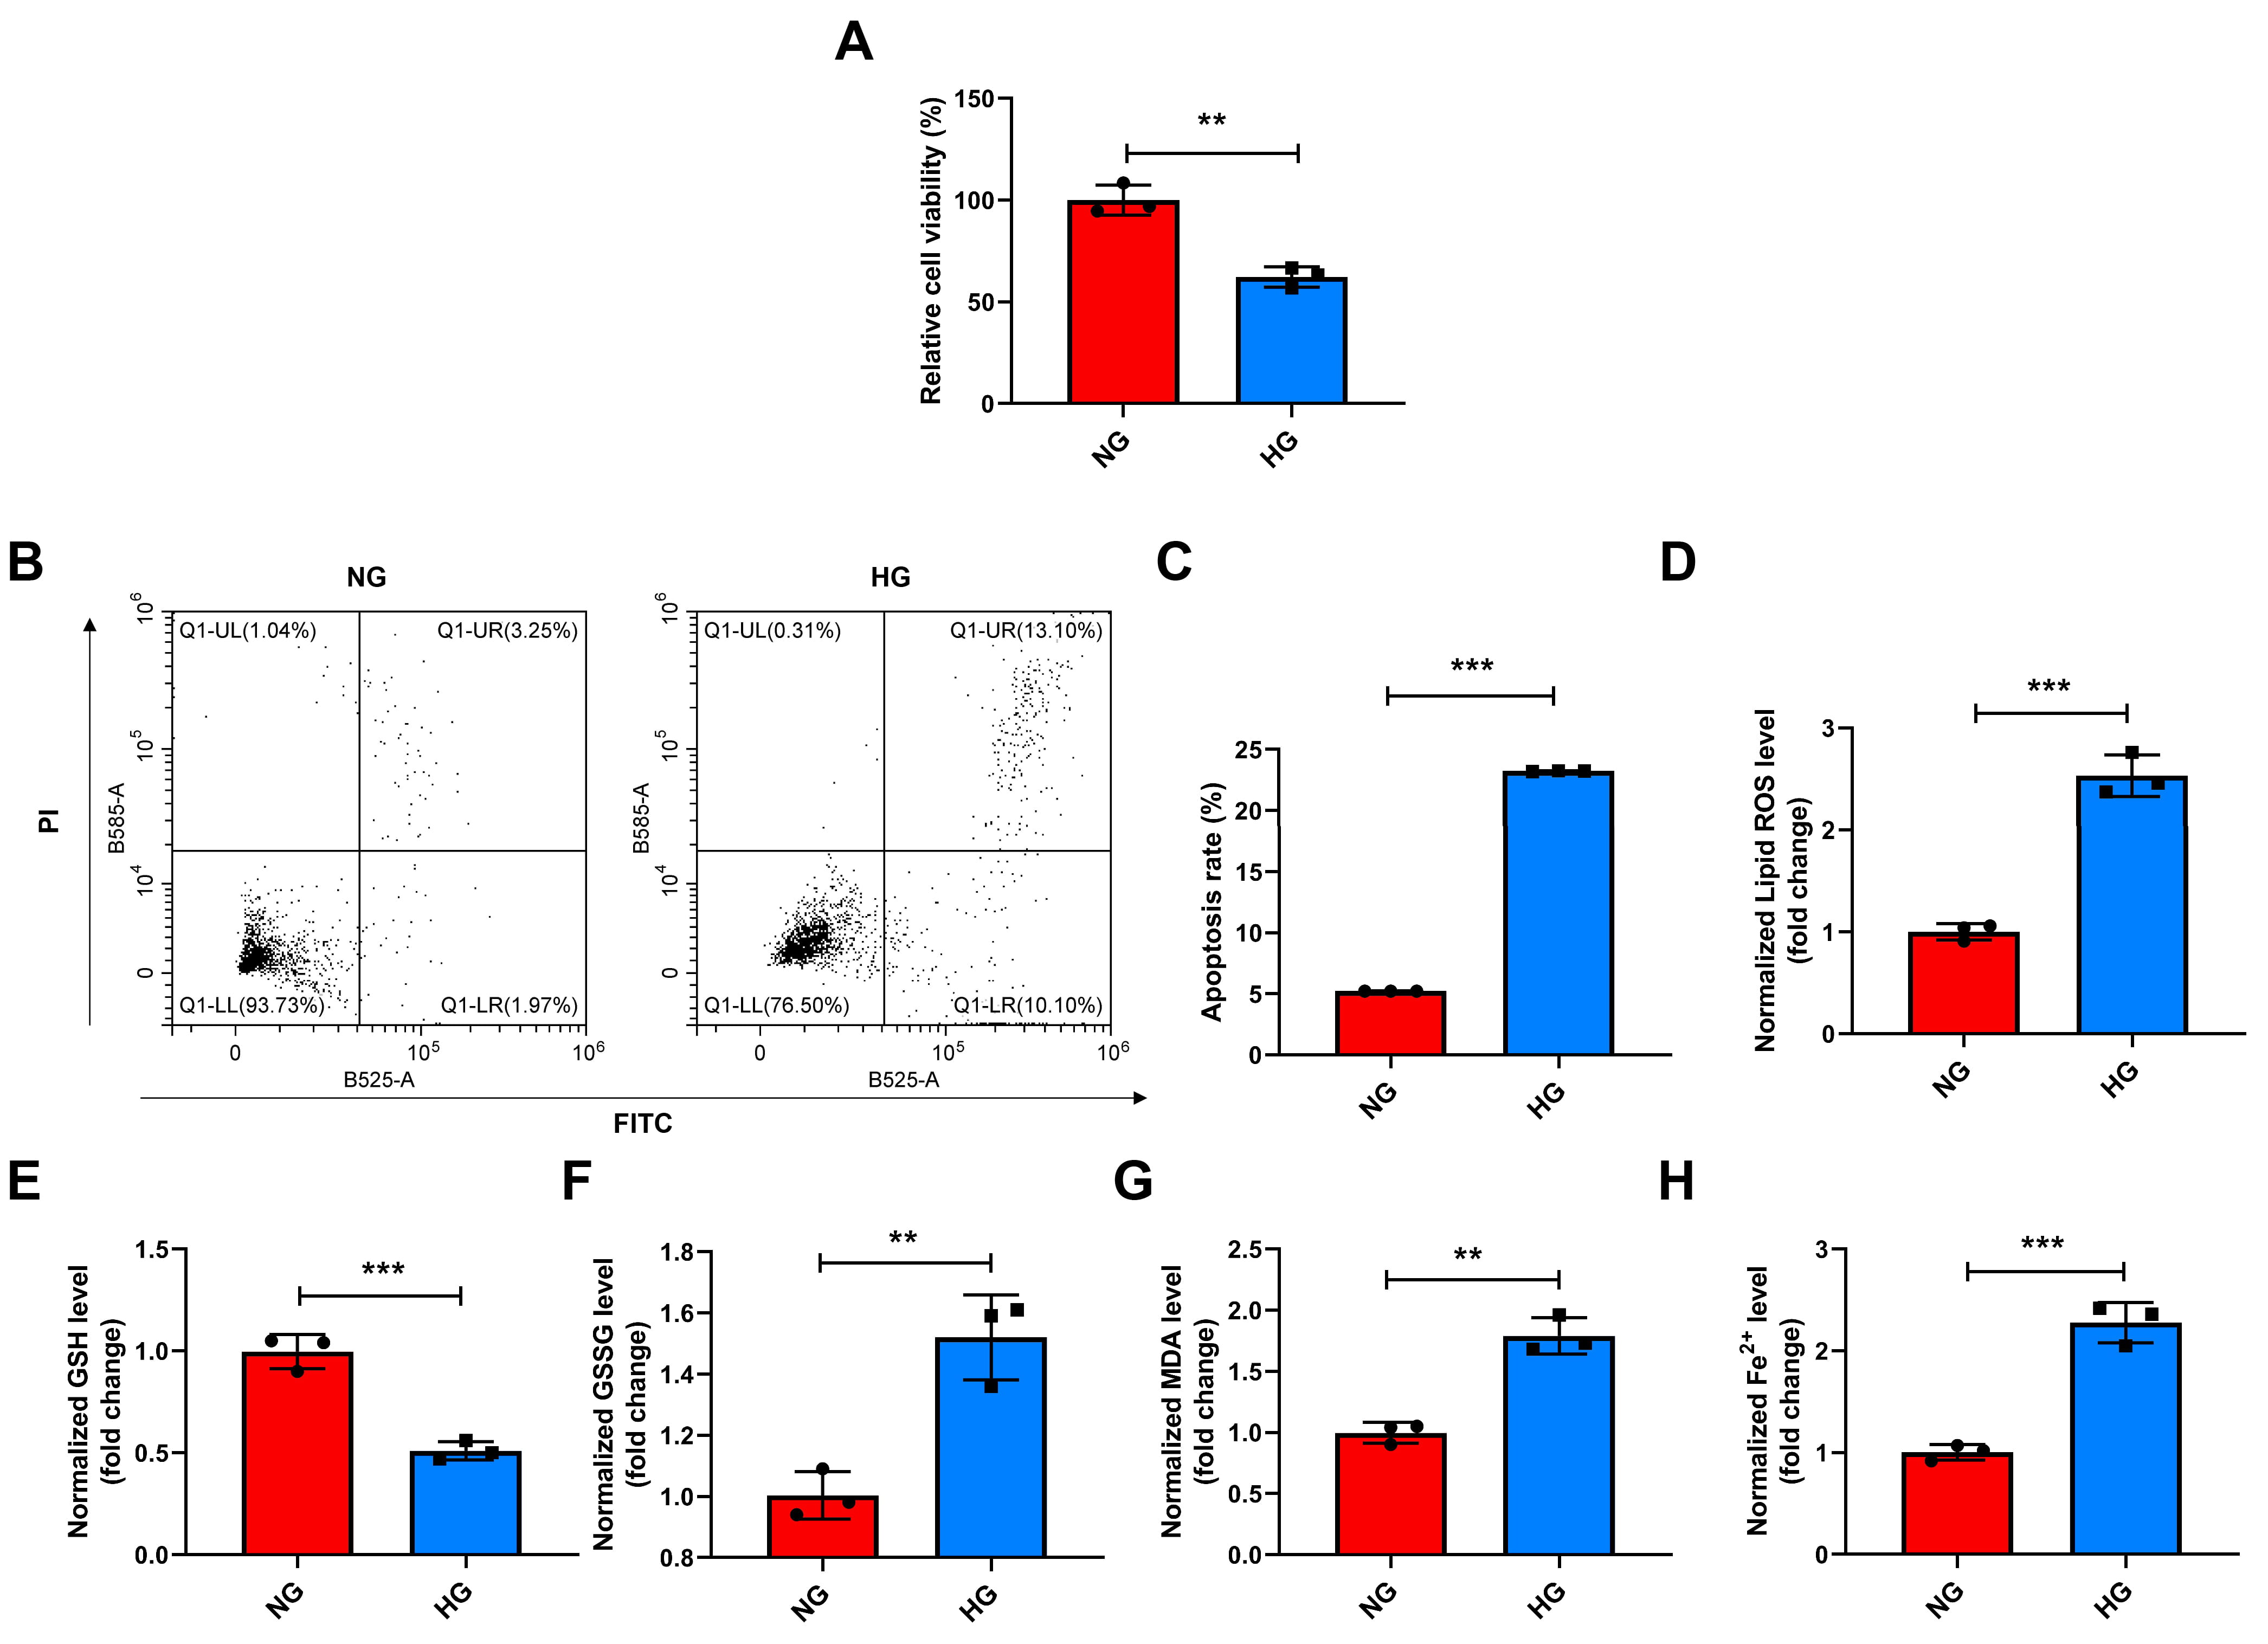 Fig. 1.
HG treatment decreased the viability and increased apoptosis,
lipid peroxidation, and Fe2+levels in Müller cells. (A–H) The
viability (CCK-8) assay (A), the apoptosis (flow cytometry) (B,C), and the
levels of lipid ROS, GSH, GSSG, MDA, and Fe2+ (commercial reagent kit)
(D–H) in HG-exposed (24 h) Müller cells. **p
In HG-exposed Müller cells, transcriptome sequencing data unveiled many
differentially expressed genes (DEGs) (Fig. 2A,B), with 34 downregulated genes and 339 upregulated genes in line with the
volcano plot. GAS1 level was lower in NG-treated Müller cells than HG-treated
Müller cells (Fig. 2B). GO analysis provided insights into the biological
process (BP), molecular function (MF), and cell component (CC) of DEG’s
enrichment (Fig. 3A). Meanwhile, KEGG’s enrichment results show that
Glycosphingolipid Biosynthesis-globo and isoglobo Series, Motor proteins and
selenocompound metabolism is the top three metabolic channels of the enrichment
(Fig. 3B). Furthermore, GAS1 expression in HG-treated Müller cells
was discovered to be upregulated (p
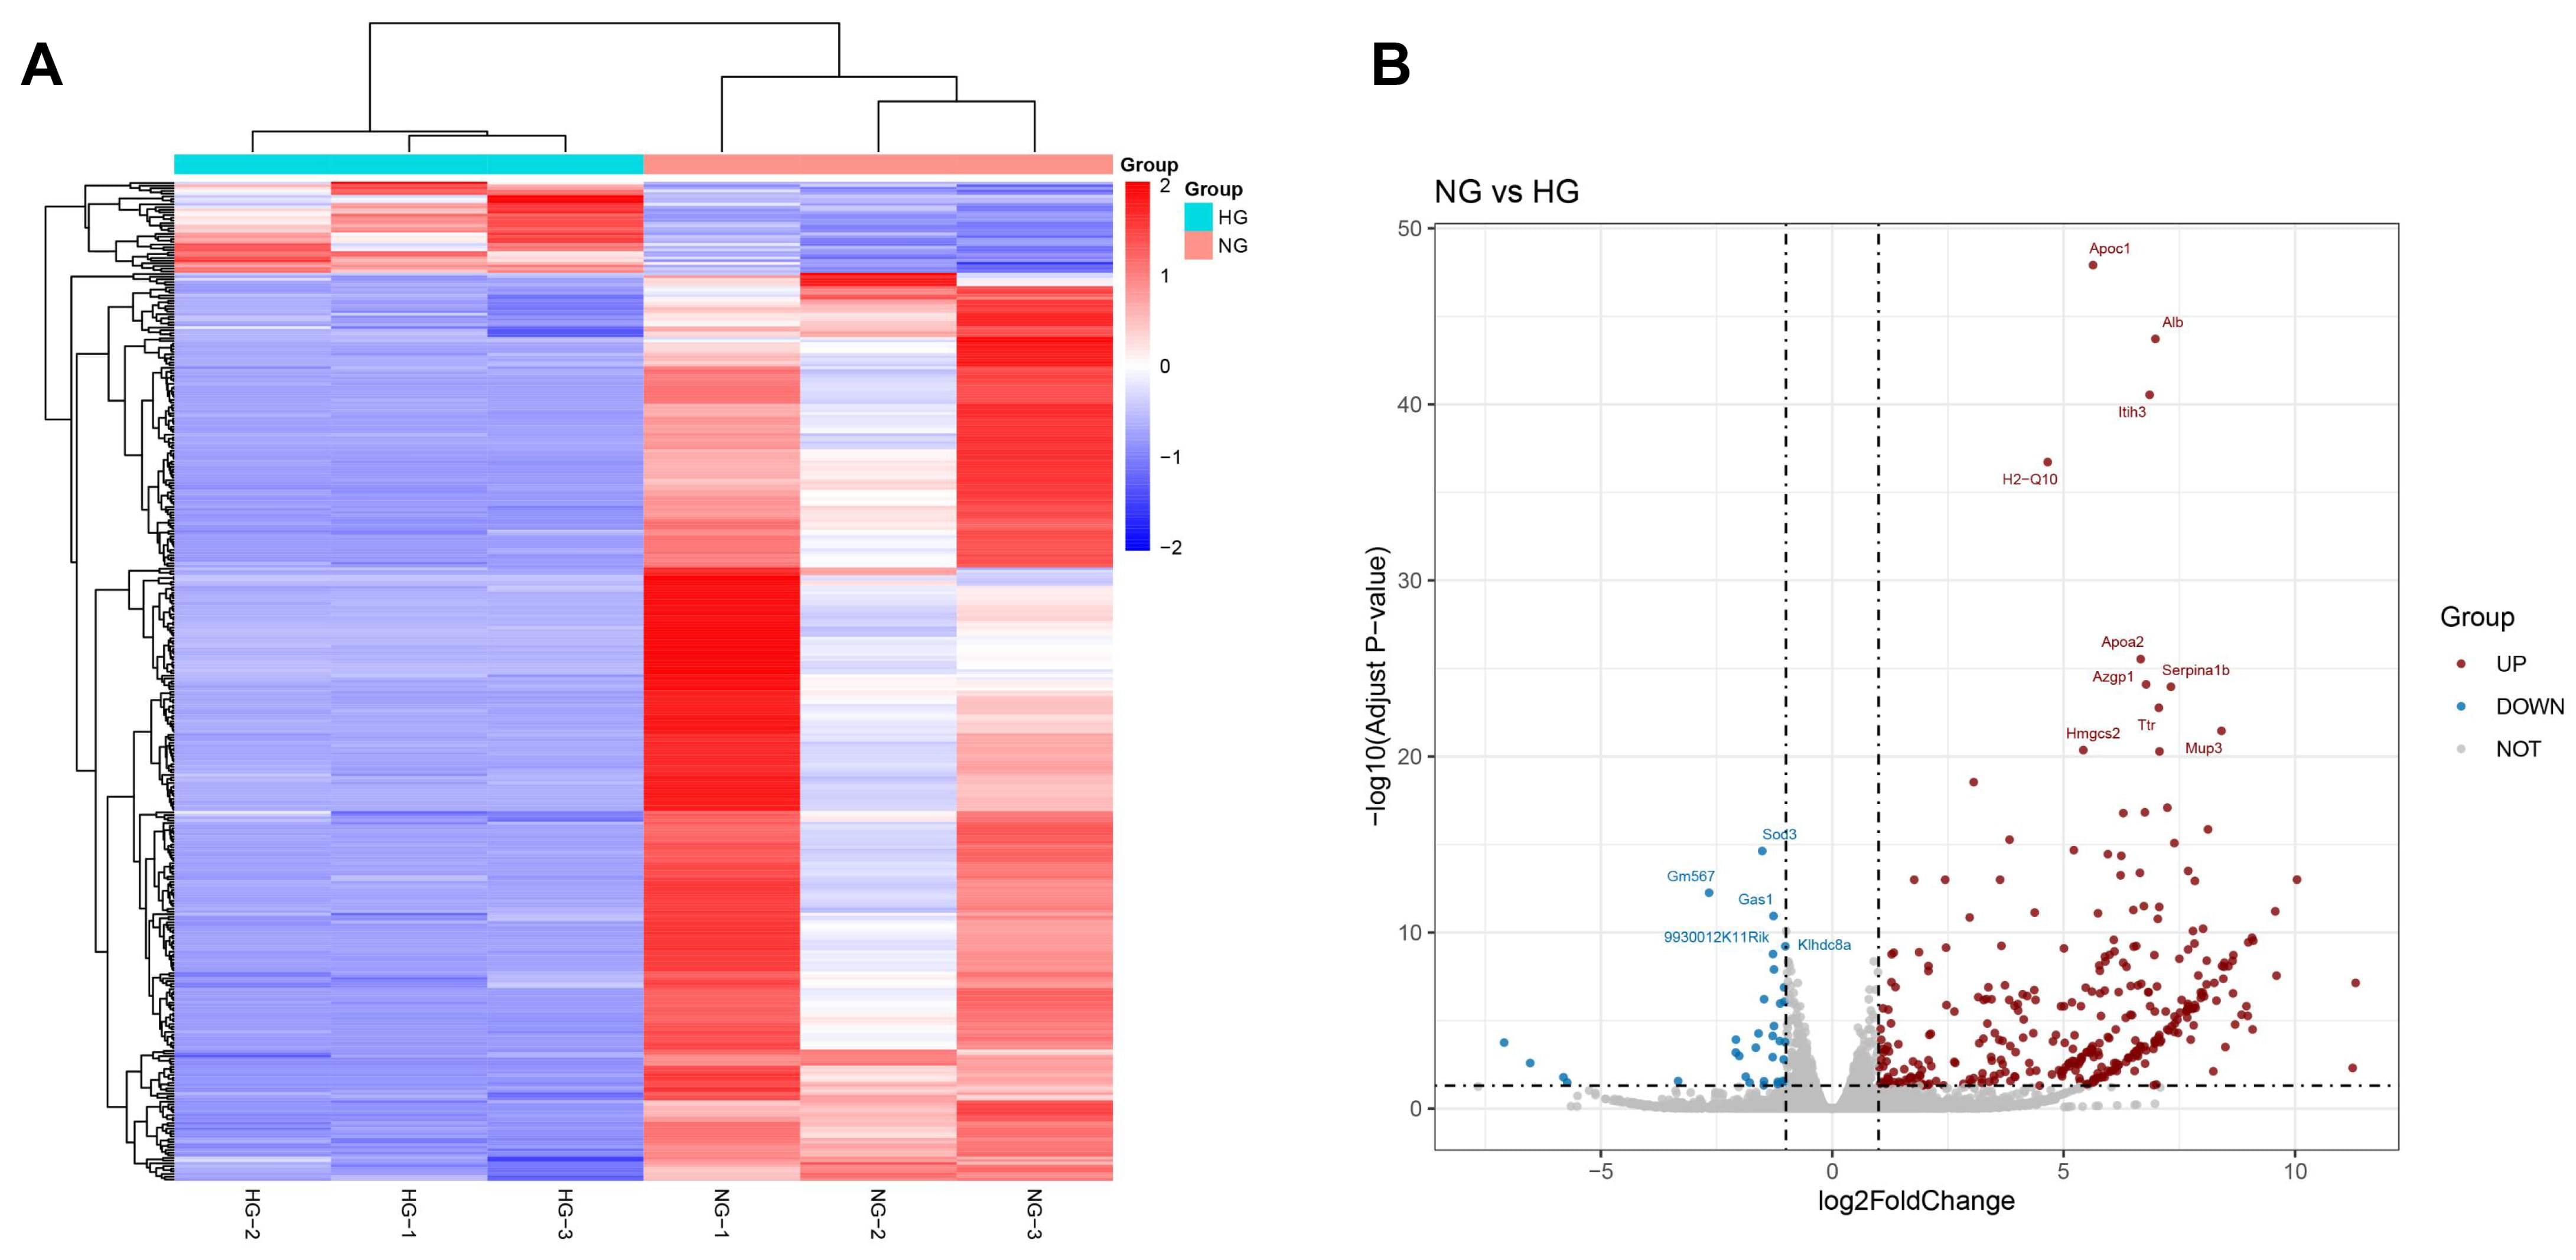 Fig. 2.
GAS1 was differentially expressed in HG-treated Müller cells. (A,B) Heat map (A) and volcano map (B) of NG/HG-treated (24 h) DEGs in Müller cells (transcriptome sequencing), showing decreased GAS1 expression in the NG group relative to HG group. NG, normal glucose; HG, high glucose; GAS1, growth arrest-specific 1; DEGs, differentially expressed genes.
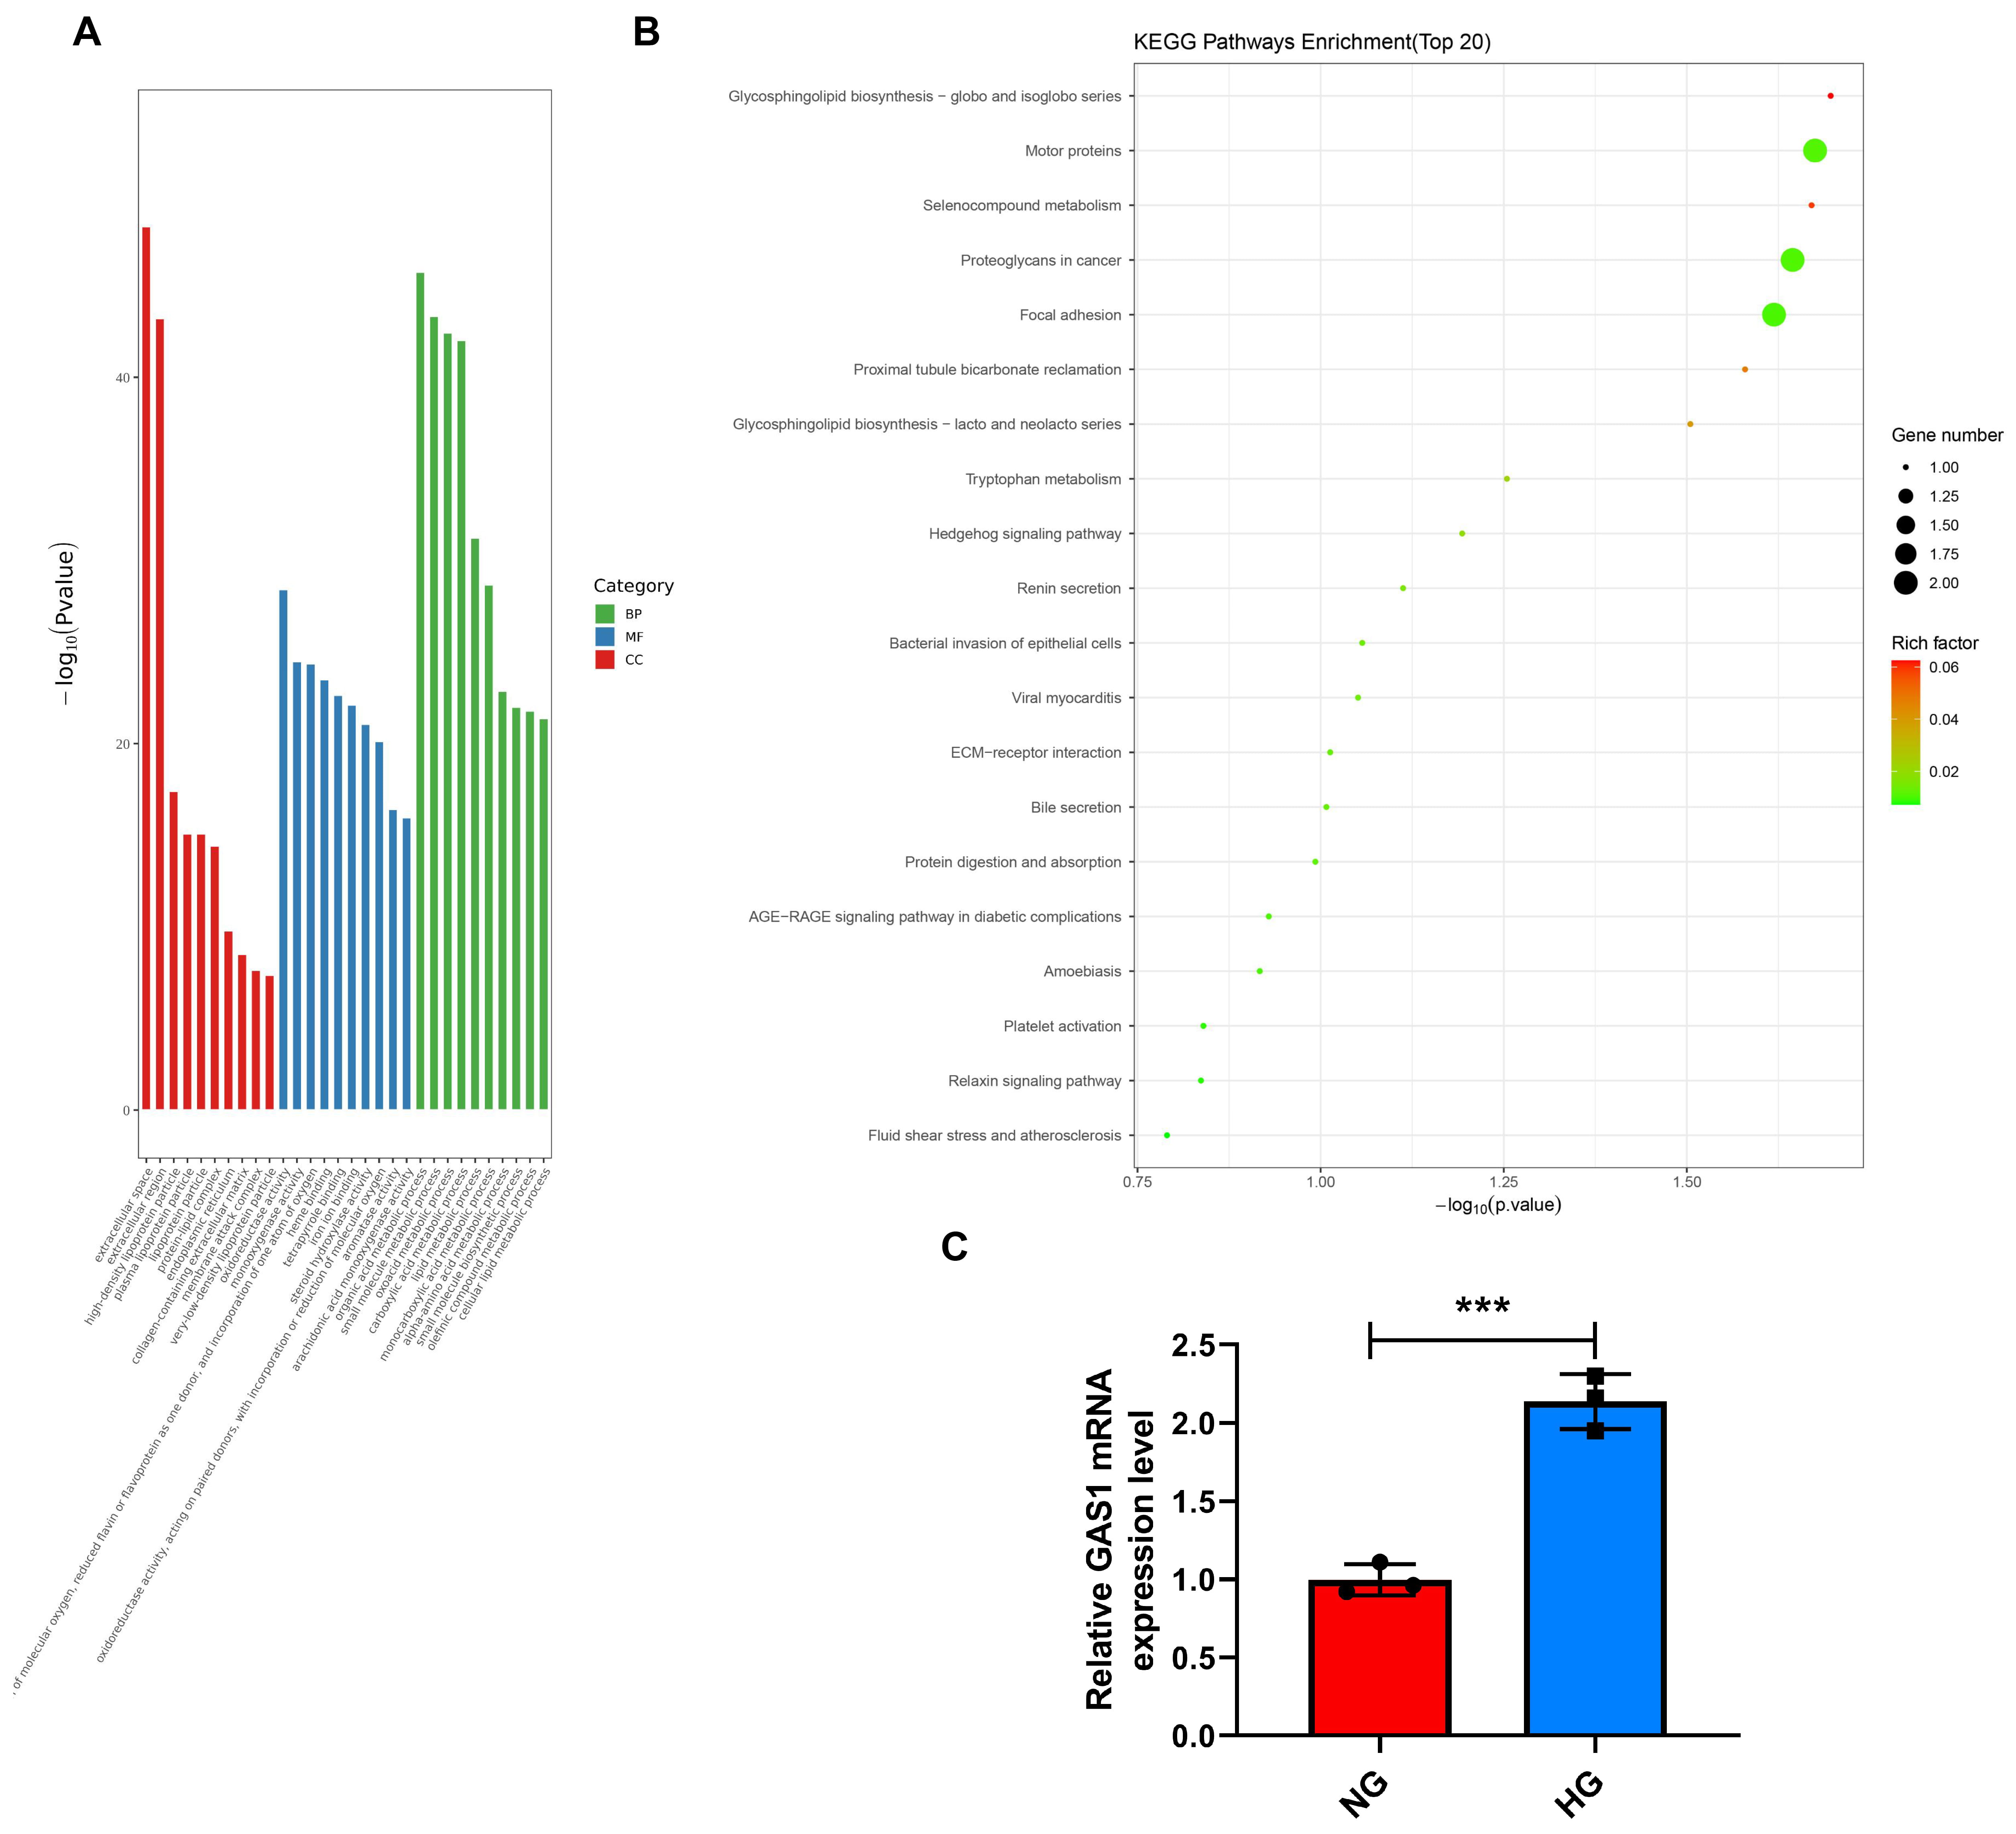 Fig. 3.
GAS1 was upregulated in HG-treated Müller cells. (A,B) BP,
MF, and CC of enrichment between GO and KEGG of DEGs (A) and the pathways
enrichment between GO and KEGG of DEGs (B) (GO and KEGG analysis). (C)
GAS1 expression in HG-exposed (24 h) Müller cells (quantitative
real-time PCR). ***p
To evaluate how GAS1 impacted HG-treated Müller cells, shGAS1 was
transfected into Müller cells. Fig. 4A–C revealed increased GAS1 expression
by HG treatment (p
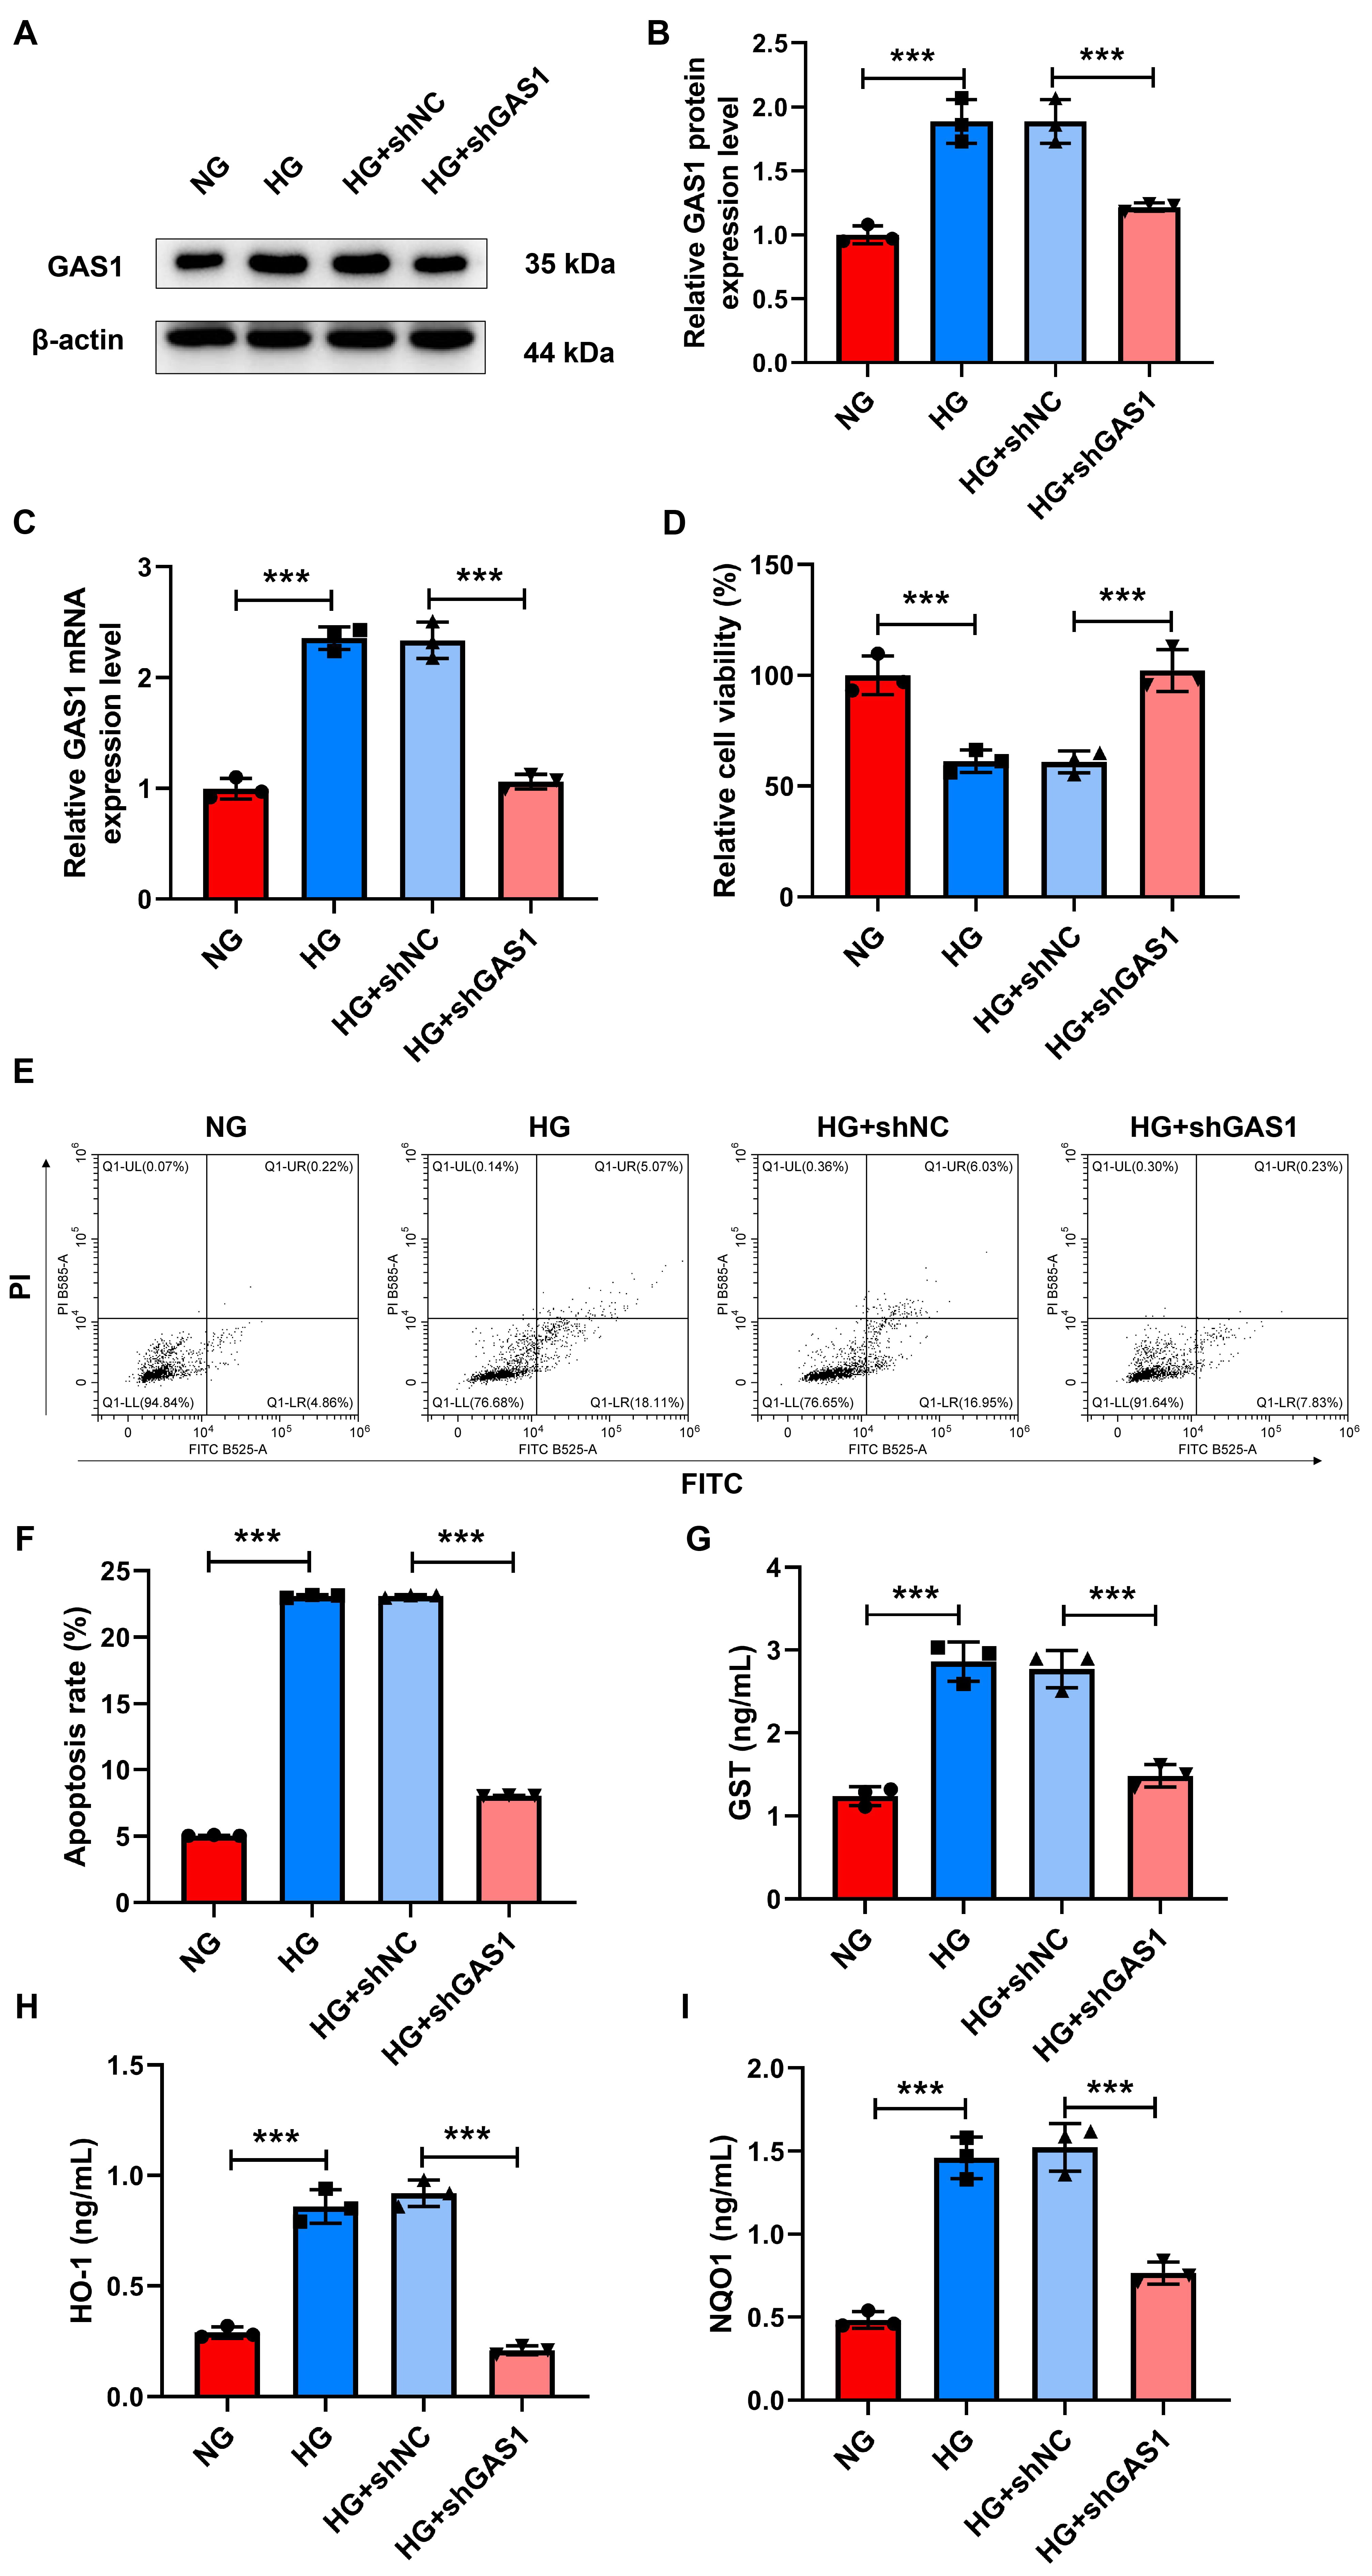 Fig. 4.
GAS1 downregulation promoted the viability and inhibited the
apoptosis and oxidative stress of HG-treated Müller cells. (A–I) GAS1
expression (western blotting and quantitative real-time PCR) (A–C), viability
(CCK-8 assay) (D), apoptosis (flow cytometry) (E,F), and the concentrations of
GST, HO-1, and NQO1 (commercial reagent kit) (G–I) in shGAS1-transfected and
HG-treated Müller cells. ***p
Then, examination of lipid peroxidation (Fig. 5A–D) indicated the relative
levels of lipid ROS, GSSG, and MDA were increased (p
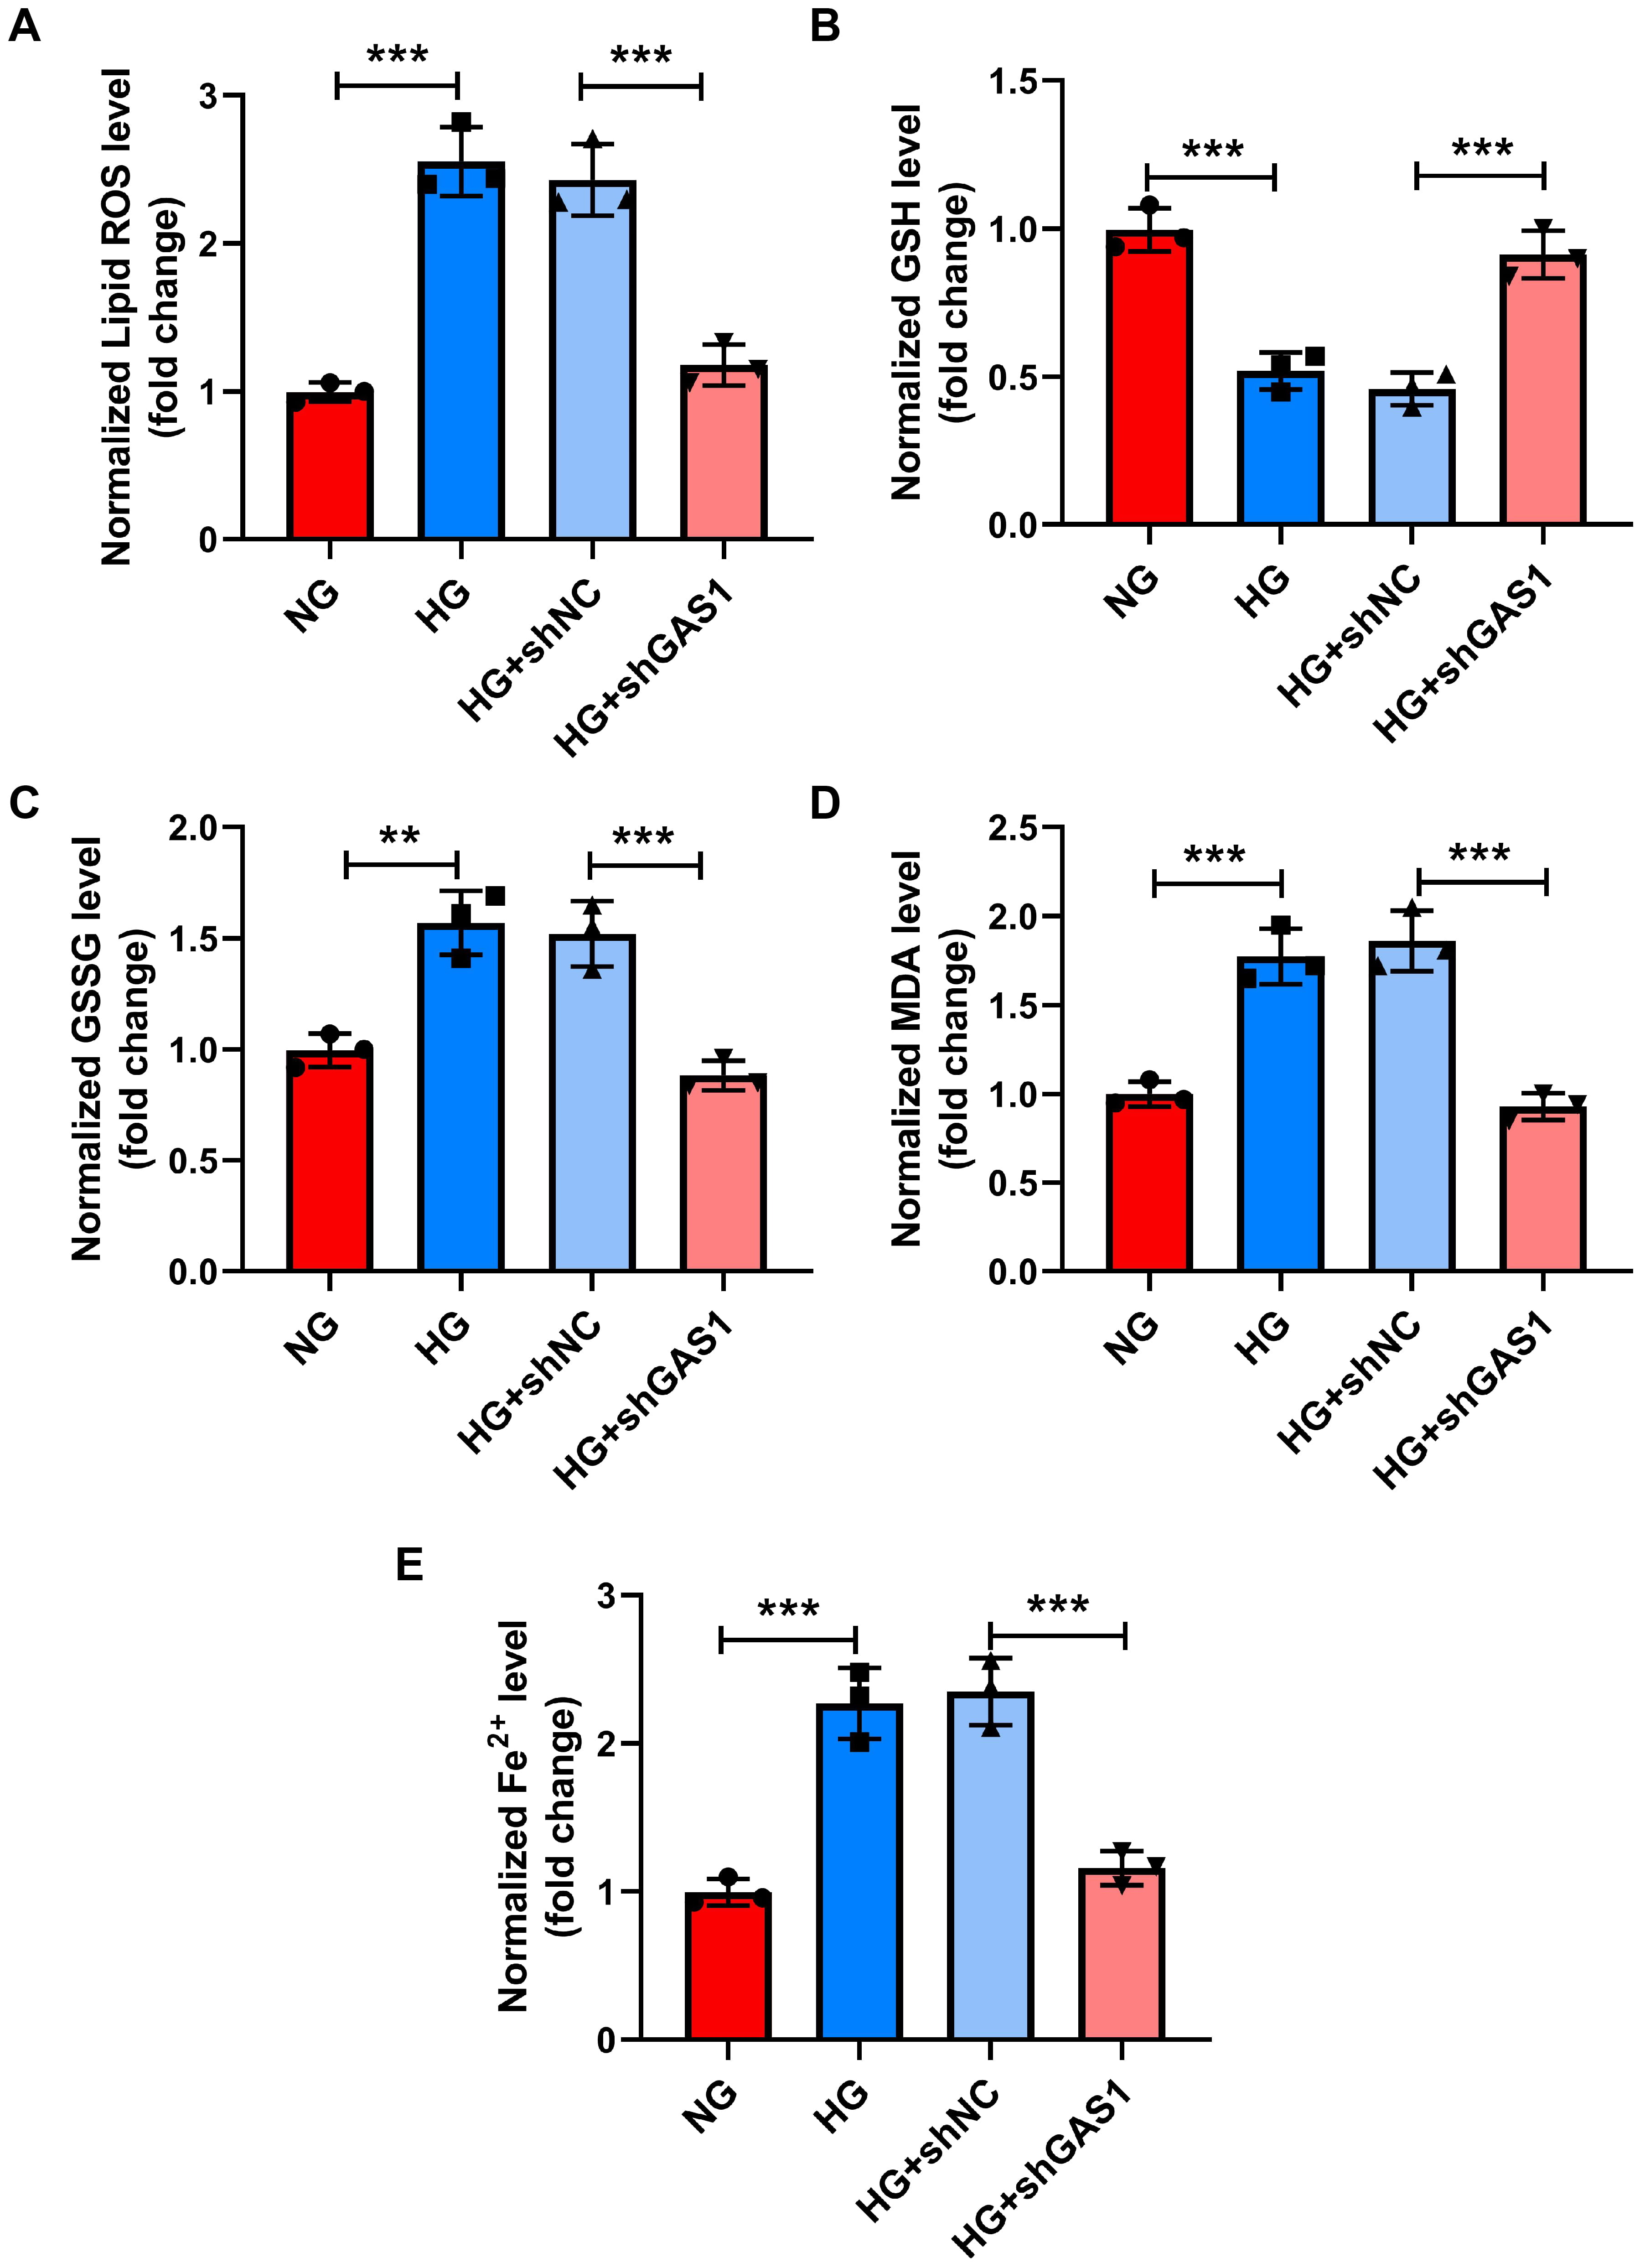 Fig. 5.
GAS1 downregulation reduced the lipid peroxidation and Fe2+ levels of HG-treated Müller cells. (A–E) Levels of lipid ROS, GSH, GSSG,
MDA, and Fe2+ in shGAS1-transfected and HG-treated Müller cells
(commercial reagent kit). **p
Mechanistically, Keap1/Nrf2 signaling transduction was evaluated (Fig. 6A–D),
revealing upregulated Keap1 and total Nrf2 as well as downregulated nuclear Nrf2
in HG-treated Müller cells (p
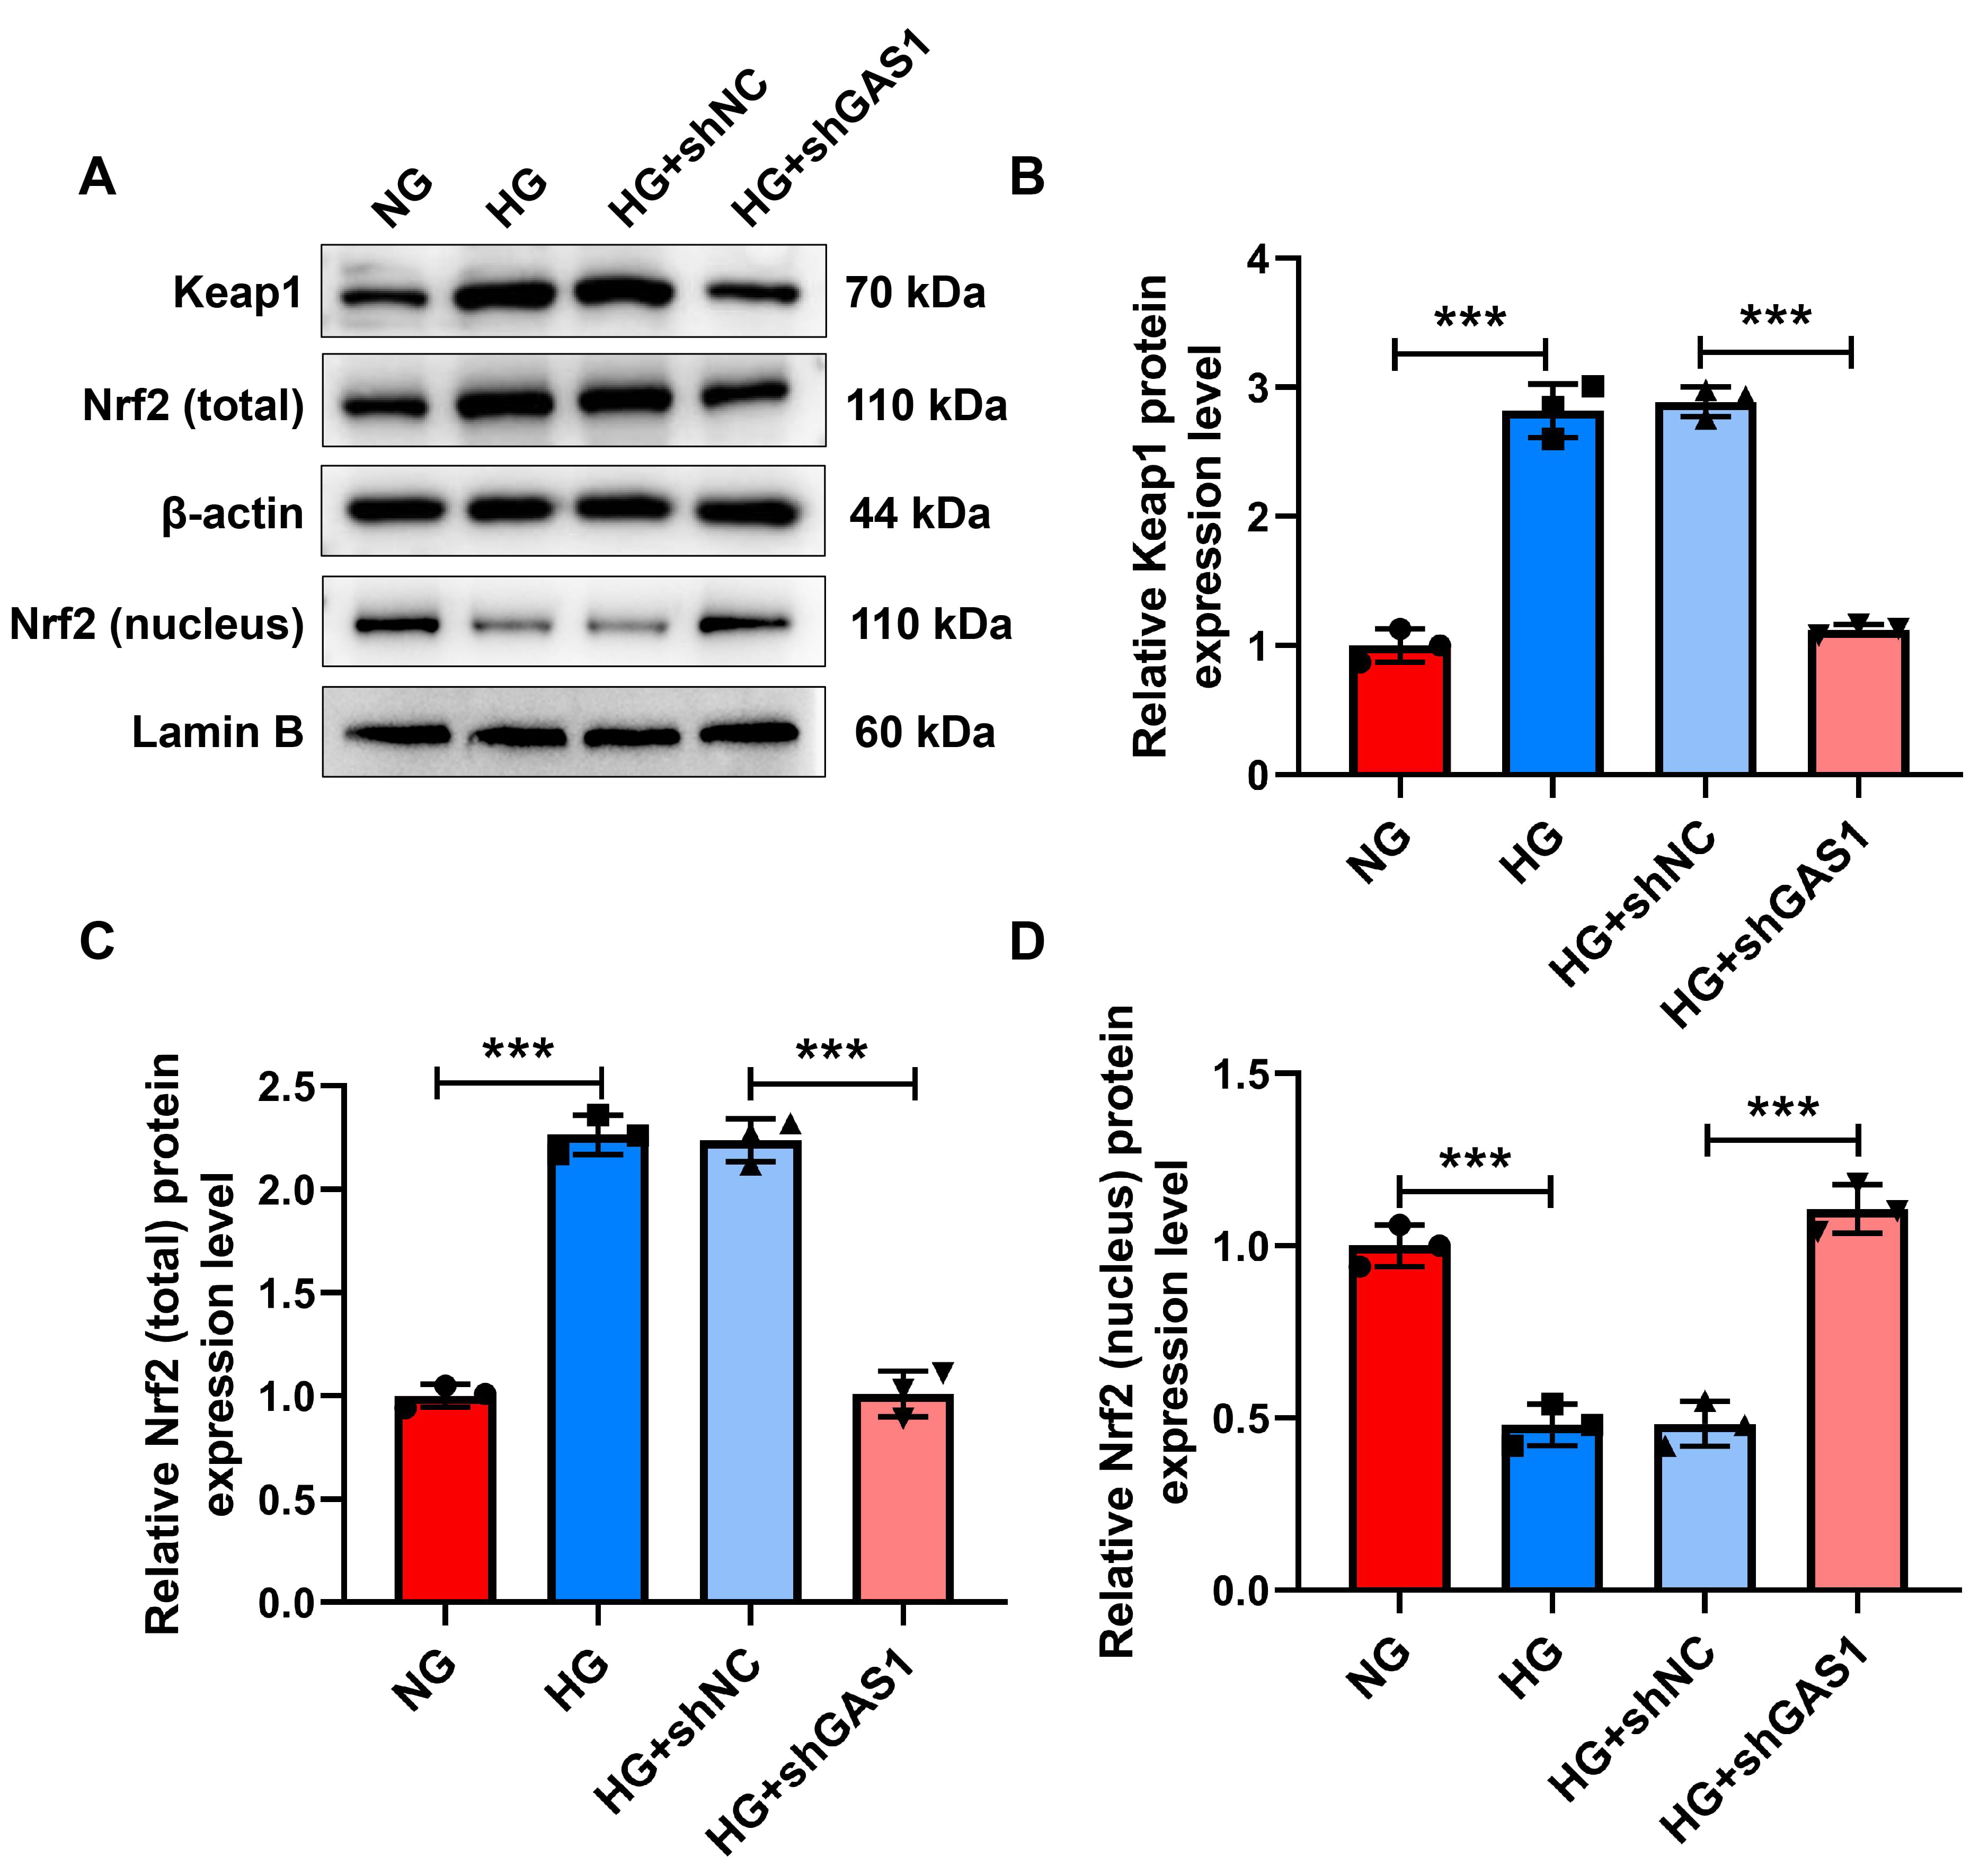 Fig. 6.
GAS1 downregulation promoted the Keap1/Nrf2 signal in HG-treated
Müller cells. (A–D) Expressions of Keap1, total Nrf2, and nuclear Nrf2 in
shGAS1-transfected and HG-treated Müller cells (Western blot).
***p
To confirm that GAS1 impacted HG-treated Müller cells through regulating the
Keap1/Nrf2 signal, Nrf2 was silenced in Müller cells (p
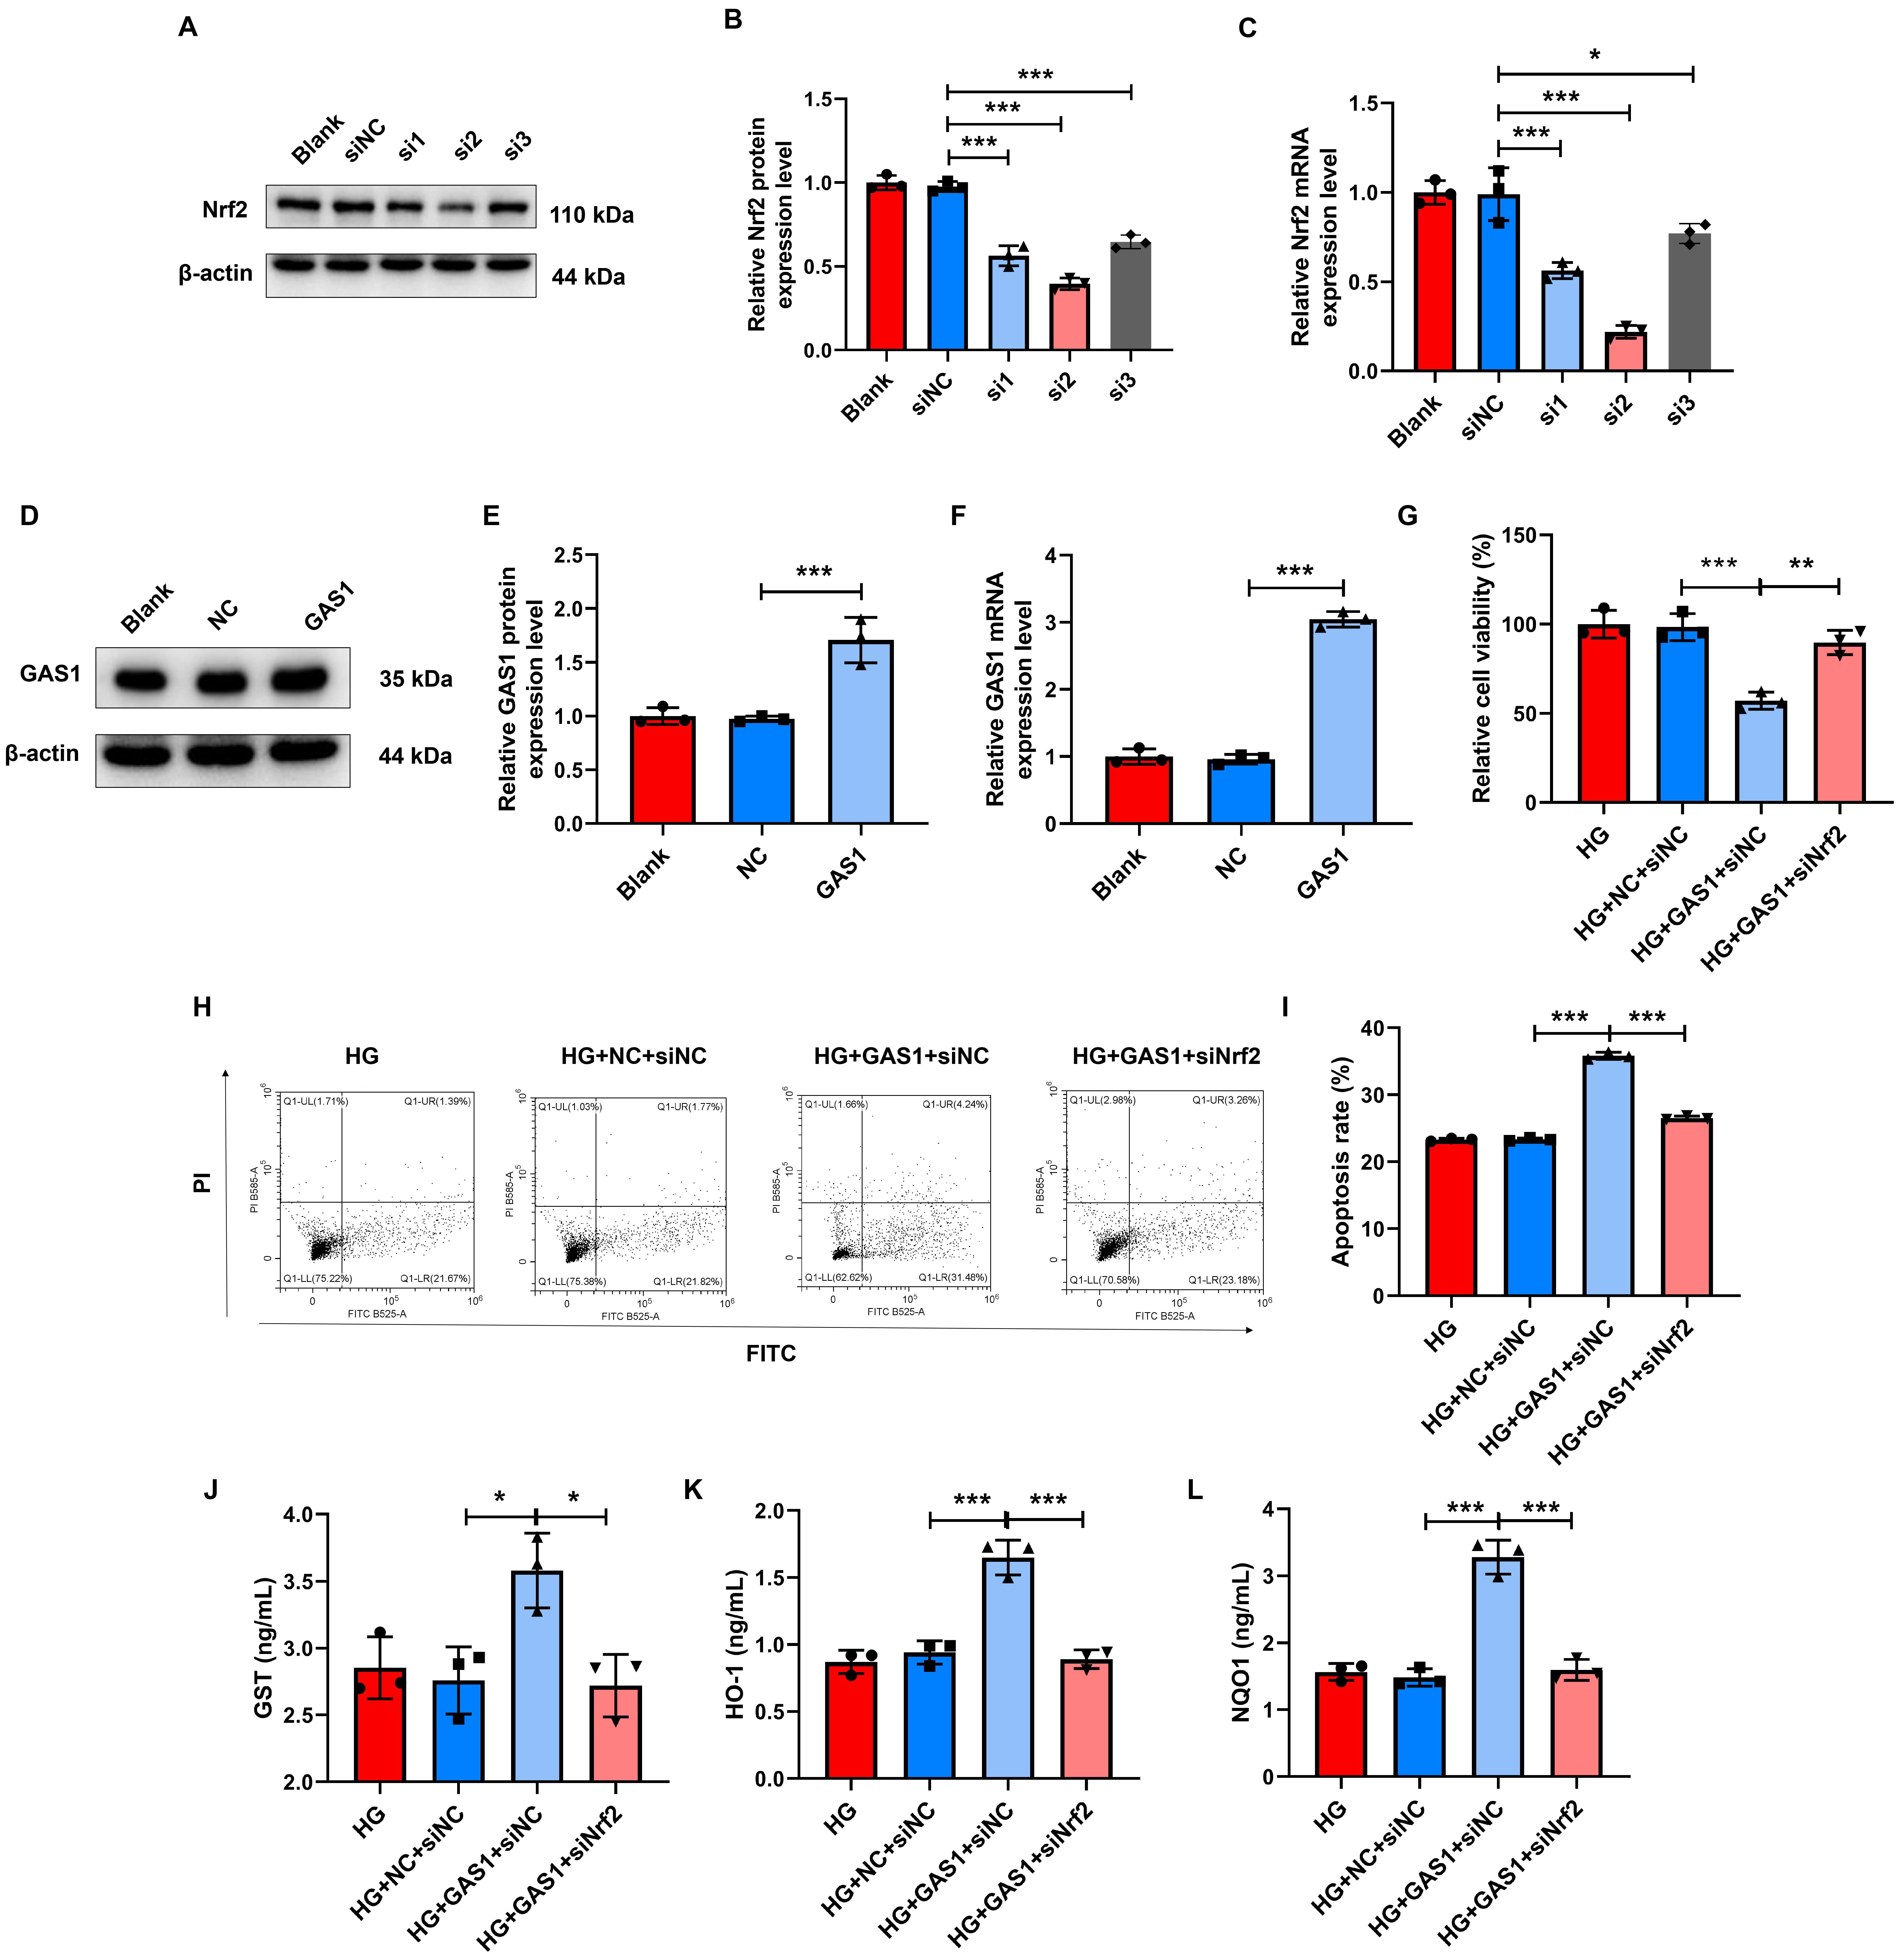 Fig. 7.
Nrf2 downregulation reversed the role of GAS1 in the viability,
apoptosis, and oxidative stress of HG-treated Müller cells. (A–C) The
transfection efficiency of siRNA for Nrf2 and (D–F) GAS1 overexpression plasmids
(western blotting and quantitative real-time PCR). (G–L) Viability (CCK-8 assay)
(G), apoptosis (flow cytometry) (H–I), and the concentrations of GST, HO-1, and
NQO1 (commercial reagent kit) (J–L) in transfected and HG-exposed Müller
cells. *p
Changes in lipid peroxidation and Fe2+ levels in HG-treated Müller
cells were examined (Fig. 8A–D). GAS1 overexpression increased lipid ROS
production, GSSG level and MDA level (p
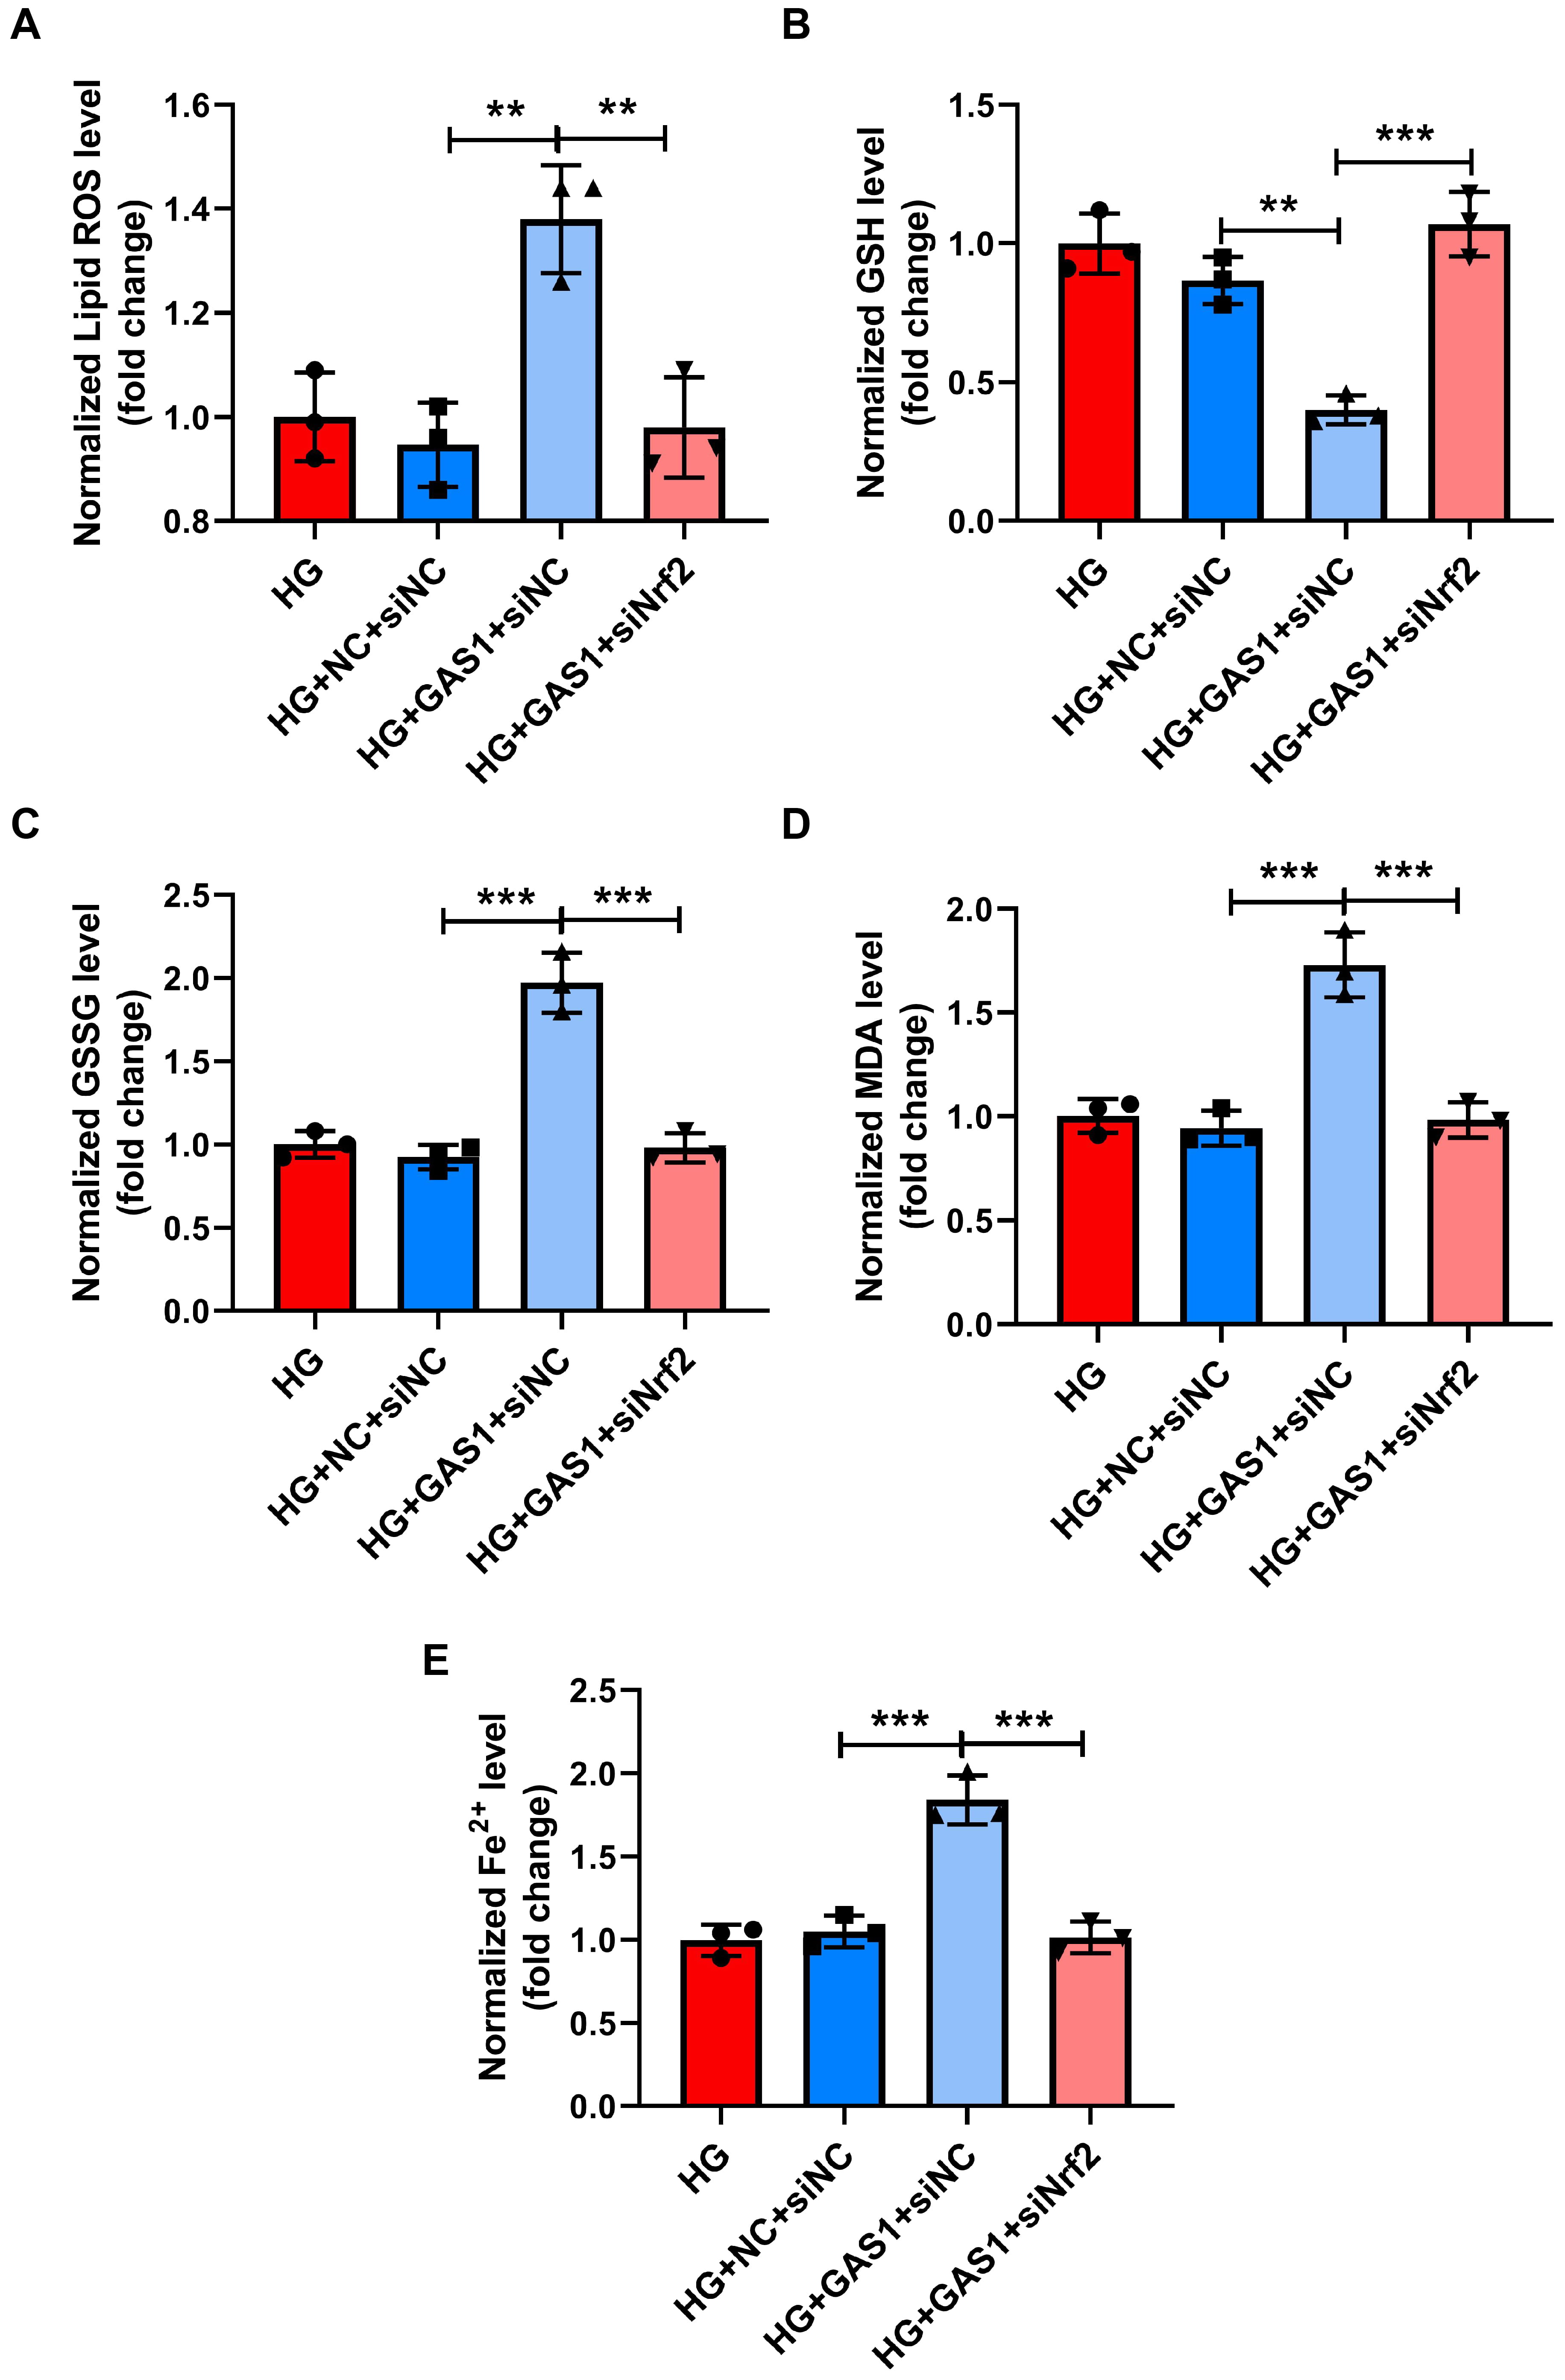 Fig. 8.
Nrf2 downregulation reversed the role of GAS1 in the lipid
peroxidation and Fe2+levels of HG-treated Müller cells. (A–E) Levels
of lipid ROS, GSH, GSSG, MDA, and Fe2+ in transfected and HG-exposed
Müller cells (commercial reagent kit). **p
Finally, Keap1/Nrf2 signaling transduction was evaluated (Fig. 9A–D). The
expressions of Keap1 and total Nrf2 were upregulated while nuclear Nrf2
expression was downregulation in HG-treated Müller cells after GAS1
overexpression (p
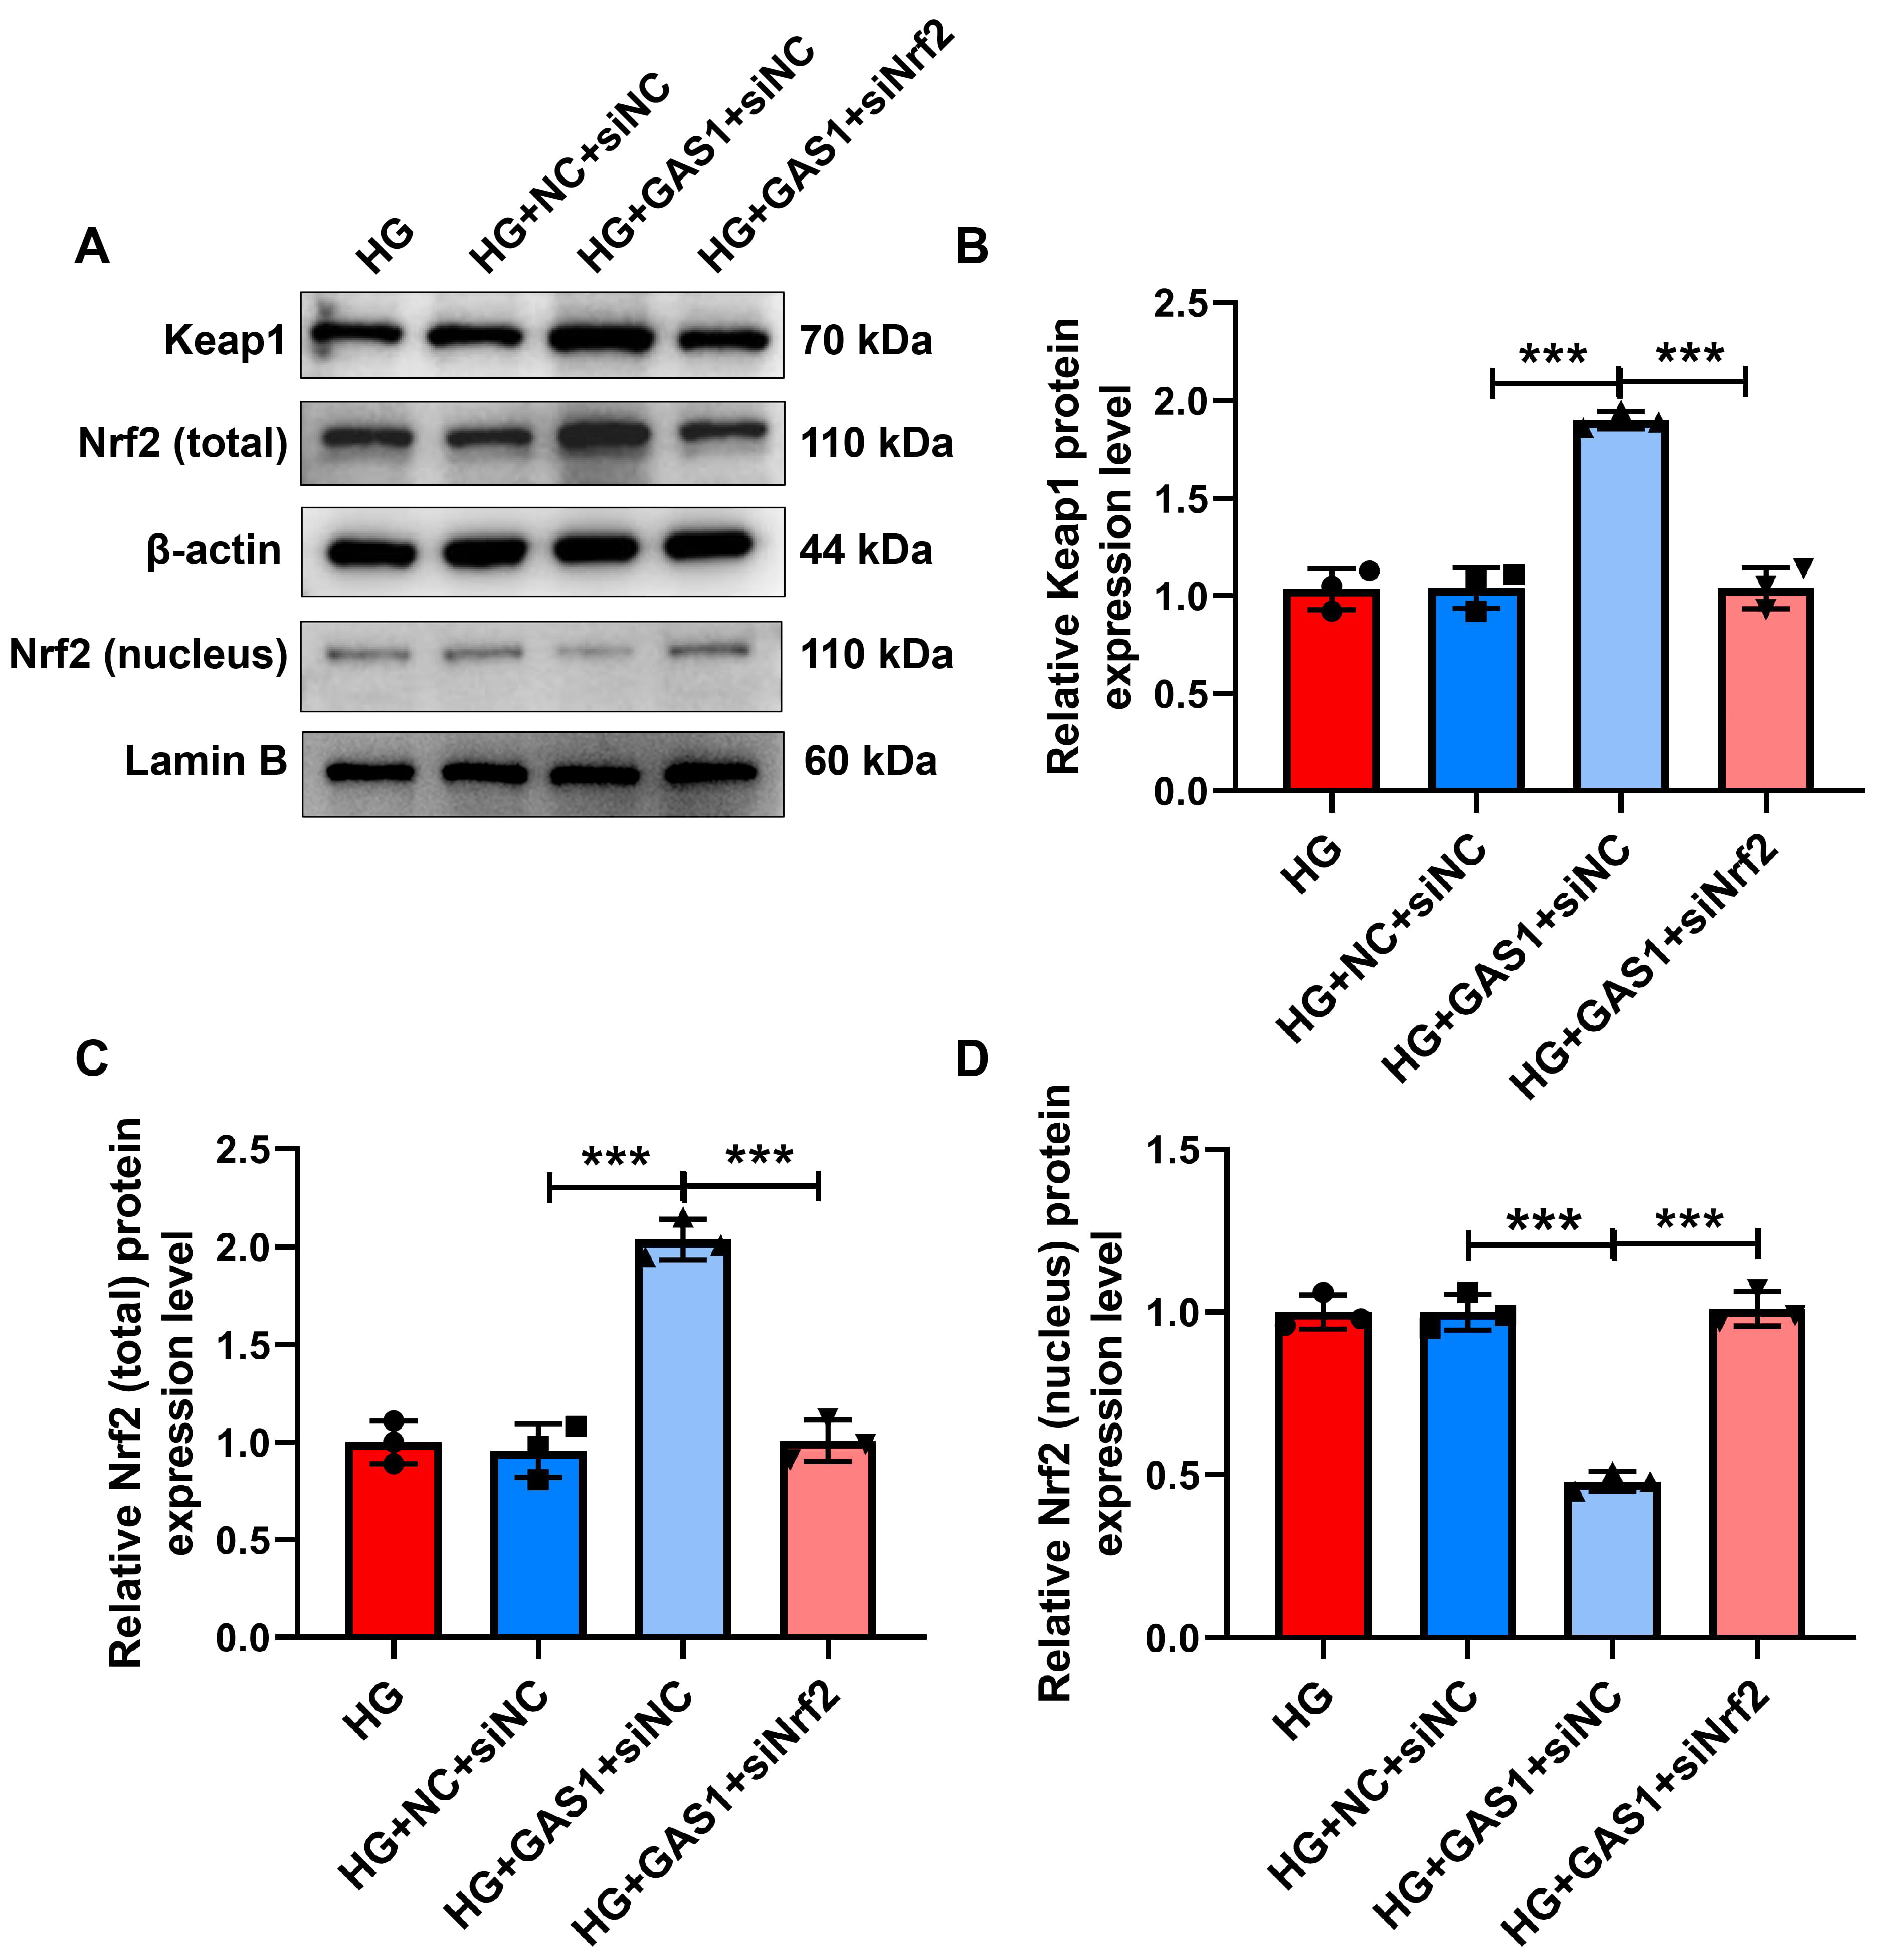 Fig. 9.
Nrf2 downregulation reversed the role of GAS1 in Keap1/Nrf2
signaling transduction in HG-treated Müller cells. (A–D) Expressions of
Keap1, total Nrf2, and nuclear Nrf2 in transfected and HG-exposed Müller
cells (Western blot). ***p
This research uncovered that GAS1 expression, lipid ROS, GSSG, MDA, oxidative stress, and ferroptosis were boosted, and the Keap1/Nrf2 signal was inhibited in HG-exposed Müller cells. GAS1 downregulation increased the viability and GSH level, reduced the lipid ROS, GSSG, MDA, oxidative stress and ferroptosis, and promoted Keap1/Nrf2 signal in HG-treated Müller cells, while GAS1 overexpression did oppositely. Nrf2 silencing reversed the role of GAS1 overexpression in HG-treated Müller cells. This work proved that GAS1 impeded Keap1/Nrf2 signaling transduction to activate ferroptosis in retinal Müller cells.
Ferroptosis, a newly discovered cell death reliant on iron regulation [26, 27], has the main feature of excess iron deposition that elevates ROS and oxidative stress, further promoting lipid peroxidation [28, 29]. Abundant evidence identified diabetes is intimately pertinent to ferroptosis [9, 30, 31, 32]. Hyperglycemia contributes to excessive production of ROS, further causing oxidative stress in various organs of diabetes patients [33]. HG results in iron overload and dysregulation, and then induces oxidative stress and lipid peroxidation containing ROS production, GSSG and MDA accumulation, and GSH reduction, ultimately initiating ferroptosis [34, 35, 36]. Herein, after HG treatment, the viability and GSH were decreased while the apoptosis, ROS, GSSG, MDA, Fe2+, GST, HO-1, and NQO1 were increased in rat Müller cells, suggesting that HG induced ferroptosis in rat Müller cells.
As a multifunctional protein, GAS1 possesses regulatory effects on various diseases, and its activation in human brain tumor-initiating cells can reduce the tumorigenecity [37], while its loss enhances the degeneration of nucleus pulposus tissues [38]. Besides, GAS1 is discovered to be a specific marker in diabetic rats and is highly expressed in diabetes, which has a crucial effect on the maintenance and differentiation of principal cells in diabetic nephropathy [39]. Herein, we provided new discovery that GAS1 was highly expressed in HG-exposed rat Müller cells. Furthermore, GAS1 can trigger cell death by an intrinsic apoptotic pathway [13]. GAS1 is a ferroptosis-related gene in high-grade serous ovarian cancer [14], and GAS1 upregulation aggravates acute liver injury through enhancing ferroptosis-mediated lipid peroxides accumulation [15]. Herein, we verified deficient GAS1 increased the viability and GSH while reducing the apoptosis, ROS, GSSG, MDA, Fe2+, GST, HO-1, and NQO1 in rat Müller cells, but GAS1 overexpression did the opposite, revealing that GAS1 upregulation promoted while GAS1 downregulation inhibited the ferroptosis in HG-treated rat Müller cells.
Reportedly, GAS1 obstructs PI3K/AKT pathway transduction [16, 17] which interacts with the Keap1/Nrf2 signaling [18]. Moreover, the Keap1/Nrf2 signal prevents the progression of ferroptosis [19, 22]. The Keap1/Nrf2 pathway is the main protective response to oxidant and electrophilic stress. Under homeostatic conditions, Keap1 targets Nrf2 for ubiquitination and proteasome dependent degradation, strictly regulating the activity of Nrf2; in stress response, the complex molecular mechanism promoted by the cysteine sensor in Keap1 allows Nrf2 to evade ubiquitination, accumulate in cells, and transport to the nucleus, where it can promote its antioxidant transcription program [40]. In DR model cells, the nuclear translocation and expression of Nrf2 is the activation of the Keap1/Nrf2 pathway induced by Acteoside, contributing to inhibition of the HG-induced oxidative stress injury [41]. In this work, the expressions of Keap1 and total Nrf2 were decreased, while nuclear Nrf2 expression was increased by GAS1 knockdown in HG-treated Müller cells, but GAS1 overexpression generated opposite effects, revealing that GAS1 overexpression inhibited while GAS1 downregulation promoted the transduction of the Keap1/Nrf2 signaling. Additionally, Nrf2 silencing abrogated GAS1 overexpression-induced ferroptosis in HG-treated rat Müller cells, further proving that the role of GAS1 in ferroptosis in DR was realized by regulating Keap1/Nrf2 signaling. Of note, some limitations exist and require resolution. Firstly, the effect of GAS1 on HG-treated Müller cells was only verified at the cellular level, necessitating animal experiments and clinical experiments. Secondly, we only analyzed the effect of GAS1 on HG-exposed Müller cells, and its effect on other biological behaviors of Müller cells remains obscure. Hence, we will explore the role of GAS1 in other cells and the effect of GAS1 on other biological functions in our future work.
Collectively, this work finds that GAS1 is upregulated in HG-exposed Müller cells, which can inhibit Keap1/Nrf2 signaling transduction to activate ferroptosis in retinal Müller cells. Our findings provide important clues for new drug development, optimize existing treatments, and offer novel foundation and biomarkers for DR treatment to improve therapeutic efficacy. Nevertheless, additional evidence and further experiments are necessary to substantiate our findings.
The analyzed data sets generated during the study are available from the corresponding author on reasonable request.
Substantial contributions to conception and design: RFD. Data acquisition, data analysis and interpretation: YQ, SQL, XZ, SSS, ZS. Drafting the article or critically revising it for important intellectual content: All authors. Final approval of the version to be published: All authors. Agreement to be accountable for all aspects of the work in ensuring that questions related to the accuracy or integrity of the work are appropriately investigated and resolved: All authors.
Not applicable.
Not applicable.
This research received no external funding.
The authors declare no conflict of interest.
Supplementary material associated with this article can be found, in the online version, at https://doi.org/10.31083/FBL27954.
References
Publisher’s Note: IMR Press stays neutral with regard to jurisdictional claims in published maps and institutional affiliations.