


 , Zhigang Cai 1,*
1 Department of Respiratory and Critical Care Medicine, PLA Navy Medical Center, 200052 Shanghai, China
†These authors contributed equally.
Abstract
Lung adenocarcinoma (LUAD) is the most prevalent histological subtype of lung cancer, accounting for 45.3% of all cases and serving as a major cause of cancer-related mortality. Although cisplatin (DDP) is a cornerstone in LUAD therapy, its efficacy is often compromised by resistance, leading to therapeutic failure and poor patient outcomes. Lipid metabolism and associated proteins, such as perilipin 3 (PLIN3), have been increasingly implicated in cancer progression and chemoresistance. However, the precise mechanisms through which PLIN3 contributes to cisplatin (DDP) resistance in LUAD remain poorly understood.
To investigate the role of PLIN3 in DDP resistance, its expression in LUAD tissues and its correlation with patient prognosis were analyzed using bioinformatics databases and validated through clinical sample analysis. The effects of PLIN3 knockdown and overexpression on DDP resistance and Wnt3a/β-catenin signaling were assessed using quantitative real-time PCR (qPCR), western blotting, cytotoxicity assays, and colony formation assays. Bioinformatics screening identified FOS-like antigen 1 (FOSL1) as a transcription factor positively correlated with PLIN3, and its involvement in DDP resistance was further examined both in vitro and in vivo.
PLIN3 expression is significantly elevated in LUAD tissues and correlates with poor overall survival. In LUAD cells, PLIN3 overexpression enhanced DDP resistance by upregulating Wnt3a expression and promoting β-catenin nuclear translocation. Bioinformatics analysis identified FOSL1 as a key transcription factor regulating PLIN3 expression. Experimental validation confirmed that FOSL1 directly binds to the PLIN3 promoter, activating the Wnt3a/β-catenin pathway and promoting DDP resistance. Knockdown of PLIN3 or inhibition of Wnt3a signaling reversed the effects of FOSL1 overexpression on DDP resistance.
This study demonstrates that PLIN3 contributes to DDP resistance in LUAD by activating the Wnt3a/β-catenin signaling pathway, with FOSL1 acting as a critical upstream regulator. Targeting the FOSL1/PLIN3/Wnt/β-catenin axis may provide a promising therapeutic strategy for overcoming chemoresistance in LUAD.
Keywords
- lung cancer
- chemoresistance
- FOSL1
- PLIN3
- Wnt
- β-catenin
Lung cancer remains the leading cause of cancer incidence and mortality worldwide, accounting for 12.4% of all cancer diagnoses and 18.7% of cancer-related deaths [1]. Non-small cell lung cancer (NSCLC) represents the predominant subtype, encompassing lung adenocarcinoma (LUAD), lung squamous cell carcinoma (LUSC), and large cell carcinoma (LCC) [2]. Among these, LUAD is the most prevalent, constituting approximately 45.3% of all lung cancers, exceeding the incidence of LUSC at 20.1% and LCC at 7.4% [2].
Cisplatin (DDP) remains a cornerstone of chemotherapy for NSCLC due to its broad-spectrum anti-tumor activity [3, 4]. However, the development of DDP resistance presents a significant barrier to its clinical efficacy [5, 6]. Evidence reveals substantial variability in DDP sensitivity across different NSCLC subtypes [7, 8], with LUAD exhibiting a higher degree of resistance compared to LUSC, potentially due to differences in inflammatory responses and the tumor microenvironment [7, 8]. Therefore, understanding the mechanisms driving DDP resistance in LUAD is critical for improving therapeutic outcomes.
Lipid metabolism reprogramming is a hallmark of cancer, facilitating rapid tumor cell proliferation and survival by modulating fatty acid synthesis, oxidation, and storage [9, 10, 11, 12]. This metabolic adaptability not only provides energy and essential components for tumor cells but may also contribute to their resistance to chemotherapy, thereby promoting drug resistance [9, 10, 11, 12]. For example, lipid metabolism in LUAD regulates osimertinib resistance via the epidermal growth factor receptor (EGFR) signaling pathway [13].
Lipid droplets (LDs) play a central role in lipid metabolism, with their dynamic regulation responsive to cellular lipid and energy demands [14, 15, 16]. Perilipin 3 (PLIN3), a member of the perilipin protein family, regulates LD formation and lipid storage [17]. Recent studies have highlighted PLIN3’s association with tumor progression, increased invasiveness, and poor prognosis in various cancers [18, 19, 20, 21]. In lung cancer, PLIN3 is significantly upregulated in early-stage tissues, indicating the critical role of LDs in tumor development [22]. Furthermore, PLIN3 has been shown to exert an immune-resistant effect in LUAD, where its silencing reduces Programmed Cell Death Ligand 1 (PD-L1) expression, thereby inhibiting immune evasion and suppressing tumor growth [23].
Although research directly linking PLIN3 to chemotherapy resistance is limited, evidence from other cancers suggests that PLIN3 may modulate chemoresistance through metabolic pathways, including autophagy. For instance, inhibition of PLIN3 in prostate cancer enhances autophagic activity and promotes resistance to docetaxel, while Perilipin 4 (PLIN4), another member of the perilipin family, has been associated with chemoresistance in triple-negative breast cancer [9, 24].
This study investigated the role of PLIN3 in DDP resistance in LUAD. Our results
demonstrate that PLIN3 expression is significantly elevated in LUAD and strongly
correlates with poor prognosis. Mechanistic studies reveal that PLIN3 promotes
DDP resistance by activating the Wnt3a/
The TCGA database was utilized to examine the expression levels of PLIN3 and its prognostic significance in LUAD (Kaplan-Meier Plotter). RNA-seq data and corresponding clinical information for patients with LUAD were retrieved from the TCGA database via the UALCAN portal (https://ualcan.path.uab.edu/). On the UALCAN analysis page (https://ualcan.path.uab.edu/analysis.html), PLIN3 expression was assessed in LUAD based on sample types, cancer stages, smoking habits, nodal metastasis status, TP53 mutation status, and histological subtypes. Survival analysis was conducted using both the TCGA and Kaplan-Meier Plotter databases (https://kmplot.com/analysis/). Patients were categorized into two groups based on the median PLIN3 expression level in LUAD. Survival curves were generated to evaluate the prognostic impact of PLIN3 expression on patient survival. The analysis was performed using the following parameters: Affy ID:202122_s_at; Survival: Overall Survival (OS); Split patients by: median; Follow up threshold: all; Censor at threshold: checked; Compute median over entire database: false; Cutoff value used in analysis: 962; Expression range of the probe: 38-7829; Probe set option: user-selected probe set; Invert HR values below 1: not checked.
Tumor and adjacent non-tumor tissue samples were collected from 24 patients with LUAD at the PLA Naval Medical Center (Shanghai, China), with the non-tumor tissues being situated more than 5 cm from the tumor. Only patients with primary LUAD who had not received any prior treatment, including chemotherapy, were included in the study. All tissues were diagnosed histopathologically and clinically. The study was approved by the Ethics Committee of the Naval Medical Center (ethical approval number: AF-HEC-068), and all patients or their families/legal guardians provided written informed consent. The clinical characteristics of the included patients were summarized in Table 1.
| Characteristics | Cases (24 in total) | Percentage (%) | |
| Sex | |||
| Male (n) | 13 | 54.2% | |
| Female (n) | 11 | 45.8% | |
| Smoking status | |||
| Current smoker | 9 | 37.5% | |
| Ex smoker | 7 | 29.2% | |
| Never smoker | 8 | 33.3% | |
| Age (years) | |||
| 10 | 41.7% | ||
| 14 | 58.3% | ||
| N classification | |||
| N0 | 8 | 33.3% | |
| N1 | 5 | 20.8% | |
| N2 | 6 | 25.0% | |
| N3 | 5 | 20.9% | |
| Clinical stage | |||
| Stage I | 7 | 29.2% | |
| Stage II | 5 | 20.9% | |
| Stage III | 8 | 33.3% | |
| Stage IV | 4 | 16.6% | |
| Primary tumor size | |||
| Tumor size |
10 | 41.7% | |
| Tumor size |
14 | 58.3% | |
The NSCLC cell lines H2030 (ATCC), H2405, H1755, H2347, H1703, and the lung epithelial cell line BEAS-2B were sourced from American Type Culture Collection (ATCC, Manassas, MD, USA) and cultured in a humidified incubator at 37 °C with 5% CO2. Cells were maintained in RPMI-1640 medium (Sigma-Aldrich, Shanghai, China) supplemented with 10% fetal bovine serum (FBS, Sigma-Aldrich, Shanghai, China). All cell lines were validated by short tandem repeat (STR) profiling and tested negative for mycoplasma.
For transfection experiments, cells were seeded in 6-well plates (Sigma-Aldrich,
Shanghai, China) at a density of 2
The DDP-resistant LUAD cell line was established through gradual drug selection. Parental H2030 and H1775 cells were initially exposed to low concentrations of DDP (0.5–1.0 µg/mL, Sigma-Aldrich, Shanghai, China) and allowed to proliferate until stable growth was observed. The DDP concentration was then incrementally increased by 0.5–1.0 µg/mL every 2–4 weeks, enabling the cells to adapt to each new concentration. This process continued until the cells were able to proliferate stably in high concentrations of DDP (up to 10 µg/mL). Resistance development was confirmed by comparing the half-maximal inhibitory concentration (IC50) of DDP between resistant and parental cells via cell viability assays. The resistant cell line was further stabilized by culturing in a DDP-free medium for several passages.
Total RNA was extracted from the cultured cells following the TRIzol reagent protocol (Invitrogen, Thermo Fisher Scientific, Waltham, MA, USA). RNA quality and concentration were assessed using a NanoDrop spectrophotometer (Thermo Fisher Scientific, Waltham, MA, USA). For cDNA synthesis, 1 µg of total RNA was reverse-transcribed using Superscript II Reverse Transcriptase (Thermo Fisher Scientific, Inc., Waltham, MA, USA). QPCR was performed with SYBR Green Master Mix (Thermo Fisher Scientific, Waltham, MA, USA) on a real-time PCR detection system, employing primers specific to the target genes. Glyceraldehyde-3-phosphate dehydrogenase (GAPDH) was used as the internal reference for normalization. Negative controls, including no-template controls, were included to exclude contamination or non-specific amplification. Relative expression levels were calculated using the 2-ΔΔCt method. The primers for FOSL1 were: left primer: AGCTGCAGAAGCAGAAGGAG; right primer: GGAGTTAGGGAGGGTGTGGT. The primers for PLIN3 were: left primer: CAGCAGAGAAGGGAGTGAGG; right primer: ACACAAGCTCCTTGGTGTCC.
Cell lysates were prepared using Radio-Immunoprecipitation Assay (RIPA) buffer (Sigma-Aldrich, Shanghai, China), supplemented with protease and phosphatase inhibitors (Sigma-Aldrich, Shanghai, China). After lysis, the samples were centrifuged at 12,000 rpm for 10 minutes at 4 °C, and the supernatants were collected. Protein concentration was quantified using a bicinchoninic acid (BCA) protein assay kit (Sigma-Aldrich, Shanghai, China). Equal amounts of protein (20–30 µg) were separated by sodium dodecyl sulfate-polyacrylamide gel electrophoresis (SDS-PAGE, Bio-Rad, Shanghai, China) and transferred to Polyvinylidene fluoride (PVDF) membranes (Bio-Rad, Shanghai, China). The membranes were blocked for 1 hour at room temperature with 5% non-fat dry milk in tris-buffered saline with tween (TBST) (Sigma-Aldrich, Shanghai, China), followed by overnight incubation at 4 °C with primary antibodies (anti-PLIN3, SAB1406951, 1 μg/Ml, Sigma-aldrich, Shanghai, China; anti-Wnt3a, ab219412, 1:1000, Abcam, Shanghai, China; anti-β-Catenin, #9582, 1:1000, Cell Signaling Technology, Shanghai, China; anti-Lamin A/C, L1293, 1:1000, Sigma-aldrich, Shanghai, China; anti-FOSL1, SAB1411459, 1 µg/mL, Sigma-aldrich, Shanghai, China; anti-GAPDH, AB2302, 1:10,000, Sigma-aldrich, Shanghai, China). After three washes with TBST, the membranes were incubated with horseradish peroxidase (HRP)-conjugated secondary antibody (Rabbit Anti-Goat lgG Antibody HRP conjugate, AP106P, 1:5,000, Sigma-aldrich, Shanghai, China) for 1.5 hours at room temperature. Protein bands were visualized using an enhanced chemiluminescence (ECL) detection system (Thermo Fisher Scientific, Waltham, MA, USA). Relative protein expression was quantified using ImageJ software (Version 1.53, NIH, Bethesda MD, USA), with GAPDH or Lamin A/C as loading controls. The original Western blot is provided as Supplementary Material.
The cytotoxicity and cell viability effects of DDP were assessed using the Cell Counting Kit-8 (CCK-8) assay (Sigma-Aldrich, Shanghai, China). Cells were seeded in 96-well plates at a density of 5000 cells per well and incubated overnight to allow attachment. For the cytotoxicity assessment, cells were treated with increasing concentrations of DDP for 48 hours. Following the designated treatment or growth periods (24, 48, or 72 hours), 10 µL of CCK-8 reagent was added to each well, and the plates were incubated at 37 °C for 2 hours in the dark. Absorbance at 450 nm was measured using a microplate reader (Tecan-UK, Reading, UK), with background correction performed by subtracting the absorbance of wells containing only media and CCK-8. Cell viability or cytotoxicity was calculated as a percentage relative to control cells, with the control group set to 100% for normalization. The half maximal inhibitory concentration (IC50) of DDP was determined by plotting dose-response curves and performing nonlinear regression to identify the concentration required to inhibit 50% of cell viability.
For colony formation assays, cells were plated in 6-well plates at a density of 500 cells per well and cultured at 37 °C with 5% CO2 for 10–14 days to allow colony formation. At the end of the incubation, the culture medium was discarded, and colonies were fixed with 4% paraformaldehyde (Sigma-Aldrich, Shanghai, China) for 15 minutes at room temperature. After fixation, colonies were stained with 0.5% crystal violet (Sigma-Aldrich, Shanghai, China) for 20 minutes and washed with distilled water to remove excess stain. Colonies containing more than 50 cells were counted under a microscope (OLYMPUS IX71, Olympus, Tokyo, Japan), and colony formation efficiency was calculated by dividing the number of colonies formed by the initial cell number.
Cells were cross-linked with 1% formaldehyde (Sigma-Aldrich, Shanghai, China) for 10 minutes at room temperature to preserve protein-DNA interactions. The reaction was subsequently quenched with 125 mM glycine (Sigma-Aldrich, Shanghai, China). Following this, cells were lysed in chromatin immunoprecipitation (ChIP) lysis buffer (Thermo Fisher Scientific, Waltham, MA, USA), and chromatin was fragmented to an average size of 200–1000 bp by sonication. The sheared chromatin was subjected to overnight immunoprecipitation at 4 °C using antibodies (Anti-FOSL1, ab252421, 1/30, Abcam, Shanghai, China; IgG, I8140, 1/30, Sigma-aldrich, Shanghai, China) specific to the protein of interest or control immunoglobulin G (IgG). Immunoprecipitated DNA-protein complexes were then eluted, and cross-links were reversed by heating at 65 °C for 4 hours. Purified DNA was analyzed by qPCR using primers specific to the target DNA sequences to identify the presence of these sequences in the immunoprecipitates. Results were normalized to input DNA to account for variations in chromatin preparation and PCR efficiency.
For luciferase assays, cells were co-transfected with a luciferase reporter plasmid containing the PLIN3 promoter region and a Renilla luciferase plasmid as an internal control to assess transfection efficiency. Forty-eight hours post-transfection, cell lysates were prepared using passive lysis buffer according to the manufacturer’s instructions. Luciferase activity was measured using a dual-luciferase reporter assay system (Thermo Fisher Scientific, Waltham, MA, USA), with the firefly luciferase signal, reflecting the promoter activity of the target gene, normalized to the Renilla luciferase signal to correct for transfection efficiency. Relative promoter activity was determined by calculating the ratio of firefly to Renilla luciferase activity.
Six-week-old female nude mice (Bikai Keyi Biotechnology Co., Ltd., Shanghai, China) were subcutaneously
injected with H2030/DDP cells into the right flank under anesthesia with ketamine (100 mg/mL) and acepromazine
(10 mg/mL) at a dose of 100 mg/kg and 5.0 mg/kg, respectively, via intraperitoneal injection. The injected cells
had undergone FOSL1 knockdown, or FOSL1 knockdown combined with overexpression of PLIN3
or Wnt3a. Mice received intraperitoneal injections of DDP at a dose of 2 mg/kg, twice weekly.
Tumor dimensions were measured weekly, and tumor volume was calculated using the
formula (length
Experimental data were processed and analyzed using GraphPad Prism 19.0 software
(Dotmatics, Boston, MA, USA). Quantitative data are presented as mean
Querying the TCGA database via GEPIA
(http://gepia2.cancer-pku.cn/#survival) and performing survival analysis using
the Kaplan-Meier Plotter database confirmed a strong association between elevated
PLIN3 expression and poor prognosis in LUAD (Fig. 1A,B). Results from
both databases revealed that patients with higher PLIN3 expression had
significantly reduced survival times (p
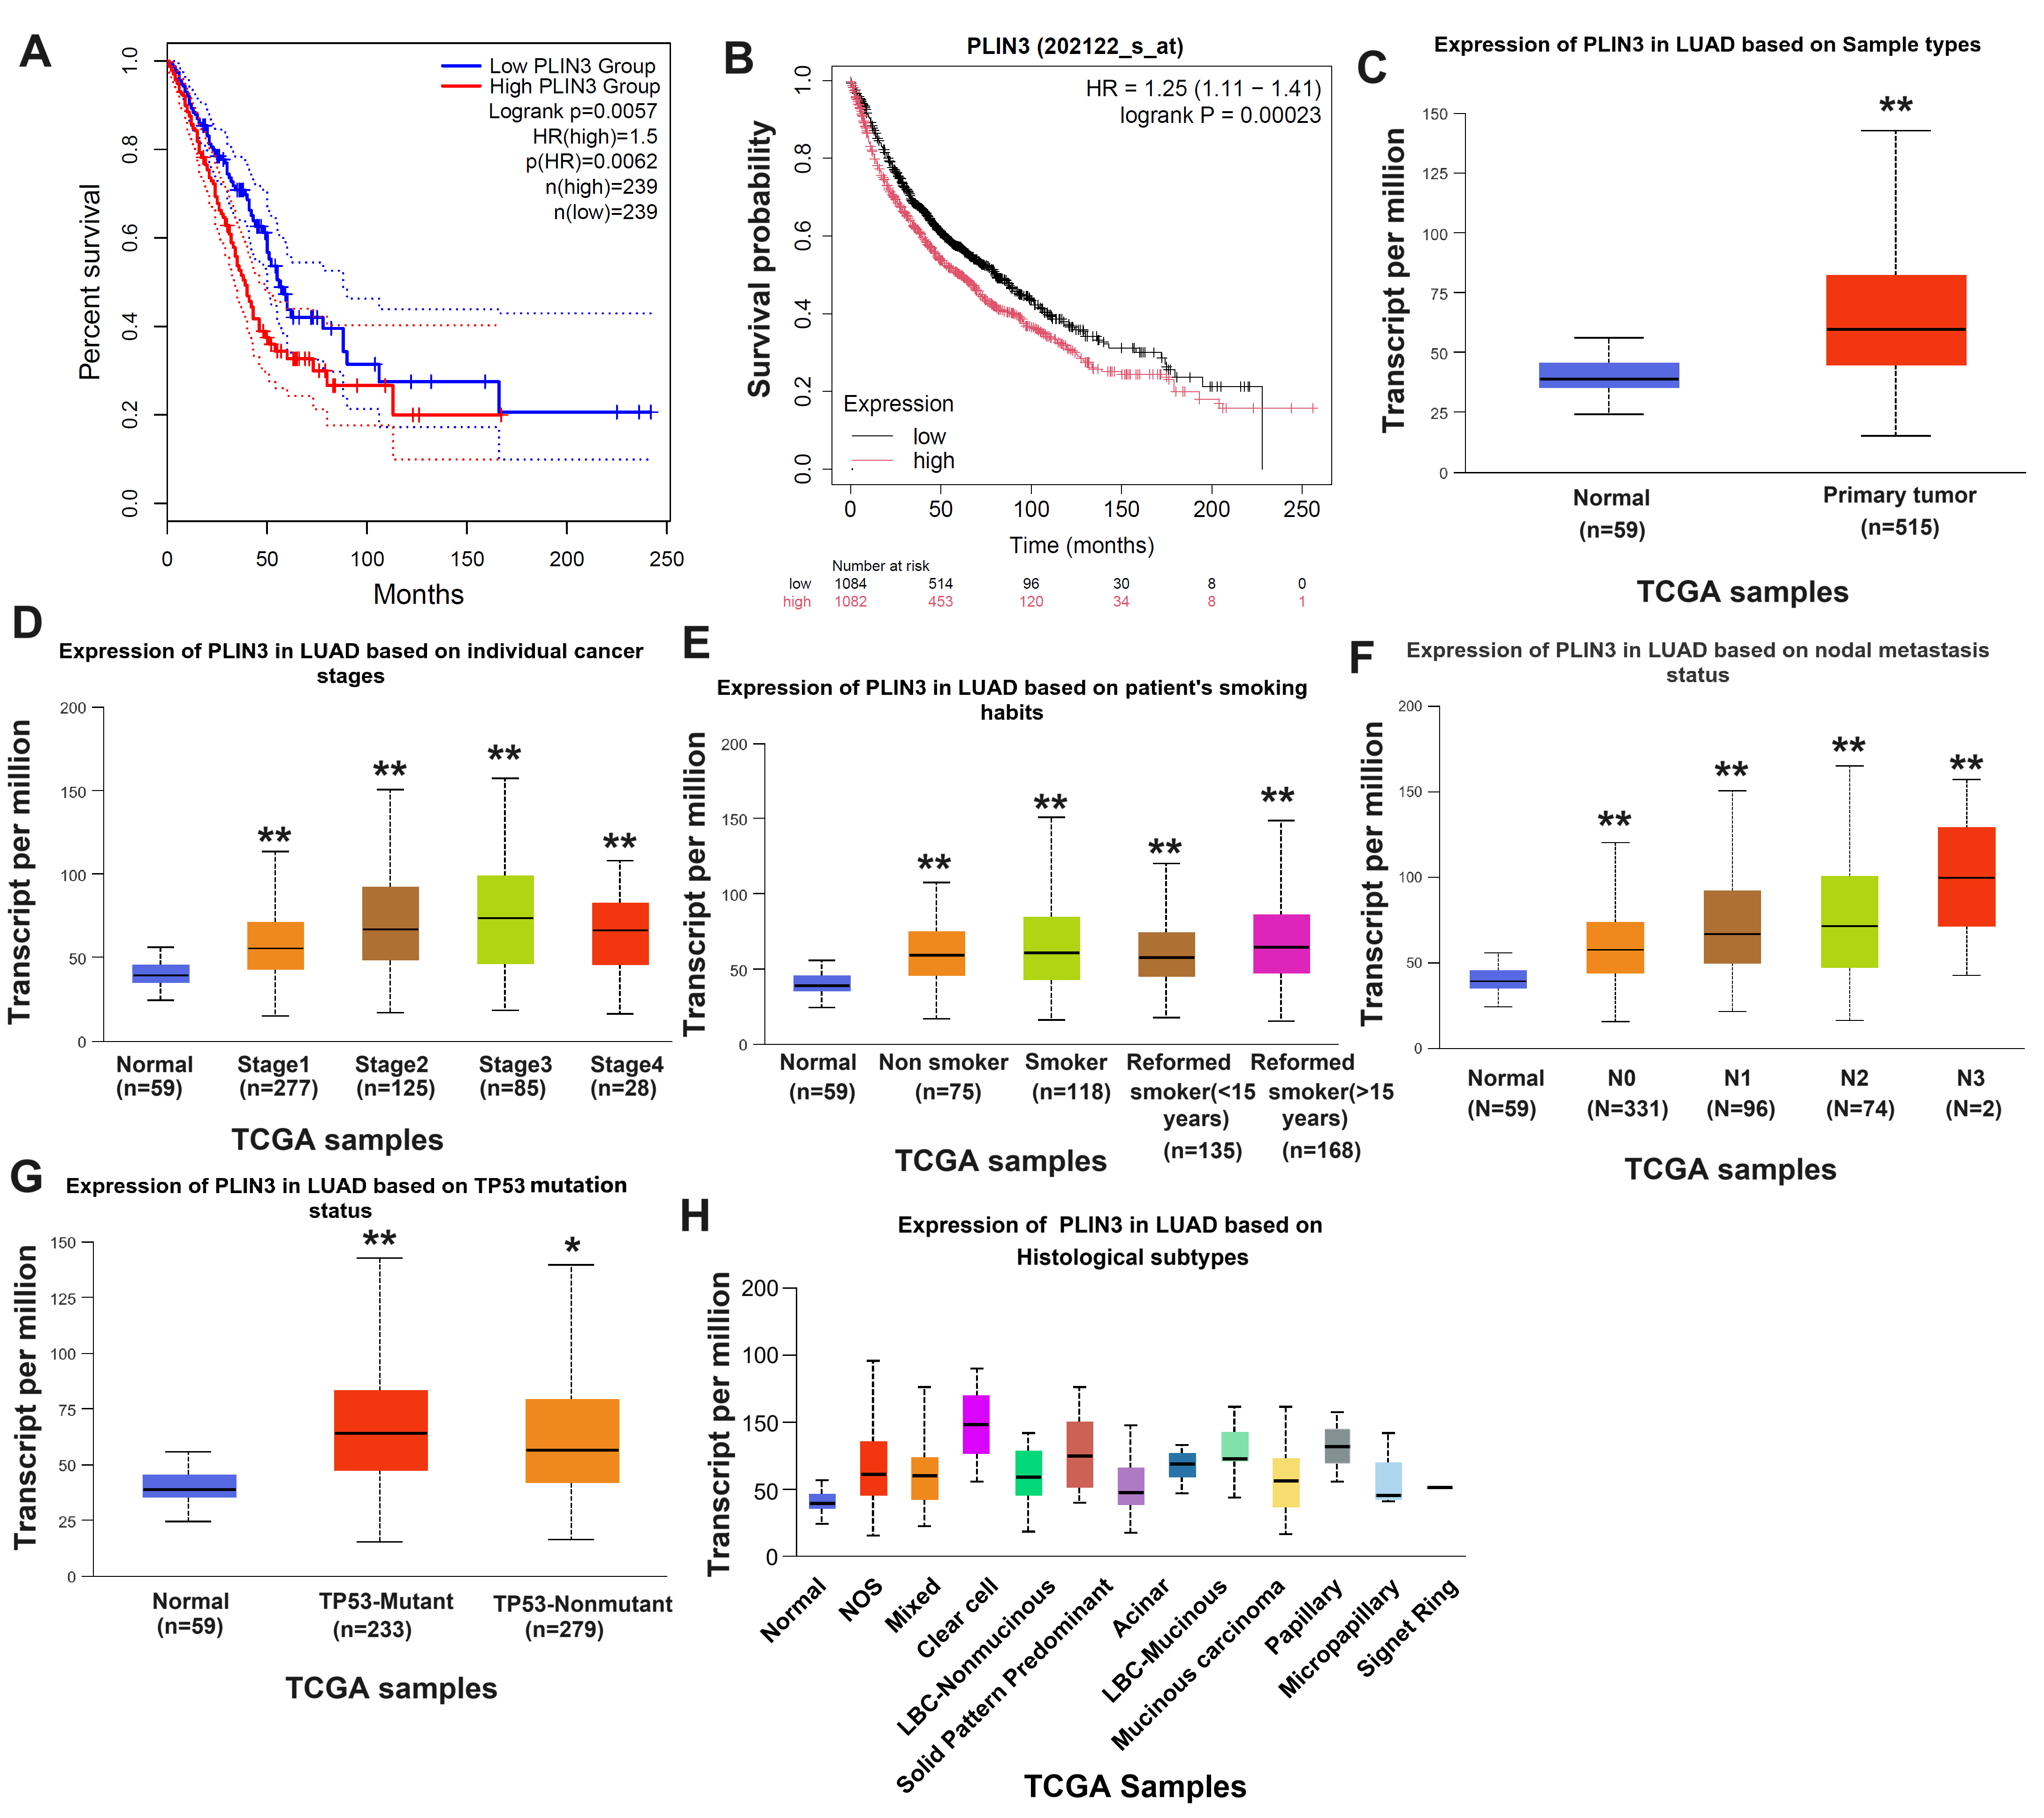 Fig. 1.
Bioinformatics analysis revealed prominent expression of PLIN3
in LUAD and its strong correlation with LUAD prognosis. (A) Survival
probabilities from the TCGA database via GEPIA
(http://gepia2.cancer-pku.cn/#survival) for patients with LUAD exhibiting high
(n = 239) and low/medium (n = 239) PLIN3 expression (p
Building on previous analyses, PLIN3 mRNA levels were assessed in 24 pairs of normal and LUAD tissues, revealing a marked elevation in PLIN3 expression in LUAD tissues (Fig. 2A). Consistent with these results, both transcriptional and translational levels of PLIN3 were significantly upregulated in five NSCLC cell lines (H2030, H2405, H1755, H2347, and H1703) compared to normal BEAS-2B cells (Fig. 2B,C). Among these, PLIN3 expression was most prominent in H2030 and H1775 cells, which were selected for further investigation. The impact of PLIN3 knockdown was confirmed in H2030 and H1775 cells (Fig. 2D,E), with results showing that PLIN3 knockdown notably reduced cell viability (Fig. 2F,G). In H2030/DDP cells, PLIN3 expression was significantly decreased compared to normal H2030 cells (Fig. 2H), and PLIN3 shRNA also significantly reduced PLIN3 levels in H2030/DDP cells. Moreover, cytotoxicity assays demonstrated that PLIN3 shRNA treatment significantly increased the susceptibility of H2030 cells to DDP (Fig. 2I,J). The knockdown of PLIN3 in H2030/DDP cells significantly diminished cell viability and reduced the IC50 value in response to DDP treatment (Fig. 2K,L). In conclusion, these results suggest that PLIN3 is notably elevated in LUAD, playing a role in promoting DDP resistance.
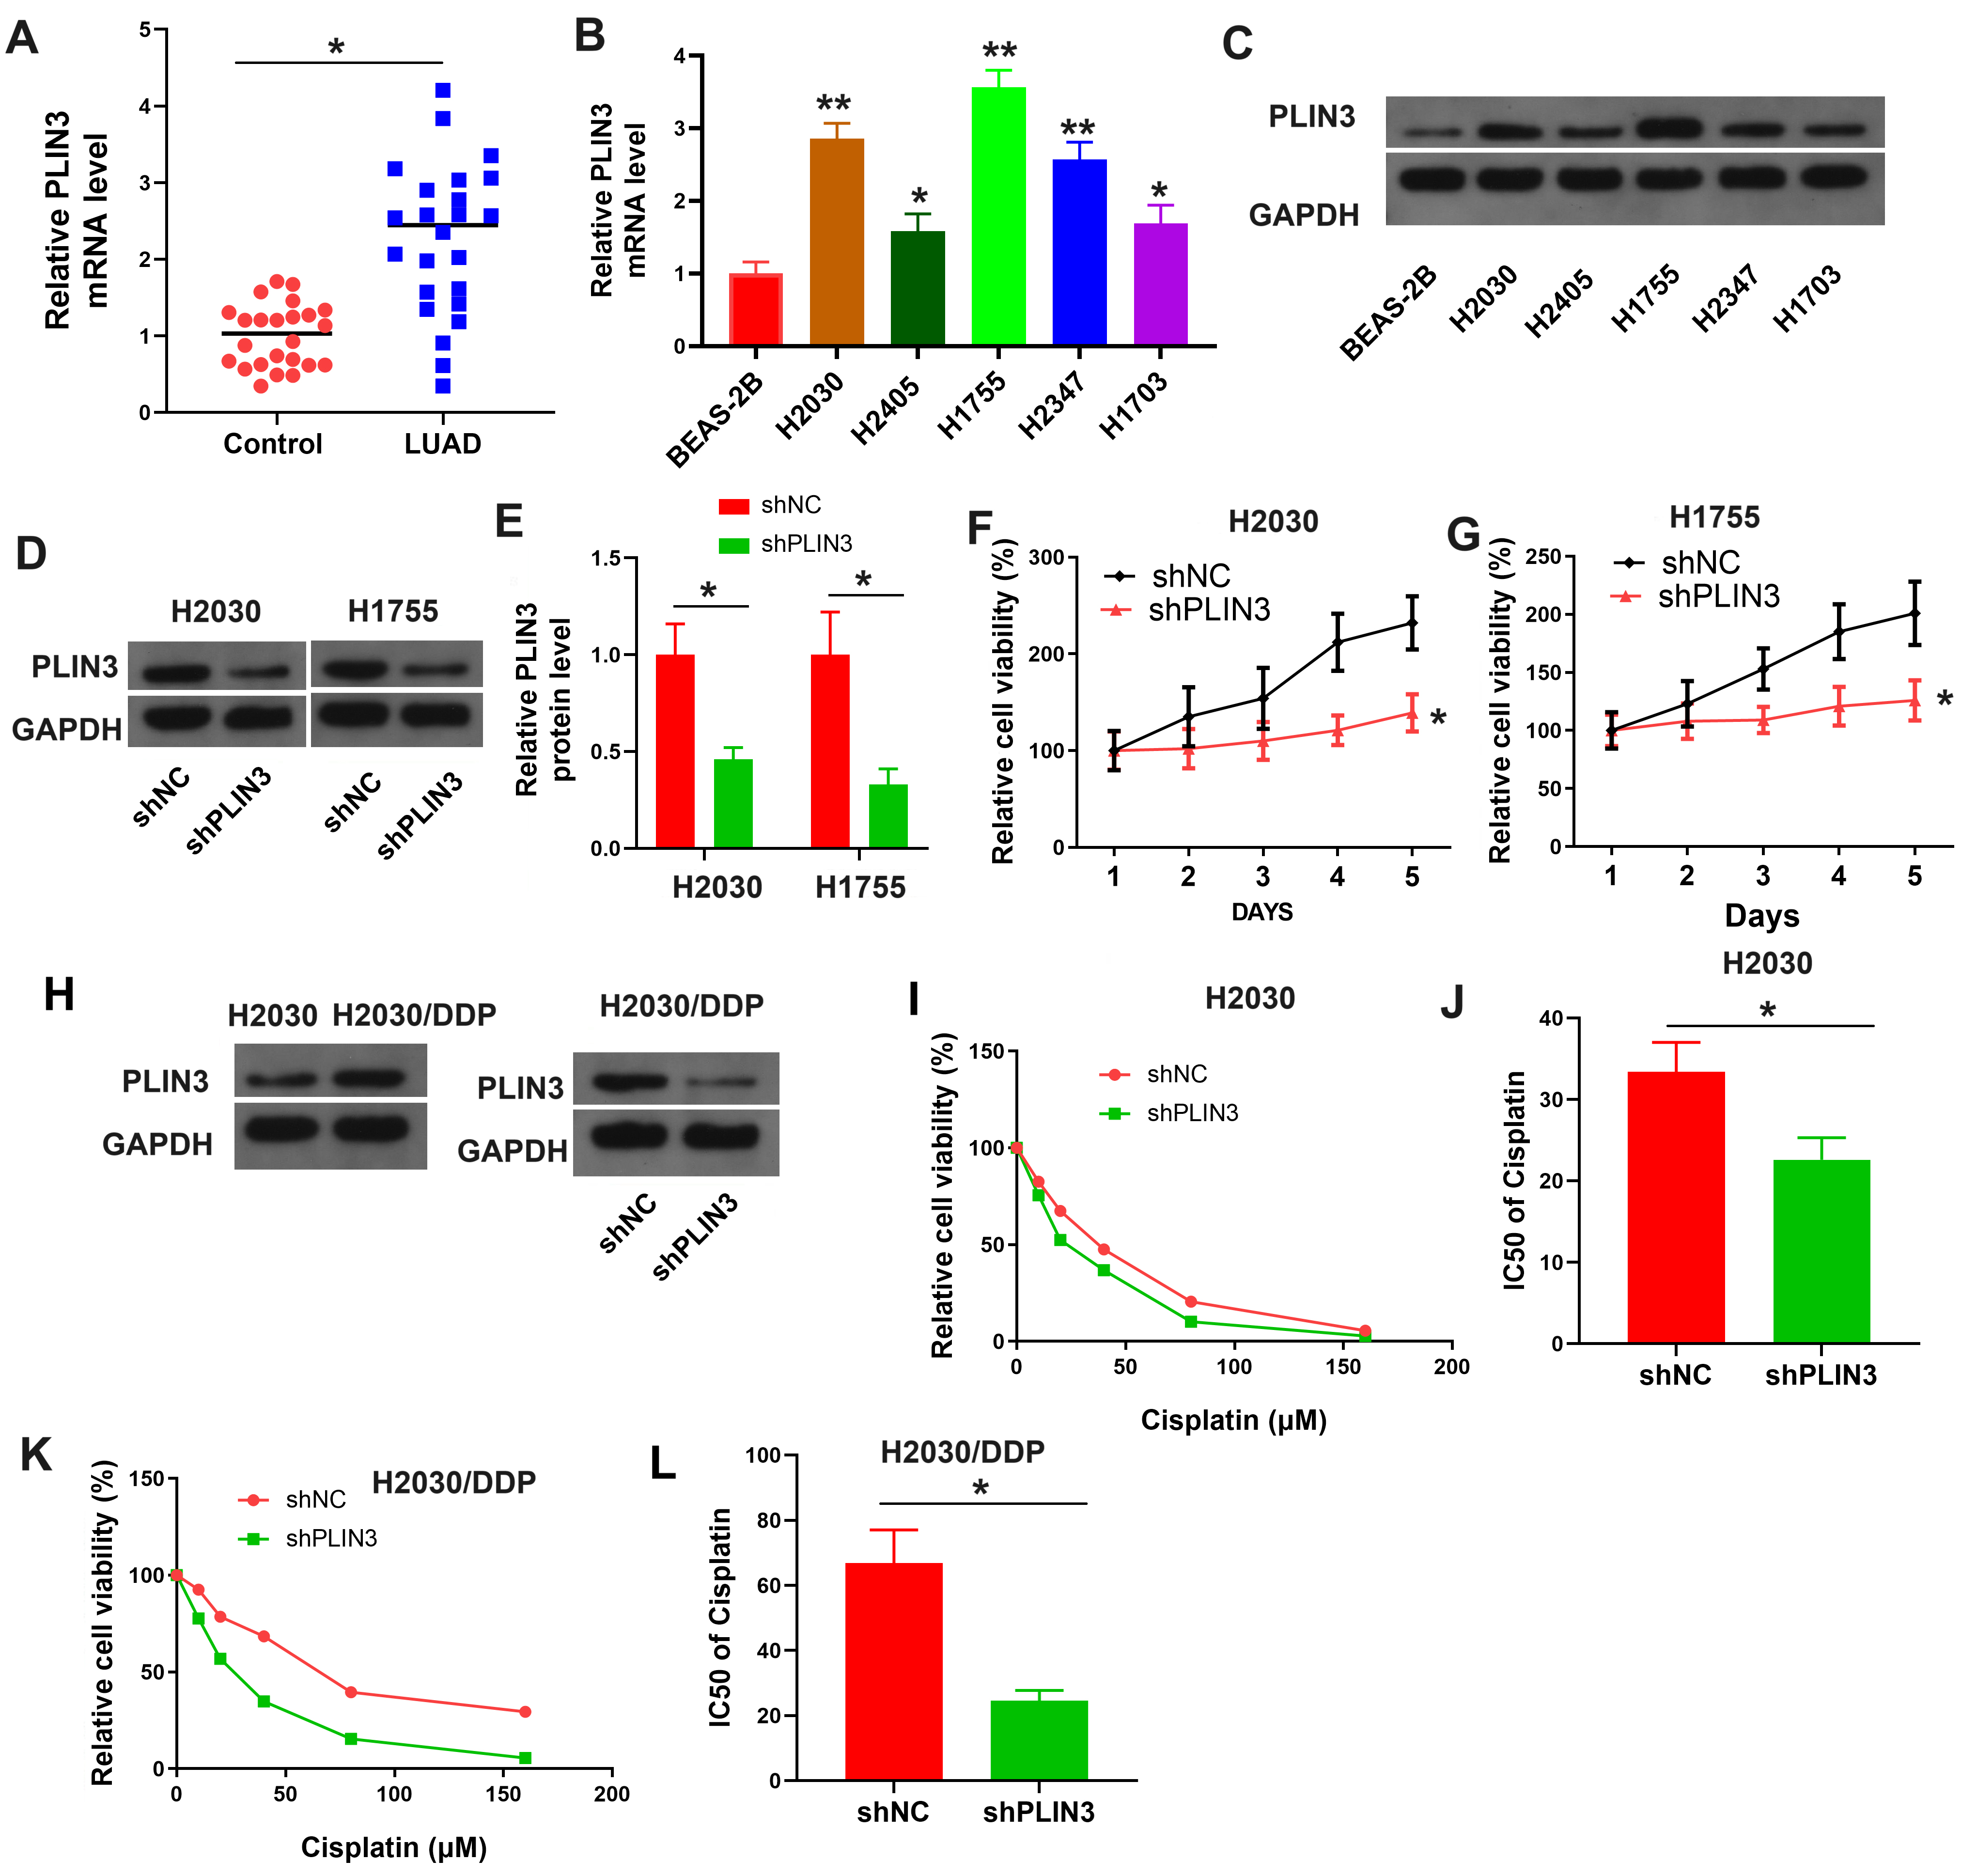 Fig. 2.
PLIN3 was markedly elevated in LUAD and promoted DDP
resistance. (A) Relative PLIN3 mRNA levels in normal and LUAD tissues
(n = 24). Transcription (B) and translation (C) levels of PLIN3 in five
NSCLC cell lines. (D,E) Western blot analysis of PLIN3 translation levels in
H2030 and H1775 cells transfected with shNC or shPLIN3. Cell viability
(F,G) of H2030 and H1775 cells transfected with shNC or shPLIN3. (H)
PLIN3 protein levels in H2030 and H2030/DDP cells (left) and in H2030/DDP cells
transfected with shNC or shPLIN3 (right). Cell viability (I) and
IC50 values (J) in gradient DDP concentrations of H2030 cells transfected
with shNC or shPLIN3. Cell viability (K) and IC50 values (L) in
gradient DDP concentrations of H2030/DDP cells transfected with shNC or
shPLIN3. *p
Given the pivotal role of the Wnt/
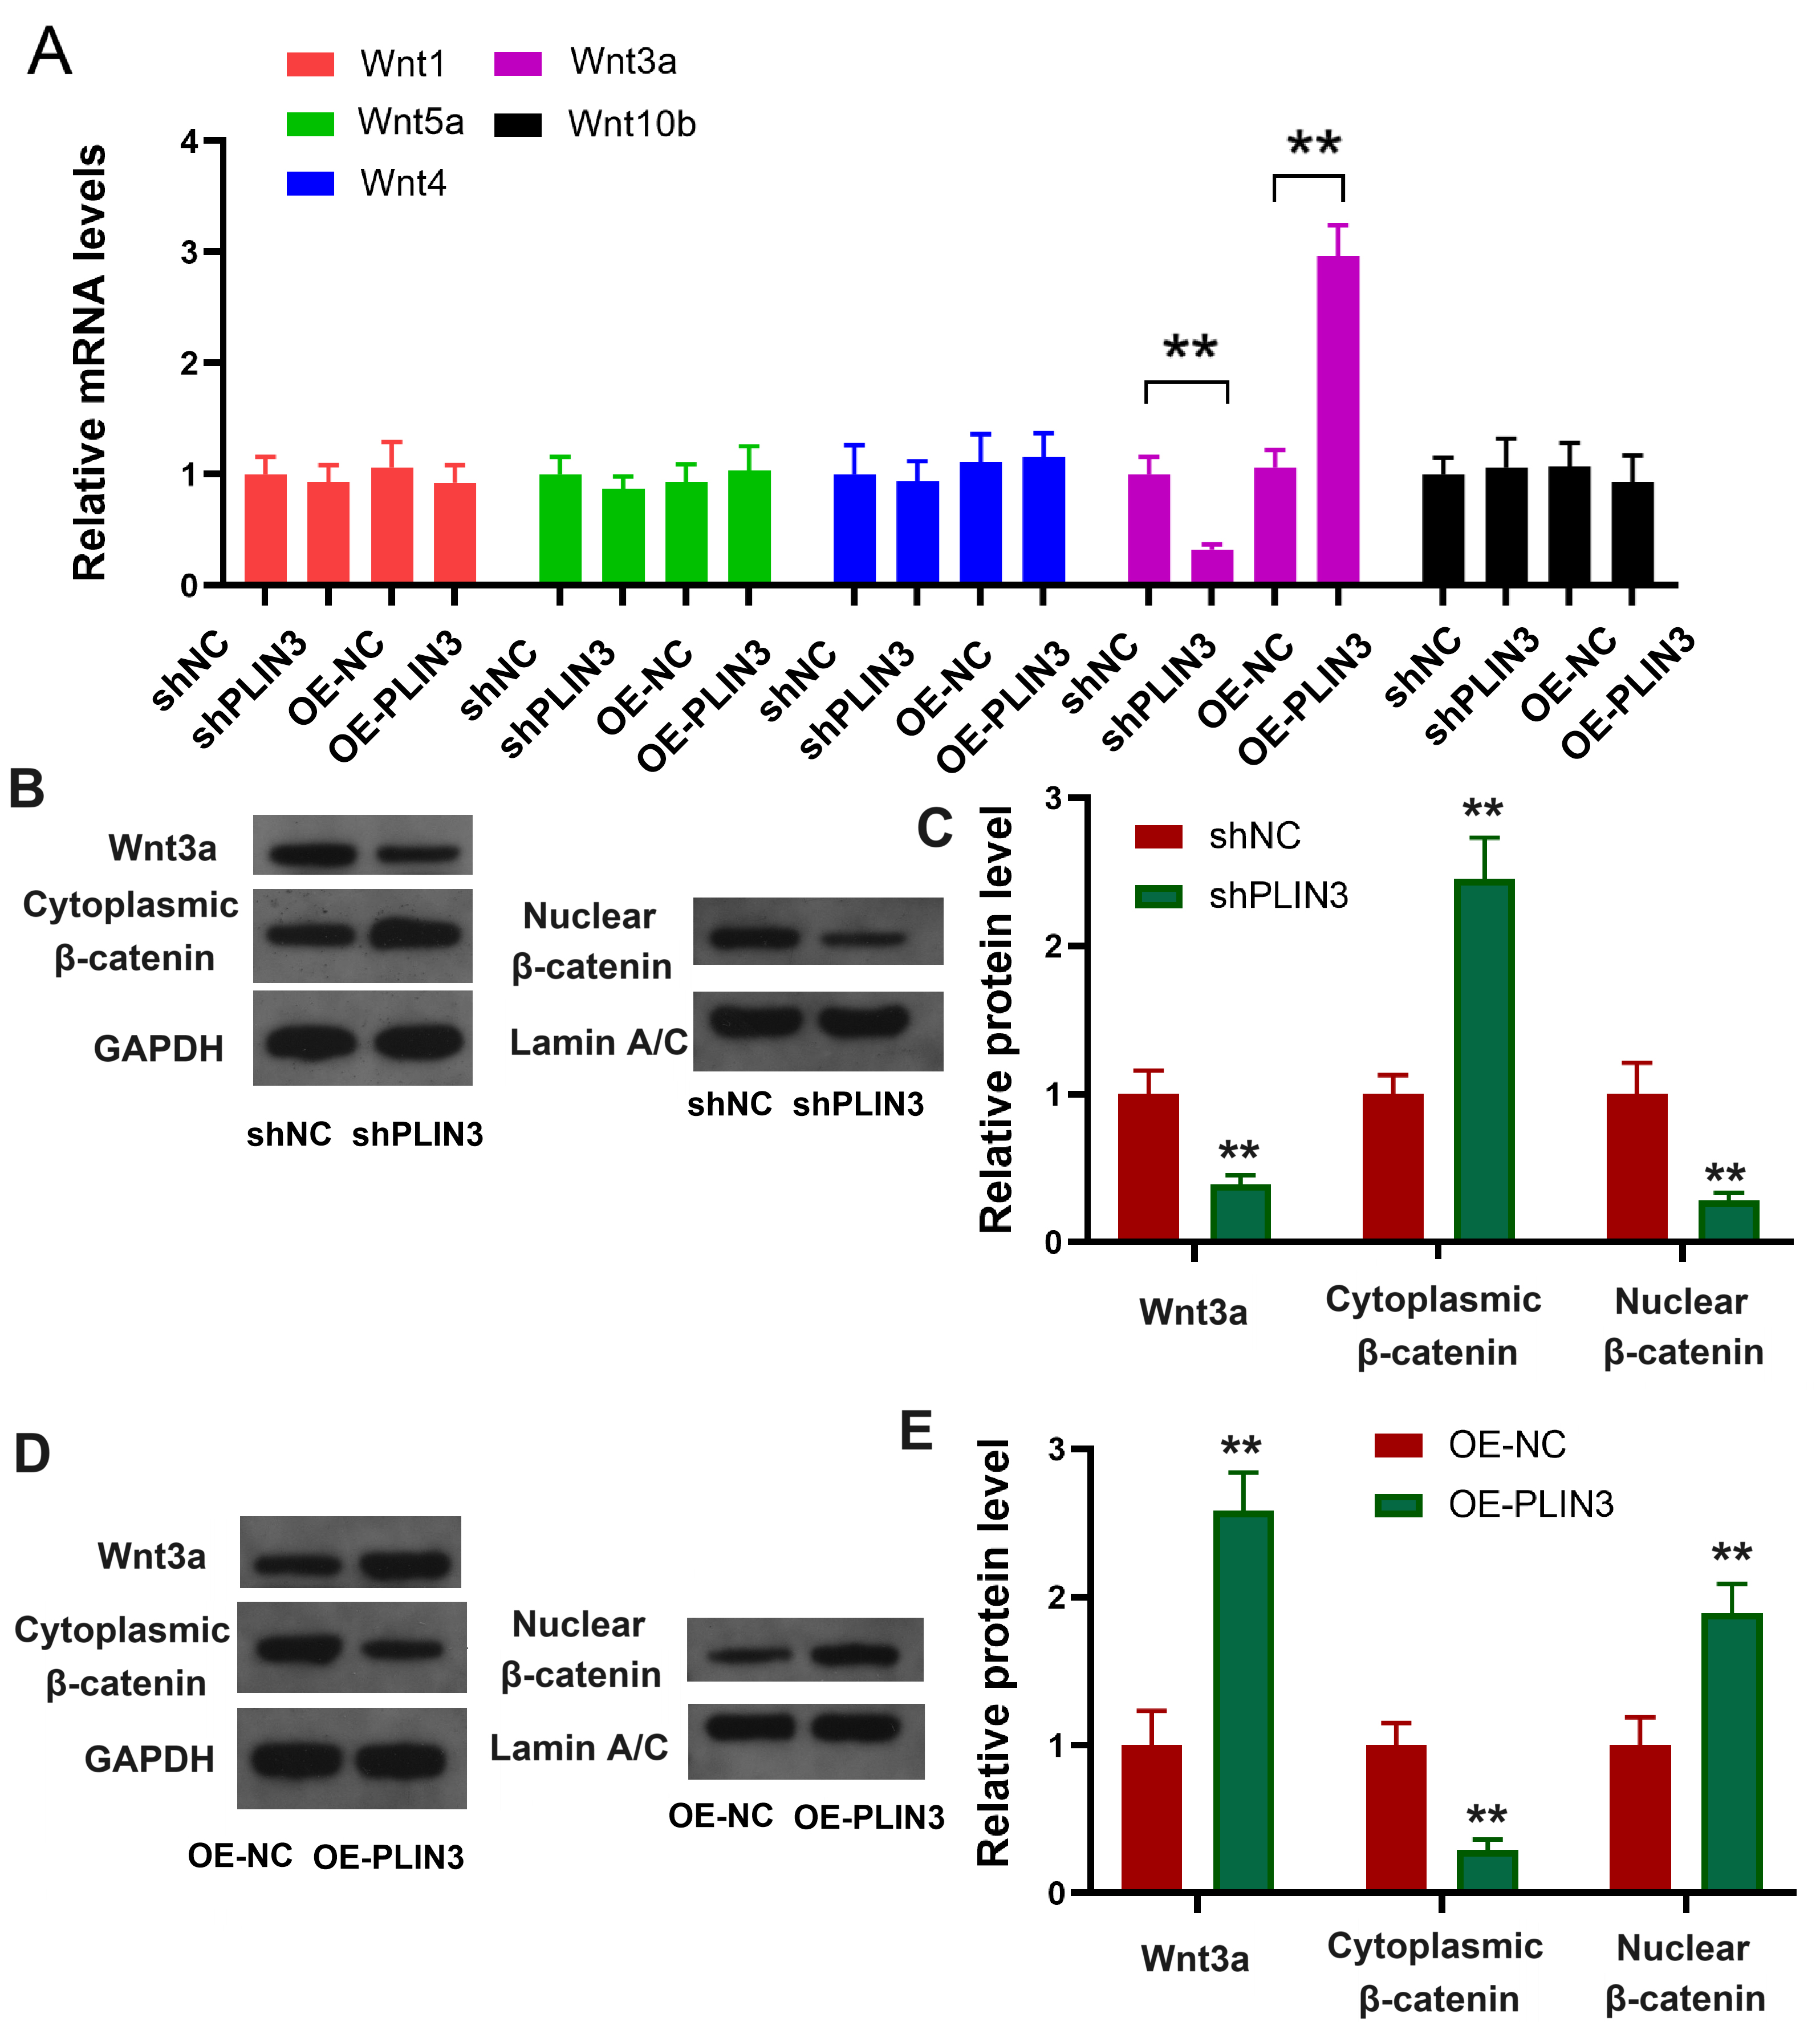 Fig. 3.
PLIN3 activates the Wnt/
To investigate the upstream regulatory factors of PLIN3, the TCGA database was queried to identify 205 proteins strongly correlated with PLIN3 expression. The JASPAR database (https://jaspar.elixir.no/) was then used to identify 605 transcription factors (TFs) with potential binding sites in the PLIN3 promoter region. The intersection of these two datasets revealed four common proteins: FOS-like antigen 2 (FOSL2), TEA domain transcription factor 1 (TEAD1), v-rel avian reticuloendotheliosis viral oncogene homolog A (RELA), and FOSL1 (Fig. 4A). Further analysis using the TCGA database evaluated the prognostic significance of these four proteins in patients with LUAD, revealing that only FOSL1 was consistently associated with poorer survival outcomes (Fig. 4B–E). Additionally, analysis from the GEPIA database (http://gepia.cancer-pku.cn/index.html) showed a positive linear correlation between FOSL1 and PLIN3 expression (Fig. 4F). These data suggest that FOSL1 may regulate PLIN3 expression and influence survival in LUAD.
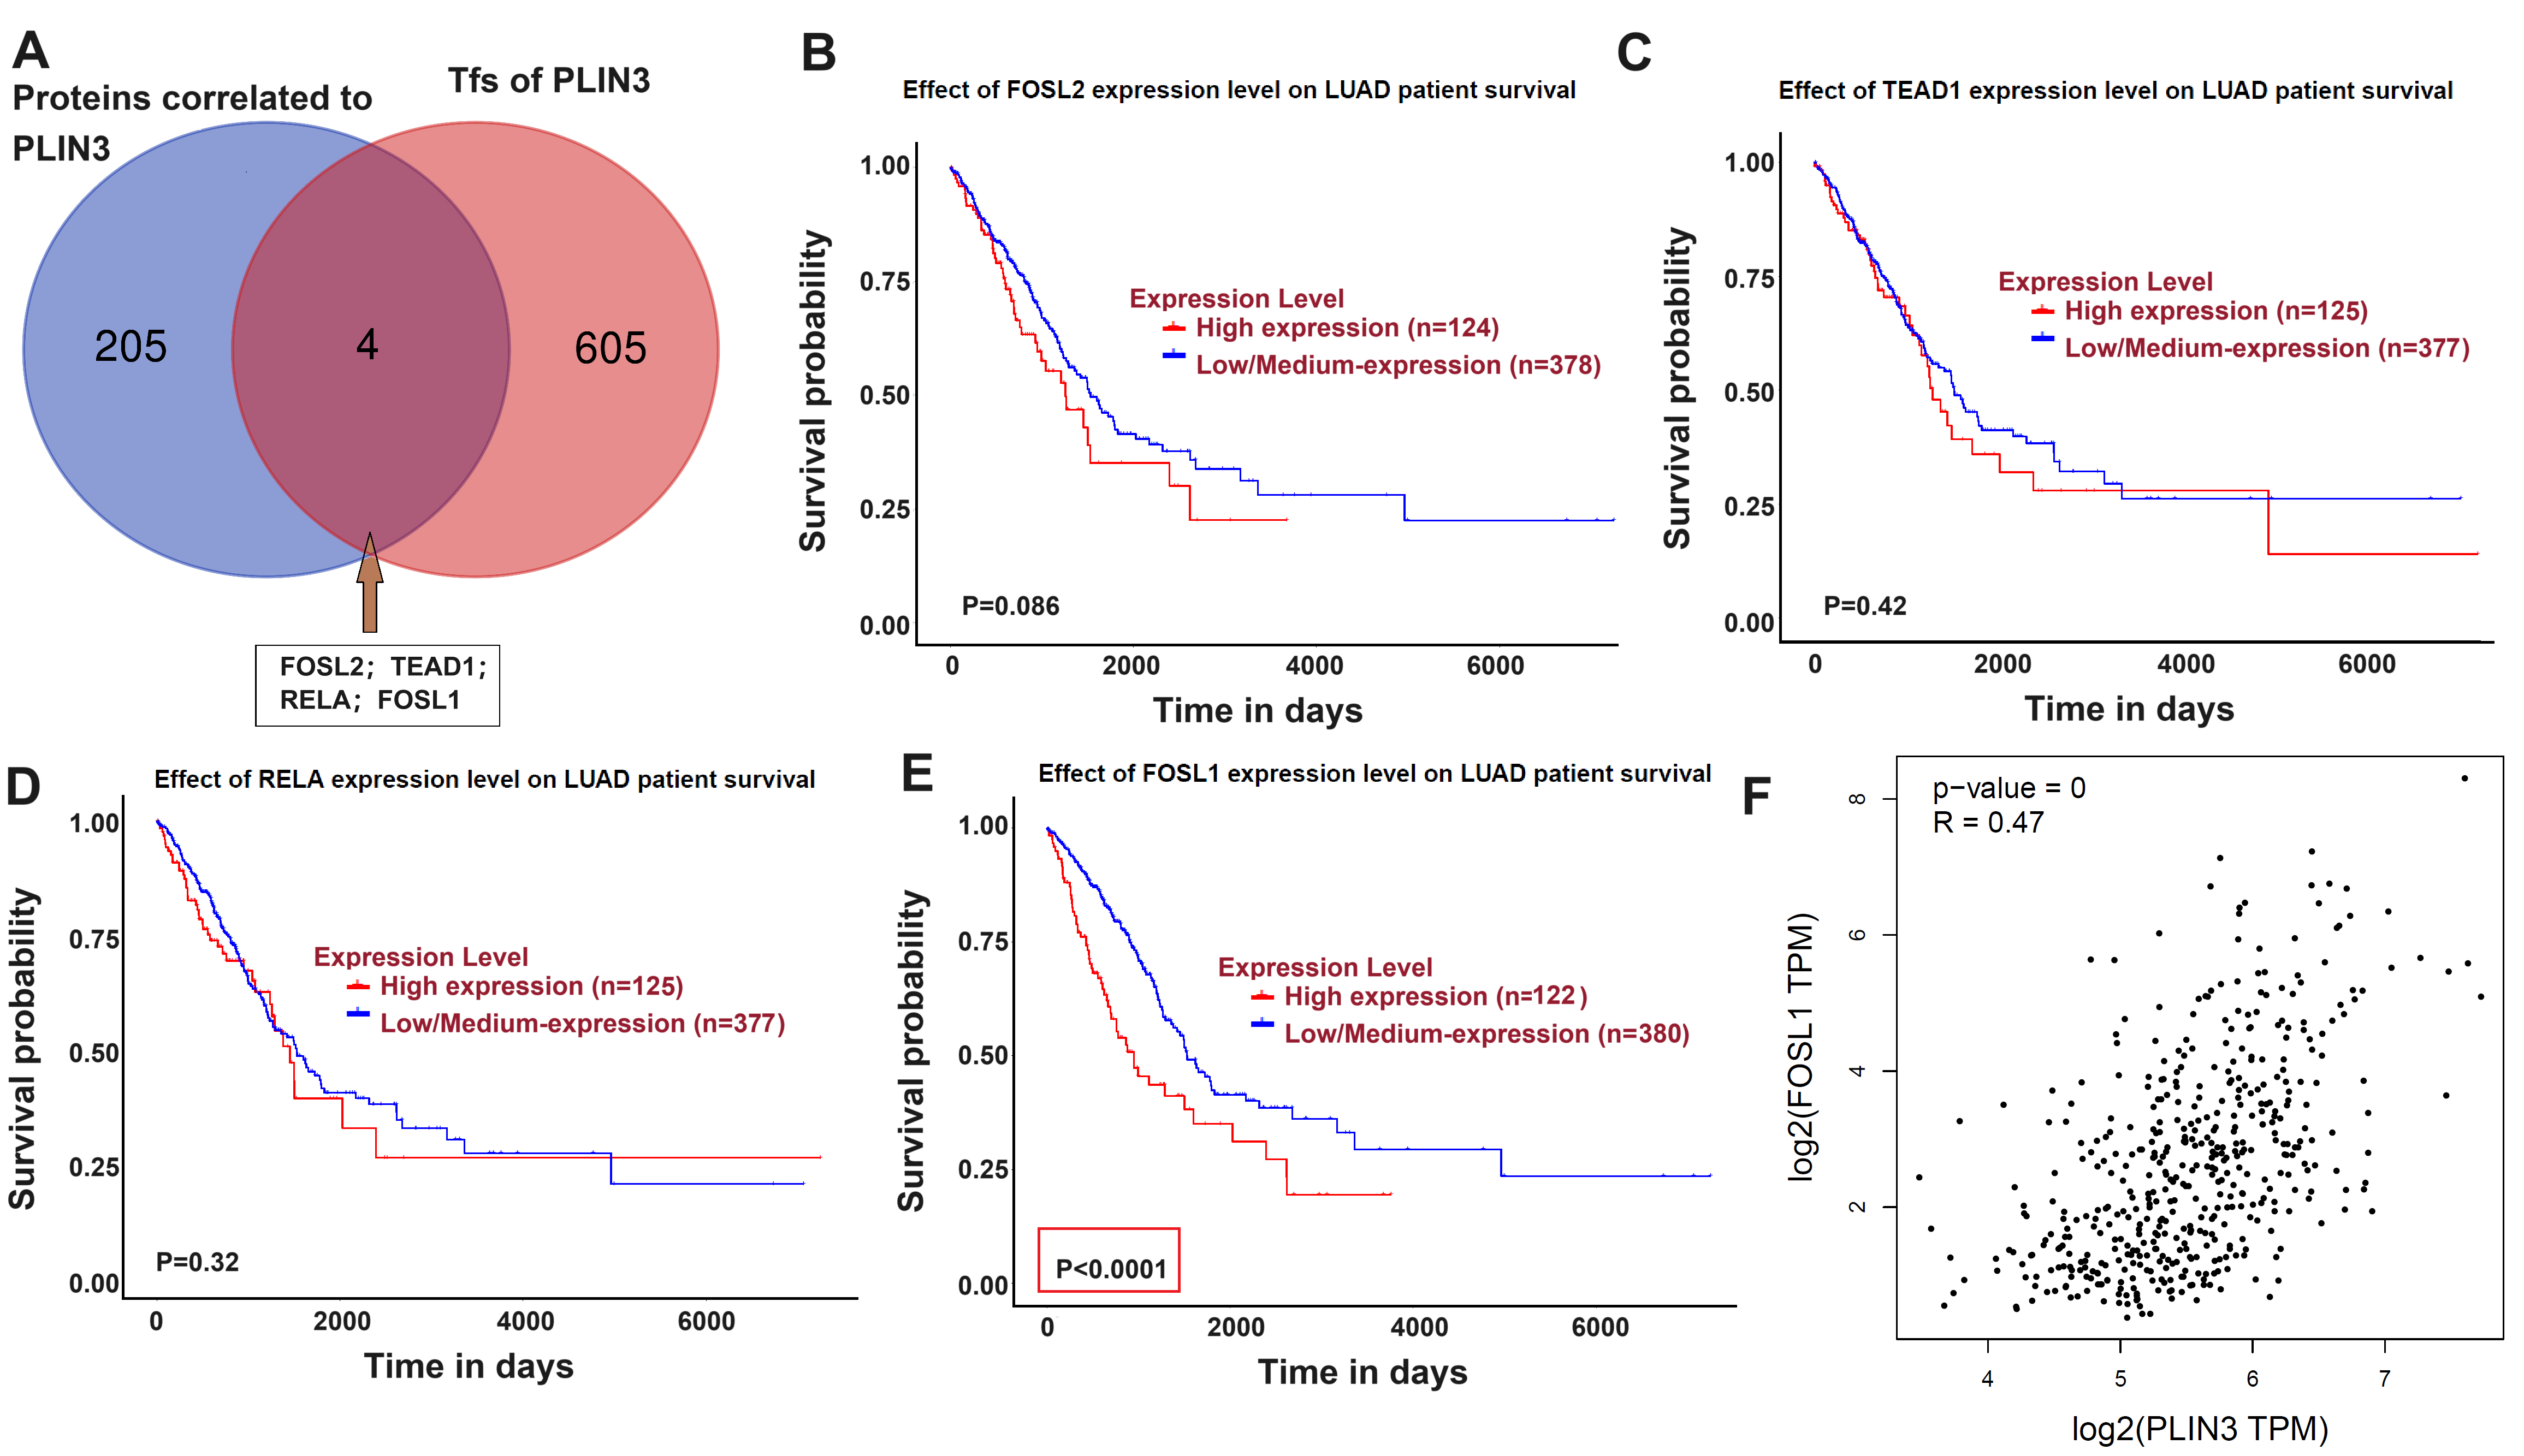 Fig. 4.
FOSL1 may regulate PLIN3 expression. (A) Intersection of
proteins correlated with PLIN3 and transcription factors regulating
PLIN3. Survival probabilities from the TCGA database for patients with
LUAD exhibiting high or low/medium expression of FOSL2 (B), TEAD1 (C), RELA (D),
and FOSL1 (E, p
Building on previous findings regarding FOSL1’s role in regulating PLIN3 expression, its impact on DDP resistance in LUAD cells was further investigated. FOSL1 translation and transcription levels were evaluated in normal lung cells and five NSCLC cell lines, with results revealing prominent FOSL1 expression across all NSCLC cells (Fig. 5A–C). H2030/DDP cells were incubated with FOSL1 siRNA, and the protein and mRNA levels of PLIN3 were subsequently quantified. The results showed that both the transcriptional and translational levels of PLIN3 were significantly reduced following FOSL1 knockdown (Fig. 5D–F). Additionally, H2030/DDP and H1775/DDP cells were transfected with siFOSL1, siPLIN3, or a combination of siFOSL1 and a PLIN3 overexpression plasmid (siFOSL1+OE-PLIN3), and changes in cell viability and IC50 values at varying DDP concentrations were monitored. FOSL1 and PLIN3 knockdown increased the susceptibility of both H2030/DDP and H1775/DDP cells to DDP, while PLIN3 overexpression mitigated the effects of FOSL1 knockdown (Fig. 5G–I). Further survival assessments revealed that siFOSL1 and siPLIN3 treatments significantly impaired cell viability, whereas PLIN3 overexpression counteracted the detrimental effects of FOSL1 knockdown on cell survival (Fig. 5J,K). These results highlight the role of FOSL1 in promoting DDP resistance in LUAD cells through the regulation of PLIN3.
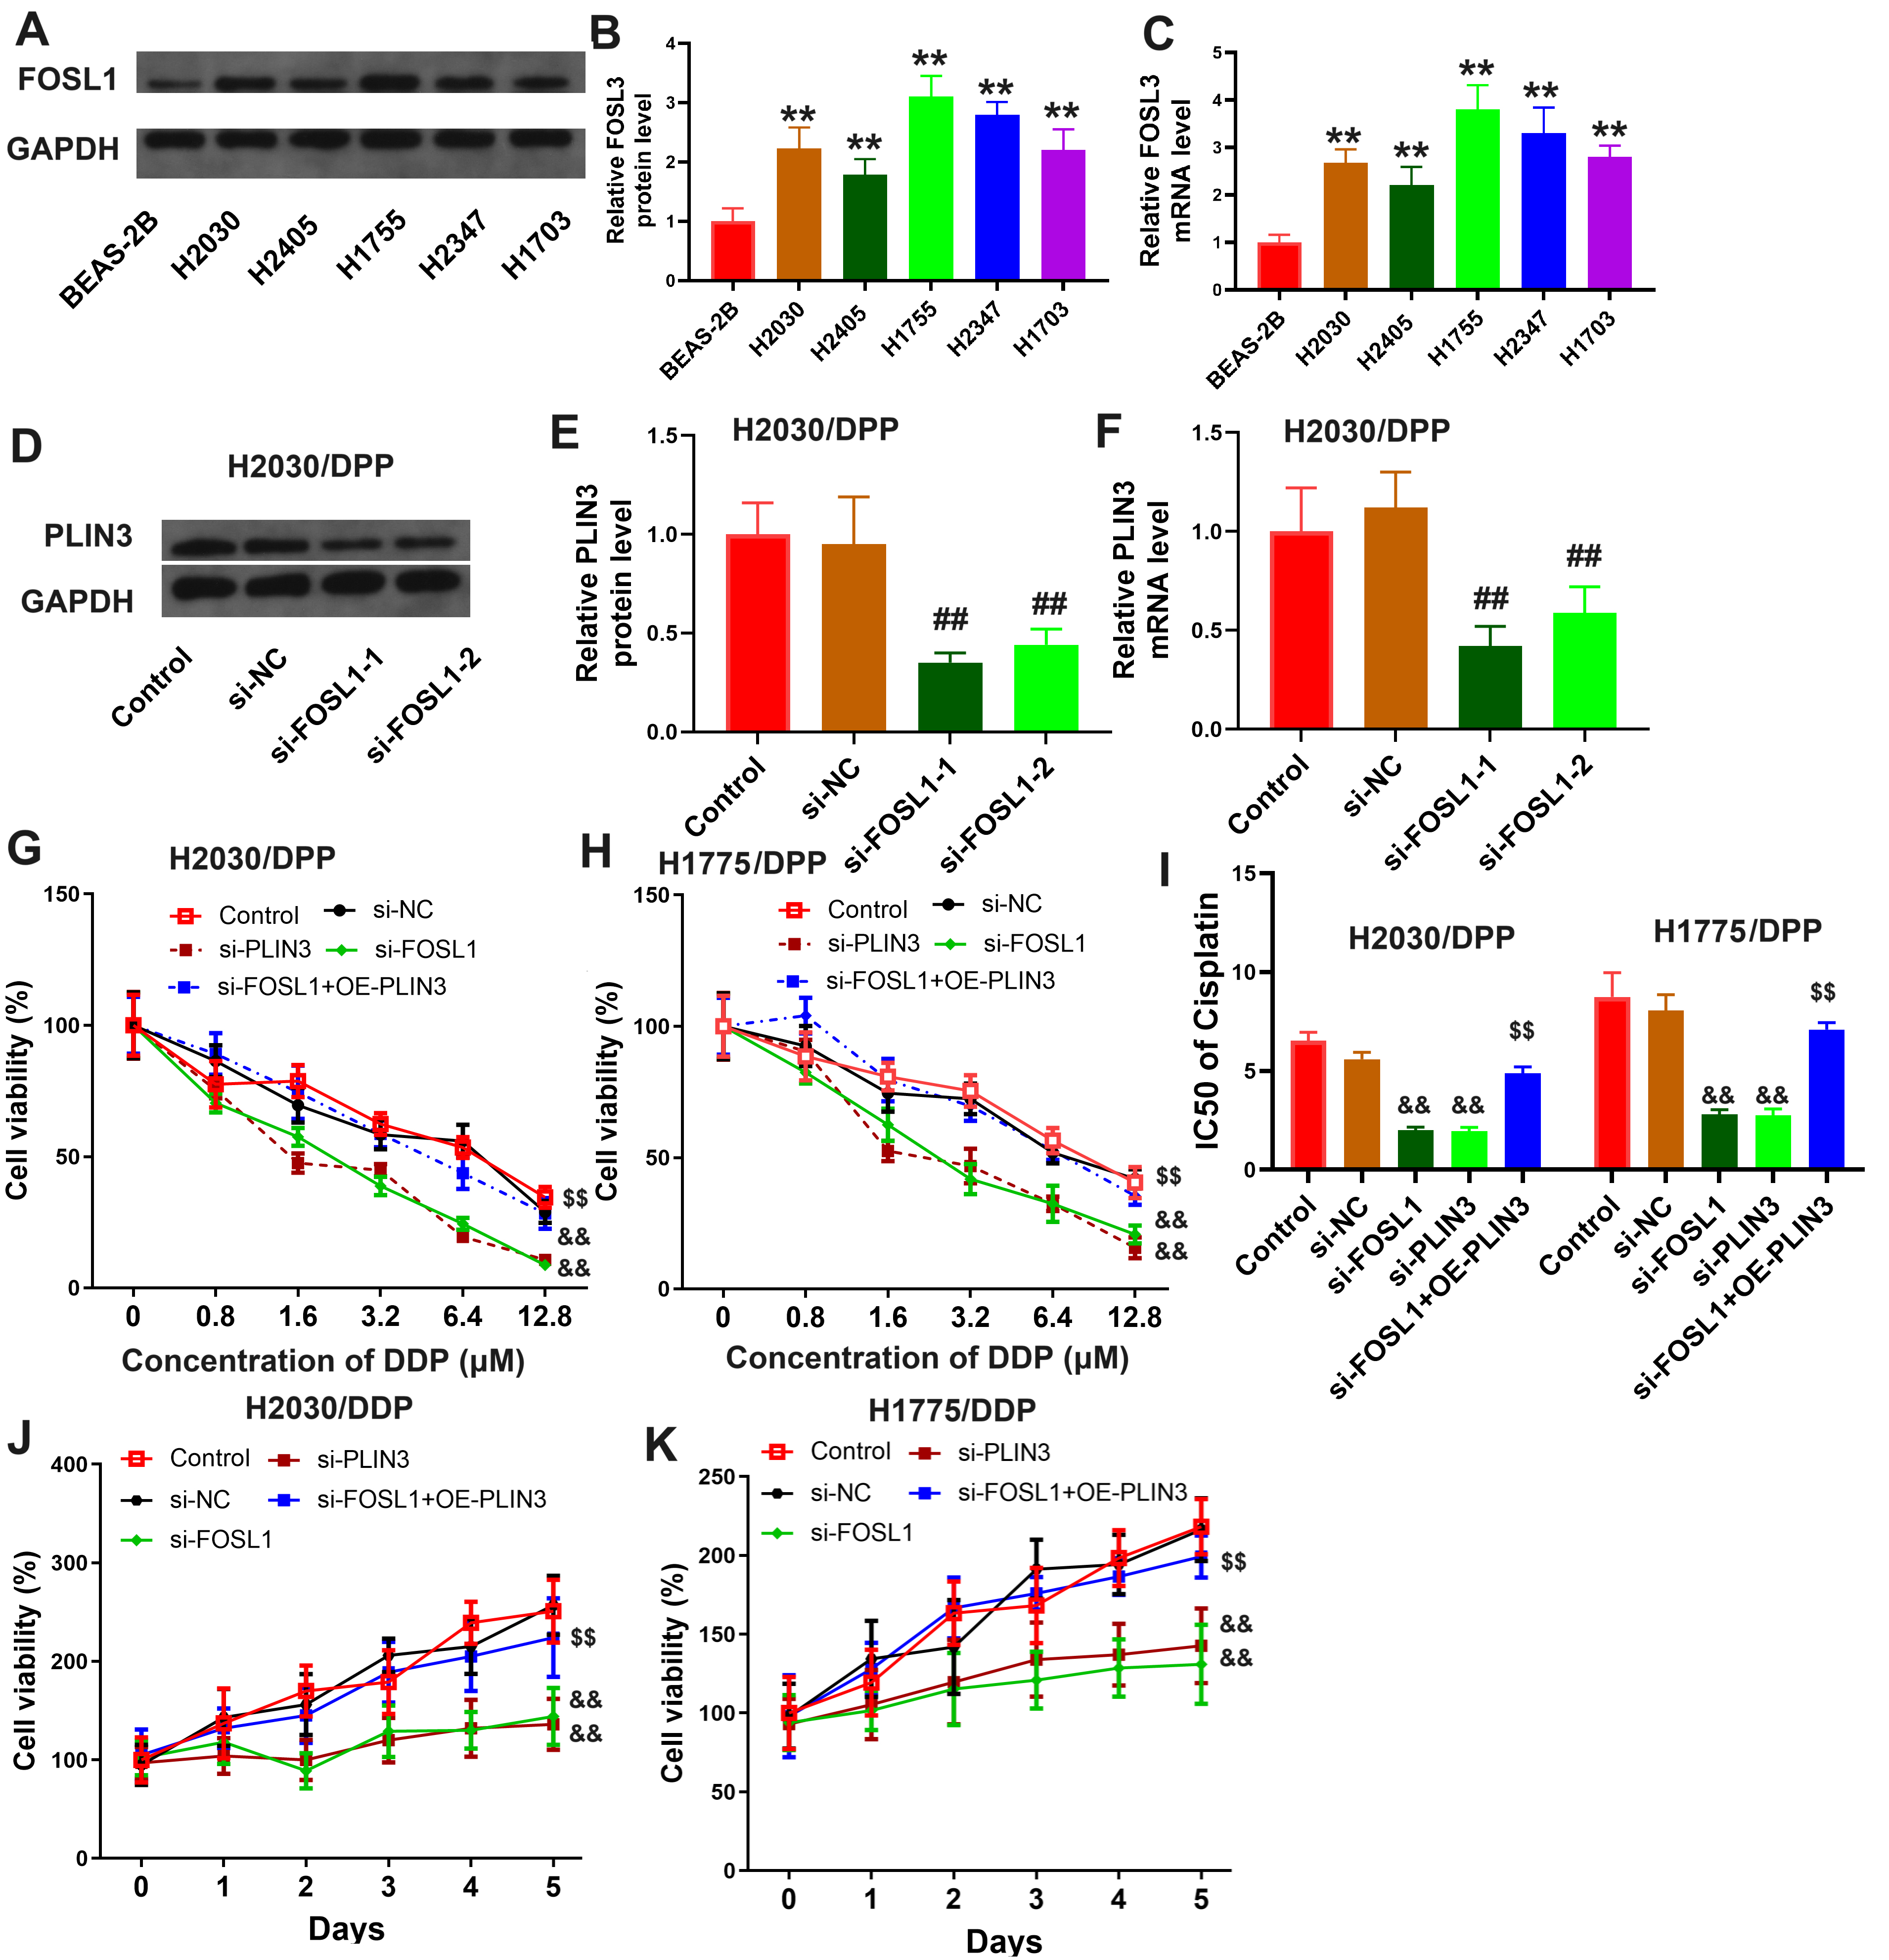 Fig. 5.
FOSL1 promotes DDP resistance in LUAD through mediation of
PLIN3. The translation (A,B) and transcription (C) levels of
FOSL1 in five NSCLC cell lines. The translation (D,E) and transcription
(F) levels of PLIN3 in H2030/DDP cells transfected with siNC or
siFOSL1. The cell vitality (G,H) and IC50 values (I) in gradient
DDP concentration of H2030/DDP and H1775/DDP cells treated with siFOSL1,
siPLIN3, or siFOSL1+OE-PLIN3. (J,K) The cell vitality
of H2030/DDP and H1755/DDP cells treated with siFOSL1, siPLIN3,
or siFOSL1+OE-PLIN3. **p
DDP-resistant LUAD cell lines were treated with siFOSL1,
siPLIN3, or siFOSL1+OE-PLIN3, and the number of cell
clones, along with protein levels of Wnt3a, intracytoplasmic
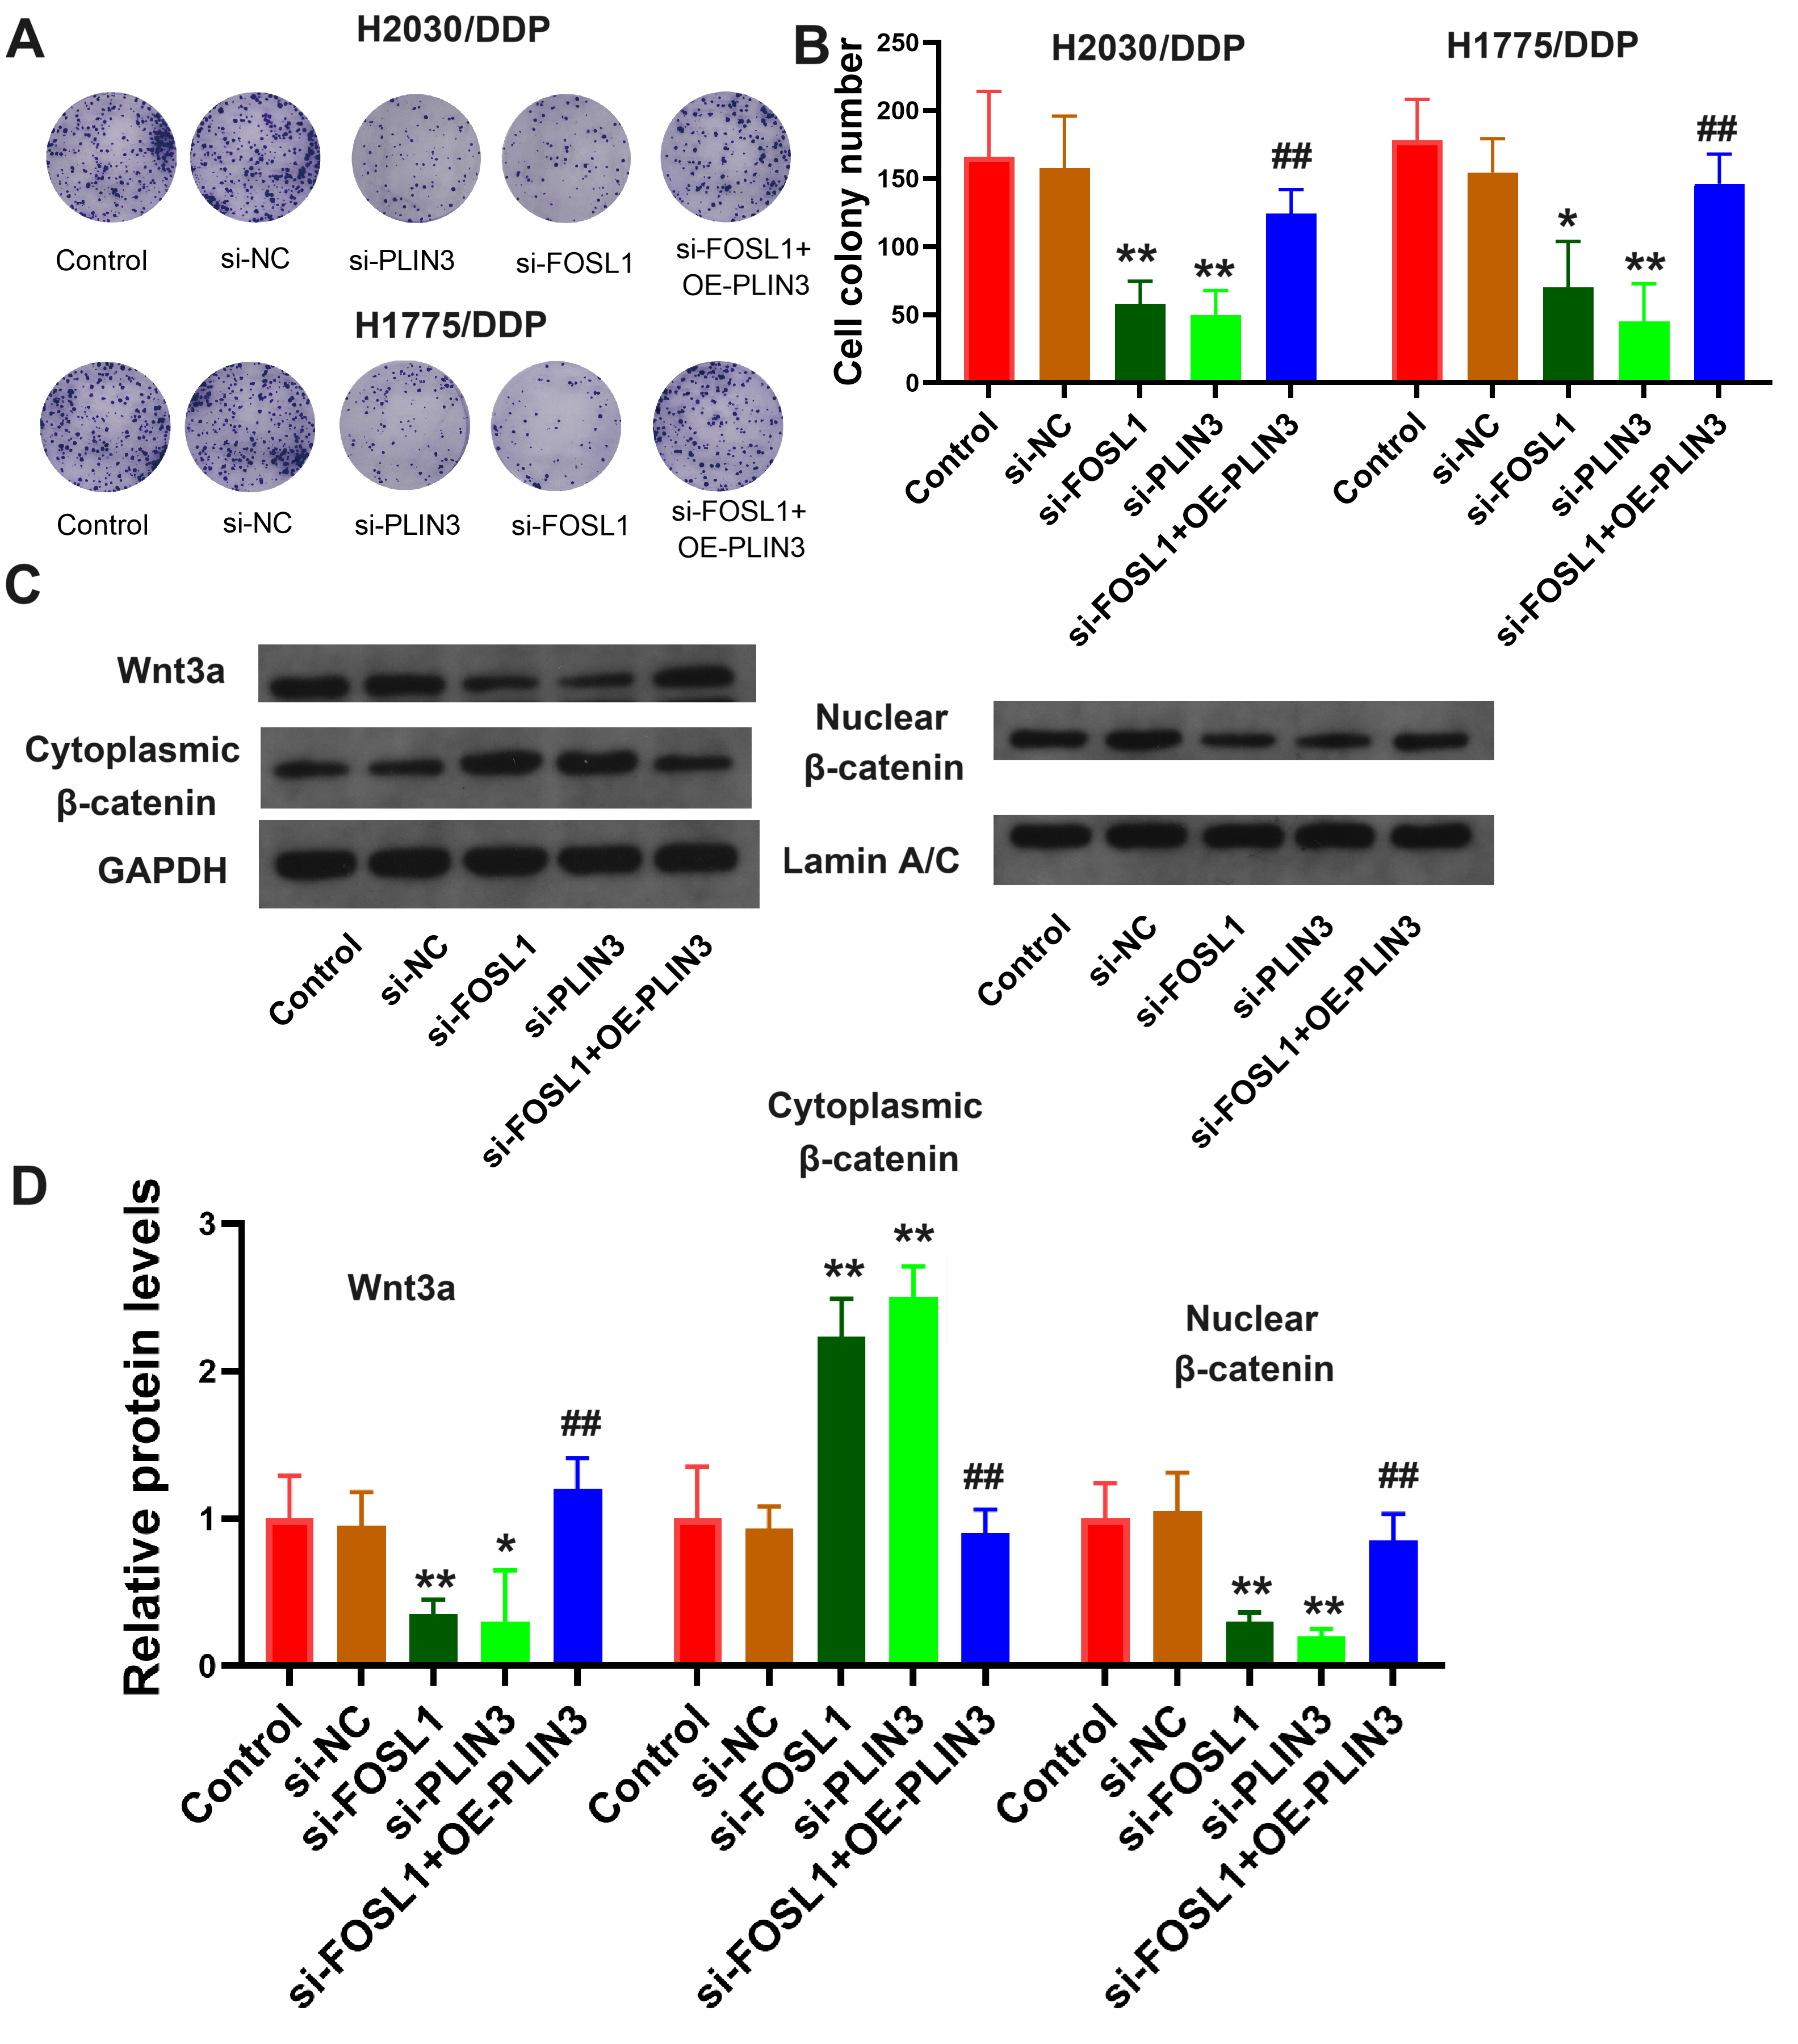 Fig. 6.
FOSL1 enhances the clonogenic potential of DDP-resistant LUAD
cells by triggering the Wnt3a/
To further investigate the sequence sites through which FOSL1 regulates PLIN3 expression, a search of the JASPER database identified three potential binding sites of FOSL1 on the PLIN3 promoter (P1-P3, Fig. 7A). The profile summary and sequence logo for FOSL1 were retrieved from the JASPER database (Fig. 7B). Chromatin immunoprecipitation (ChIP) assays confirmed that FOSL1 directly binds to the P1 sequence of the PLIN3 promoter in DDP-resistant cells (Fig. 7C,D). Furthermore, luciferase reporter assays performed in 293T, H2030/DDP, and H1775/DDP cells revealed a significant increase in PLIN3 promoter-driven reporter activity upon FOSL1 overexpression and a marked decrease following FOSL1 knockdown (Fig. 7E–G). These results indicate that FOSL1 enhances PLIN3 expression by directly binding to the P1 sequence of the PLIN3 promoter.
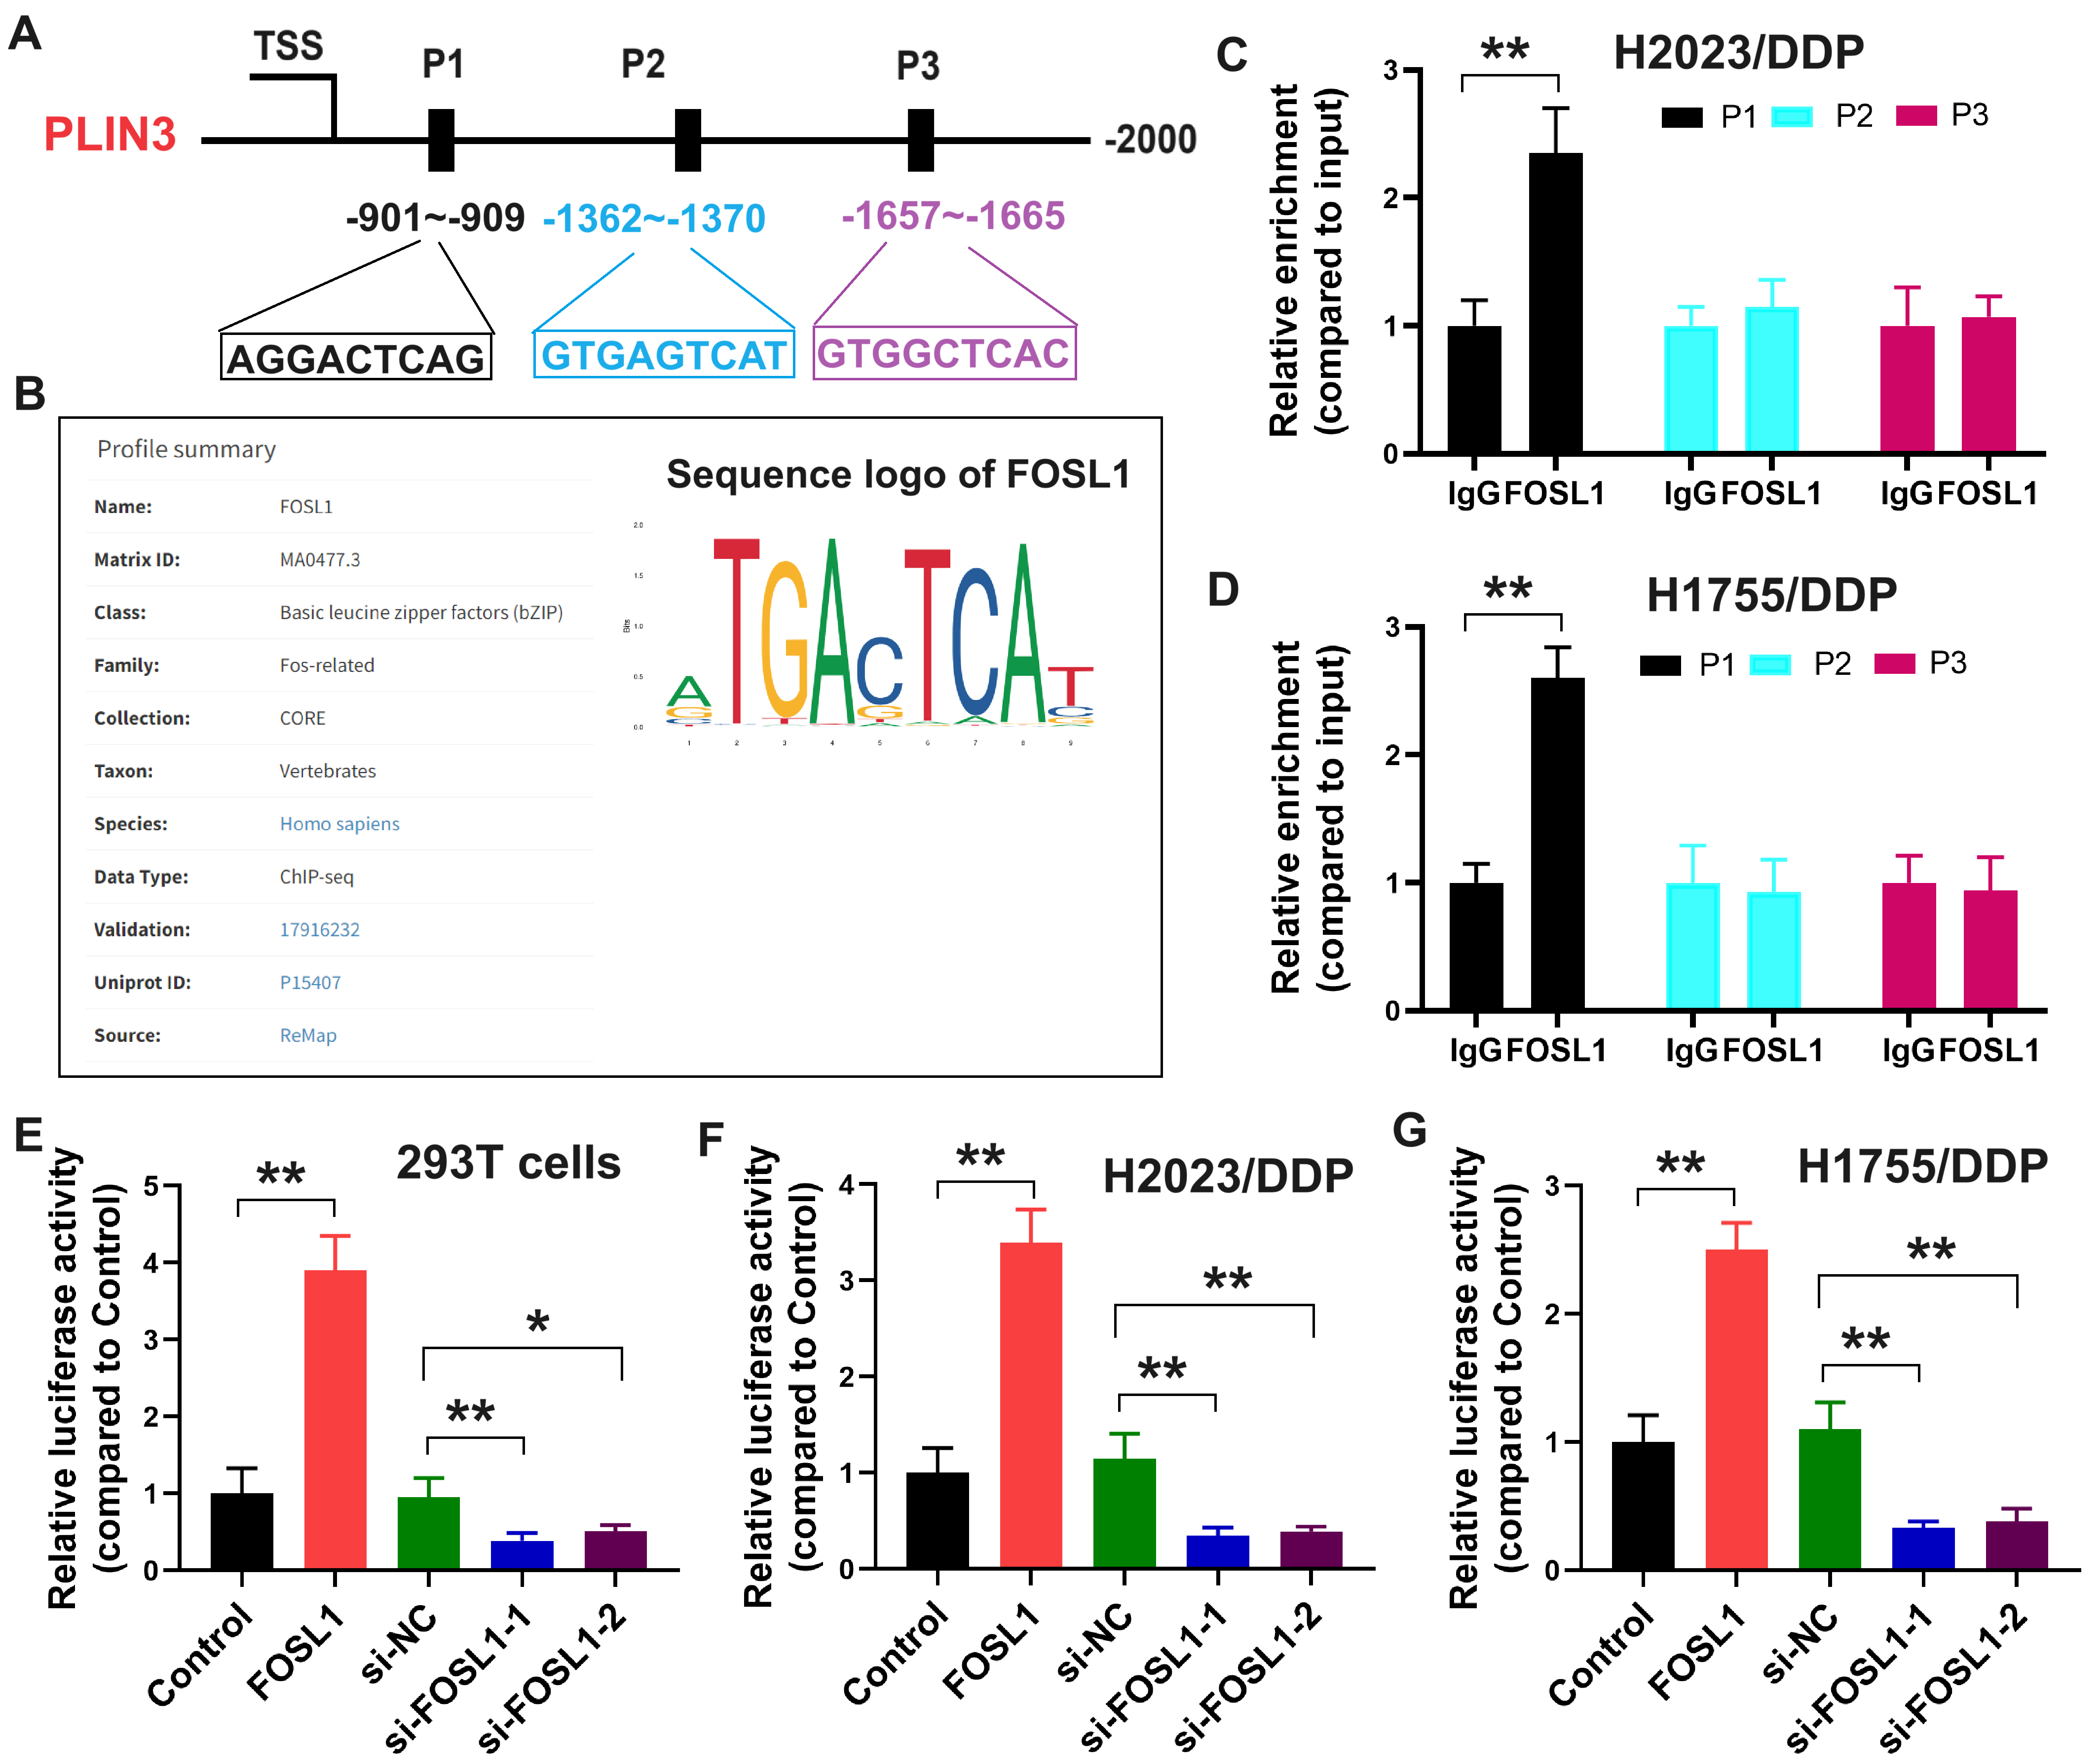 Fig. 7.
The transcription factor FOSL1 promotes PLIN3 expression via direct binding to the P1 sequence of the PLIN3 promoter. (A) The potential binding sequences of FOSL1 to the PLIN3 promoter identified by the JASPER database. (B) The profile summary and sequence
logo of FOSL1 from the JASPER database. (C,D) The validation of the potential
binding sequences of FOSL1 to the PLIN3 promoter by chromatin
immunoprecipitation assay in two cell lines. Luciferase reporter assays of
PLIN3 transcriptional activity following FOSL1 overexpression
and knockdown in 293T (E), H2030/DDP (F), and H1775/DDP (G) cells. *p
To assess the in vivo impact, H2030/DDP cells were treated with FOSL1 siRNA in combination with PLIN3 or Wnt3a overexpression plasmids (OE-PLIN3 or OE-Wnt3a) and subcutaneously implanted into nude mice. Tumor growth was monitored following intraperitoneal administration of DDP (2 mg/kg) twice a week. The results showed that FOSL1 knockdown significantly suppressed tumor growth and weight in the subcutaneous model, whereas overexpression of PLIN3 or Wnt3a reversed this effect (Fig. 8A–C). These in vivo data confirm that FOSL1 promotes DDP resistance in LUAD through upregulation of PLIN3 and Wnt3a.
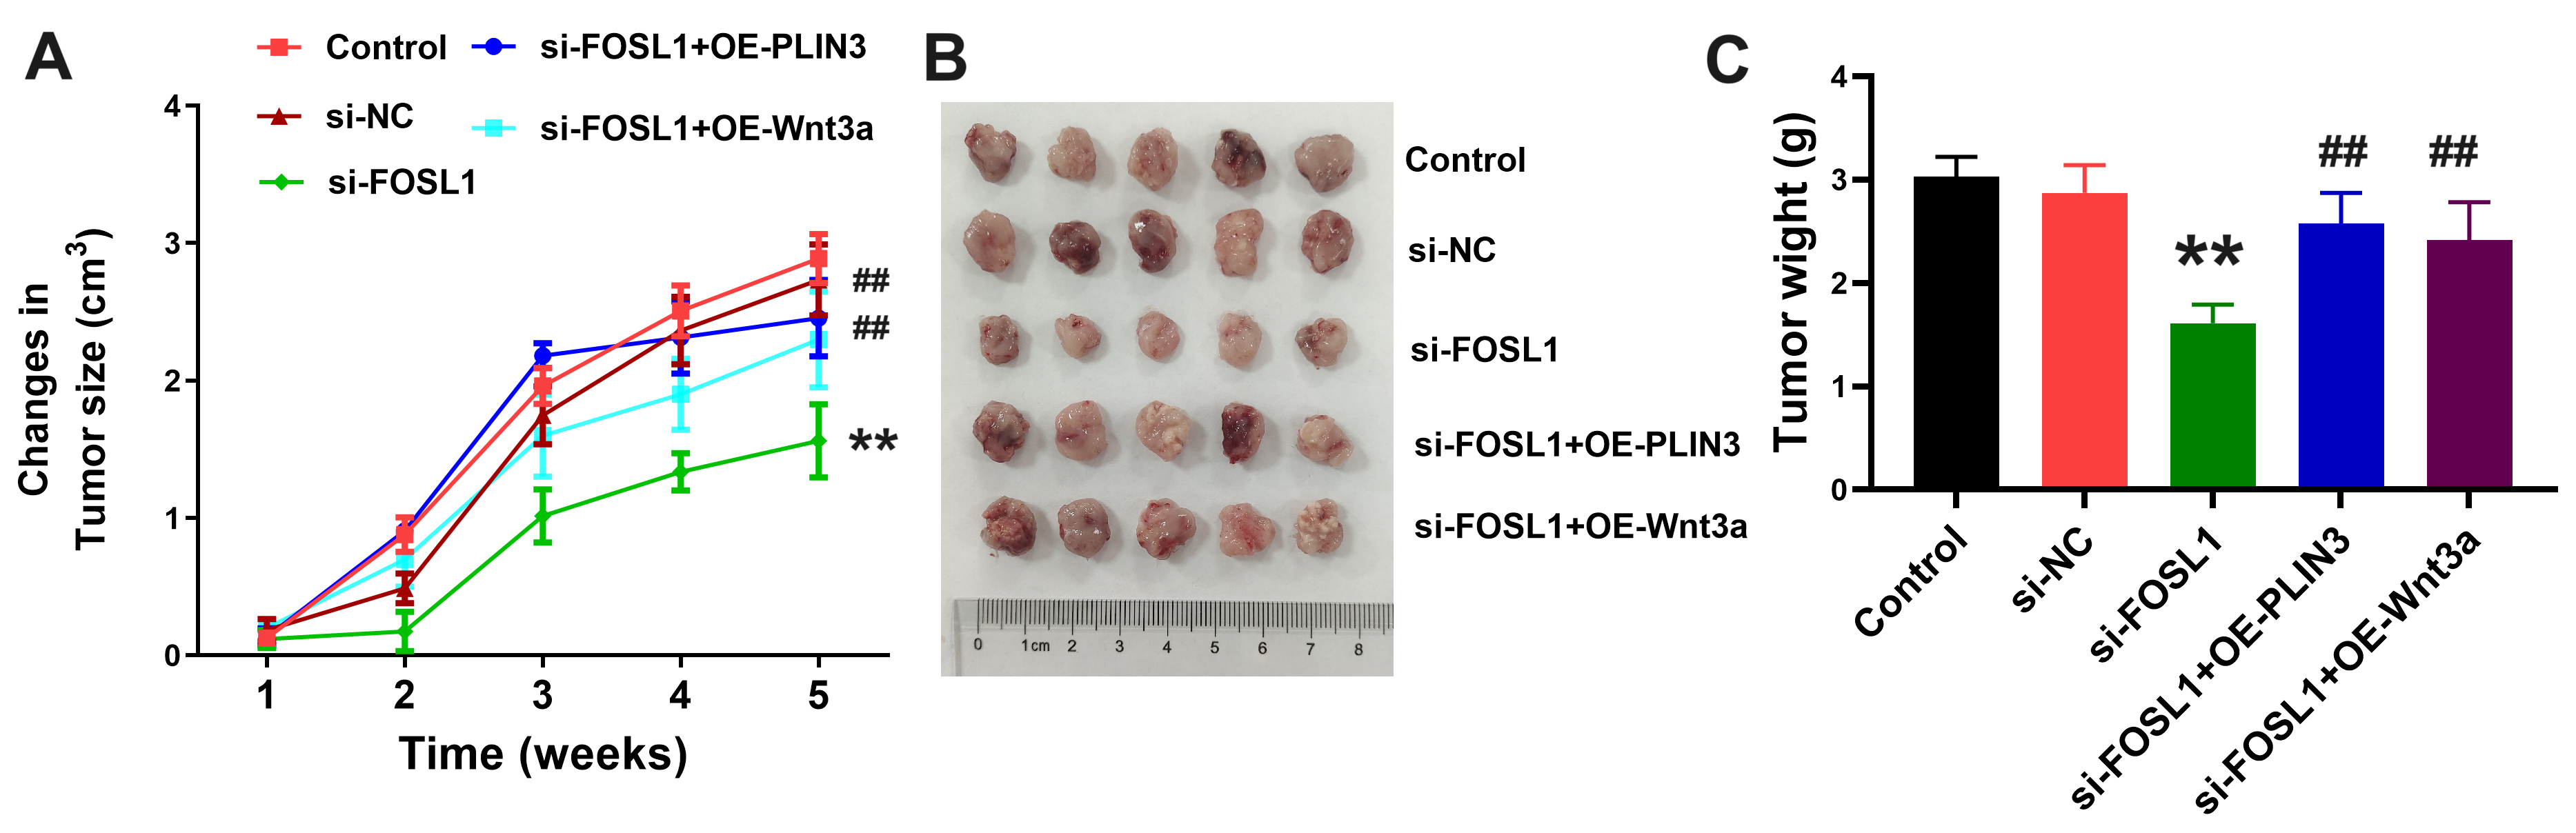 Fig. 8.
Validation of FOSL1, PLIN3, and Wnt3a in mediating LUAD DDP
resistance in vivo. (A,B) The growth rate of subcutaneous tumors
following intraperitoneal administration of DDP in nude mice. (C) The weight of
subcutaneous tumors following intraperitoneal administration of DDP in nude mice.
**p
LUAD, the most prevalent subtype of lung cancer, presents significant diagnostic challenges due to its often asymptomatic early stages, which contribute to delayed detection and poor prognosis [2, 26, 27, 28, 29]. At advanced stages, systemic therapies, including chemotherapy, remain the primary treatment options [29, 30, 31, 32]. DDP-based chemotherapy is a cornerstone of LUAD management [33, 34], with initial responses typically promising; however, the eventual development of resistance significantly limits its long-term effectiveness [8, 35]. Notably, DDP resistance is more pronounced in LUAD compared to LUSC [7, 8], emphasizing the urgent need for a deeper understanding of the underlying biological mechanisms of DDP resistance to develop more effective therapeutic strategies.
One key factor implicated in cancer progression and chemoresistance is LD accumulation, commonly observed in cancer cells [10, 16, 36]. LDs, as the primary organelles responsible for storing neutral lipids in eukaryotic cells, play critical roles in cellular metabolism, membrane synthesis, and steroidogenesis [10, 14, 15, 16]. Additionally, they are closely linked to various cancer-related processes, including tumorigenesis, invasion, metastasis, and chemoresistance [10, 16]. PLIN3, located on the surface of LDs, is essential for LD formation, structural integrity, and functional regulation [37, 38]. Overexpression of PLIN3 has been associated with poor prognosis in multiple cancers, including breast cancer, clear cell renal cell carcinoma, and hepatocellular carcinoma [18, 19, 20]. Our study demonstrates that PLIN3 is significantly upregulated in LUAD and that its overexpression correlates with unfavorable clinical outcomes. Notably, PLIN3 elevation is involved in the development of DDP resistance in LUAD, likely through the regulation of lipid metabolism, thereby supporting cancer cell survival under chemotherapy-induced stress.
The Wnt signaling pathway, a highly conserved system, regulates cell
proliferation and differentiation, primarily by stabilizing cytoplasmic
This study identifies FOSL1 as the sole transcription factor significantly
associated with both PLIN3 expression and reduced survival in patients with LUAD.
FOSL1, a subunit of the AP-1 transcription factor complex, plays a critical role
in cell differentiation, stress response, and tumorigenesis [44]. Previous
research has demonstrated that FOSL1 is pivotal in the progression of lung
cancer, particularly in KRAS-mutant variants, where its elevated expression
correlates with poor prognosis [45]. Mechanistically, FOSL1 promotes KRAS-driven
lung cancer by regulating survival genes and amphiregulin expression [46].
However, its role in tumor drug resistance has remained largely unexplored. In
this study, the direct interaction between FOSL1 and the PLIN3 promoter was
further confirmed. A combination of in vitro and in vivo
experiments demonstrated that FOSL1 regulates PLIN3 transcription, subsequently
activating the Wnt3a/
Several limitations of this study should be acknowledged. First, the reliance on
bioinformatics databases for analyzing PLIN3 expression and its correlation with
patient prognosis may introduce potential bias or inaccuracies. Second, the use
of in vitro cell line models to investigate the mechanisms of PLIN3 in
DDP resistance may not fully capture the complexity of tumor biology in patient
tissues. Third, the findings are primarily based on experiments conducted in cell
lines, which may not accurately represent the in vivo tumor
microenvironment. The effects of PLIN3, FOSL1, and Wnt3a/
In conclusion, this study establishes that PLIN3 promotes DDP resistance in LUAD
by stimulating the Wnt3a/
The data supporting our results are available from the GEPIA database (http://gepia2.cancer-pku.cn/#survival), Kaplan-Meier Plotter database (https://kmplot.com/analysis/) and the UALCAN database (https://ualcan.path.uab.edu/) and from the corresponding author upon reasonable request.
WNT: Conceptualization, Investigation, Writing—original draft, and Data curation; JJS: Conceptualization and Investigation; HBW: Conceptualization, Investigation, Resources; YHH: Investigation, Visualization, Validation; CXW: Data curation; MR: Methodology; JL: Methodology; DLX: Validation; JGD: Data curation; HW: Formal analysis, Visualization; DMZ: Formal analysis; BS: Resources, Validation; ZGC: Conceptualization, Project administration, Supervision, and Writing—review & editing. All authors contributed to editorial changes in the manuscript. All authors read and approved the final manuscript. All authors have participated sufficiently in the work and agreed to be accountable for all aspects of the work.
The animal procedures were approved by the Animal Ethics Committee of the PLA Navy Medical Center (Approval number AF-HEC-069), adhered to the Animal Research: Reporting of In Vivo Experiments (ARRIVE) guidelines 2019. The clinical study involving human participants was approved by the Ethics Committee of the PLA Navy Medical Center (Approval number AF-HEC-068), and all patients or their families/legal guardians provided written informed consent. The study was carried out in accordance with the guidelines of the Declaration of Helsinki.
Not applicable.
This research received no external funding.
The authors declare no conflict of interest.
During the preparation of this work, the authors used ERNIE Bot to check spelling and grammar (mainly Discussion section). After using this tool, the authors reviewed and edited the content as needed and take full responsibility for the content of the publication.
Supplementary material associated with this article can be found, in the online version, at https://doi.org/10.31083/FBL26898.
References
Publisher’s Note: IMR Press stays neutral with regard to jurisdictional claims in published maps and institutional affiliations.