


 , Satya Srirama Karthik Divvela 1, Victoria Clare Williams-Ward 2, Beate Brand-Saberi 1,*
1 Department of Anatomy and Molecular Embryology, Institute of Anatomy, Ruhr-University, 44801 Bochum, Germany
2 Randall Centre for Cell & Molecular Biophysics, King’s College London, SE1 9RT London, UK
Abstract
The basic helix-loop-helix (bHLH) transcription factor atonal homologue 8 (Atoh8) has been implicated in various developmental and physiological processes by means of transient knockdown and conditional knockout approaches in zebrafish, chick and mouse. Despite its demonstrated involvement in multiple tissues, the role of Atoh8 remains elusive in zebrafish. A recent permanent knockout study in zebrafish investigated the role of Atoh8 on the background of previous morpholino studies which demonstrated various developmental defects but could not find any of the morpholino-based effects in the mutant. In mice, a knockout study demonstrated involvement of the transcription factor in skeletal development, showing that disruption of the atoh8 gene results in reduction of skeletal size. We investigated a mutant fish line generated using clustered regularly interspaced short palindromic repeats (CRISPR)/CRISPR-associated protein 9 (Cas9) (CRISPR/Cas9)-technology for possible phenotypic effects on zebrafish skeletogenesis.
Here, we present a CRISPR/Cas9-generated atoh8 permanent zebrafish mutant and investigate the phenotypic effects of the knockout on the developing zebrafish craniofacial and axial skeleton. We investigated the expression pattern of the gene in wildtype and conducted detailed morphometric analysis for a variety of bone and cartilage elements of the developing skeleton at 12 days post fertilisation (dpf) in zebrafish siblings from a heterozygous mating using detailed morphometric measurements and statistical analysis of the results.
Homozygous mutants are viable into late adulthood and show no overt morphological phenotype. Despite the prominent appearance of atoh8 signal in various embryonic and larval craniofacial and axial skeletal structures, detailed morphometric analysis revealed only subtle phenotypic effects of the mutation on skeletal development in zebrafish. We found the formation of the orbital cartilages of the developing neurocranium and the progress of chordacentra mineralisation to be negatively affected by loss of the transcription factor.
Despite the very subtle phenotypic effect of our mutation, we were able to show involvement of atoh8 in the skeletal development of zebrafish. We attribute the mild phenotype to a compensatory mechanism induced by nonsense-mediated degradation of messenger ribonucleic acid (mRNA) as suggested in the recent literature. The effect of atoh8-disruption on zebrafish skeletal development suggests that the loss of atoh8 cannot be compensated for at interfaces where more than one embryonic cell lineage contributes to bone and cartilage formation.
Keywords
- atoh8
- zebrafish
- craniofacial development
- axial skeleton
- centra formation
- mesoderm
- neural crest
atoh8 has been shown to be expressed in many embryonic and adult tissues where it regulates a wide range of physiological processes [1, 2, 3, 4, 5, 6, 7, 8, 9]. More recent studies have shown expression of the transcription factor in tissues of the developing and adult skeleton in mice, demonstrating the effect of Atoh8 mutation on proliferation and differentiation of skeletal cells [10, 11]. Based on these findings and on our own previous expression study [12], we investigated a possible role of atoh8 in skeletal development of zebrafish.
The skeleton of the zebrafish consists, like in all vertebrates, of cranial, axial and appendicular elements [13, 14]. In many aspects, zebrafish and mammalian skeletogenesis encompass the same cellular and morphological processes of bone and cartilage formation [15, 16]. The similarities are furthermore reflected by the high degree of conservation at the molecular level, with mammals and teleosts sharing the same key regulatory genes and signalling pathways of skeletal development [17, 18, 19, 20, 21, 22]. Importantly, the zebrafish genome shares over 70% of the human genes [23], including orthologs of skeletogenesis-related genes. In addition, zebrafish offers many advantages as alternative to other vertebrate models. For example, external fertilisation and development allows for easy genetic manipulation, the effects of which can be readily observed in the transparent embryos and larvae. Furthermore, the high fecundity of the fish allows for a large sample size, making zebrafish an attractive and powerful model for large-scale investigations of skeletal development and disorders.
The first skeletal components to develop in zebrafish are the bone and cartilage elements of the head. Craniofacial development is considered one of the most complex sequences of morphological and molecular events in embryology and encompasses the contribution of cells derived from all three embryonic germ layers and its finely tuned regulation by signalling pathways [17, 18, 20, 21, 24]. Its complexity is mirrored in the enormous interspecies diversity in morphology of the adult face and skull. Despite the great variety in the final outcome, however, the underlying signalling pathways have been highly conserved in vertebrates from fish to man, as supported by studies of normal and disrupted signalling in craniofacial development in model organisms and their definitive association with human conditions [18, 19, 24].
Like in their higher vertebrate counterparts, the embryonic precursor of the zebrafish craniofacial skeleton consists of two different units: the viscerocranium formed by the embryonic branchial arches and giving rise to the facial elements, and the neurocranium, the embryonic precursor of the protective braincase. As in higher vertebrates, the zebrafish craniofacial skeletal components are of dual mesenchymal origin: some derive solely from neural crest, others are derived entirely from mesoderm or a mixture of the two cell lineages [25, 26, 27, 28]. Most of the current knowledge on the development of the craniofacial skeleton is derived from studies on mouse and chick, and, from these studies, it is generally acknowledged that the viscerocranial elements are derived from the migratory neural crest, while the neurocranial elements are either of mixed neural crest and mesoderm origin or entirely derived from mesoderm [25, 29, 30, 31, 32, 33, 34, 35, 36].
Unlike in higher vertebrates, vertebral centra formation in the axial skeleton of teleosts, including zebrafish, starts in absence of cartilage anlagen through segmented mineralisation of the notochord by chordoblasts [37, 38, 39, 40, 41]. These initial chordacentra are then surrounded by somitic mesoderm-derived osteoblasts, which deposit bone matrix to form the autocentrum [37, 42, 43, 44, 45, 46].
In zebrafish, the head skeleton is composed of 74 bones, of which 43 are derived from a cartilage template and 31 form by direct ossification [14]. While many of the bones in zebrafish, particularly those forming the cranial vaults, develop late after the embryonic period in comparison to their mammalian counterparts, the skeletal elements derived from the branchial arches, associated with feeding and breathing, form as cartilage templates very early from 2 days post fertilisation (dpf) [26, 27, 47, 48, 49, 50, 51]. By approximately 5 dpf, the zebrafish larva has acquired the ability to feed independently, owing to the formation of cartilage components of the feeding apparatus. At about this stage, first signs of ossification become apparent in the ceratobranchial cartilage (cb) 5 of the viscerocranium [14]; in contrast, the last bones to develop are the calvariae, the bony plates of the skull vault, progressively forming via dermal ossification during the second month of life [14, 52, 53, 54]. By 10 to 12 dpf, all the cartilage components have developed, and the beginning of ossification is well underway in the larval zebrafish head (Fig. 1).
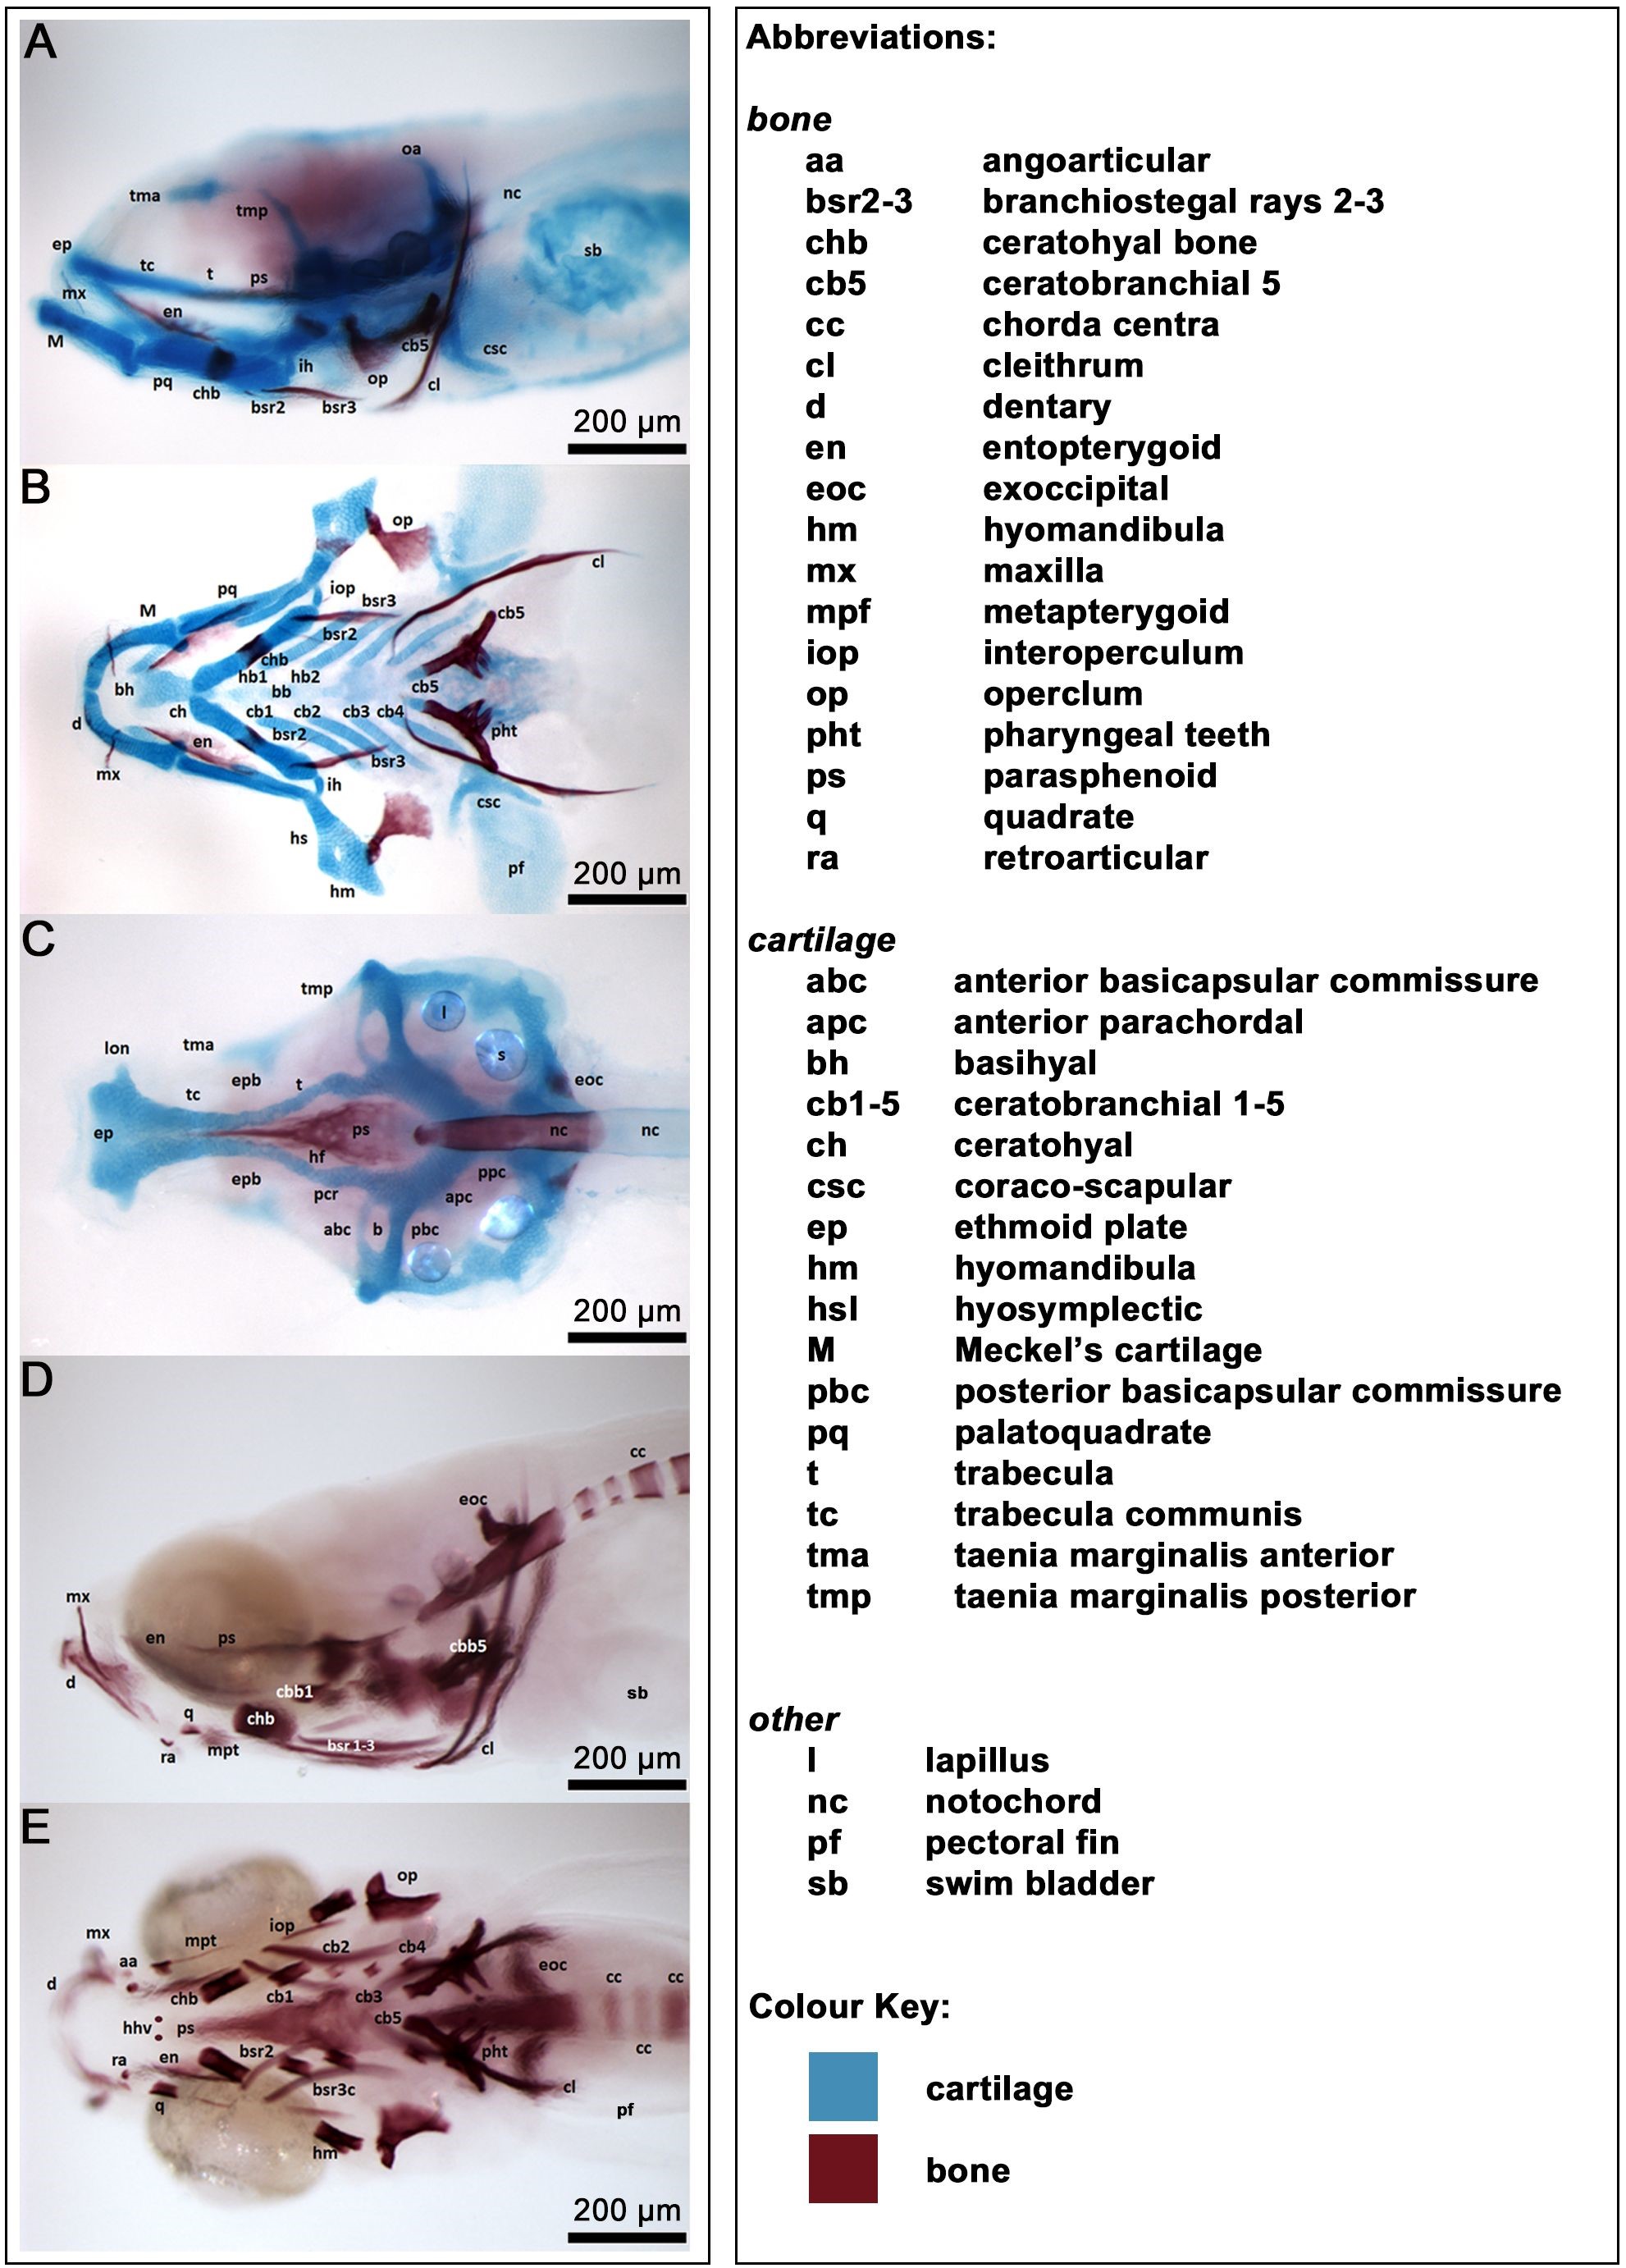 Fig. 1.
Bone and cartilage structures of the larval zebrafish cranium. Alizarin Red and Alcian Blue staining of bone and cartilage structures in larvae at 12 dpf. The different level of ossification in the two larvae shown reflects the intrastrain variation in the progression of ossification. Anterior to the left, dorsal up. (A,D) Lateral view. (B,C,E) Ventral views of dissected skull (B) and jaw (C) and undissected head (E). Scale bars: 200 µm.
Given the recent findings of a role of Atoh8 in mouse skeletogenesis [10], we aimed in this study at exploring a possible contribution of atoh8 in zebrafish skeletogenesis. We present a detailed morphometric and statistical analysis of craniofacial and axial structures of the developing zebrafish skeleton and propose that the transcription factor subtly participates in the formation of the orbital cartilages in the zebrafish cranium and modulates chordacentra formation in the developing zebrafish vertebral column.
In-house bred zebrafish (Danio rerio) adults and larvae were maintained at 26.5 °C on a 14 h light/10 h dark cycle and fed daily with flakes and artemia salina. Embryos were collected and raised to the desired stages at 28.5 °C in E3 medium supplemented with 0.01% methylene blue for in situ hybridisation.
Mutagenesis was performed on wildtype AB zebrafish lines. atoh8-mutant zebrafish were generated using clustered regularly interspaced short palindromic repeats (CRISPR)/CRISPR-associated protein 9 (Cas9) (CRISPR/Cas9) genome editing as described by Hwang et al. [55, 56]. Additional data on the procedure can be found in Supplementary Tables 1,2 and Supplementary Figs. 1,2.
Suitable CRISPR target sites in the first coding exon were selected and potential off-targets minimized using the ZiFiT tool [57]. The corresponding DNA-oligos for synthesis of guide RNA (gRNA) were purchased from IDT (Integrated DNA Technologies, Leuven, Belgium). For each target site, optimised flanking primers of 20–22 bases were selected with Primer 3 free online software (https://primer3.ut.ee/) generating an 80–120 bp polymerase chain reaction (PCR) product for High Resolution Melt Analysis (HRMA) and a 200–400 bp amplicon for DNA sequencing. Primer oligos were bought from MWG Eurofins (Wolverhampton, UK).
Single stranded gRNA oligos were annealed and ligated into BsaI-digested pDR274 (Addgene, Watertown, MA, USA). XL-1 Blue cells (Stratagene, La Jolla, CA, USA) were transformed with the ligation reaction and single colonies were selected for growth of bacterial cultures. Plasmids were isolated using the QIAprep Spin Miniprep Kit (QIAGEN, Manchester, UK) according to the manufacturer’s instructions. Purified plasmids were sequenced and confirmed positive clones were digested with DraI. The 284 bp fragment was gel-purified and used to synthesise gRNA with T7 RiboMAX large scale RNA production kit (Promega, Southampton, UK) and the product was purified with NORGEN BIOTEK microRNA Purification Kit (Thorold, Ontario, Canada) and quantified by Nanodrop® (Thermo Fisher Scientific, Carlsbad, CA, USA).
For synthesis of cas9 messenger ribonucleic acid (mRNA), pCS2-Cas9 (Addgene, Watertown, MA, USA) was NotI linearised (Promega, Southampton, UK), purified (Wizard® SV Gel and PCR Clean-Up System, Promega, Southampton, UK) and transcribed using the mMessage mMachine SP6 kit (Ambion, Huntingdon, UK). Synthesised Cas9-mRNA was purified using the MEGAclear™ kit (Ambion, Huntingdon, UK).
1 nL gRNA and Cas9-mRNA solution containing phenol red (0.05%) and rhodamine dextran (0.05%) were co-injected into fertilised zebrafish embryos at the one cell stage using a microinjector. RNA-solutions were of the following concentrations: 64 ng/µL Cas9-mRNA and 25 ng/µL and 29 ng/µL gRNA for target site 1 and 2, respectively, Embryos were transferred into Petri dishes containing E3 medium supplemented with methylene blue, kept at 28.5 °C and checked daily for fluorescence and signs of ill health and malformations. Non-fluorescent, dead and malformed embryos were removed, and medium was replaced. Non-injected wildtype embryos served as control. At 2 dpf, 8 normally developed embryos per target site were collected for genomic DNA extraction and subsequent HRMA.
To verify mutagenesis, total genomic DNA was extracted from single embryos at 48
hours post fertilisation (hpf) and incubated in 50 µL
of alkaline lysis solution (125 µL 25 mM NaOH + 20 µL
0.2 mM EDTA in 50 mL dH2O) at 95 °C for 1 hour.
Lysis of the embryos was inactivated by adding 50 µL neutralisation
buffer (2 mL 1 M Tris-HCl, pH 8, + 48 mL dH2O). For HRMA,
1 µL of DNA lysate was mixed with 2
In addition to HRM- and DNA-sequence analysis, the individual mutation types in the F1-embryos were determined by alignment of wildtype and mutated sequences using the free online Kalign sequence alignment tool (https://www.ebi.ac.uk/jdispatcher/msa/kalign?stype=dna) [58] and the mutated DNA sequence was translated into the corresponding AA-sequence with the free online ExPASy translation tool (Swiss Institute for Bioinformatics; http://web.expasy.org/translate/).
Total genomic DNA was extracted as described above. For genotyping, we used a method after Bhattacharya and Van Meir [59], which allows small CRISPR/Cas9 induced indels as small as 3 base pairs to be detected via gel electrophoresis. Briefly, in a first step, PCR was performed and 5 µL of sample were loaded onto a 3% agarose gel. Gel electrophoresis was performed for approximately 1.5 h at 100 mV. The results were visualised. For the second step 5 µL of those samples yielding a single band after electrophoresis were selected for hybridisation with known control wildtype samples. The hybridisation procedure involved one single step of denaturation of the mixed samples at 95 °C for 5 minutes in a thermal cycler and subsequent renaturation by lowering the temperature to 20 °C in at a rate of 0.5 °C/sec. The hybridised samples were loaded onto an agarose gel (3%) and the gel was run for 1 h at 100 mV. Those samples containing mutant and wildtype DNA produced heteroduplexes generating two distinct bands on the gel, whereas samples containing wildtype only DNA formed homoduplexes yielding one single band.
Embryonic developmental stages were determined according to Kimmel et al. [60]. For larvae older than 3 dpf staging was performed according to external anatomical traits after Parichy et al. [61]. We chose standard length (SL) in µm, which is defined as the distance from the anterior end of the jaw to the posterior tip of the notochord [13, 14, 61].
Anatomical terms used in this study are based upon terminology of Cubbage and Mabee [14]. Detailed allocation of the anatomical structures was performed using the FishFace Atlas, accessible at the following website: https://www.facebase.org/resources/zebrafish/fishface/home/[62, 63].
Zebrafish larvae were euthanised on ice, fixed in 4% paraformaldehyde in phosphate-buffered saline (PFA/PBS) and processed following the protocol of Walker and Kimmel [64] for bone and cartilage staining. Briefly, after fixation in 4% PFA/PBS for 2 hours at room temperature on a shaker, specimens were dehydrated in 50% ethanol, stained gently shaking overnight at room temperature with Alizarin red and/or Alcian blue, bleached and cleared according to the protocol. Storage in 50% glycerol/0.1% KOH (as suggested in the original protocol) was omitted, instead, samples were stored in 100% glycerol at 4 °C to avoid rapid loss of Alizarin red staining before image acquisition.
Wholemount in situ hybridisation steps were carried out as previously
described [12, 65] for embryos and early larvae. For larvae older than 4 dpf we
followed the protocol of Vauti et al. [66]. Briefly, embryos were
manually dechorionated and fixed in 4% PFA/PBS overnight at 4 °C.
Following dehydration in 50% and 100% methanol in PBS the embryos were stored
at –20 °C until further use. For WISH, embryos were rehydrated and
post-fixed in 4% PFA/PBST for 20 minutes at room temperature (RT). Proteinase K
(Sigma-Aldrich, Darmstadt, Germamy) digest (10 µg/mL in PBST) was
performed for the duration appropriate to the stages of the embryos and stopped
with 0.2 M glycine in PBS. Embryos were again post-fixed in 4% PFA/PBST for 20
minutes at RT, and then washed 3 times for 5 minutes in PBST at RT, followed by
pre-hybridisation at 60 °C in the hybridisation oven (HO) for 2 hours.
Hybridisation with digoxigenin (DIG)-labelled atoh8 and myoD
probes (1 µg/mL for each probe) was performed overnight (HO). After
successive washes in 1:1 formamide in 2
Fifty embryos were collected in 1 mL of TRI reagent® (Sigma-Aldrich, Darmstadt, Germamy) for RNA isolation. RNA was isolated according to manufacturer’s instruction. After RNA isolation, complementary DNA (cDNA) was synthesized using M-MLV reverse transcriptase, following manufacturer’s instructions (Promega - M170A). Quantitative real time (qRT) PCR was performed using GoTaq® RT-qPCR system, following manufacturer’s instruction (Promega - A6001). Six replicates were used to quantify the target region. Following qRT-PCR, data was analysed following Livak’s method [67]. The data presented in the graphs are (2(-dCT)). The expression levels are relative to actb2. Primer sequences were as follows:
atoh8 5′-GCCATTCAGCAGACTCGGA-3′; 5′-CTGCCCATAAGAGTAGCAGGG-3′;
actb2 5′-AAGGCCAACAGGGAAAAGAT-3′; 5′-AGGGCGTAACCCTCGTAGAT-3′.
After bone and cartilage staining and whole mount in situ
hybridisation, embryos and larvae were observed under the Leica M165 FC
microscope (Wetzlar, Germany) at
Alizarin red stained larvae were analysed under the microscope for the progression of ossification in 19 different craniofacial structures and the vertebrae. The level of craniofacial ossification was determined in each larva for each stained structure, with a score of 0 for absent, 1 for starting, 2 present, 3 for advanced. For every larva, the sum of the single scores for each structure was calculated. From the sum of the scores for the single larvae, an average score (mean value) was calculated. The mean values for the single larvae were sorted according to genotype and for each genotype, the resulting mean value was statistically analysed for significance. Progress of ossification in the vertebrae was assessed by simple counting the number of forming vertebrae as indicated by alizarin red staining.
Morphometric studies and statistical analysis were performed on siblings (n = 157) of the progeny of a atoh8wt/kg117 in-cross.
Stained embryos and larvae were placed in a drop of 100% glycerol on a
micrometre stage ruler, and standard length (SL) was measured from images
acquired at
As a substitute for whole head, the chondrification pattern of the basicranium (including ethmoid plate, trabeculae and basal plates) was used. Larvae were dissected to separate the viscerocranium from the neurocranium. In images taken from the ventral aspect of the neurocranium, head length was measured bilaterally as the distance from the tip of the ethmoid plate to the posterior end of the parachordals. The mean value of the two measurements for each embryo was entered into the statistical analysis. For head width, the same images were used and 1 measurement per larva was taken from the lateral-most tips of the basal plate.
M-PQ and CH angles were used to determine differences in morphology of the viscerocranium between wildtype and mutants (one measurement each per larva).
The length of the ceratohyal was determined by measuring bilaterally the distance from the anterior to the posterior tip of the cartilage structure. The mean value of both measurements per larva was statistically analysed for significance.
The area of the anterior parachordals was measured by encircling the area between the posterior end of the structure and the region of the polar cartilages on both sides of the chondrocranium. A mean value was calculated from the two measurements per larva and statistical analysis was performed.
In all larvae, the area occupied by orbital cartilages was calculated on both sides of the neurocranium. The mean values from these two measurements per larva were analysed for statistical significance.
Raw data was processed in Excel (Microsoft Corporation, Redmond, WA, USA), and
statistical analysis was performed using GraphPad prism version 8 for Windows (La
Jolla, CA, USA). p-values were determined by unpaired, two-tailed
student’s t-test comparing the mean values of several skeletal bone and cartilage structures (as described below) of mutant and wildtype
siblings raised under identical conditions at the stated days post-fertilisation.
p-values
Two sites in the atoh8 coding sequence were chosen for CRISPR/Cas9 targeted mutagenesis (Fig. 2A). Our method introduced a double strand break, which was repaired by activation of the non-homologus-end-joining (NHEJ) mechanism. As a result, we yielded several different mutations in F0 which were confirmed by HRMA. These mutations were intended to result ultimately either in destruction of the nascent mRNA by introduction of a premature stop codon, or in the production of a protein with an amino acid sequence which greatly diverged from the wild type.
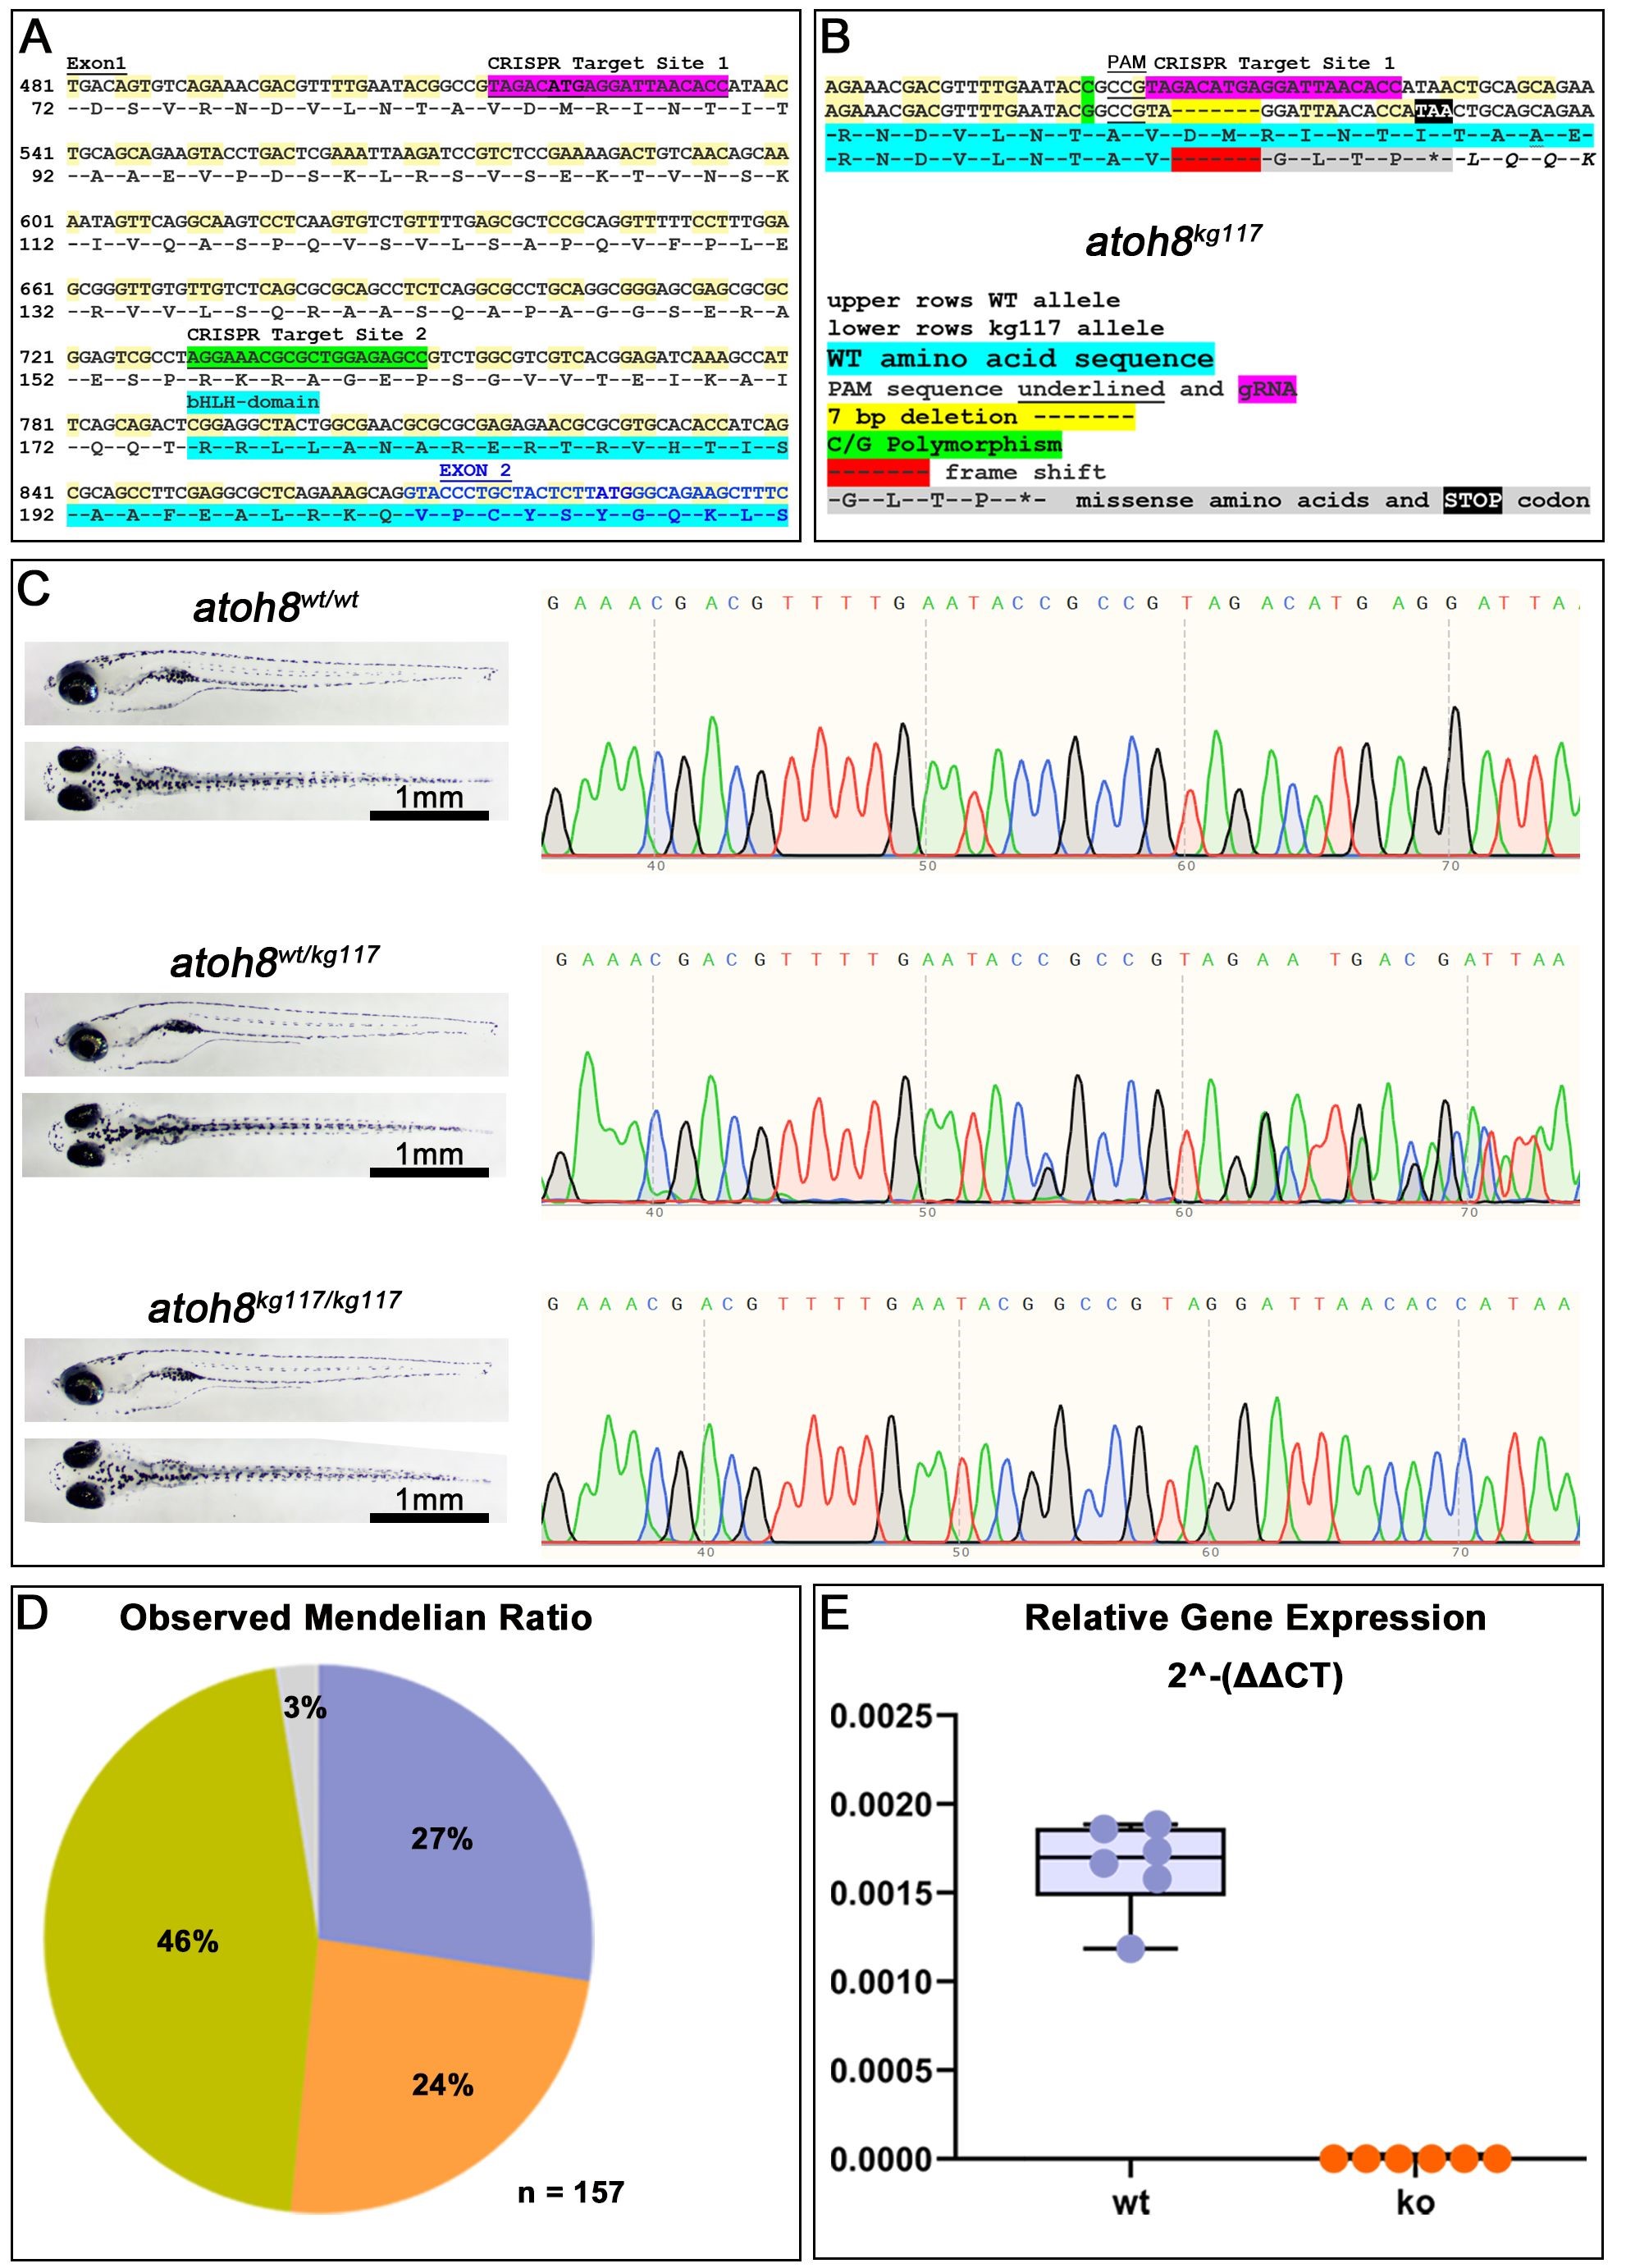 Fig. 2.
CRISPR/Cas9-mediated mutagenesis. (A) Nucleotide and amino acid sequences showing the intended target sites for CRISPR/Cas9-mediated editing. Highlighted in light blue is the beginning of the functional bHLH domain, which is coded for partly in exon1 (black letters) and exon2 (blue letters) of the atoh8 gene. (B) Sequencing results in F1 progeny for the atoh8kg117 allele. The nucleotide deletion is highlighted in yellow in the DNA sequence and in red in the amino acid sequence of the protein. (C) Trace sequences for wildtype, heterozygous and homozygous siblings in the allele atoh8kg117. To the left: wildtype, heterozygous and homozygous sibling larvae shown in lateral (above) and dorsal (below) view. (D) The observed Mendelian Ratio is in very close correspondence with the expected Mendelian Ratio of 25% for wildtype (shown in lilac), 50% heterozygous mutants (green) and 25% for homozygous mutants (orange). The grey portion represents the percentage of larvae for which the genotype could not be determined. n = 157 sibling embryos of a atoh8wt/kg117 in-cross were used for genotyping and all subsequent analysis. (E) Relative gene expression in wildtype and homozygous mutant. Scale bars in (C): 1 mm. bHLH, basic helix-loop-helix; PAM, protospacer adjacent motif; gRNA, guide RNA; wt, wildtype; CRISPR/Cas9, clustered regularly interspaced short palindromic repeats/CRISPR-associated protein 9; ko, atoh8kg117/117.
Most double strand breaks repaired via NHEJ resulted in a shift in the open reading frame. In silico analysis of the mutated DNA sequences predicted to generate a premature stop codon in the sequence either by deletion, insertion, or both. In consequence, this nonsense mutation should cause a degradation of the transcribed mRNA (nonsense-mediated decay) leading to no production of protein at all [68, 69, 70]. Of the many resulting mutated zebrafish strains, two with germline transmission of optimal mutations for each target site were chosen for further breeding in subsequent generations. For our experiments, we used the mutant strain carrying a 7 bp deletion in the first CRISPR/Cas9 target site (allele atoh8kg117; Fig. 2B). In silico, this mutation introduced a premature stop codon at residue 89 of the amino acid sequence (Fig. 2B).
The subsequent generations of fish developed without any overt phenotype. However, sequence analysis confirmed the 7 bp deletion in the atoh8kg117 allele (Fig. 2C). All pairwise matings resulted in the distribution of genotypes according to the expected Mendelian ratio (Fig. 2D). Quantitative real-time PCR revealed the absence of mRNA (Fig. 2E) in homozygous mutants.
In our previous study [12], we demonstrated expression of the transcription factor atoh8 in the sclerotome compartment of the embryonic zebrafish somite. We also noticed atoh8 signal in the embryonic zebrafish head and assumed part of this expression to be in cells of the mesodermal lineage. Because of the possibility that atoh8 transcripts might label cells of mesodermal origin contributing to elements of the craniofacial skeleton, we investigated later stages of zebrafish development. At 2 dpf (Fig. 3A), we detected atoh8 transcripts, as with the previous study, in the hindbrain and cerebellum. We found expression in the anlagen of the basicranium, the pectoral fin and, interestingly, in the branchial arches. We previously suggested that there was no overlap in the expression domains of atoh8 as a marker of sclerotome and myoD as a marker of muscle precursor tissue, therefore, we compared the craniofacial expression domains of atoh8 to those of myoD. As in our previous study, we found the two domains to locate in vicinity to each other without any overlap. We briefly investigated and compared the expression pattern of myoD in wild type and mutant zebrafish but did not find any differences (Supplementary Fig. 3A). The separation of the atoh8 and myoD domains was apparent already at 2 dpf (Fig. 3A,B) and became most obvious in the 3–4 dpf larvae (Fig. 3C,D). Here, atoh8 signal was still detectable in the cerebellum. More importantly, at this stage atoh8 transcripts occurred in regions of beginning cartilage and bone formation, namely, the trabecula communis, the trabeculae cranii, the parasphenoid, the basal plates, the cleithrum and the pectoral fin girdle. myoD signal appeared in locations of muscle precursor tissue associated with the developing viscerocranial structures and eyes (Fig. 3D). At 5–6 dpf, signal for atoh8 in the cerebellum was still present, albeit very faintly. The trabecula communis, trabeculae cranii and the parasphenoid remained atoh8-positive (Fig. 3E), as did some of the pharyngeal arch structures: the ceratohyal and the ceratobranchials 1-5 (Fig. 3F,G,H). Transcripts were also detected in the cleithrum and the coraco-scapular bone. As a further skeletal structure, the tip of the notochord labelled positive for atoh8 at this stage. We confirmed the association of atoh8 and myoD expression with the cartilage structures of the developing cranium at 5 dpf by applying cartilage staining after in situ hybridisation. We found atoh8 to be expressed in cells residing on the pharyngeal cartilage structures whereas myoD expressing muscle precursor cells were found to be located adjacent to, but not on the pharyngeal structures (Fig. 3G’,H’). Taken together, these results suggest that the spatiotemporal expression of atoh8 parallels the spatiotemporal pattern of ongoing bone and cartilage development in the zebrafish cranium [14]. However, we did not expect finding atoh8-transcripts in association with the pharyngeal arch structures (ceratohyal and ceratobranchials 1-5), since both cartilage and bone precursor cells in these structures are generally considered as entirely neural crest-derived. Transcripts were also located ventrally and dorsally to the notochord (Supplementary Fig. 3B). We assume the labelled cells to be osteoblast precursor cells, later contributing to the development of the vertebral autocentra and the neural and haemal arches of the vertebral column.
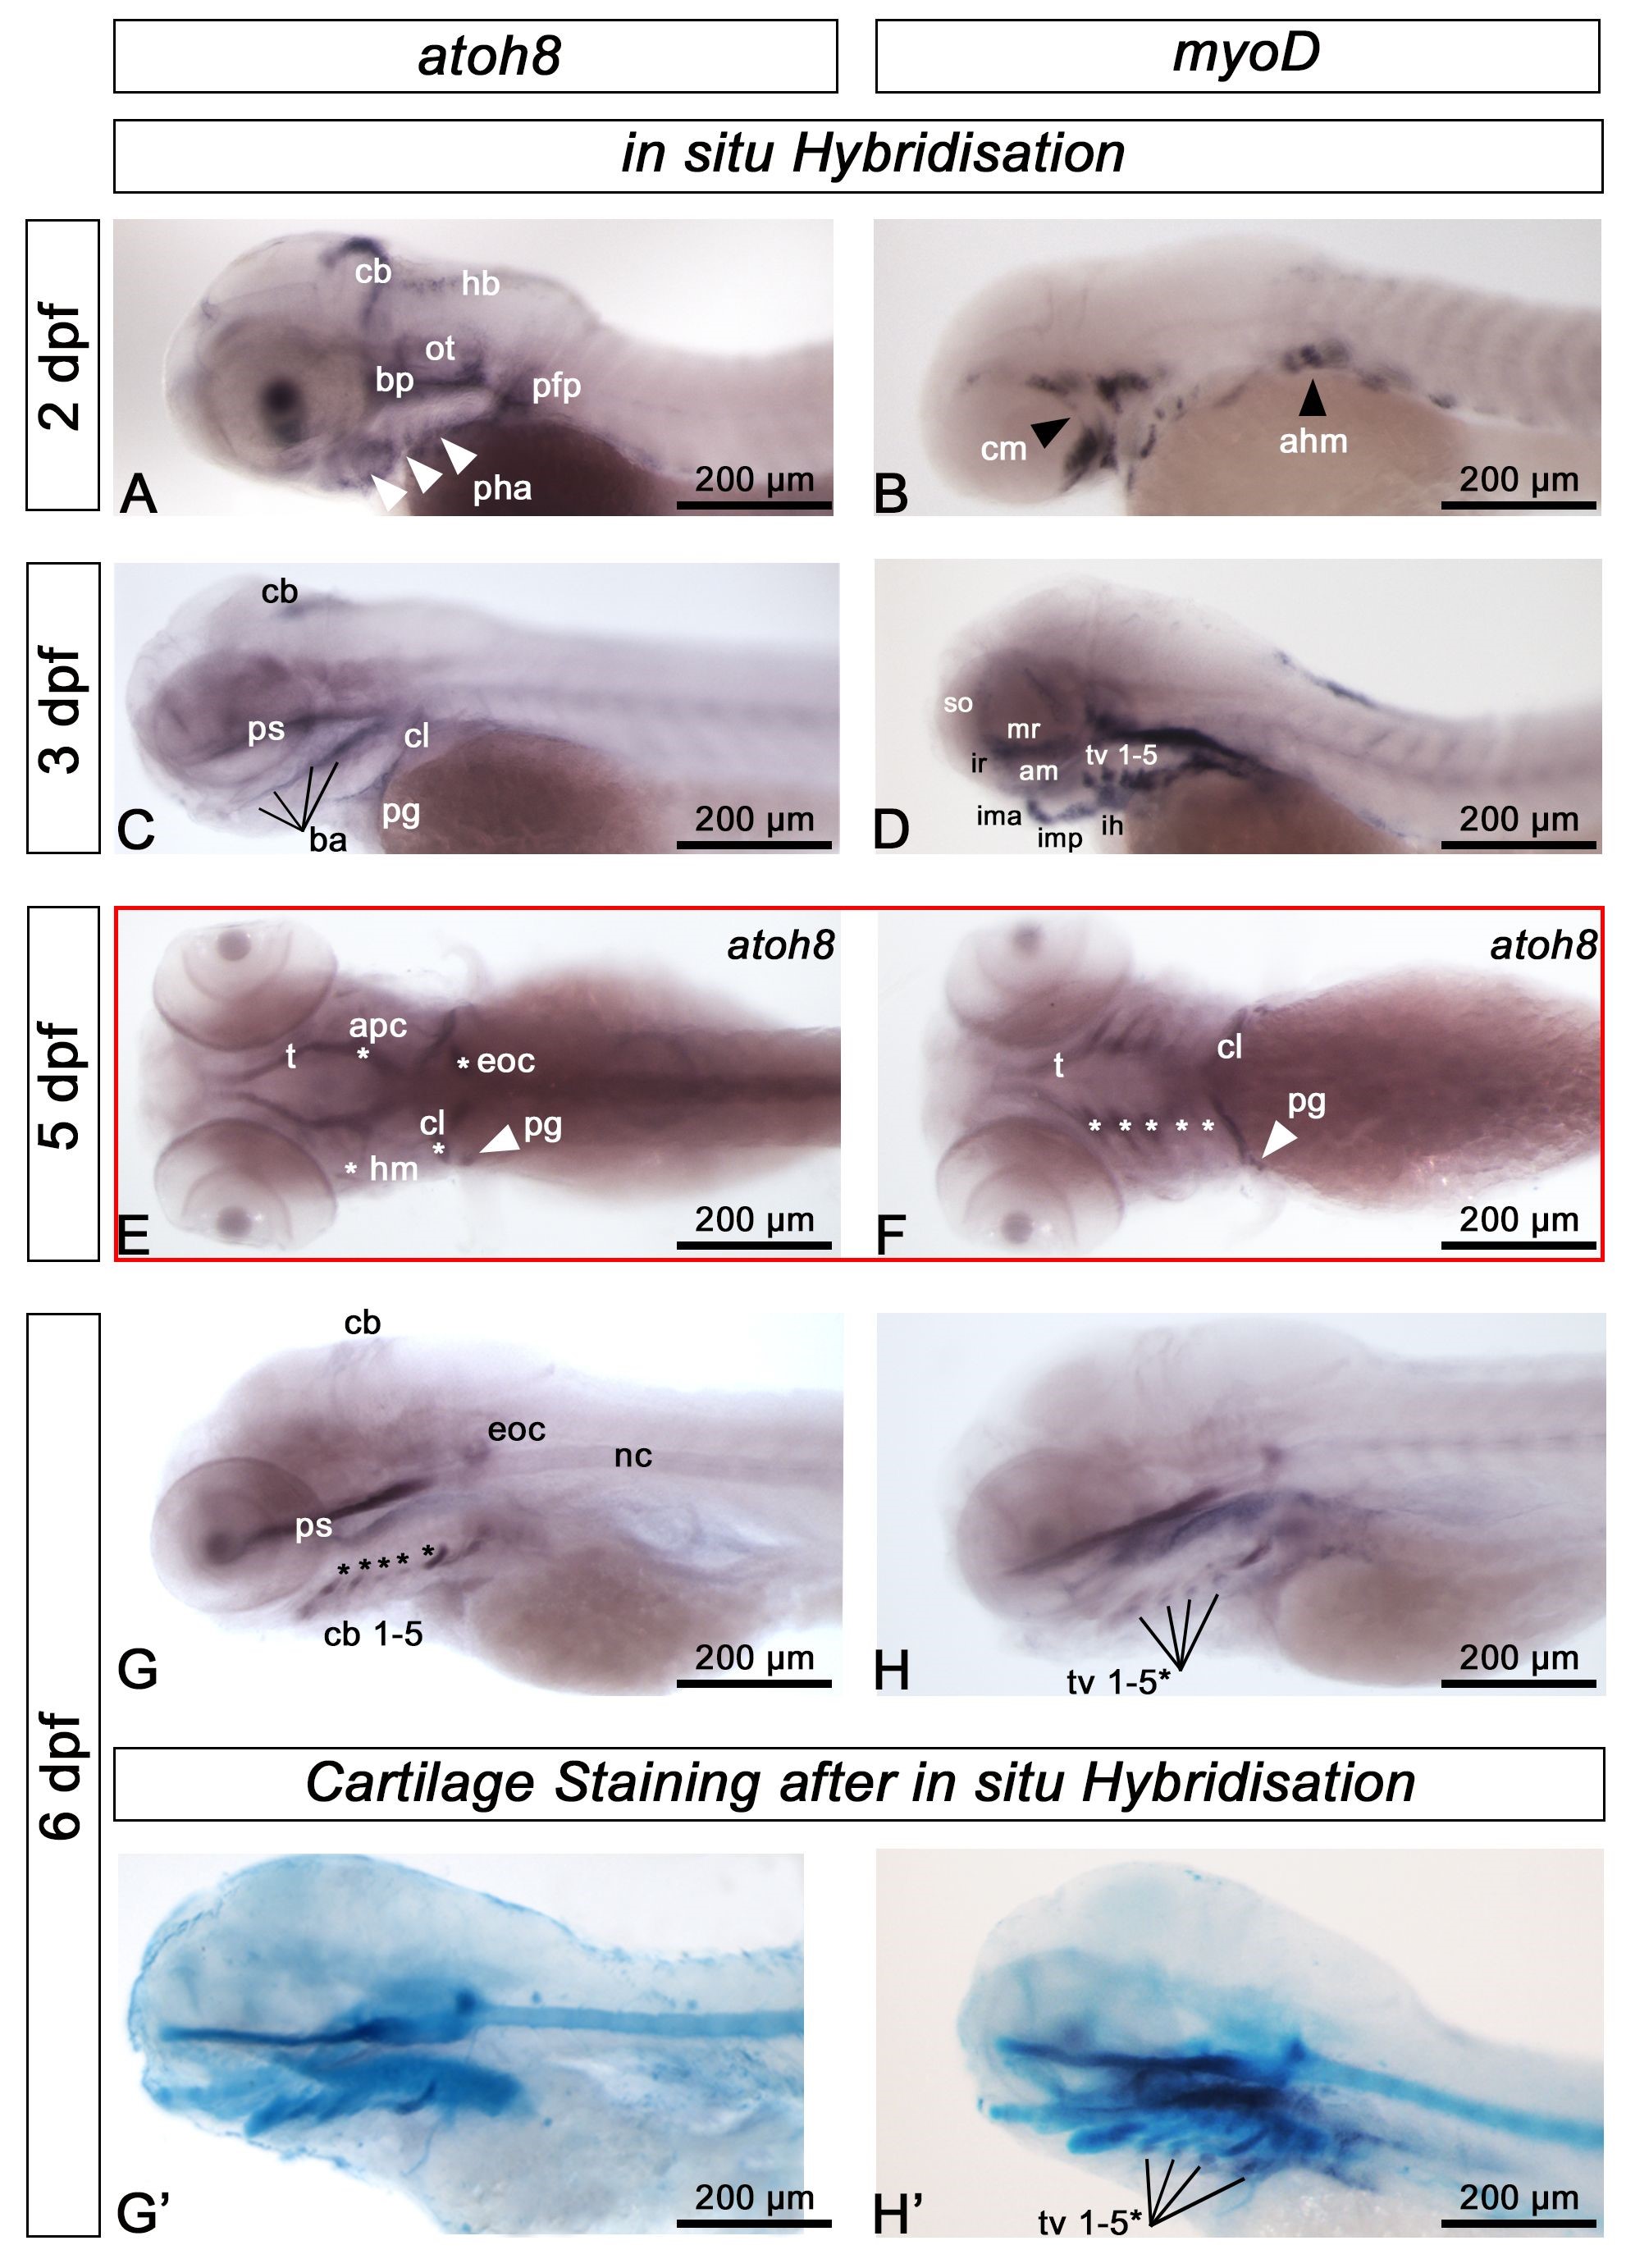 Fig. 3.
atoh8 expression in larval skeletal elements.In situ mRNA hybridisation for atoh8 and myoD mRNA in wild type zebrafish at the indicated late embryonic and early larval stages. (A,B) At 2 dpf, the expression pattern is distinctly different for each gene. atoh8 mRNA is largely expressed in precursor cells of the cartilage anlagen including the branchial arches (white arrowheads) and in the developing cerebellum (cb), hindbrain (hb) and pectoral fin primordium (pfp), whereas myoD mRNA labels undifferentiated myogenic precursors of cranial (white arrowhead, cm) and anterior hypaxial muscle (black arrowhead, ahm). (C,D) atoh8 mRNA is detected in the branchial arches and marks craniofacial skeletal anlagen, whereas myoD mRNA persists in skeletal muscle precursors. (E,F) atoh8 mRNA in craniofacial elements; dorsally: trabecula (t), anterior parachordal (apc), hyomandibular (hm), cleithrum (cl) and the pectoral girdle (arrowhead, pg), ventrally: trabecula (t), cleithrum (cl), pectoral girdle, and ceratobranchials (cb) 1-5 (asterisks). (G) atoh8 mRNA in derivatives of the branchial arches, labelling a population of cells associated with ceratobranchial cartilages 1-5 (arrowheads). (H) myoD expression goes on in myogenic precursor cells. (G’,H’) atoh8 and myoD expression, respectively, on Alcian Blue stained larvae, showing that atoh8 and myoD labelled cells associated with the ceratobranchials occupying different locations; myoD in (H’) labels the transversus ventralis (tv) muscles 1-5; *the most anteriorly located tv 1 is not labelled. All except (E,F): anterior to the left, dorsal up; (E) dorsal view, (F): ventral view. Scale bars: 200 µm.
We have previously identified the sclerotome and head mesoderm as regions of atoh8 expression in early embryonic zebrafish development and we assumed the transcription factor might contribute to the formation of skeletal elements in the developing wildtype zebrafish [12]. In this study, we found expression at later stages in areas and structures possibly contributing to the developing head and axial skeleton. Furthermore, a previous study had demonstrated a role of atoh8 in chondrocyte proliferation and differentiation, resulting in the reduced size of limb skeletal elements in mice and in reduced overall body size [10]. Based on the results obtained in their study and on the expression pattern observed for atoh8 in our studies, we decided to investigate general parameters of growth and development in our mutant zebrafish. In contrast to mouse and chick, the axial and limb skeleton of the zebrafish develops relatively late, however, the notochord, as a supporting structure and precursor of the axial skeleton, is present from earliest embryonic stages, and, together with the developing cartilaginous head structures, can be used to measure growth and general developmental progress [13, 14, 61]. We measured and analysed SL in two sets of Alcian blue-stained larvae from experiments performed under identical conditions for the two different mutation types and evaluated statistically SL for each mutation type. Statistical analysis of the measurements did not reveal significant differences in SL between the wildtype, heterozygous and homozygous mutant siblings (Fig. 4A).
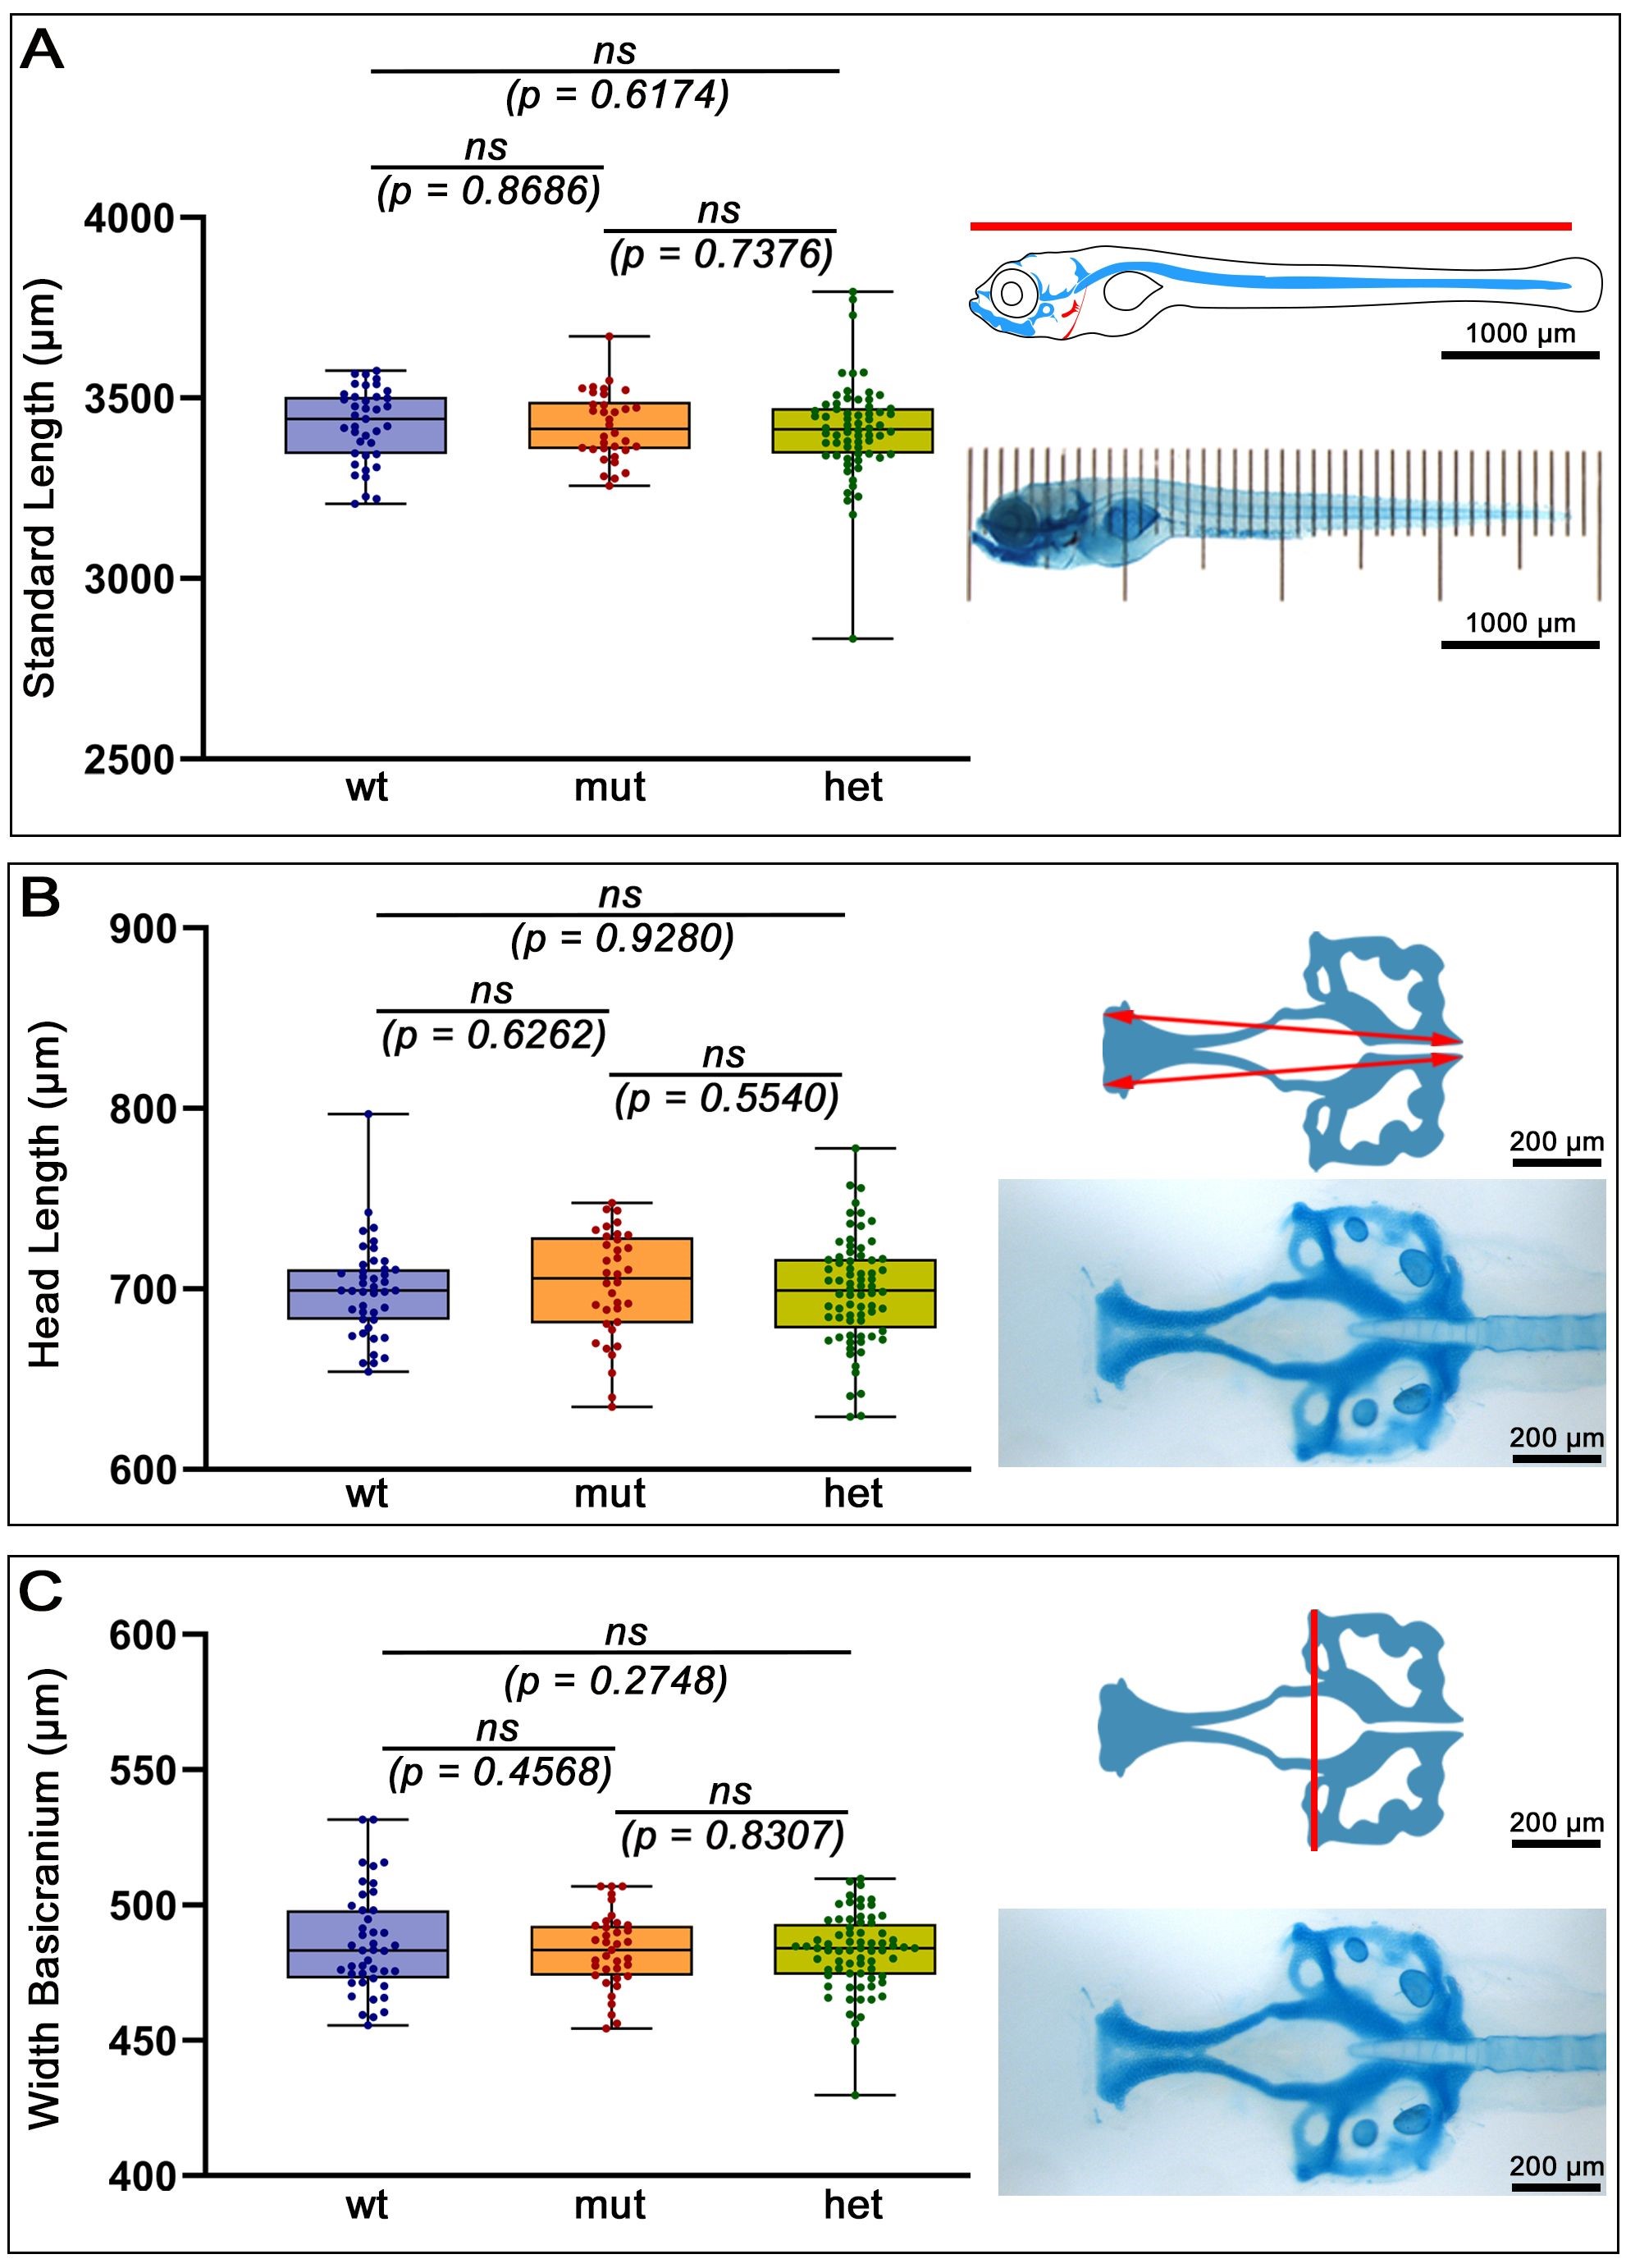 Fig. 4.
Morphometric analysis of Standard length (SL) and head length and width. Comparison of Alcian Blue stained wild type versus mutant larvae at 12 dpf. (A) SL in mm was determined using a microscopic ruler implementing 100 µm increments. Anterior to the left, lateral view and dorsal up. Head length (B) and width (C) in all larvae was measured, as depicted in the schematics, from images of the basal neurocranium using imageJ software (version 1.51h; National Institutes of Health, Bethesda, MD, USA). n = All: anterior to the left. (A) lateral view; (B,C) ventral view. Abbreviations: ns, not significant; wt, wildtype; mut, homozygous mutant; het, heterozygous mutant. Scale bars: 200 µm, except in (A): 1000 µm.
We noticed subtle differences in head morphology between wildtype and mutant in 1 dpf embryos inspected under the microscope via brightfield optics (Supplementary Fig. 3C). When focussing on the otic vesicle of the 1 dpf embryos, we noticed that the brain morphology in the mutants deviated from that in the wildtype. For example, the developing cerebellum occurred less defined, and the brain vesicles appeared wider in the mutant. Since the development and morphology of tissues strongly influence each other, we inspected these differences in the older embryos and larvae by investigating whether the altered brain morphology was a consequence of altered head morphology. Because head morphology in transparent embryos and early larvae is difficult to evaluate, we measured morphometrically several cranial elements in Alcian blue-stained larvae. The distance between the anterior tip of the ethmoid plate and the posterior end of the parachordals serves as a good proxy for head length (Fig. 4B). Statistical analysis revealed no significant difference between wildtype, heterozygous and homozygous mutants in head length in the embryos/larvae. We also measured the width of the cartilaginous basicranium (Fig. 4C) as a further possible indicator of altered head morphology but found no statistically significant differences between the genotypes.
In toxicology studies, the effects of exposure to potentially harmful compounds on zebrafish skeletal development are often investigated using a set of parameters assessing craniofacial morphology. Meckel’s-palatoquadrate (M-PQ) angle is one such frequently used parameter and serves as an indicator of subtle craniofacial malformations [71, 72]. We used this parameter to assess a possible deviation from normal viscerocranial morphology in the atoh8-depleted mutant. We detected no statistically significant differences between the M-PQ angle of wildtype, heterozygotes and homozygotes (Fig. 5A).
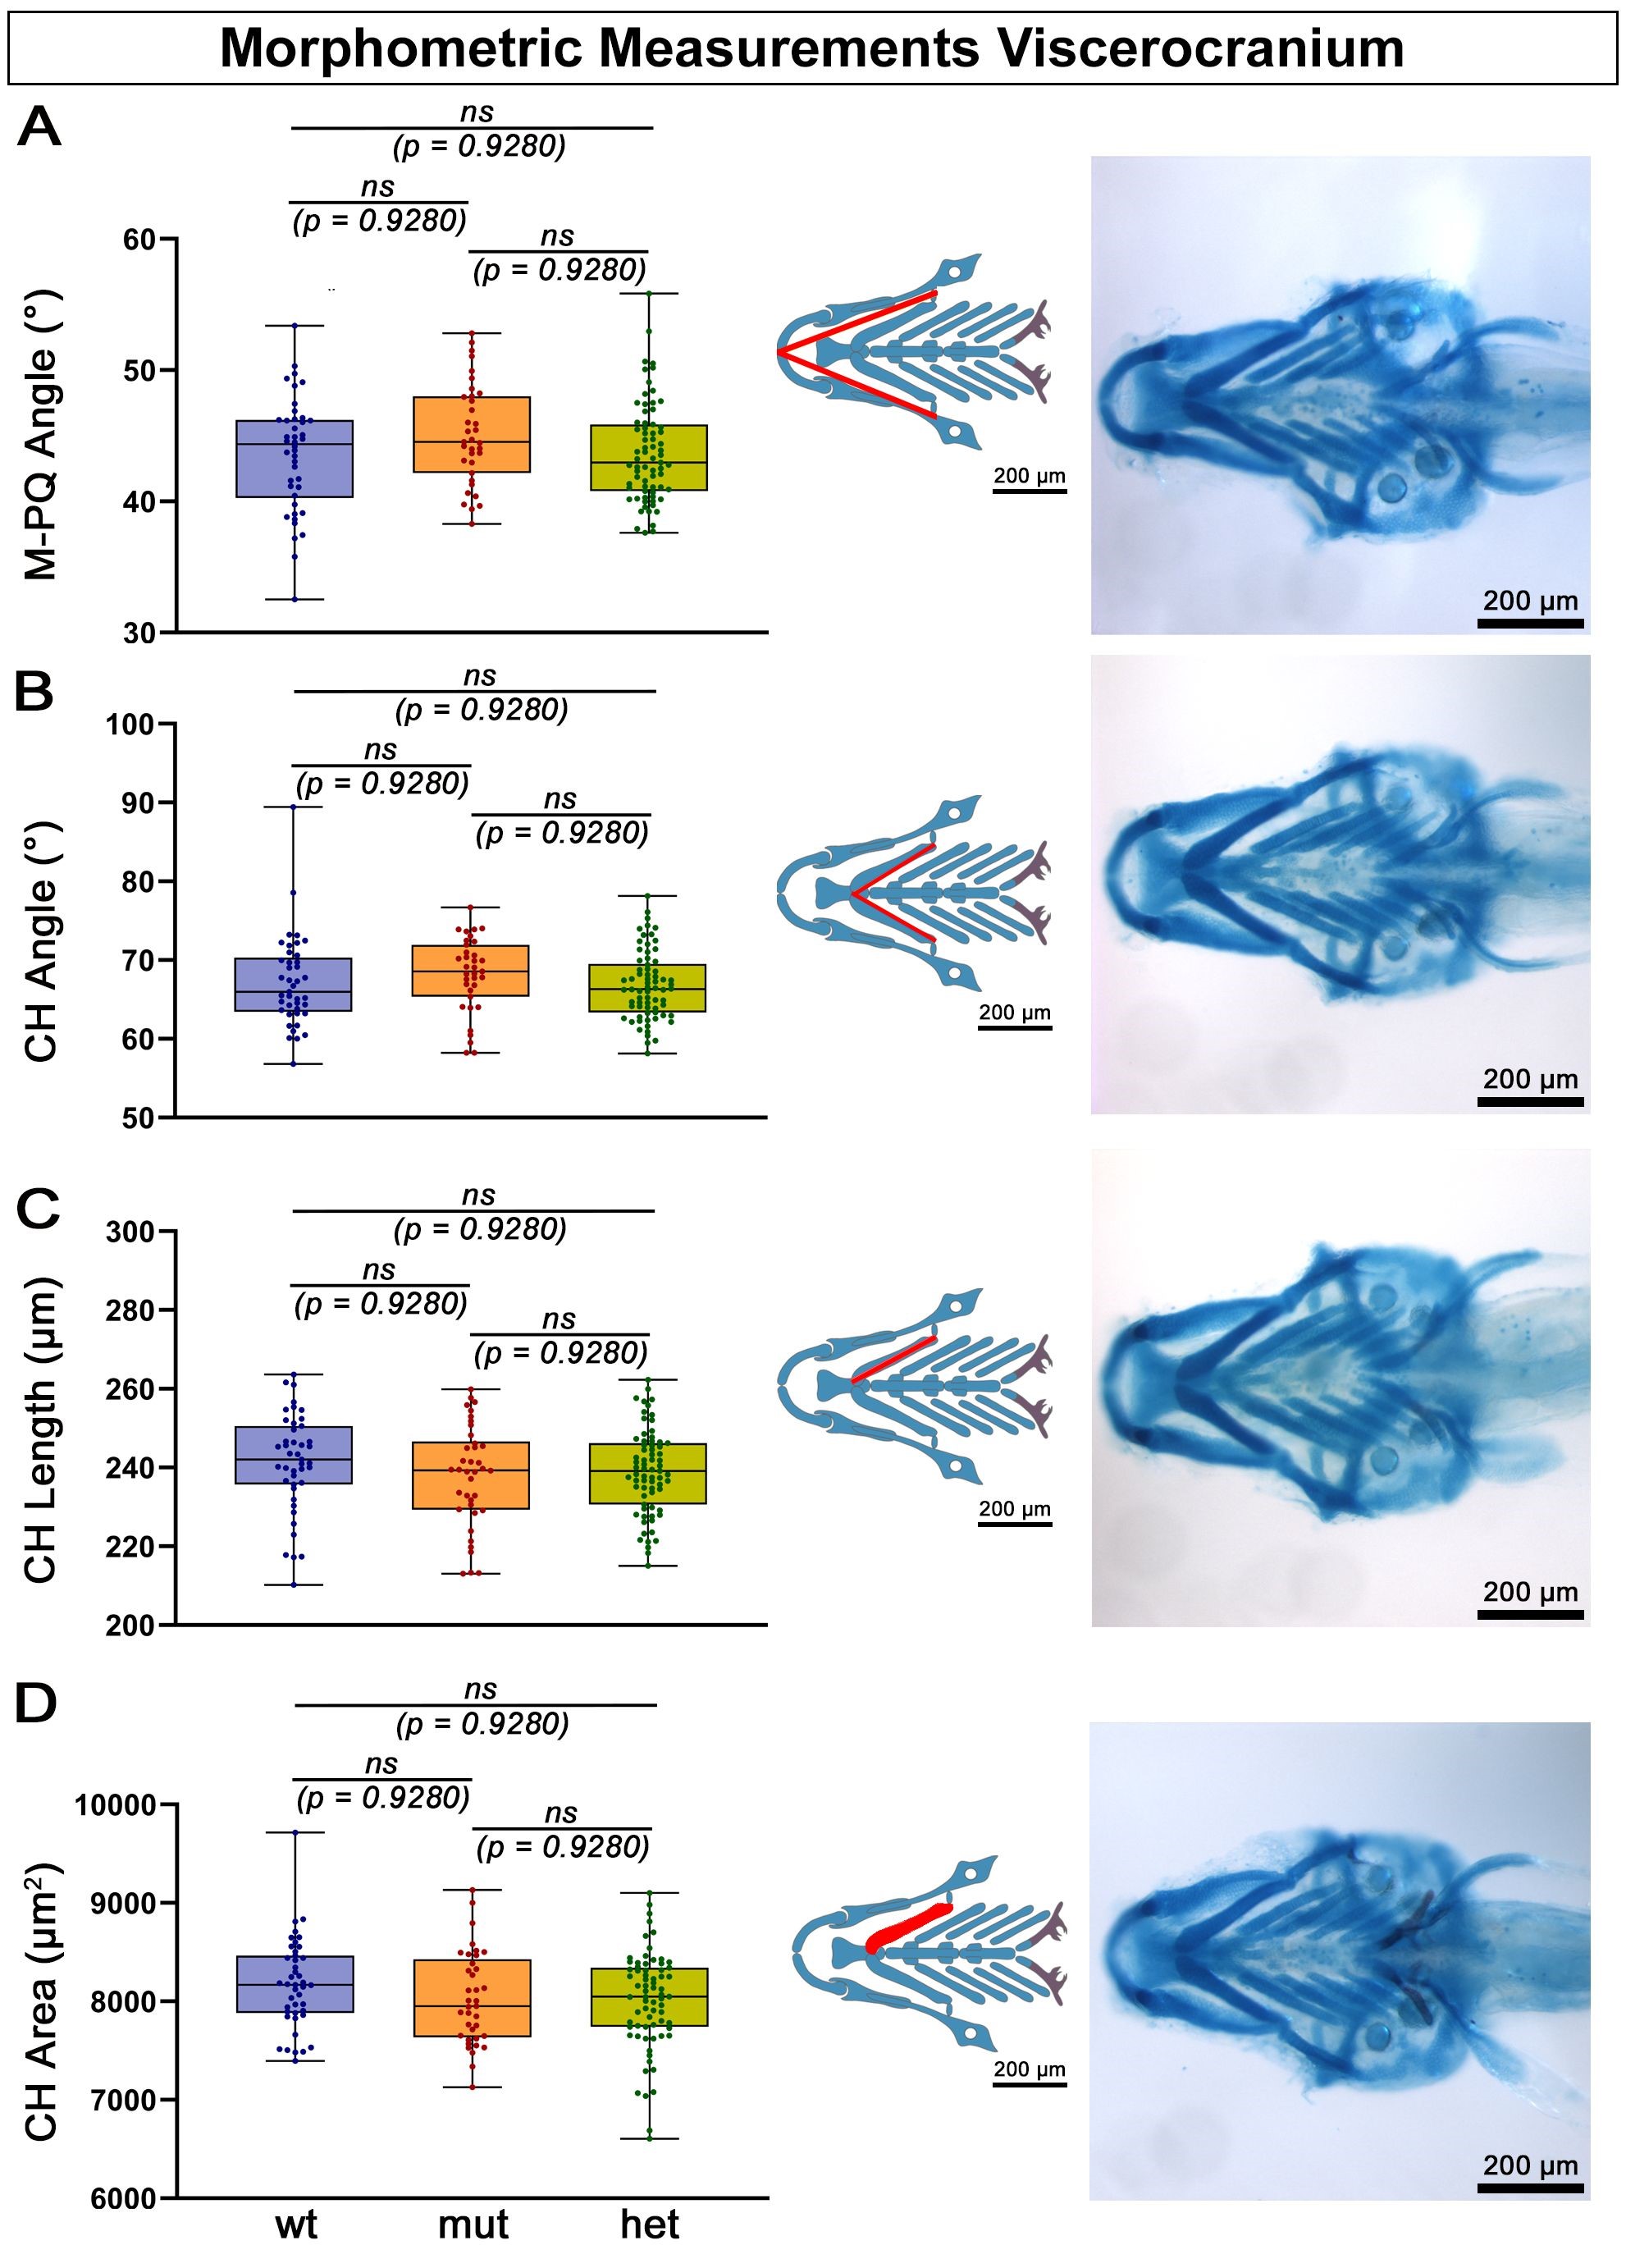 Fig. 5.
Meckel’s-palatoquadrate (M-PQ) angle and ceratohyal (CH) angle, length and area. (A–D) No statistically significant differences (ns) were detected in any of the measured viscerocranial structures. Ventral views of whole Alcian Blue stained zebrafish larval heads (eyes removed), anterior to the left. Abbreviations: ns, not significant; wt, wildtype; mut, homozygous mutant; het, heterozygous mutant. Scale bars: 200 µm.
To confirm these first findings of unaltered head morphology in our mutants, we investigated further morphometric parameters of craniofacial development: First we measured the ceratohyal (CH) angle and found the CH angle of the mutants not to be statistically different from that of the wildtype (Fig. 5B). We then measured the length and area of the CH cartilage. The statistical analysis did not reveal a difference in these two parameters in mutants compared to wildtype (Fig. 5C,D).
The cartilaginous structures of the zebrafish cranium include elements of the viscerocranium and the basicranium. While the viscerocranial elements originate from neural crest, the basicranial structures are composed of cells derived from neural crest, mesoderm or both [25, 30, 32, 33, 49]. Since we detected atoh8 signal in some of the components of the basicranium, we investigated a possible effect of the mutation on structures of the basicranium. Cartilaginous elements of the basicranium are the ethmoid plate, trabecula communis, trabeculae cranii and the basal plate [14, 27]. We measured the area of the anterior parachordals, which have been shown to be of mainly mesoderm origin [25, 73]. Flanking the anterior tip of the notochord, they form the anterior half of the basal plate. We found no significant differences in the mean area of the anterior parachordals (Fig. 6A,B).
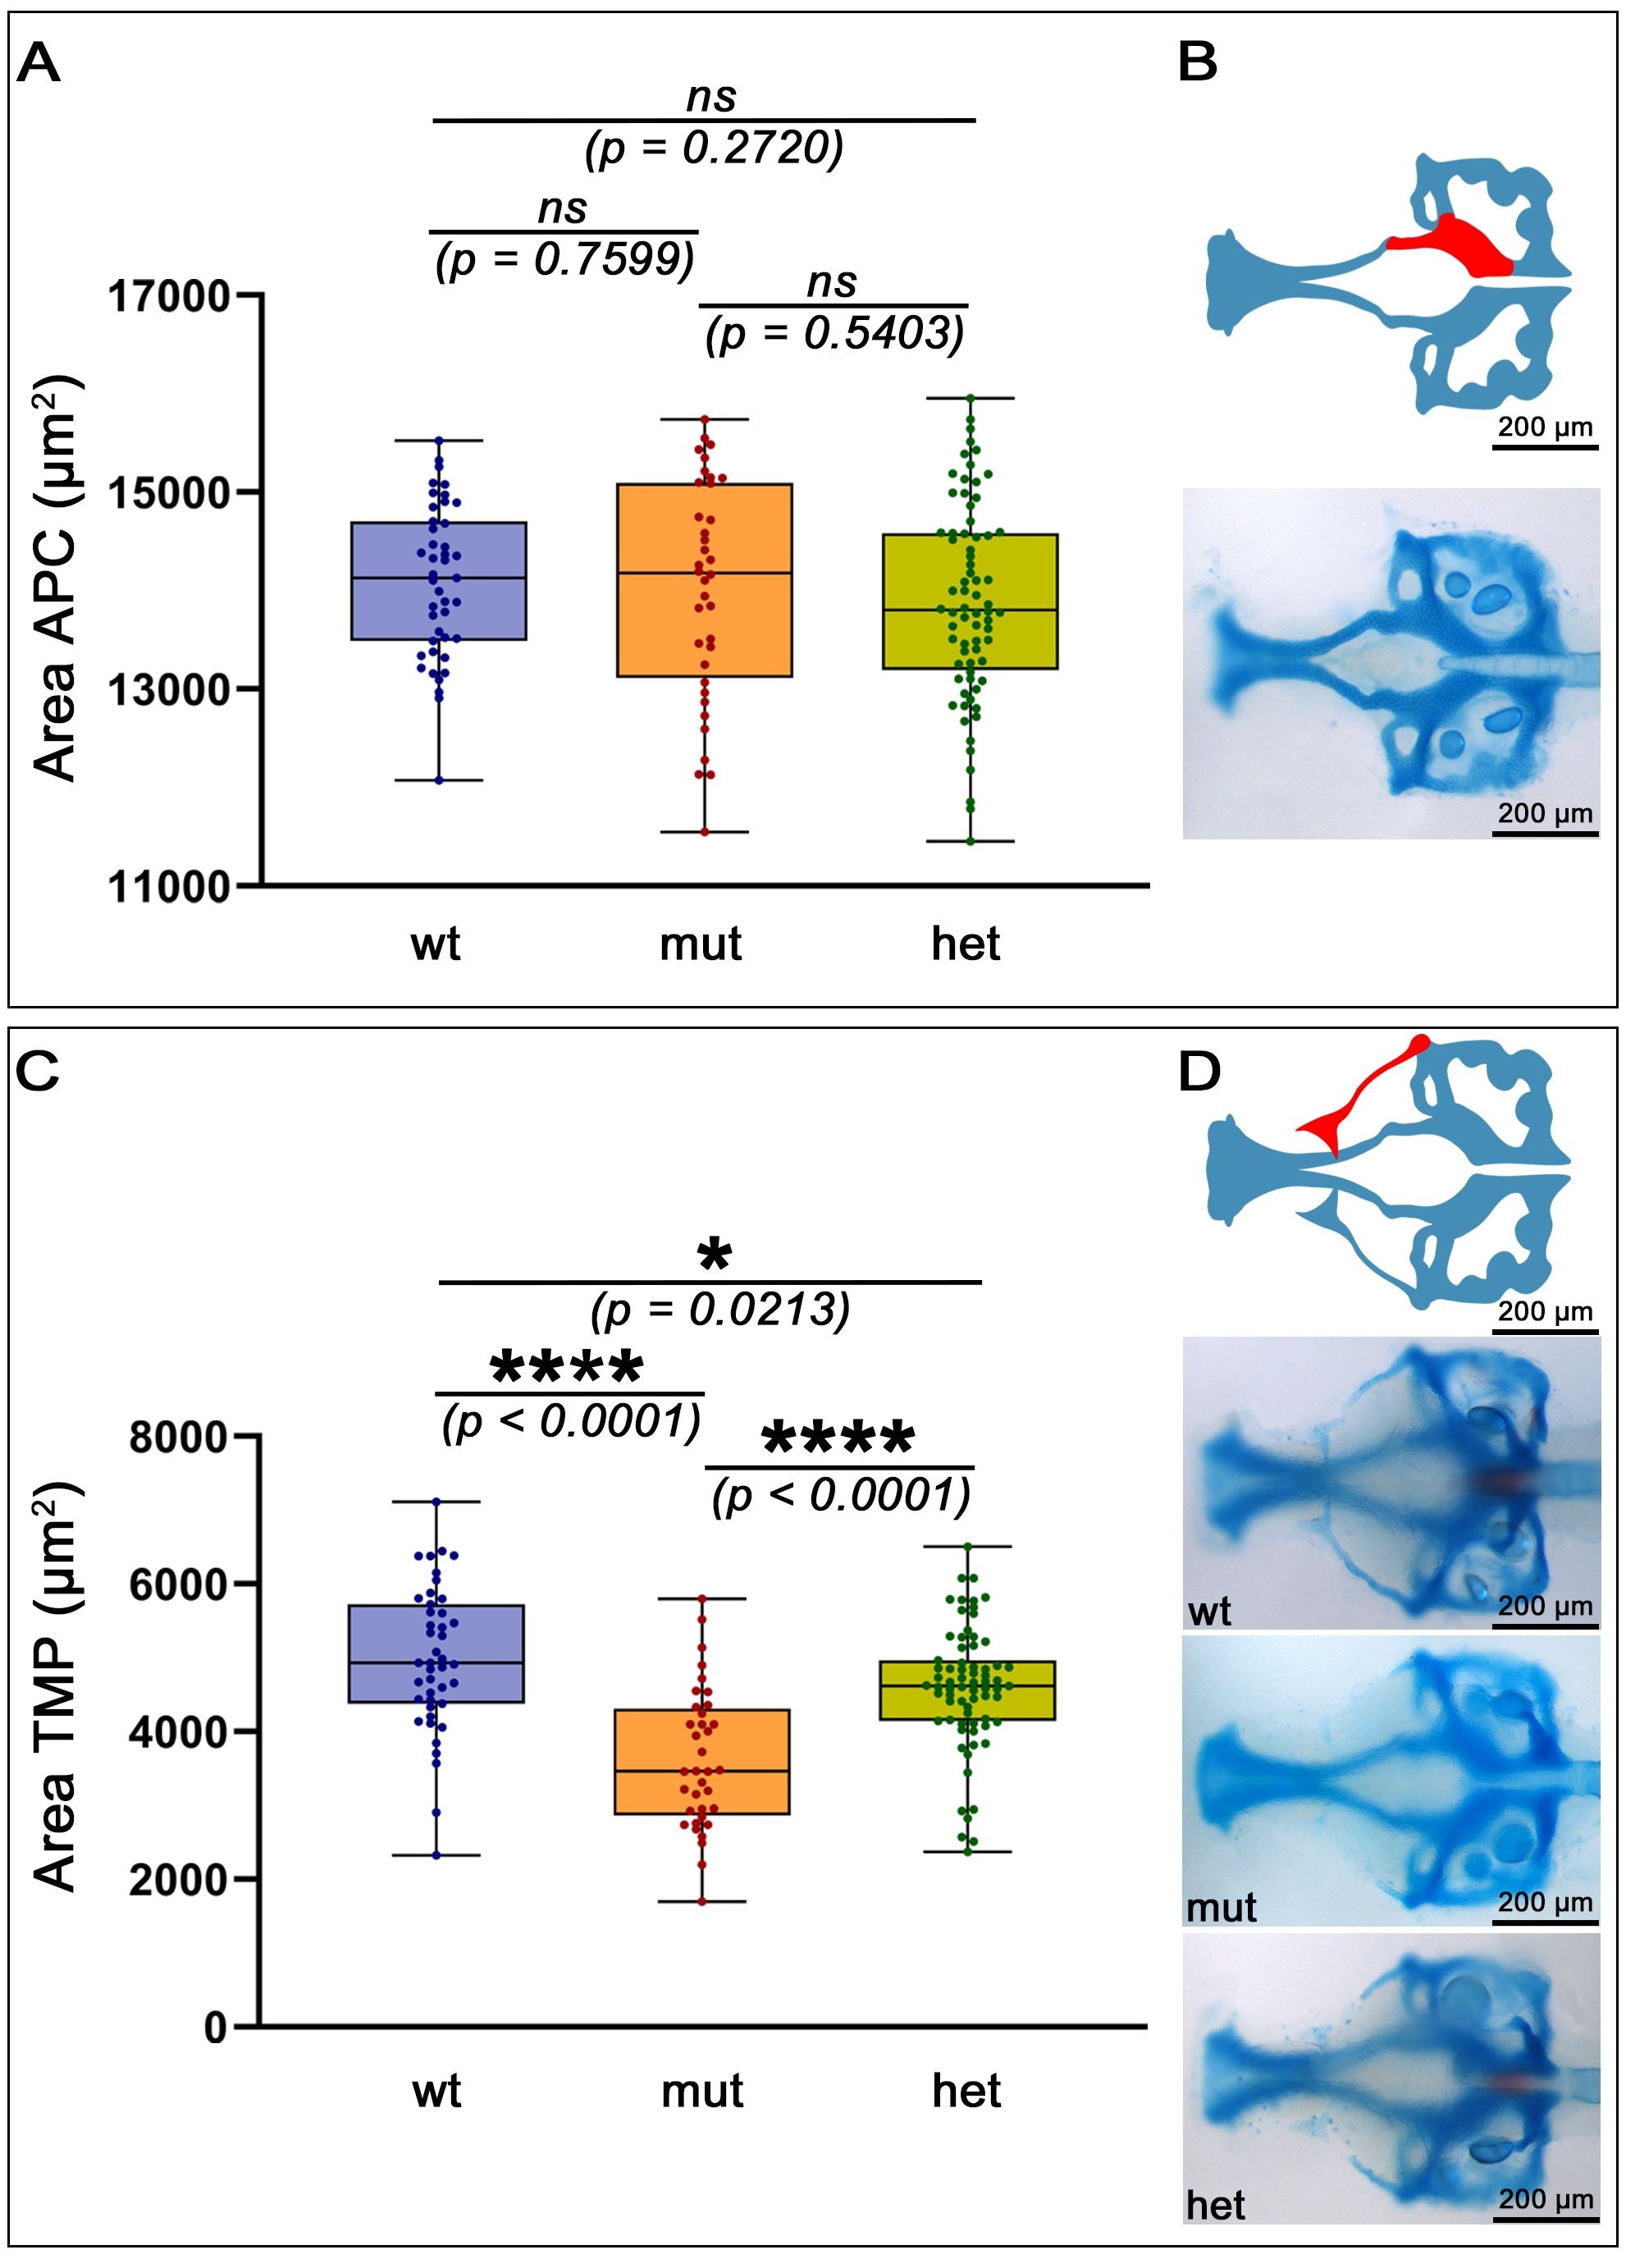 Fig. 6.
Statistical analysis of elements of the neurocranium. (A) Shown is the area of the anterior parachordals (APC) measured and statistically analysed for wild type and mutants. Statistical analysis reveals no significant differences in the area of these cartilaginous neurocranial structures between the genotypes. (B) Schematic (upper image) indicating the measured area of the basicranium (lower image). On the other hand, as shown in (C), the combined area of the triangle, taenia marginalis anterior, taenia marginalis posterior and the epiphyseal bar is of highly statistically difference between wild type and mutant genotypes. (D) Schematic (upper image) indicating the measured area of the taenia marginalis posterior in whole larval heads (lower images) All: anterior to the left, (B) Ventral view, (D) dorsal view. Abbreviations: ns, not significant; * significant; **** highly significant; wt, wildtype; mut, homozygous mutant; het, heterozygous mutant; TMP, taenia marginalis posterior. Scale bars: 200 µm.
The earliest cartilaginous precursors of the neurocranium—the epiphyseal bar
and the taeniae marginales posterior and anterior—start forming from about 5
dpf in the wildtype. The epiphyseal bar initially appears as a triangular
accumulation of chondroblasts, and from the medial corner of this triangle,
chondrification continues medially, eventually joining both extensions in the
midline of the skull vault. The lateral corners of the initial triangle expand
anteriorly and posteriorly. The anterior extension progresses towards and
eventually joins the lateral edges of the ethmoid plate—giving rise to the
taenia marginalis anterior. The posterior extension expands posteriorly to join
with the anterior extension of the auditory capsule—thus forming the taenia
marginalis posterior. Together, anterior and posterior taeniae constitute the
orbital cartilage components of the skull. While the taenia marginalis anterior
has been shown to be of neural crest origin, the taenia marginalis posterior is
considered to be of mesoderm origin; the cell lineage of the epiphyseal bar
cartilage appears to be a mixture of the cell lineages [25]. Thus, we
investigated a possible effect of atoh8 depletion on these structures.
We measured the area occupied by the triangular accumulation and its anterior,
posterior and medial extensions according to the extension of Alcian Blue
staining. Statistical analysis revealed the area occupied by the developing
orbital cartilages to be significantly smaller in the heterozygotes compared to
their wildtype siblings (p = 0.0213) and even highly significantly
smaller (p
The cartilaginous components of the zebrafish head start forming from already 2 dpf [26] and, using Alcian blue staining, become visible from 3 dpf onwards. On the other hand, the process of ossification cannot be visualised before 5 dpf, when the secretion of bone matrix by mature osteoblasts allows for staining of the mineralised matrix with Alizarin red. The pattern of ossification follows a sequence which is invariable for most of the developing bone structures [14]. We investigated the ossification pattern of skeletal structures of the zebrafish head in our mutant larvae and compared it to the pattern observed in wildtype. We found no difference in the sequence of ossification as described by Cubbage and Mabee [14]. To determine a possible statistical significance, we developed a scoring system assessing the level of ossification for each of 19 skeletal structures. In this system, absent ossification indicated by absent Alizarin red staining was scored 0, onset of ossification observed as first faint appearance of staining was scored 1, progressing ossification represented by stronger staining was scored 2 and advanced ossification visible by intense labelling was scored 3. Using this scoring system, we calculated for each developmental stage first the average score for each single larva. The average score for each larva was grouped according to genotype to calculate and statistically analyse the mean values for the wild type and mutant sets of fish. According to our statistical analysis, there were no differences between mutant and wildtype siblings (Fig. 7A).
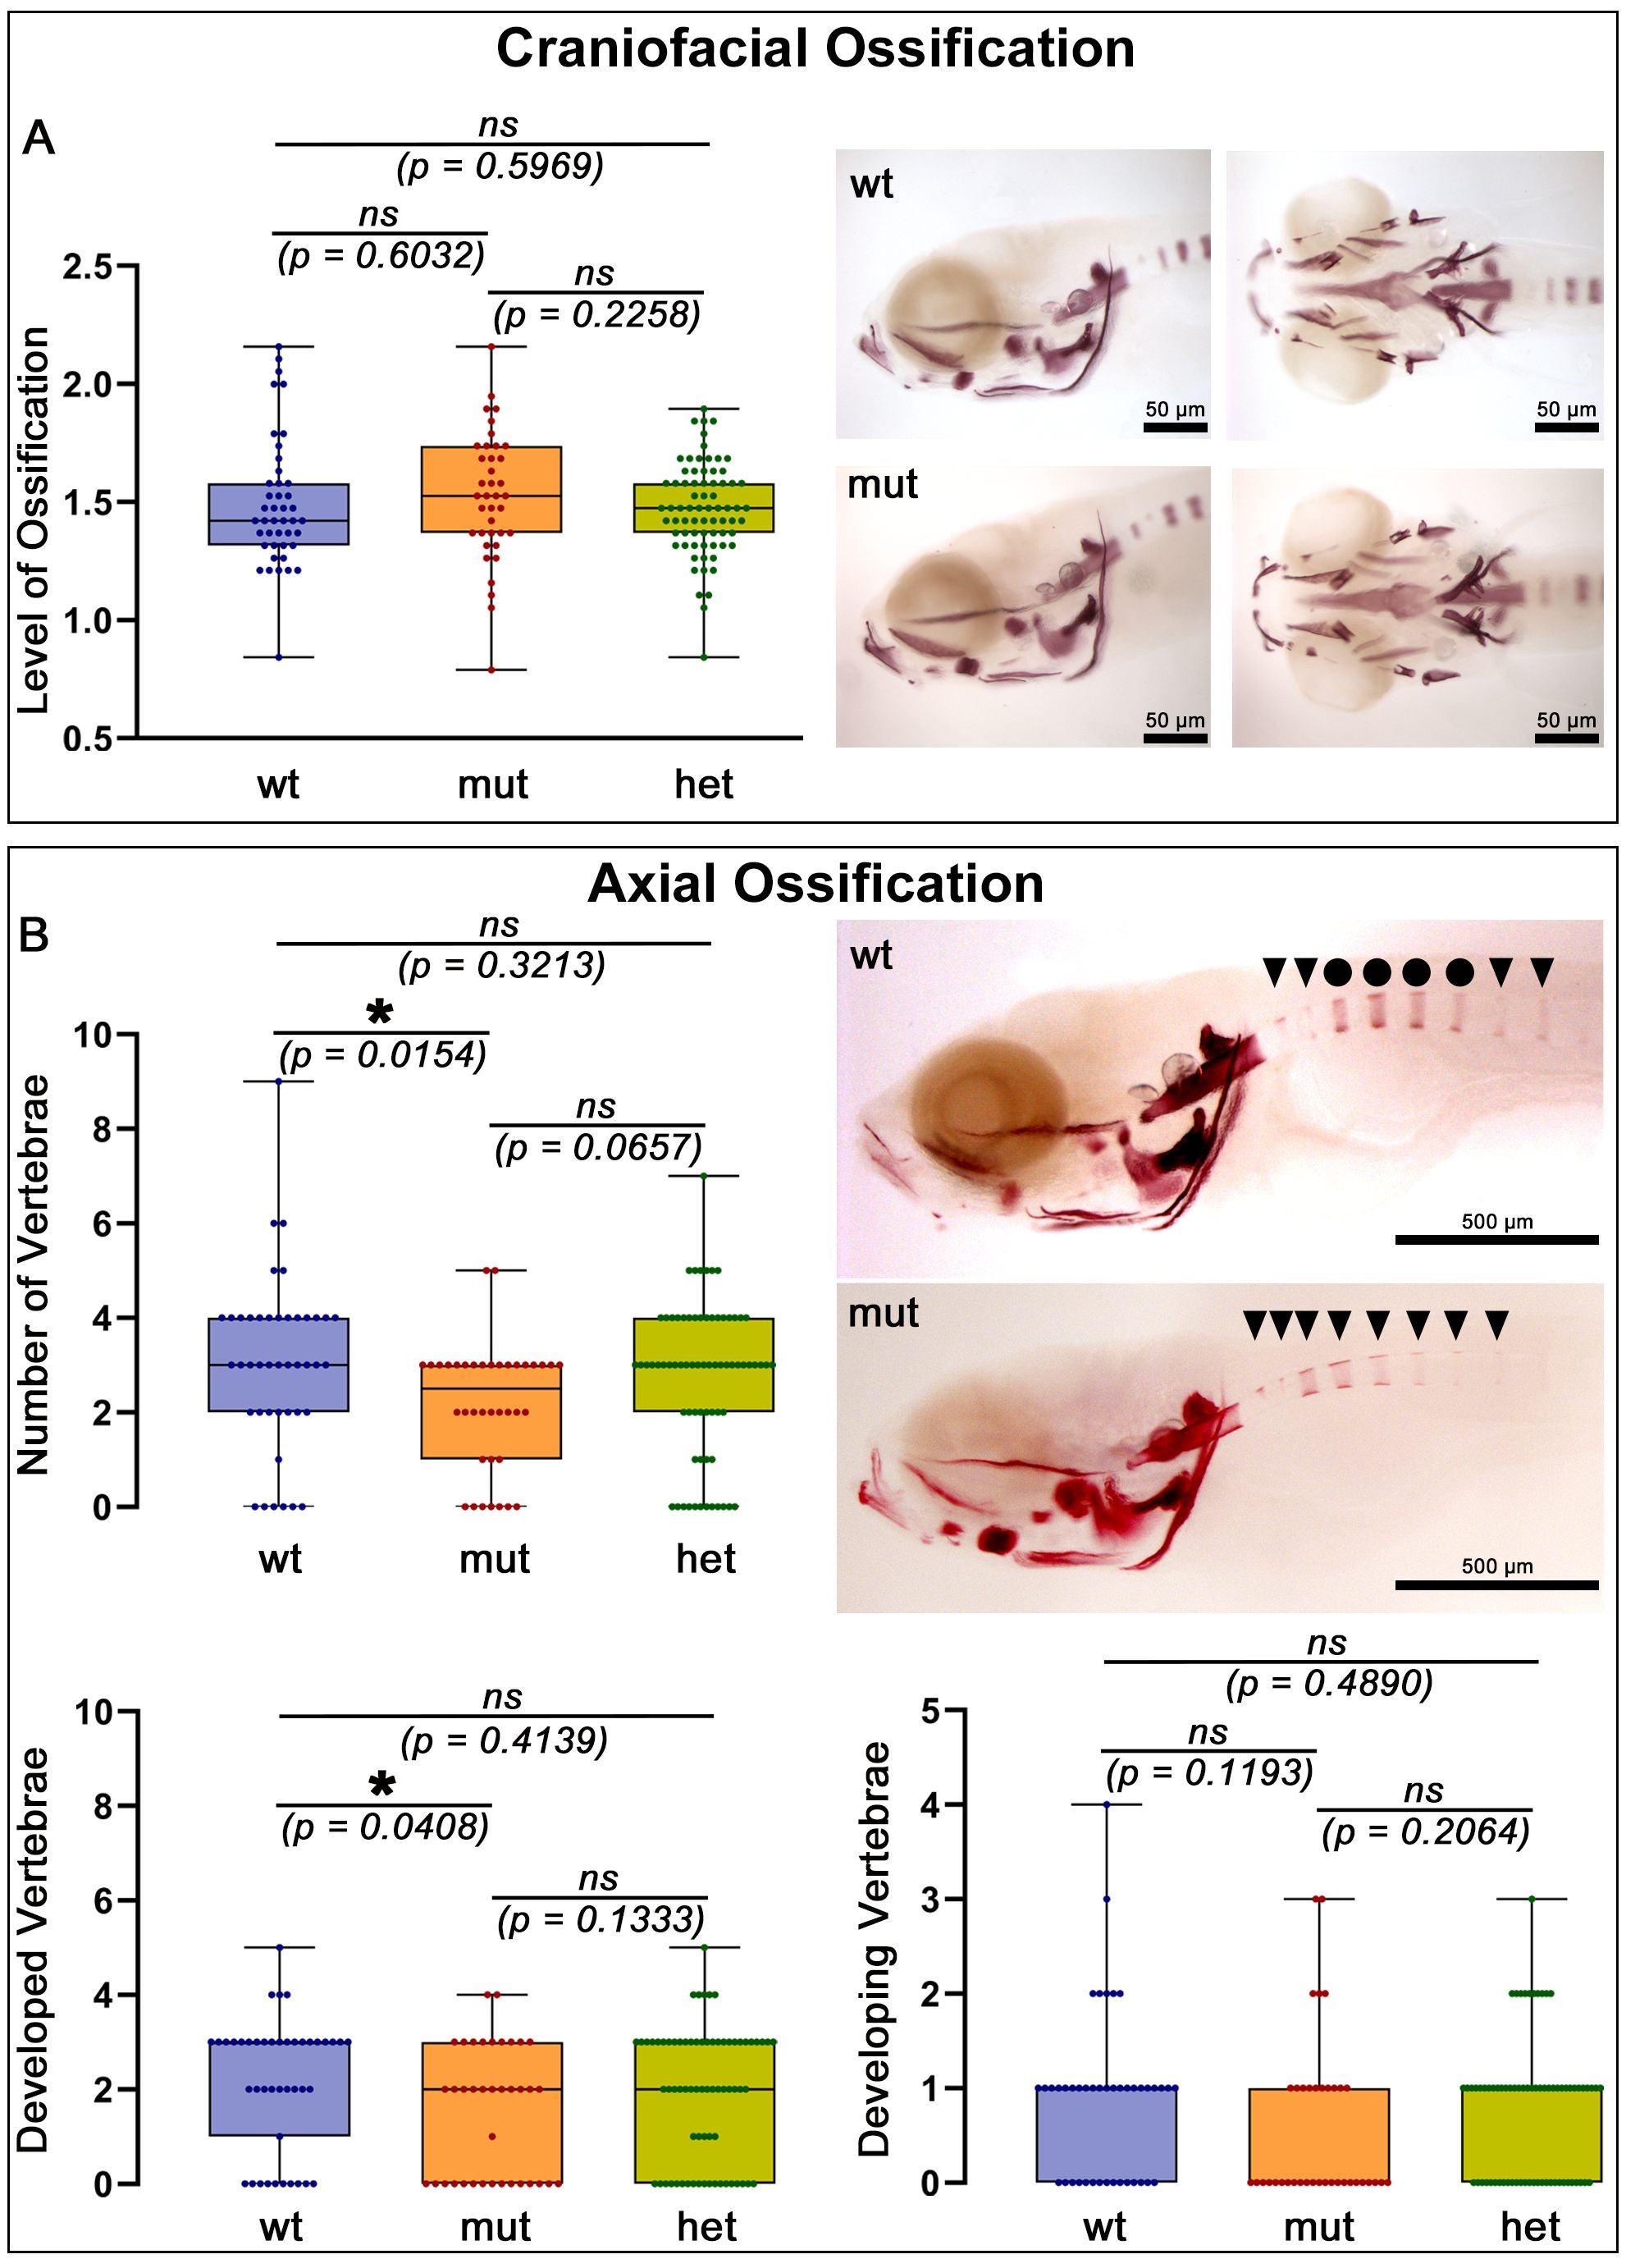 Fig. 7.
General progress of ossification in craniofacial and axial skeletal elements. (A) Ossification pattern and progress shows no statistically significant differences between Alizarin Red stained larvae of the three genotypes. The images show homozygous mutants (mut) and wildtype (wt) viewed from laterally and ventrally. (B) Formation of chordacentra in the zebrafish column. The overall number of vertebrae is without any statistically significant differences, indicating that the onset of chordacentra ossification is not affected by the mutation. Ossification seems to progress faster in wildtype larvae, as confirmed by statistical analysis. Anterior to the left, dorsal up. Abbreviations: ns, not significant; * significant; wt, wildtype; mut, homozygous mutant; het, heterozygous mutant. Black circles and triangles indicate developed and developing vertebrae, respectively. Scale bars: 50 µm in (A), 500 µm in (B).
The axial skeleton of zebrafish comprises 30–33 vertebrae and is regionalised in Weberian, precaudal, caudal and caudal fin vertebrae. In the simplest terms, each vertebra is composed of a body, also called centrum, which develops around the notochord, and haemal and neural arches extending ventrally and dorsally from the body, respectively. Ossification becomes evident with the formation of the chordacentra by deposition of bone matrix around the notochord. Two centres of ossification appear in zebrafish, first anteriorly in the Weberian region and later posteriorly in the caudal fin region. With progressing development, chordacentra are added bilaterally along the anterior-posterior axis to these initial regions of ossification [13]. In the Weberian region, centra 3 and 4 are the first to ossify simultaneously, followed first by centra 1 and 2 and later by the centra posterior to 4.
In wildtype zebrafish, centra 3 and 4 formation becomes first apparent as bone matrix encircling the notochord at a standard length of approximately 3.5 mm [13], corresponding in terms of age to 6 dpf in our wildtype. In our previous study [12] we did not detect atoh8 signal in cells encircling the notochord. However, at 2 dpf in this study we found cells positive for atoh8 located directly beneath the notochord. We observed the development of the centra and assessed the pattern and progression of their formation. In the mutants as in the wildtype, the development followed the pattern described by Bird and Mabee (2003) [13], however, we found a statistically significant difference between wildtype and homozygous mutants in the average number of mineralising centra (wt: 3.1, mut: 2.2; p = 0.0154; Fig. 7B, upper panel). No differences were detected between wildtype and heterozygous mutants and between homozygous and heterozygous mutants. We investigated whether this difference was based on the onset of ossification or on the rate of progression of bone mineralisation. By distinguishing between the presence of fully circular (“developed vertebrae”—black circles in Fig. 7B), indicative for the progression rate, versus incompletely circular chordacentra (“developing vertebrae”—black triangles in Fig. 7B), indicative for the onset, we were able to determine that the onset of mineralisation did not differ whereas the progression rate of mineralisation did, being faster in the wildtype than in the homozygous mutants (wt: 2.1, mut: 1.5; p = 0.0408; Fig. 7B, upper panel). This phenotype suggests a possible role of atoh8 in chordacentra mineralisation of the zebrafish vertebral column.
In agreement with the only other atoh8 knockout study in zebrafish [74], we found no phenotype recapitulating any of the morphant phenotypes reported by previous knockdown studies [8, 75]. Although the expression pattern of atoh8 in this and in our previous study [12] clearly indicates a role of this transcription factor in the development of mesodermally derived skeletal components, our findings could not substantiate this first assumption of a general involvement of atoh8 in zebrafish skeletal development.
An implication of atoh8 in bone and cartilage development was demonstrated by Schroeder and colleagues [10] who provided experimental evidence of the effects of an atoh8 knockout on skeletal development of the mouse in vivo and in vitro. According to their study, ubiquitous as well as conditional depletion of atoh8 in mice results in viable mutants whose phenotypic manifestation of the knockout is a reduced skeletal size. Their study demonstrated a regulatory role of atoh8 in proliferation and differentiation of chondrocytes from embryonic stages onwards. Our study of atoh8 depletion demonstrated no such striking effect on cartilage and bone structures of the developing zebrafish craniofacial and axial skeleton. However, statistically significant differences were detected in a small neurocranial structure of the larval skull, namely the taenia marginalis posterior, and, albeit subtle, in the rate of mineralisation of the chordacentra in the vertebral column.
The finding that ubiquitous and permanent depletion of atoh8 message in zebrafish has no gross phenotypic effect does not necessarily imply the absence of function of this gene in developmental processes, including skeletogenesis. We believe that the expression of a gene of interest is a strong indicator of functional involvement of the gene product in the tissues displaying transcription of the gene.
We propose that the lack of a striking phenotype in our mutants is due to a possible compensatory effect of gene(s) taking over the task of the disrupted gene of interest. One of the biggest surprises arising from the increasing use of permanent genome editing techniques such as CRISPR/Cas in zebrafish was the phenotypic discrepancy between the morphants generated by transient knockdown of a gene and the mutants generated by permanent knockout. For atoh8, this discrepancy was demonstrated by the knockout study of Place and Smith [74], looking at diverse developmental processes in which knockdown and expression studies had implicated the gene in zebrafish development. One of the most extensive studies performed on the correlation between morphant and mutant phenotypes was performed by Kok and colleagues [76]. The group compared the outcomes of permanent gene knockout and transient gene knockdown and found no correlation between the phenotypic outcomes of the two methods. Kok and colleagues [76] argued the discrepancy arises mainly from off-target effects of the morpholinos, inducing widespread programmed cell death. However, even when eliminating adverse effects under strict adherence to published guidelines [77], other studies have revealed the same inconsistent findings between knockdown and knockout approaches [78, 79]. These and above mentioned studies have investigated possible mechanisms underlying the phenotypic differences, showing that transcriptional activation of genes coding for proteins with (or without) sequence similarity in functional domains, compensates for disruption of the target gene, consequently leading to the lack of phenotype in mutants. This genetic compensation by transcriptional adaptation is induced upstream of the protein level and seems to require the degradation of aberrant mRNA produced by the faulty gene. Thus, the adaptational response does not occur in mutants lacking the entire gene, hence not producing any mRNA, or in morphants, where the interference is at the mature mRNA level, where the gene has been transcribed but its product cannot be translated into protein [80, 81, 82]. The exact mechanisms are still under investigation, but in the recent years factors of the nonsense-mediated degradation/decay (NMD) pathway have emerged as mediators of transcriptional adaptation response, in particular members of the up-frameshift proteins [80, 83]. Interestingly, the compensatory mechanism is induced by the presence of a premature stop codon: the one feature promising the generation of null mutants now turns out to activate a compensatory mechanism which guarantees the symptom-less survival of the affected individuals. Which factors could be compensating for the mutation of the atoh8 gene? At this stage of our investigation, we can only offer speculative general suggestions. Since the disruption of atoh8 results in a decrease of proliferation and mineralisation rate, our idea is that we should investigate compensatory expression of transcription factors positively involved in chondroblast proliferation and bone mineralisation.
It appears, however, that the compensation mechanism does not apply to all structures and processes of skeletal development. The taenia marginalis posterior, the triangle and the epiphyseal bar are affected by the loss of atoh8. These transient structures of the developing zebrafish scull have been scarcely investigated, hence only limited information on the embryonic origin of the cells is available. Kague and colleagues [25] consider the taenia marginalis anterior, belonging to the anterior frontal bone, as neural crest derived, and the triangle, epiphyseal bar and the taenia marginalis posterior, belonging to the posterior frontal bone, as mesoderm derived. Our expression study was limited to stages up to 6 dpf, and because of the faintness of the signal we might have missed expression in the whole mount for this structure. Alternatively, appearance of signal might occur only at later developmental stages, which we did not include in our expression study. We do know that the triangle is formed at about 5 dpf in the AB wildtype (our own observation), but if development is delayed and/or morphology altered before 12 dpf or thereafter in the mutant remains to be investigated. The smaller size of the taenia marginalis posterior, triangle and epiphyseal bar in the mutant is indicative for a decrease in the proliferation rate of the constituent chondrocytes, a phenotype consistent with studies implicating atoh8 as an activator of proliferation [1, 4, 9, 84]. Given the known involvement of bone morphogenetic proteins (BMPs) in zebrafish craniofacial and skeletal development [85, 86, 87, 88], and the transcription factor’s known functional association with BMPs [10, 11, 53, 88], the phenotype of our mutants implicates atoh8 as a likely participant in BMP-mediated bone and cartilage formation. This association, however, is still missing in our work and needs to be addressed in future studies.
In addition to the subtle negative impact on the cartilaginous developmental program of the head skeleton, atoh8-knockout in zebrafish appears to lead to deceleration of the ossification program in the axial skeleton. The slower progression of chorda centra mineralisation points toward a regulatory role for atoh8 in ossification of the vertebral bodies, at least in zebrafish. In teleosts, the formation of the spine is initiated not by the classical osteoblasts of the sclerotome but by epithelial cells of the notochord—the chordoblasts. These cells first produce the cartilaginous extracellular matrix (ECM)—the notochord sheath—and later mineralise it in reiterative, ring-shaped sections to form the precursors of the vertebral bodies. Sclerotomal osteoblasts subsequently add the outer autocentra and the vertebral arches. Mineralisation of the notochord sheath is directed by the interaction of two signalling molecules known to play essential roles in vertebrate skeletogenesis [89, 90, 91, 92]: retinoic acid (RA) and BMPs. In zebrafish, BMP signalling has been shown to be indispensable for the mineralisation of the notochord sheath by guiding the chordoblasts through a transitory stage of matrix-producing to matrix-mineralising cells [93]. Given the proximity of atoh8 to chordoblasts in the ventrally and dorsally to the notochord positioned sclerotomal domains and the fact that the transcription factor has been implicated in a multitude of BMP signalling-directed processes, as reviewed in [2], we propose a subtle regulatory role for atoh8 in chordacentra mineralisation.
The most surprising finding in our study of atoh8 in zebrafish is the detection of atoh8 signal in skeletal structures of the viscerocranium. The generally accepted view is that, in zebrafish, skeletal structures developing from the branchial arches form as cartilage precursors first, later being replaced by bone, and that the two contributing cell types, i.e., cartilage as well as bone precursor cells, both are of neural crest origin [25]. The head mesoderm, on the other hand, seems to play a role only in contributing to muscle components of the viscerocranium [26, 27]. Thus, our results finding atoh8 expression in regions where neural crest cells only should contribute to the formation of skeletal elements seem to contradict our assumption that atoh8 labels cells of mesodermal origin. We cannot provide a definitive explanation for this observation at this stage of our investigations. Our previous study [12] revealed an expression pattern for atoh8 that does not relate to that for the pan-neural crest marker as described by Luo and colleagues [94], except, possibly, for a small population of cells located in the region around the otic vesicle. crestin expression does not persist beyond 72 hpf, a stage at which almost all neural crest-derived cells have overtly differentiated. Thus, there is a small possibility that atoh8 is also being expressed in an as yet unidentified subpopulation of neural crest cells. A valid alternative, still, would be that, at the interface where the cells of the two different embryonic lineages contribute to skeletogenesis, atoh8-positive, mesoderm derived cells might interact with neural crest derived cells. This interaction might also apply to skeletogenesis of the vertebrae centra between chordoblasts of the notochord and osteoblasts of the sclerotome.
Research relating atoh8 to developmental and or functional aspects of skeletogenesis is just beginning to emerge. Apart from our studies ([12] and this), there are no other publications investigating atoh8 in zebrafish skeletal development so far. Only a few studies exist in mice [10, 11] demonstrating a role of Atoh8 in skeletal development in vivo and in vitro. On the other hand, this transcription factor has been implicated in a multitude of developmental, physiological and tumour related processes, as reviewed in [2]. Existing developmental studies display a common theme regarding the general function of this transcription factor: Atoh8 seems to be coming into play in processes where the action of other factors regulating cell fate determination and differentiation needs to be finely tuned [1, 4, 8, 9, 10, 11, 75, 84, 95]. Thus, the transcription factor appears to act as a subtle regulator of cell and tissue fate determination. The results obtained in this study demonstrate that atoh8 is expressed in skeletal precursor tissues in the zebrafish head and trunk. A possible compensatory mechanism leads to a very subtle, nevertheless statistically significant phenotype. The mild effect of atoh8-disruption observed in the craniofacial and axial skeleton indicates that this mechanism cannot compensate for the loss of atoh8 at interfaces where more than one embryonic cell lineage contributes to bone and cartilage formation. Potential future studies include the investigation of how atoh8 interacts with known skeletogenic signalling pathways.
All data reported in this paper will be shared by the lead contact upon request.
BBS, and NF conceived and designed the research study. VCWW advised and aided NF in the creation of the atoh8kg117 mutant fish line. NF, SSKD, performed the experiments. NF acquired, analysed and interpreted the data. NF wrote the manuscript. BBS provided help and advice on drafting and editing the manuscript. All authors contributed to editorial changes in the manuscript. All authors read and approved the final manuscript. All authors have participated sufficiently in the work and agreed to be accountable for all aspects of the work.
Mutagenesis was performed at King’s College London under licence from the Home Office. All procedures performed at the RUB on animals reared at the Ruhr-University Bochum and used for the expression study and morphometric analysis are in compliance with the German Animal Protection Law (Tierschutzgesetz). All work at KCL complied with the Home Office guidance required by the Animals (Scientific Procedures) Act 1986 under the relevant personal, project and establishment licences held by the scientists and an institution. According to the German Tierschutzgesetz (TSchG, Animal Protection Law), no ethical approval is required.
Thanks to Bruno Correia de Silva and his staff for fish care at KCL, and Markus Westerbarkey for fish care at the Rub. We very much appreciate the great technical assistance provided by Amelie Ritter. Our thanks goes also to Hughes lab members for advice and reagents. We furthermore express our gratitude to Professor Simon Hughes, who helped with his critical and constructive comments on the manuscript. Special thanks go to Dr. Giorgia Bergamin and Dr. Yaniv Hinits who provided valuable insights into CRISPR/Cas-mediated mutagenesis and HRM-analysis. We also acknowledge the support provided by the DFG Open Access Publication Funds of the Ruhr-University Bochum.
This research was partly funded by the MRC Grant G1001029 and MR/N021231/1 to Simon Hughes.
The authors declare no conflict of interest.
Supplementary material associated with this article can be found, in the online version, at https://doi.org/10.31083/FBL26806.
References
Publisher’s Note: IMR Press stays neutral with regard to jurisdictional claims in published maps and institutional affiliations.