


 , Yue Kong 3,†, Yaohua Liu 1,2, Xu Wang 2, Hongyu Tang 1,2, Tingting Zang 2, Jian Yin 2,*
 , Lianping Gu 2,4,*
1 Department of Neurosurgery, Shanghai General Hospital Affiliated to Shanghai Jiao Tong University School of Medicine, Shanghai Jiao Tong University, 200080 Shanghai, China
2 Department of Neurosurgery, Shanghai General Hospital, 200080 Shanghai, China
3 Department of Oral Basic Medicine, Hospital of Stomatology, Sun Yat-sen University, 510062 Guangzhou, Guangdong, China
4 Department of Neurosurgery, Shanghai General Hospital Affiliated to Nanjing Medical University, Nanjing Medical University, 210029 Nanjing, Jiangsu, China
†These authors contributed equally.
Abstract
Glioma, the most common brain tumor in adults, exhibits marked hypoxia and invasiveness. Endoplasmic reticulum stress (ERS) and the unfolded protein response (UPR) have been implicated in tumor progression, while epithelial mesenchymal transition (EMT) drives invasion and metastasis.
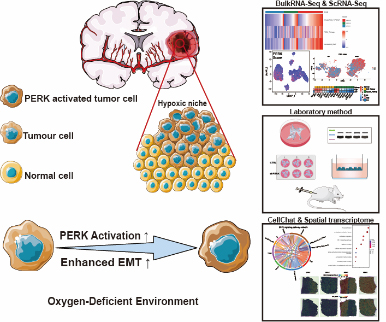
This study explored the role of ERS, particularly the PKR-like endoplasmic reticulum kinase (PERK) pathway, in promoting EMT and malignancy in glioma. Based on publicly available bulk transcriptomic data, we analyzed PERK activity in high-grade and hypoxic gliomas. PERK activation across glioma subtypes was compared using publicly available single-cell sequencing, and its correlation with EMT upregulation was evaluated using pseudotime analysis. The effects of PERK on glioma migration and invasion in a hypoxic environment were investigated using PERK-silenced glioma cell lines. In vivo tumorigenicity was assessed in nude mice by measuring tumor size and EMT marker expression. Intercellular communication was examined using CellChat analysis. Hypoxic niche regions were identified using publicly available spatial transcriptomics with PERK-EMT co-localization.
Hypoxia-induced PERK activation promoted EMT, enhancing glioma cell migration and tumor growth. High PERK signatures correlated with EMT activation in aggressive gliomas. Genetic silencing of PERK reduced the expression of EMT-related proteins, an effect partially reversed by hypoxia. Inhibition of PERK signaling decreased tumor size in mice. PERK-activated glioma subpopulations exhibited stronger cell–cell communication through secreted phosphoprotein 1 (SPP1)-CD44 interactions. Spatial transcriptomic analysis confirmed enrichment of the PERK/EMT pathway in hypoxic niches alongside SPP1-CD44 co-localization.
These findings reveal PERK-driven EMT as a key mechanism linking ER stress to glioma progression, with hypoxia reinforcing this axis. Targeting the PERK signaling axis or SPP1-CD44 interactions may offer novel therapeutic strategies against aggressive gliomas.
Graphical Abstract
Keywords
- glioma
- epithelial-mesenchymal transition
- hypoxia
- endoplasmic reticulum stress
- PERK kinase
Glioma, the most prevalent and aggressive brain tumor in adults, is defined by cellular heterogeneity with diverse subtypes and gene expression patterns [1, 2]. It also possesses the capacity for rapid growth and extensive angiogenesis under hypoxic conditions. The tumor microenvironment of glioma is complex, characterizing hypoxia, nutrient deprivation, and immune suppression, all of which collectively influence tumor growth and treatment responses [3]. The processes of epithelial-to-mesenchymal transition (EMT) and endoplasmic reticulum stress (ERS) are crucial processes closely associated with the hypoxic microenvironment in glioma progression [4, 5]. Although these signaling pathways highlight invasive, migratory, and malignant gliomas, the regulatory mechanisms associated with these proteins remain unclear. EMT is a fundamental biological process where cells undergo extensive biochemical changes, acquiring a mesenchymal phenotype with reduced cell adhesion and increased migratory capability [6] through the modulation of various epithelial markers such as E-cadherin, cytokeratin, laminin-1, and desmoplakin, as well as mesenchymal markers including vimentin, fibronectin, N-cadherin, Twist, Snail, and Slug [7]. In glioblastoma, multiple signaling pathways tightly regulate EMT, and hypoxia exacerbates migration and invasion by promoting this mesenchymal transition [8]. The mesenchymal subtype of glioma is closely associated with poor prognosis [9]. Targeting the hypoxic microenvironment may attenuate EMT in gliomas, thereby holding promise for glioma treatment [10].
In recent years, evidence suggests that the ERS response and its associated
unfolded protein response (UPR) signals govern tumor cell migration, invasion,
angiogenesis, and inflammation [11]. As a key branch of the UPR, PKR-like
endoplasmic reticulum kinase (PERK) signaling is activated by phosphorylating
eukaryotic initiation factor 2
CD44 is a widely recognized marker of glioma stem cells, extensively expressed in the mesenchymal subtype of gliomas, and is associated with poor prognosis [18]. Inhibiting CD44 can reduce hypoxia-induced stemness in gliomas, thereby exerting therapeutic effects [19]. Secreted phosphoprotein 1 (SPP1), as a chemokine, regulates cell adhesion, movement, and activation in cancers, including gastric, liver, and pancreatic cancers, causing tumor progression and metastasis [20, 21, 22]. SPP1+macrophages are now considered immune barriers in liver cancer immunotherapy and influence treatment outcomes [23]. The SPP1-CD44 signaling pathway is implicated in gliomas and closely associated with the PI3K/Akt and related pathways [24].
This study aimed to comprehensively investigate the mechanisms by which hypoxia-induced ERS promotes glioma progression, utilizing a multi-omics approach. Our objectives included analyzing multi-dimensional transcriptomic data from publicly available datasets, performing functional assays in cell lines and animal models, and evaluating spatial interactions within the tumor microenvironment to elucidate the underlying pathways. In summary, our studies revealed that PERK pathway activation in glioma cells under hypoxic conditions is accompanied by EMT, which promotes invasion, migration, and malignant transformation of gliomas. Using single-cell sequencing, we explored changes in the hypoxia-induced PERK activation and EMT pathways in glioma cells, and their interactions with non-tumor cells in the tumor microenvironment. Spatial transcriptomics confirmed that hypoxic regions enriched with PERK-activated tumor cells exhibit heightened EMT pathway activation, accompanied by co-localization of SPP1 and CD44. Silencing PERK decreased EMT pathway activity, and our established mouse model further demonstrated the therapeutic potential of targeting the PERK pathway for glioma. Overall, our research uncovers novel mechanisms underlying glioma invasion, migration, and progression, offering new insights and potentially effective treatment strategies.
Bulk RNA-seq data were obtained from the Chinese Glioma Genome Atlas (CGGA, http://www.cgga.org.cn/), specifically dataset mRNAseq_325, which includes transcriptomic and clinical data from 325 glioma samples. For specific analyses, subsets of samples were used according to World Health Organization (WHO) grades: 103 Grade Ⅱ, 79 Grade Ⅲ, and 139 Grade Ⅳ cases [25]. Single-cell RNA-seq data were sourced from the Gene Expression Omnibus (GEO, https://www.ncbi.nlm.nih.gov/geo/) dataset GSE182109, from this cohort, we selected newly diagnosed glioblastoma (ndGBM) and low-grade glioma (LGG) samples for downstream analysis. It is noteworthy that a key commonality between the CGGA bulk dataset and this single-cell dataset is the inclusion of glioma samples across different grades, enabling multimodal exploration of our research questions [25, 26, 27]. Spatial transcriptomics data from Datadryad (https://doi.org/10.5061/dryad.h70rxwdmj) were accessed. Gene sets related to EMT and hypoxia were retrieved from the HALLMARK database (https://www.gsea-msigdb.org/gsea/msigdb/index.jsp), while those associated with PERK signaling were obtained from the REACTOME database (https://curator.reactome.org/) [28, 29, 30].
PERK, EMT, and hypoxia Gene sets from the HALLMARK and REACTOME databases were employed to transform the expression matrix of glioma samples from the CGGA dataset into enrichment score (ES) matrices using the R package in RStudio R 4.1.2 (R Core Team, Vienna, Austria). This process generated GSVA enrichment scores for each gene set across all samples, which were visualized using the ComplexHeatmap 2.13.1 (Guangchuang Yu, Hong Kong, China).
Clinical data and PERK scores from the CGGA database were used to perform survival analysis. Statistical analyses and survival data visualization were conducted using the R package survival in RStudio.
Differential gene expression analysis on transcriptome count data was conducted between two groups, with the reference group designated as “Low”. The DESeq2 1.43.0 (Michael Love, Berkeley, CA, USA) was used to identify differentially expressed genes on the raw count matrix, following standard procedures. Differential expression was visualized through volcano plots using ggplot2 3.4.2 (Hadley Wickham, New Zealand). Next, PPI network analysis was performed using the STRING database (https://string-db.org) on the top 100 upregulated genes identified in the high PERK score group from the CGGA database [31]. Finally, we utilized igraph for data processing, including data cleaning and organization, followed by visualization of the network graph by using ggraph.
We conducted GSEA on the differentially expressed genes, including Gene Ontology (GO), Kyoto Encyclopedia of Genes and Genomes (KEGG), and Hallmark pathways, using gene sets from the MSigDB Collections [29]. Initially, molecular identifiers in the input data were converted to ensure compatibility with gene set databases. Subsequently, we employed the clusterProfiler 4.2.2 (Guangchuang Yu, Hong Kong, China) in R to perform GSEA. GSEA results were visualized to identify enriched pathways. In addition, we computed immune infiltration levels in the CGGA dataset using the ssGSEA Algorithm from the GSVA 1.42.0 (Robert K. Gideons, Barcelona, Catalonia, Spain), based on markers for 24 immune cell types [32].
We analyzed single-cell RNA sequencing data using the Seurat package in R 4.1.2 (R Core Team, Vienna, Austria) by RStudio 2021.09.1 Build 372 (Posit, Boston, MA, USA). Initially, genes expressed in fewer than three cells and cells expressing fewer than 100 genes were filtered out. Next, the RemoveDoublets function was applied to eliminate 4% of doublets, followed by exclusion of samples with mitochondrial gene expression exceeding 10%. Gene expression variability was determined using Seurat’s FindVariableFeatures function. Dimensionality reduction was performed with Principal Component Analysis (PCA), and batch effects were corrected using the RunFastMNN algorithm. UMAP clustering identified 26 distinct clusters; cell types were annotated by integrating reported and highly variable marker genes. Tumor cell subclusters were then extracted for further dimensionality reduction and clustering using t-Distributed Stochastic Neighbor Embedding (tSNE). The annotation of glioma cell subtypes was based on gene sets and signature genes provided by previously published literature [33].
We analyzed the single-cell transcriptome data by employing the AddMododuleScore method to assess the activity of specific gene expression modules at the cellular level. This method transforms gene expression data into numerical scores that reflect the involvement of each cell in the target biological processes. Results were visualized using ggplot2.
We utilized the to conduct Pseudo-temporal analysis of tumor cell populations using machine learning methods were performed using the monocle2 2.22.0 (Cole Trapnell, Seattle, WA, USA) [34]. Changes in the expression of key marker genes associated with the EMT- and hypoxia-related marker genes were observed along their transitions in tumor cell subpopulations.
Cell-cell interactions between PERK-activated glioma cells and their immune microenvironment were explored using the CellChat 1.6.1 (Suoqin Jin, Hong Kong, China) [35]. Intercellular communication was simulated interactions involving ligands, receptors, and their respective auxiliary factors were evaluated. Signaling pathways were visualized using the “netVisual_aggregate” function. Ligands and receptors were categorized as outgoing and incoming signals, respectively.
We utilized the Seurat package in RStudio (version 4.1.2), to read and assess spatial transcriptomics data. Data were normalized using SCTransform, ensuring robustness in downstream analyses. We assigned pathway scores to each spatial spot through AddMoudleScore, allowing the evaluation of pathway activities across spatial locations. Gene and pathway expression were visually represented using SpatialFeaturePlot in Seurat 4.3.0 (Satija Lab, NY, USA).
Single-cell RNA sequencing data were deconvoluted into spatial transcriptomics data using the SPOTlight method. Gene expression matrices for each cell were extracted from our single-cell RNA sequencing data. We integrated spatial information and gene expression patterns employing SPOTlight to map single-cell data onto a spatial grid and visualize it using spatial feature plots. Furthermore, the relationship between the proportion of glioma cells with high activation of PERK and the EMT score in each SPOT was investigated through correlation analysis.
The glioma cell lines (LN229) obtained from Procell Life Science & Technology Co., Ltd. (Wuhan, China). These cell lines were cultured in a 5% O2 normal oxygen cell incubator and a 1% O2 hypoxia cell incubator according to the experimental protocol. Next, the shPERK lentivirus was transduced into glioma cells, which were expanded to the required number, and a stably transfected PERK-low-expression glioma cell line was selected. The cells were randomly categorized into the negative control and the experimental groups. All cell lines were validated by STR profiling and tested negative for mycoplasma.
PERK and negative control (NC) shRNAs were first constructed according to the effective PERK shRNA (5′-GCAGGUCAUUAGUAAUUAU-3′) and NC sequences (5′-UUCUCCGAACGUGUCACGU-3′), which were validated in this study. For transient transfection experiments, PERK and negative control (NC) shRNAs were directly used in this study. For stable transfection, PERK and NC shRNAs were cloned into the pENTR/U6-GFP vector containing GFP, followed by recombination between the pENTR/U6-shRNA-GFP and the pLenti6/Block-it-DEST vector. The resultant vector and package plasmid were co-transfected into HEK 293T cells, and viral particles were collected after 48 h. LN229 cells were then infected with lentiPERK shRNA or NC vector, and cells expressing GFP were chosen for further culture.
Antibodies used for Western blotting were as follows: anti-PERK (Santa Cruz
Biotechnology, Inc., cat. no. sc-13073, 1:100, Dallas, TX, USA), anti-p-PERK (Thr981) (Santa Cruz
Biotechnology, Inc., cat. no. sc-32577, 1:100, Dallas, TX, USA),
anti-
The cells were cultured in serum-free medium for 24 h, trypsinized, centrifuged
at 1500 rpm for 3 min, and the supernatant was aspirated. The cells were
resuspended in phosphate-buffered saline (PBS), the supernatant was discarded
following centrifugation, resuspended again in serum-free medium containing 0.1%
BSA to a density of 1
The cells were seeded on 6-well plates in triplicate. After overnight culture,
the cells were transversely scratched in the middle of the well with a
pre-sterilized pipette tip. The floating cells were washed with PBS and fresh
medium was added. The cells were visualized under a microscope (Leica, DMi1,
Shanghai, China) and images were taken every 24 h. Image-Pro Plus 6.0 (Media Cybernetics, Rockville, MD, USA) was
used to calculate the scratch area before and after healing was calculated using
the IPP software, and the wound closure rate between the different groups was
compared. Wound closure rate using the wound contraction ratioformula, defined as
(initial area – current area) / initial area
Animal experiments were reviewed and approved by the Institutional Animal Care
and Use Committee (IACUC) of Shanghai General Hospital (ID:2021SQ054). All
experimental procedures involving animals were conducted adhering strictly with
with the Guide for the Care and Use of Laboratory Animals (NIH Publication No.
86-23, revised 1985, U.S. National Academy of Sciences), with predefined humane
endpoints (tumor volume
Tissue samples were fixed with 4% paraformaldehyde, dehydrated in an alcohol gradient, embedded in xylene-treated paraffin, sliced, and heated at 60 ℃ in an oven for 2 h. The slices were dewaxed and hydrated. The antigens were retrieved by placing the slices in the antigen retrieval solution for 10 min under high pressure. After soaking in PBS, the endogenous peroxidase was blocked with 3% H2O2 for 15 min at room temperature. The samples were rinsed with PBS at room temperature and incubated with goat serum for 15 min at room temperature, followed by primary antibodies overnight at 4 °C. The specific antibodies and dilutions were as follows: anti-Vimentin (Abcam, cat. no. ab92547, 1:200, Shanghai, China), anti-E-cadherin (Abcam, cat. no. ab231303, 1:200, Shanghai, China), and anti-N-cadherin (Santa Cruz Biotechnology, Inc., cat. no. SC-53488, 1:50, Dallas, TX, USA). The prepared wash buffer was added and stored in the refrigerator at 4 ℃ overnight. The samples were then soaked in PBS, and the prepared horseradish-labelled sheep anti-mouse/rabbit IgG polymer was added and incubated at 37 ℃ for 30 min. Then, the DAB reagent and haematoxylin stain were applied for 3 min, and the slides were rinsed with 1% hydrochloric acid ethanol. The samples were separated, regressed to blue, dehydrated using gradient alcohol, and cleared with xylene. The stained sections were observed under a neutral resin seal microscope and analysed statistically.
Data are expressed as the mean
The activation status of hypoxia across different grades of gliomas was initially investigated by GSVA to score glioma samples from the CGGA dataset using hypoxia gene sets from HALLMARKER, and visualizing the results using the scatter plot (Fig. 1A). The hypoxia score in gliomas increases with tumor grade. Next, we divided the glioma samples into high- and low-hypoxia groups. Enrichment analysis of differentially expressed genes showed that the high hypoxia group was enriched in signaling pathways related to ERS and EMT, such as endoplasmic reticulum lumen, extracellular matrix structural constituent, and leukocyte-mediated immunity pathways (Fig. 1B). Further correlation analysis revealed that, compared with low-grade gliomas, the association between hypoxia and the PERK pathway was stronger in high-grade gliomas, suggesting a possible differential activation of the PERK pathway in high-grade gliomas than in low-grade gliomas under hypoxic conditions (Fig. 1C). We further stratified the cohort into high and low PERK groups based on GSVA scores, and observed lower overall survival (OS) in the high PERK group (Fig. 1D).
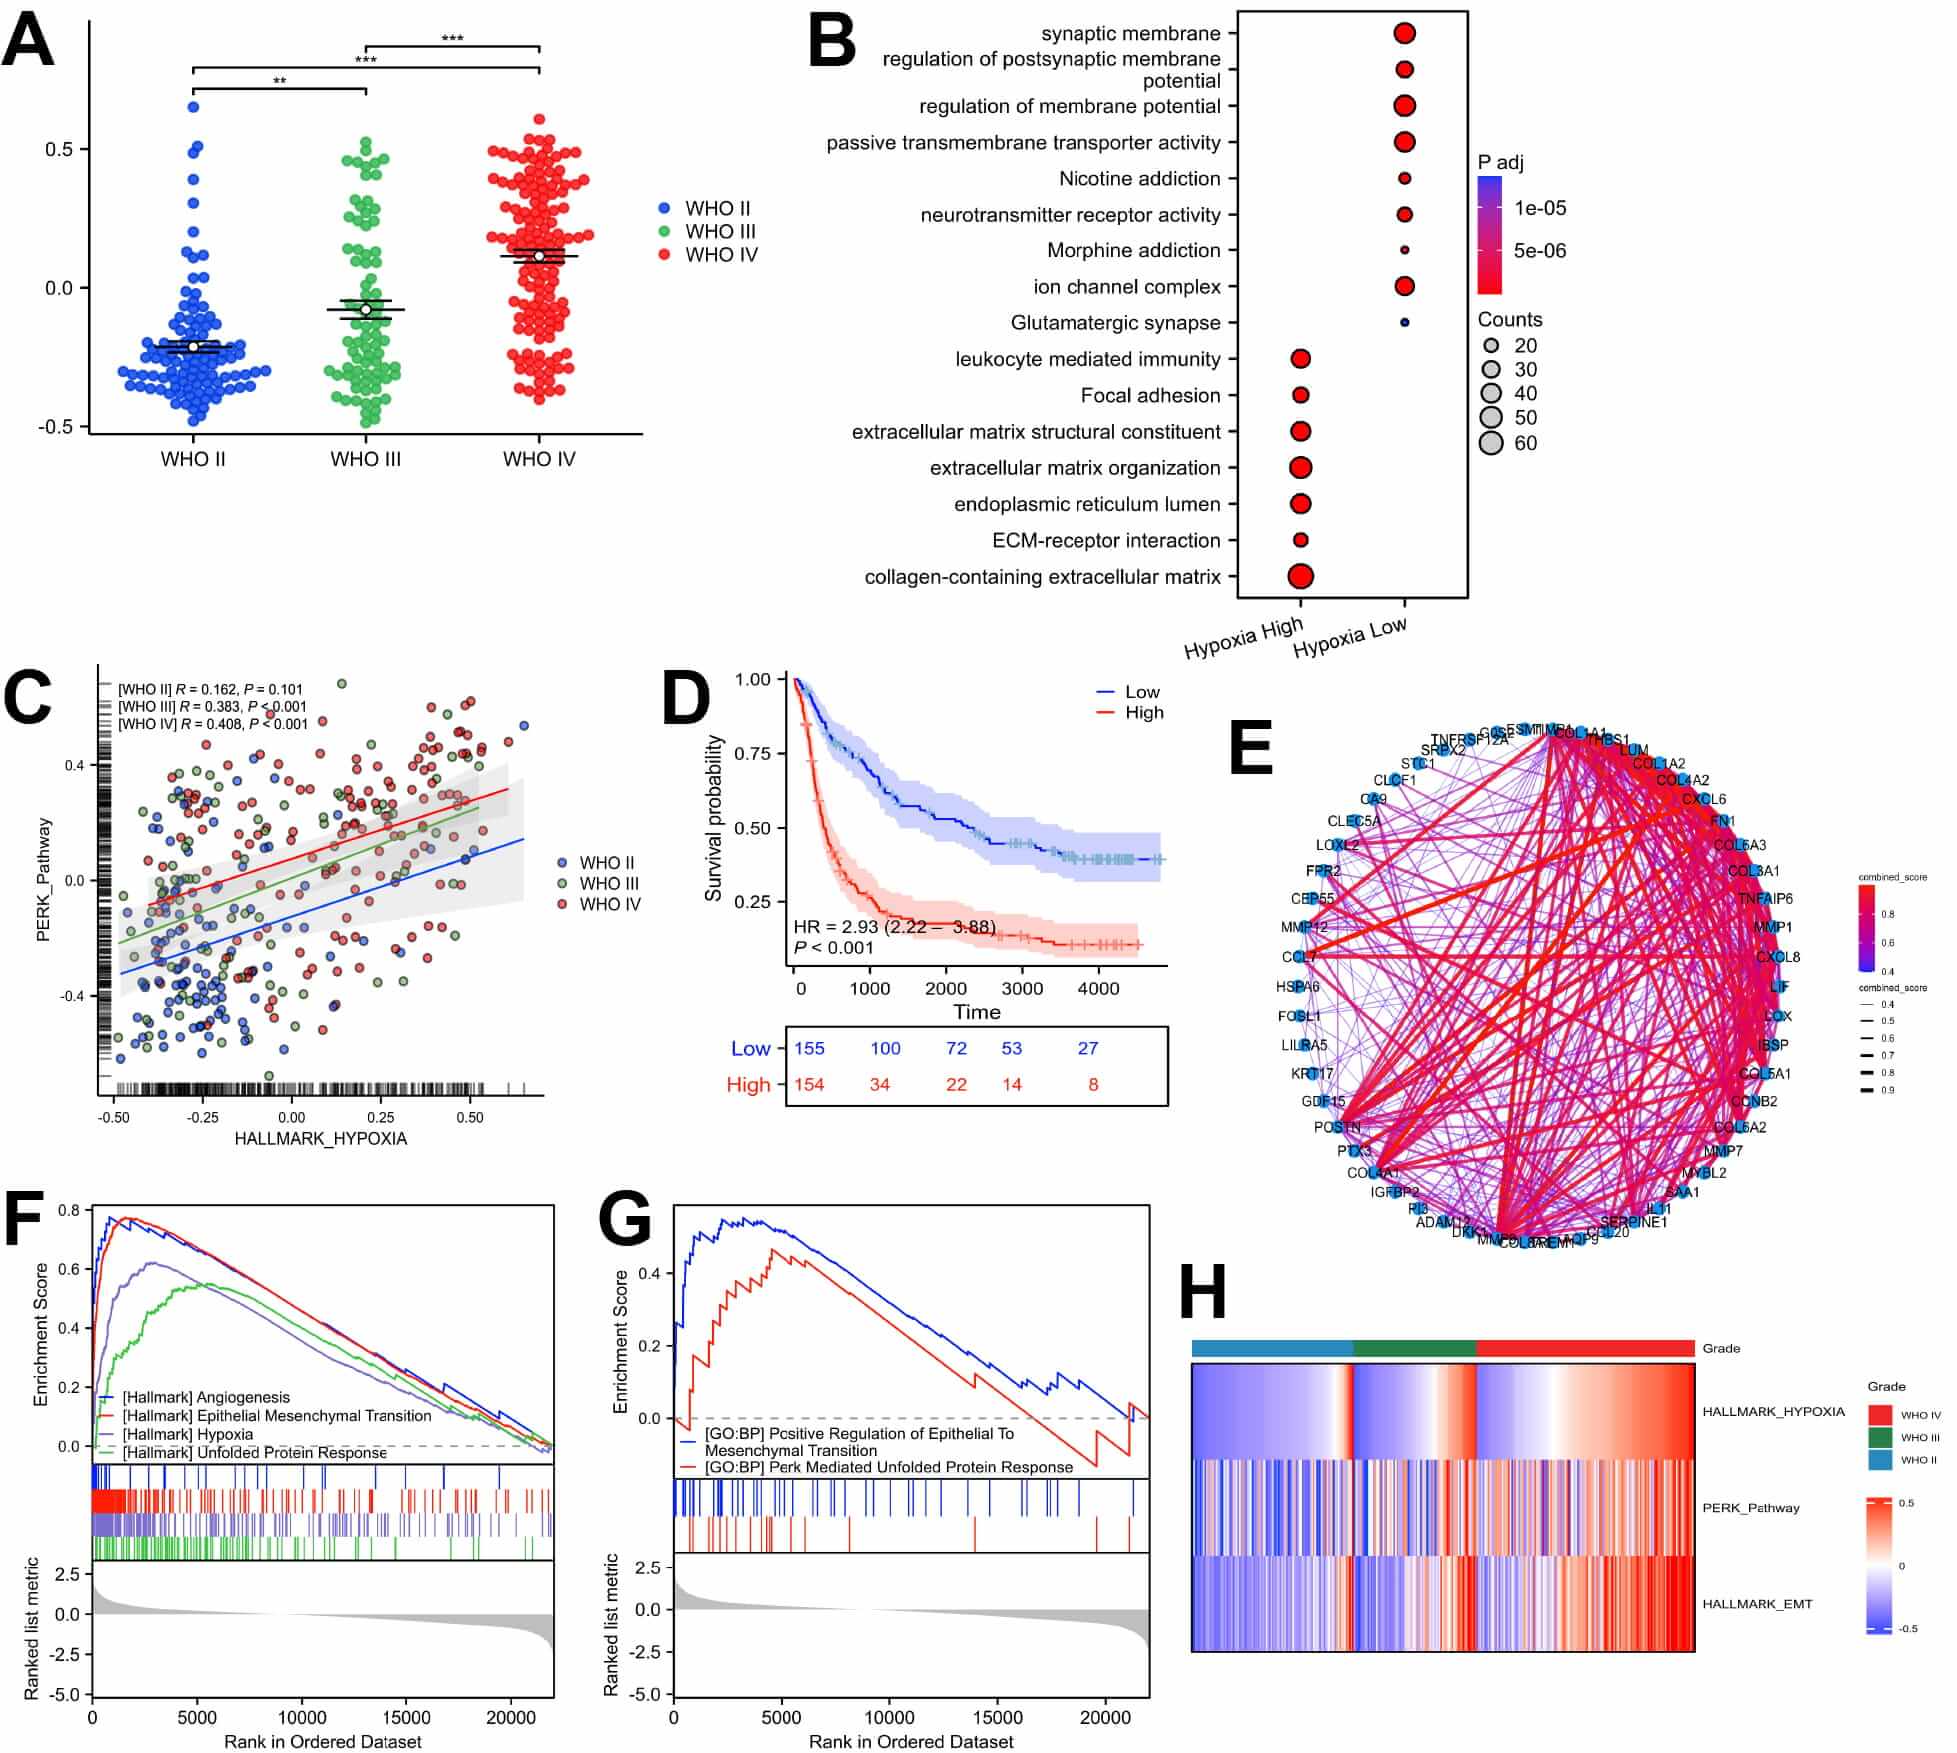 Fig. 1.
Bulk transcriptomic analysis showed a correlation between
PKR-like endoplasmic reticulum kinase (PERK) pathway activation and
epithelial-mesenchymal transition (EMT) in hypoxic gliomas. (A) Scatter plots of
hypoxia Gene Set Variation Analysis (GSVA) scores for gliomas of different
grades. (B) Enrichment analysis of differentially expressed genes in high- and
low-hypoxia groups in glioma. (C) Scatter plot presenting the correlation between
hypoxia and PERK score in gliomas of different grades. (D) Survival curve of
high- and low-PERK groups in glioma. (E) Protein-Protein Interaction network
analysis of the top 100 upregulated genes in the high-PERK activation group.
(F,G) Gene Set Enrichment Analysis of differentially expressed genes between
high- and low-PERK activation groups. (H) GSVA analysis on gliomas from the
Chinese Glioma Genome Atlas (CGGA) dataset and a heatmap to represent the
findings. ** p
We conducted differential analysis between high and low PERK score groups to explore whether high activation of PERK in gliomas correlates with EMT (Supplementary Fig. 1A). Subsequently, we performed PPI network analysis on significantly upregulated genes in the high PERK activation group, revealing elevated expression of MMP family genes associated with EMT (Fig. 1E). Further GSEA indicated significant enrichment of EMT and hypoxia-related pathways in the high PERK group (Fig. 1F,G). ssGSEA analysis further revealed higher levels of macrophage infiltration in the high PERK group, indicating that PERK activation alters the immune microenvironment of gliomas (Supplementary Fig. 1B). Thus, these findings revealed that high-grade gliomas exhibit significantly higher activation in hypoxia, PERK, and EMT pathways than low-grade gliomas (Fig. 1H).
The cellular characteristics and interactions within glioma cells and their tumor microenvironment following PERK activation were examined employing publicly available single-cell sequencing data. We selected two cases each of low-grade and high-grade gliomas for subsequent dimensional reduction clustering to distinguish 11 cell subtypes (Fig. 2A,B, Supplementary Fig. 1C). GSVA revealed that compared with low-grade gliomas, high-grade gliomas exhibited significant activation of EMT, hypoxia, and UPR pathways (Fig. 2C). Additionally, AddmodleScore confirmed significantly higher activation of these pathways in high-grade gliomas than in low-grade gliomas, with a cluster of tumor cell subpopulations only in high-grade gliomas exhibiting a state of hypoxia, PERK, and EMT activation (Fig. 2D–G, Supplementary Fig. 1D). This finding is consistent with our previous observations.
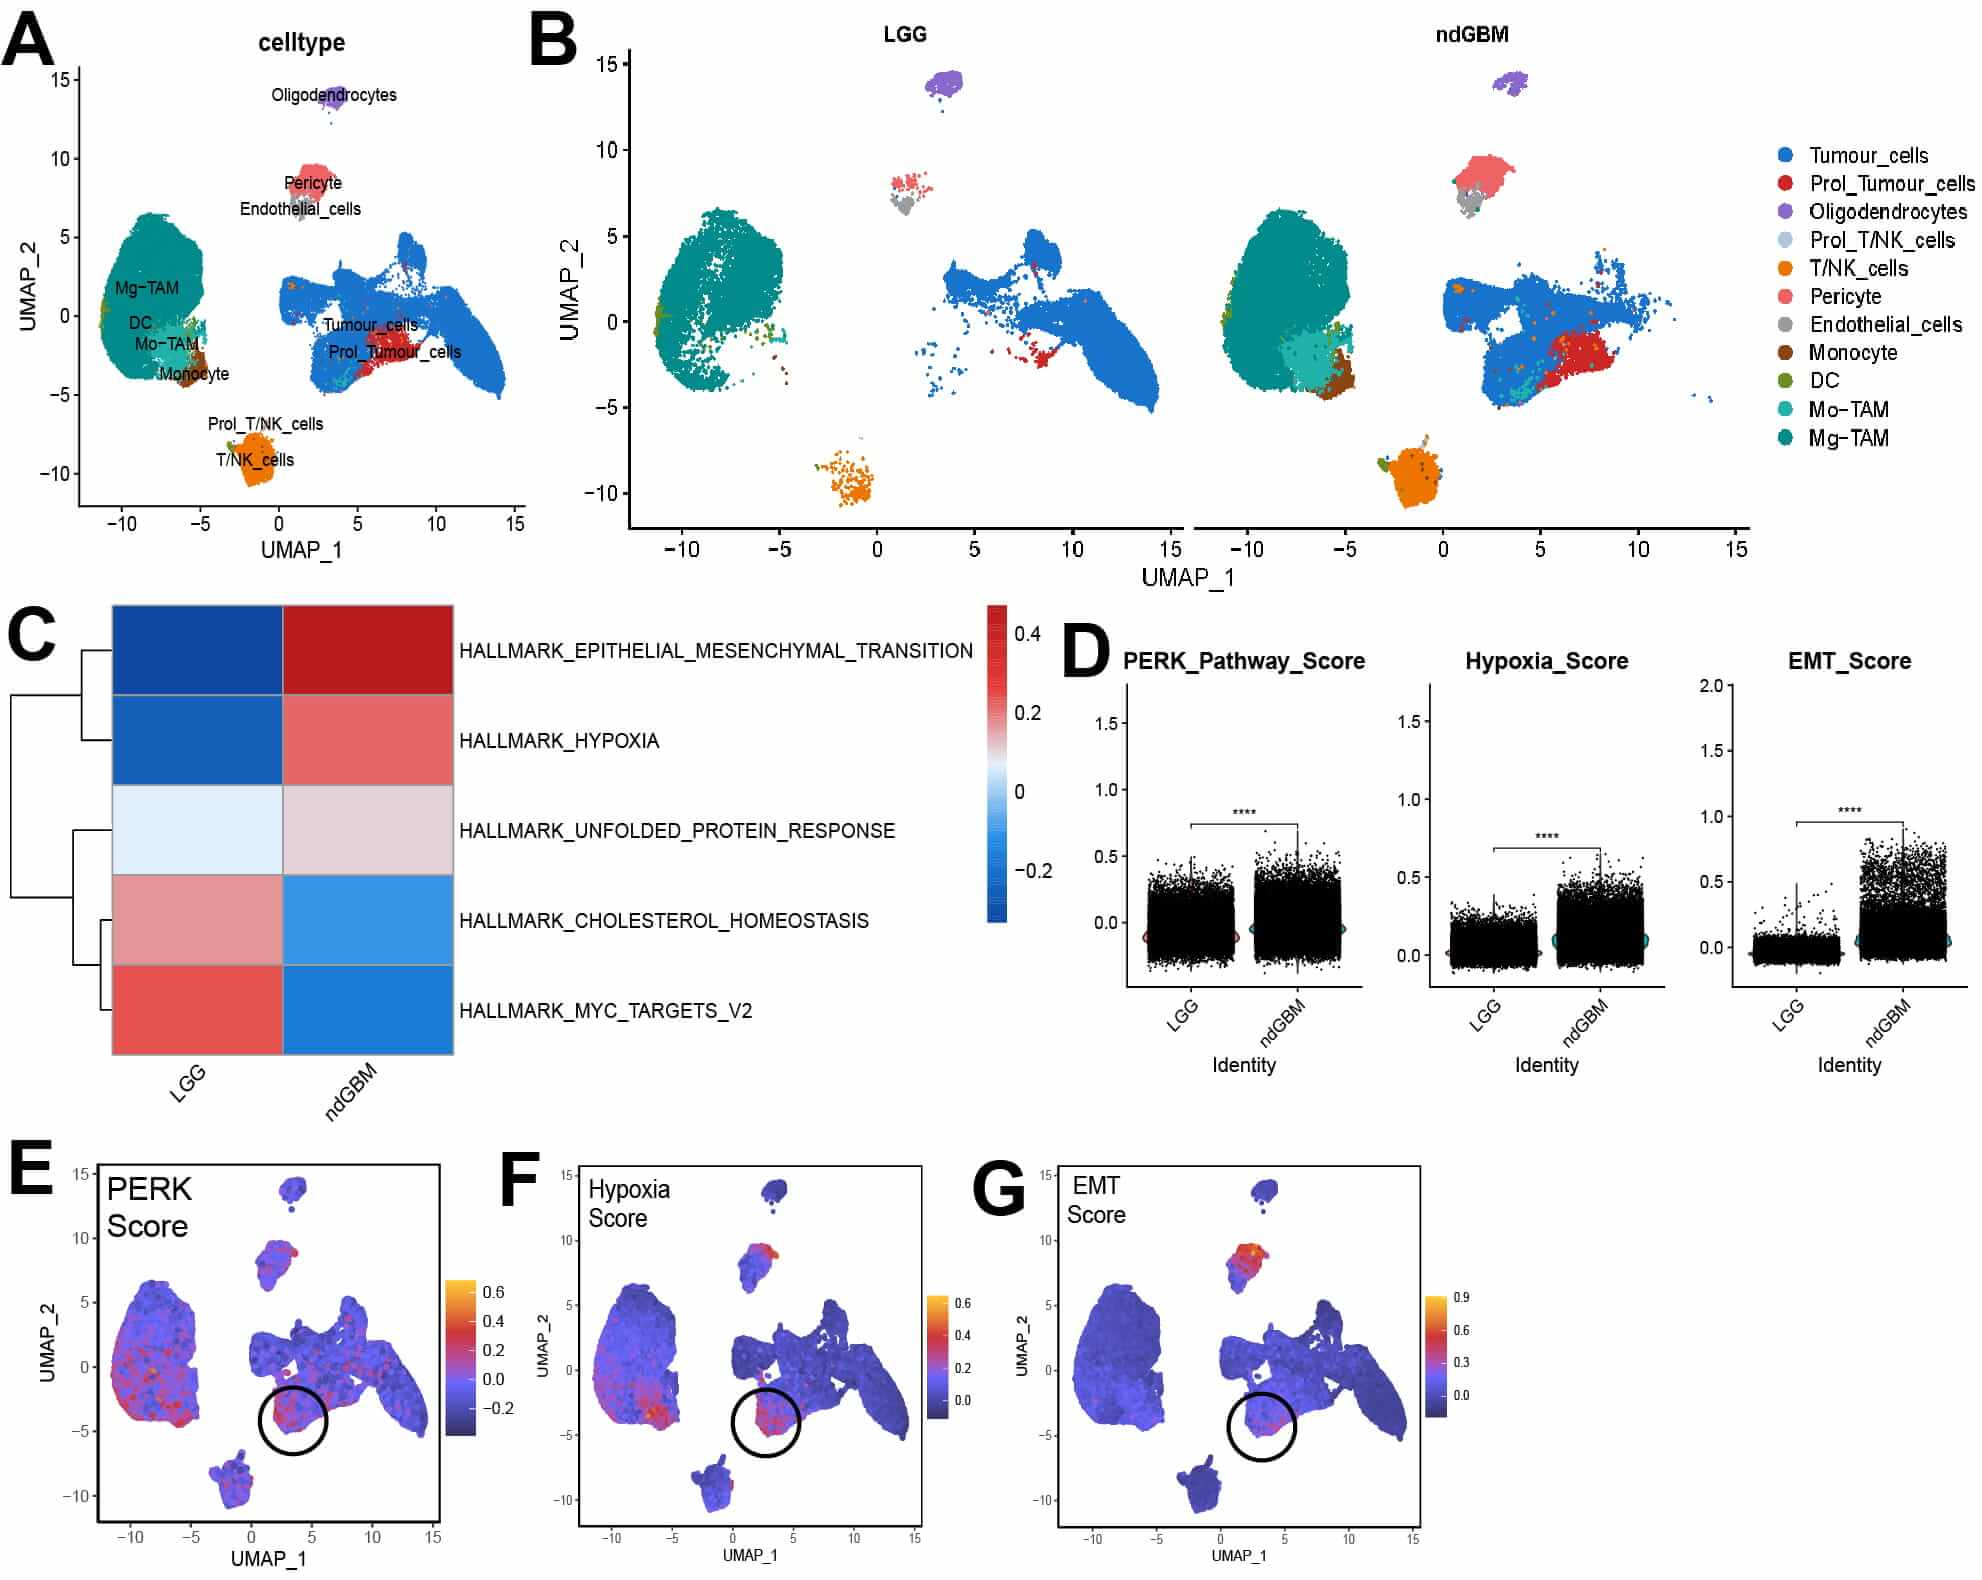 Fig. 2.
PKR-like endoplasmic reticulum kinase (PERK), hypoxia and
epithelial-mesenchymal transition (EMT) activation in different grades of glioma
and cell subpopulations. (A,B) Uniform Manifold Approximation and Projection
(UMAP) plots showing annotation of high- and low-grade glioma cells. (C) Gene Set
Variation Analysis scoring of high- and low-grade gliomas based on the Hallmark
database. (D) Violin plots of AddModuleScore for PERK, hypoxia, and EMT pathways
in different grades of gliomas. (E–G) UMAP featureplot of PERK, hypoxia, and EMT
pathways scores in gliomas. Black circles highlight tumor cell populations
exhibiting high expression of the three specified pathways. **** p
Specific tumor subclusters were explored after isolating tumor cells and further subdividing them into AC_like, MES_like, NPC_like, OPC_like, and Prolifeing_Tumor subtypes by their markers. Then we computed the GSVA scores for each tumor subset based on gene sets derived from published literature. The subgroups exhibited the highest enrichment scores corresponding to their respective gene signatures. This consistency supports the validity and reliability of our cell type annotations (Supplementary Fig. 1E,F and Supplementary Table 1), mesenchymal-like (MES-like) subtype were predominantly present in high-grade gliomas (Fig. 3A,B). The MES-like subtype of tumor cells revealed the highest PERK scoring (Fig. 3C), based on which, we categorized glioma cells into high and low PERK activation groups. The proportion of high PERK activation tumor cells was significantly higher in high-grade gliomas (Fig. 3D). Subsequent GSEA analyses exhibited enhanced activation of EMT, hypoxia, and UPR pathways in the high activation group, further establishing the close association among hypoxia, PERK, and EMT (Fig. 3E,F). Next, a pseudo-temporal analysis was conducted to further investigate the relationship among PERK activation and EMT and hypoxia in glioma cells. The quasi-temporal heatmap simulates the developmental trajectory of the cell (Fig. 3G). At the cellular subtype level, the MES subtype predominantly appeared in the later stages of the pseudo-temporal trajectory, corresponding closely to the developmental branch associated with high PERK activation group (Fig. 3H, Supplementary Fig. 2A,B). We further examined the distribution of key EMT-related genes across high- and low-PERK activation groups and observed that the transcriptional expression levels of most hypoxia- and EMT-related genes increased with the transition to the high-PERK activation subgroup (Fig. 3I). These results suggest that the activation of the PERK pathway is accompanied by upregulation of EMT-related genes.
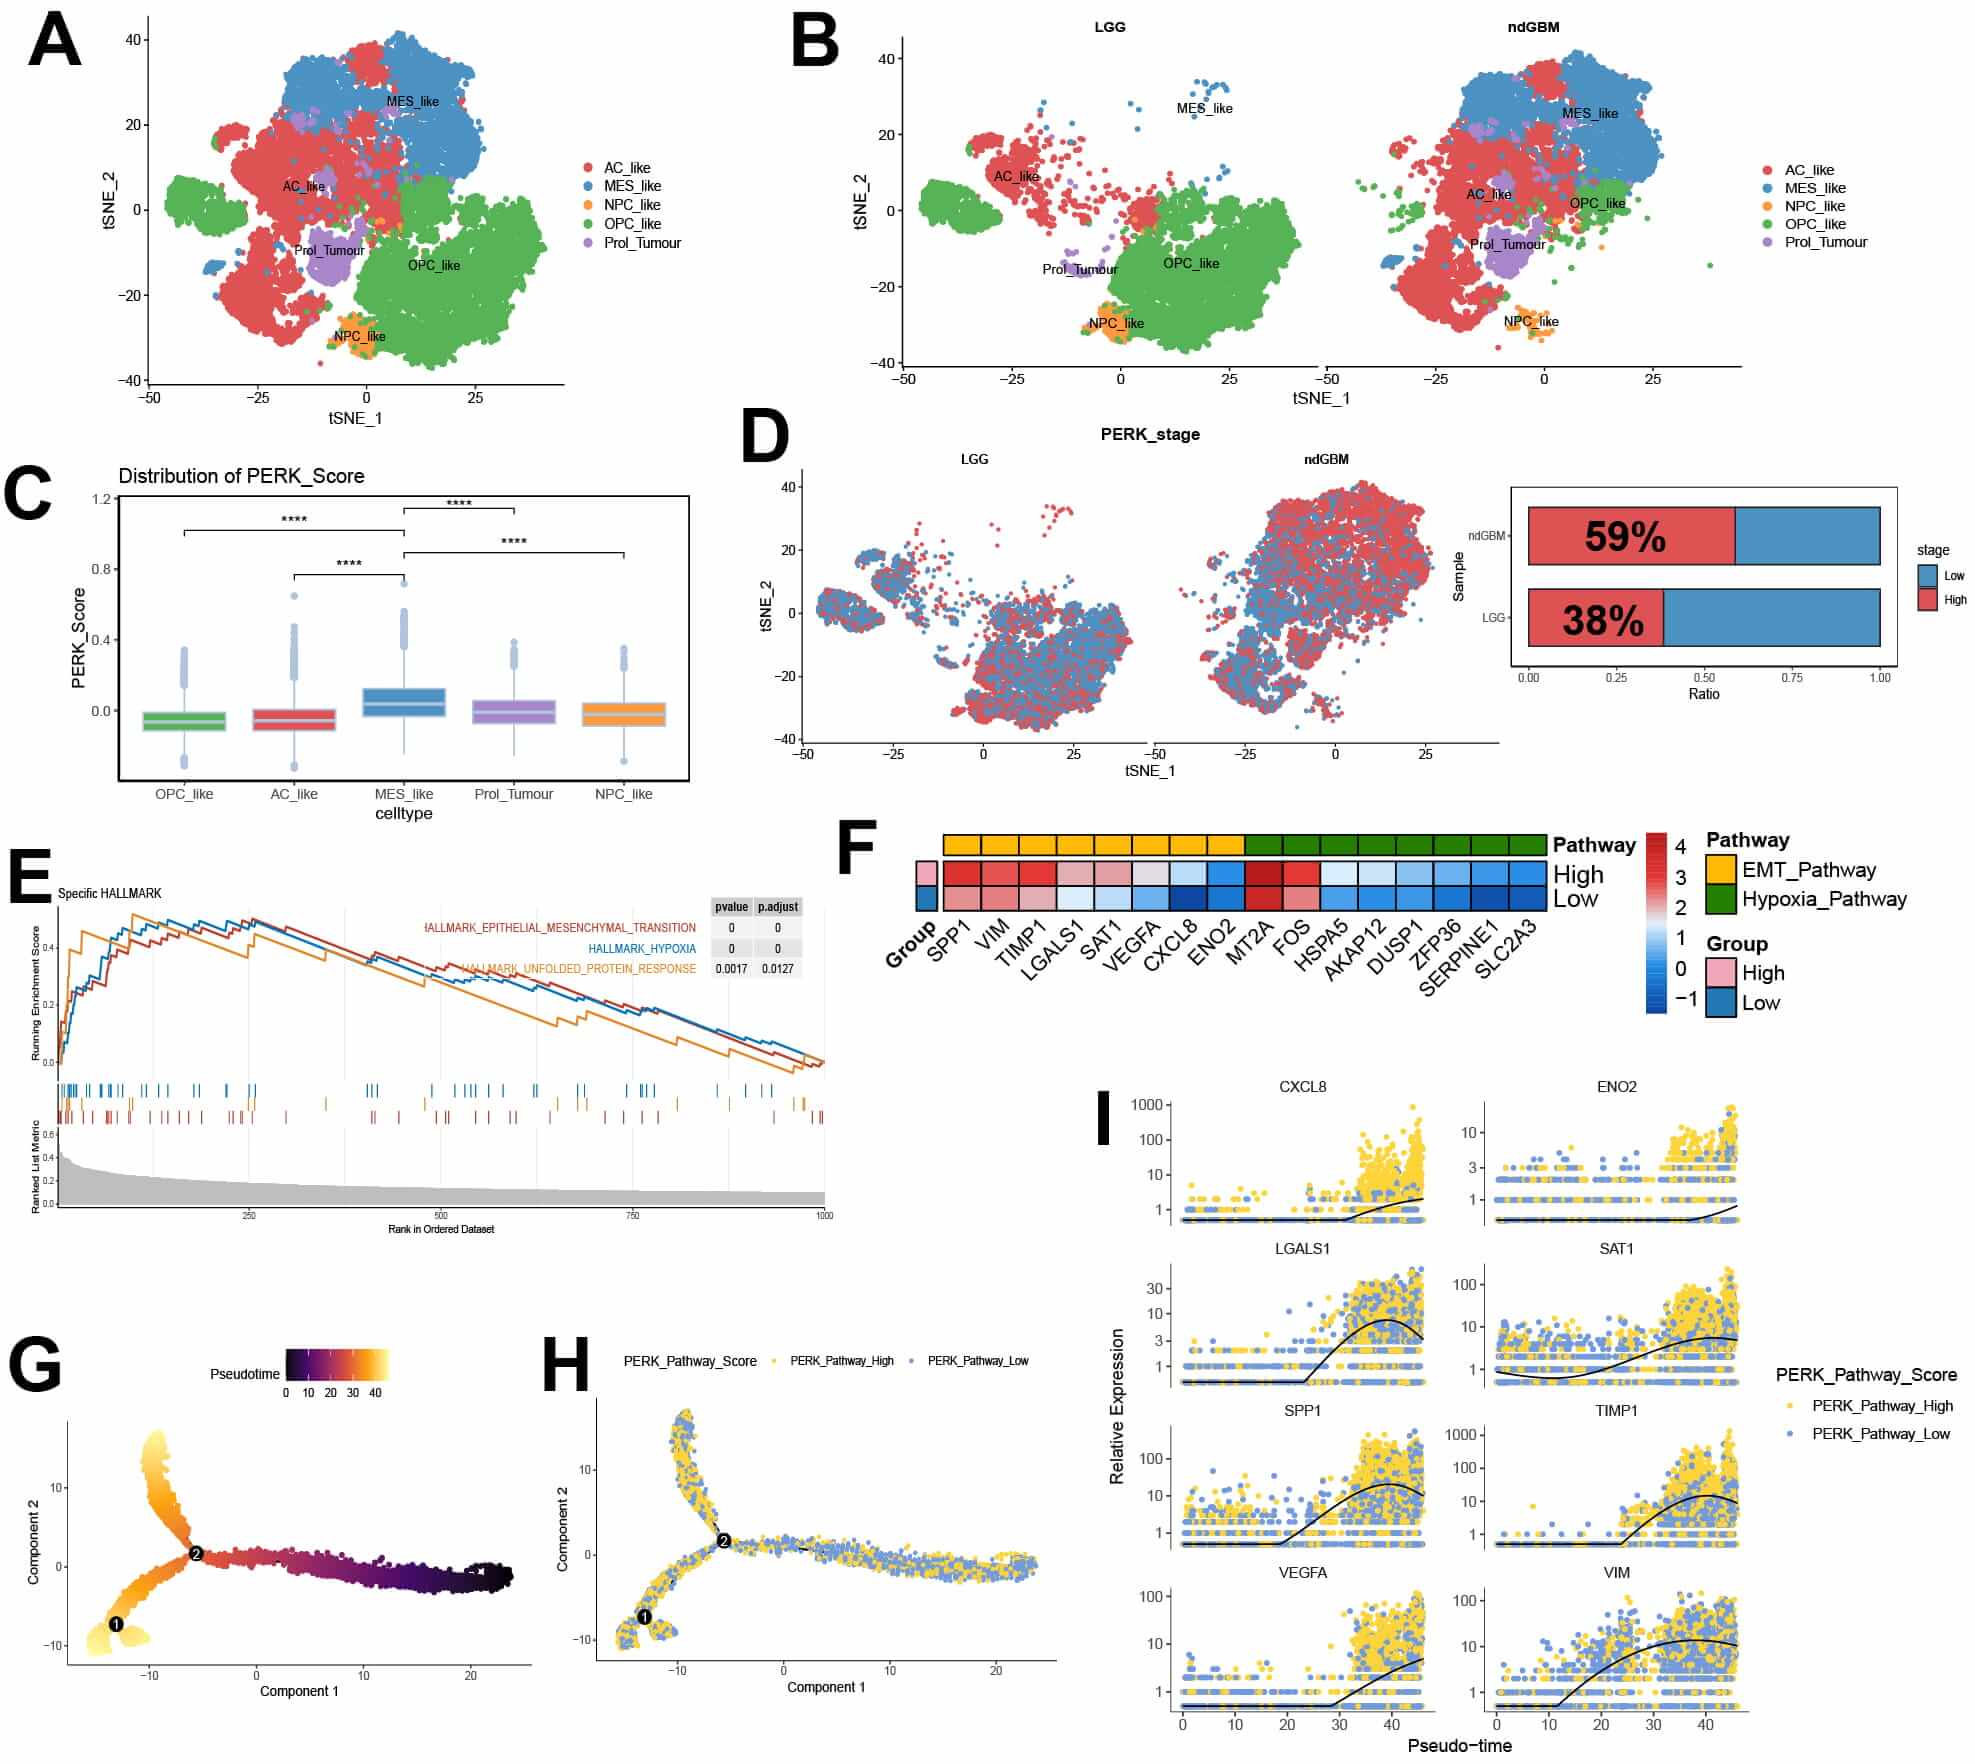 Fig. 3.
Single-cell analysis of tumor cell subpopulations shows a strong
association between high-PKR-like endoplasmic reticulum kinase (PERK) activation
and epithelial-mesenchymal transition (EMT). (A,B) Uniform Manifold
Approximation and Projection plots of glioma cell subpopulations in high- and
low-grade gliomas. (C) Box plots of AddModuleScore for the PERK pathway in
different cell subpopulations. (D) t-Distributed Stochastic Neighbor Embedding
(t-SNE) map of glioma cell distribution in high and low PERK pathways. (E) Gene
Set Enrichment Analysis of differentially expressed genes between high- and
low-PERK pathway glioma tumor cells. (F) A heatmap presenting key gene expression
for selected EMT and hypoxia pathways in high- and low-PERK pathway groups. (G,H)
A pseudotime heatmap of tumor cells in gliomas. (I) Changes in expression of
selected EMT-related genes along the pseudotime developmental axis in gliomas.
**** p
The role of PERK was further investigated to assess the invasion and migration ability of glioma cells under hypoxic conditions. We first evaluated the effect of PERK knockdown on LN229 cells under hypoxia. Western blot analysis indicated that the knockdown of PERK significantly inhibited the expression of phosphorylated PERK in glioma cells relative to control groups, whereas hypoxic conditions partially restored p-PERK levels (Fig. 4A). Our results further demonstrated a reduction in E-cadherin expression, but enhanced vimentin and N-cadherin expression in glioma cells exposed to hypoxic conditions (Fig. 4B). PERK knockdown also inhibited the invasion and migration ability of glioma cells under hypoxia (Fig. 4C,D). Thus, PERK silencing lowered the invasion and migration ability of in vitro glioma cells under hypoxia.
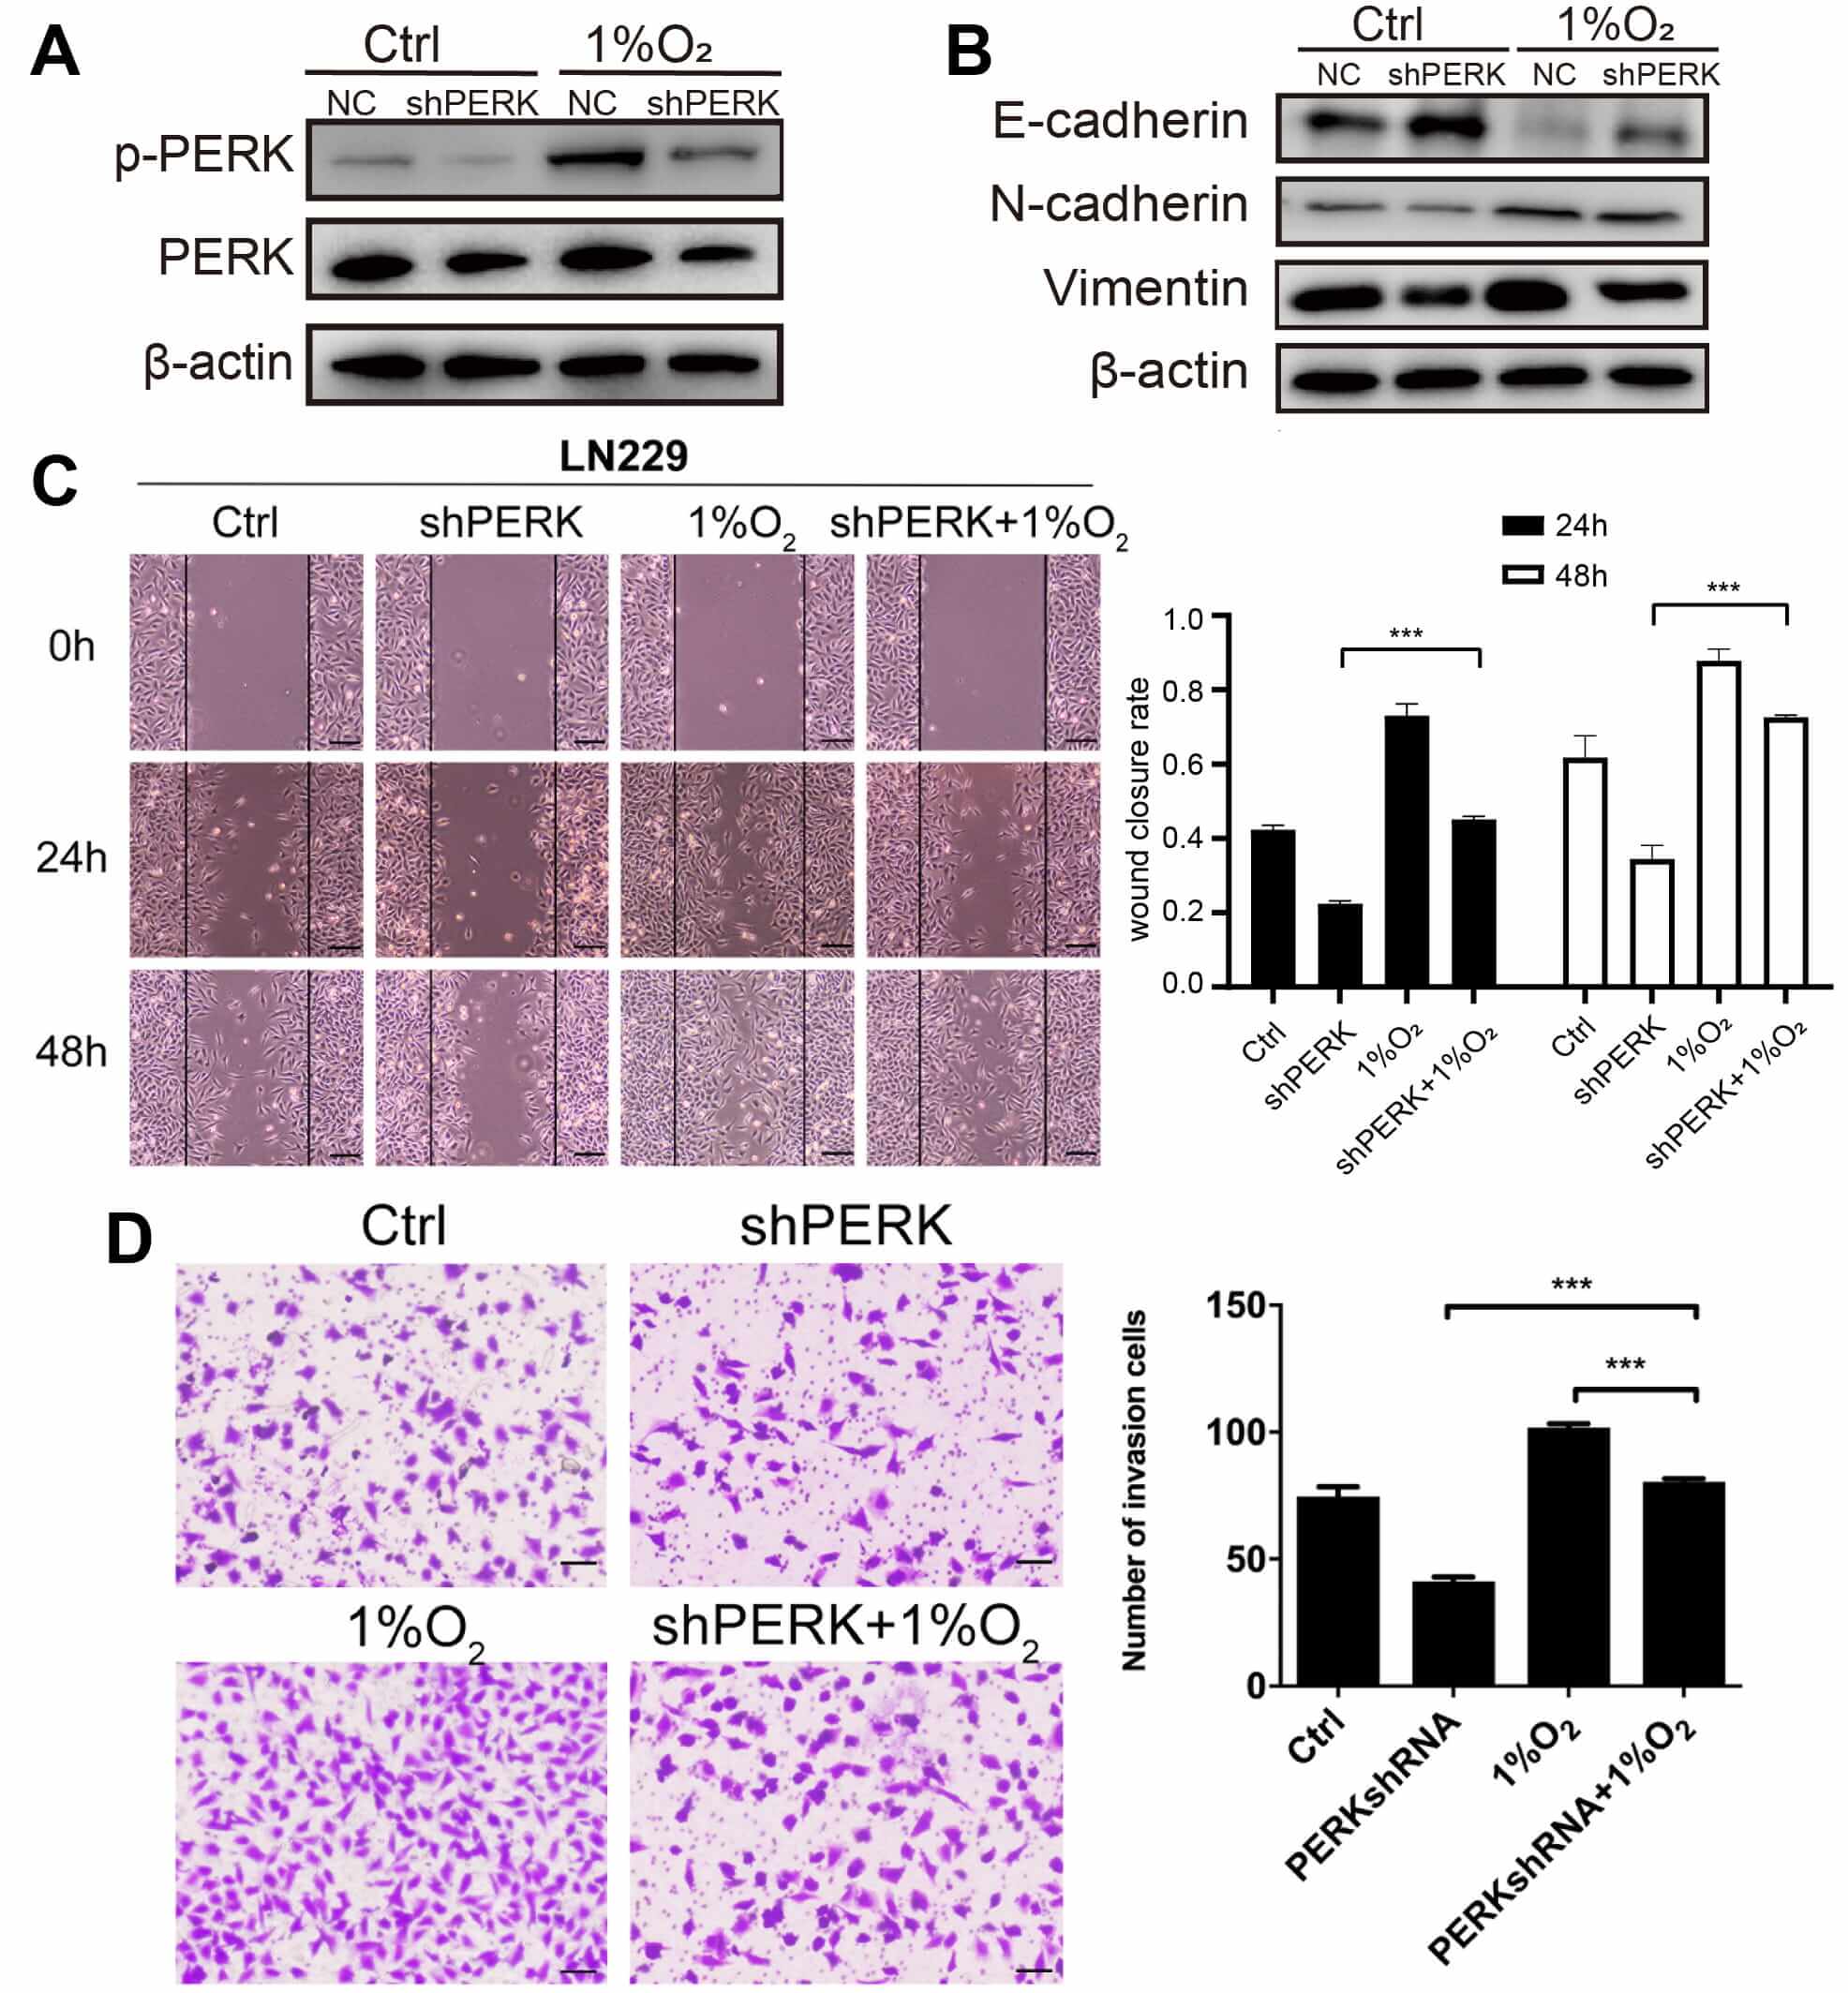 Fig. 4.
PKR-like endoplasmic reticulum kinase (PERK) silencing lowers
the invasive and migratory ability of glioma cells under hypoxia. LN229 cells
were transfected with negative control (NC) or PERK shRNA, and 48 h later, (A)
the levels of PERK and phosphorylated (p)-PERK in glioma cells under hypoxia were
evaluated by western blotting, (B) the protein levels of epithelial-mesenchymal
transition (EMT) in glioma cells under hypoxia were evaluated by western
blotting, (C) the migration of glioma cells under hypoxia was quantified using a
wound closure rate. Scale bar: 200 µm, and (D) the number of invasive cells
was examined by a transwell matrix penetration assay. Scale bar: 80 µm. ***
p
The above findings indicate that PERK silencing reduced the invasion and migration ability of glioma cells, likely through modulation of EMT and ER stress-related pathways. However, our in vitro data need to be further validated in vivo. As glioma cells grow in a hypoxic microenvironment, we hypothesized that PERK silencing may also inhibit glioma invasion and migration in vivo, further influencing glioma growth. Consistently, the weights and volumes of the lenti-PERK shRNA tumours were significantly lower than those of control animals (Fig. 5A). Analysis of the expression of related tumor proteins revealed reduced p-PERK protein levels in the PERK-silenced gliomas than those in the control glioma cells (Fig. 5B). Furthermore, immunohistochemical analysis demonstrated decreased levels of vimentin and N-cadherin proteins, along with elevated levels of E-cadherin protein in PERK-silenced gliomas (Fig. 5C). These results suggest that PERK plays an important role in glioma invasion and migration and is associated with EMT and ER stress processes.
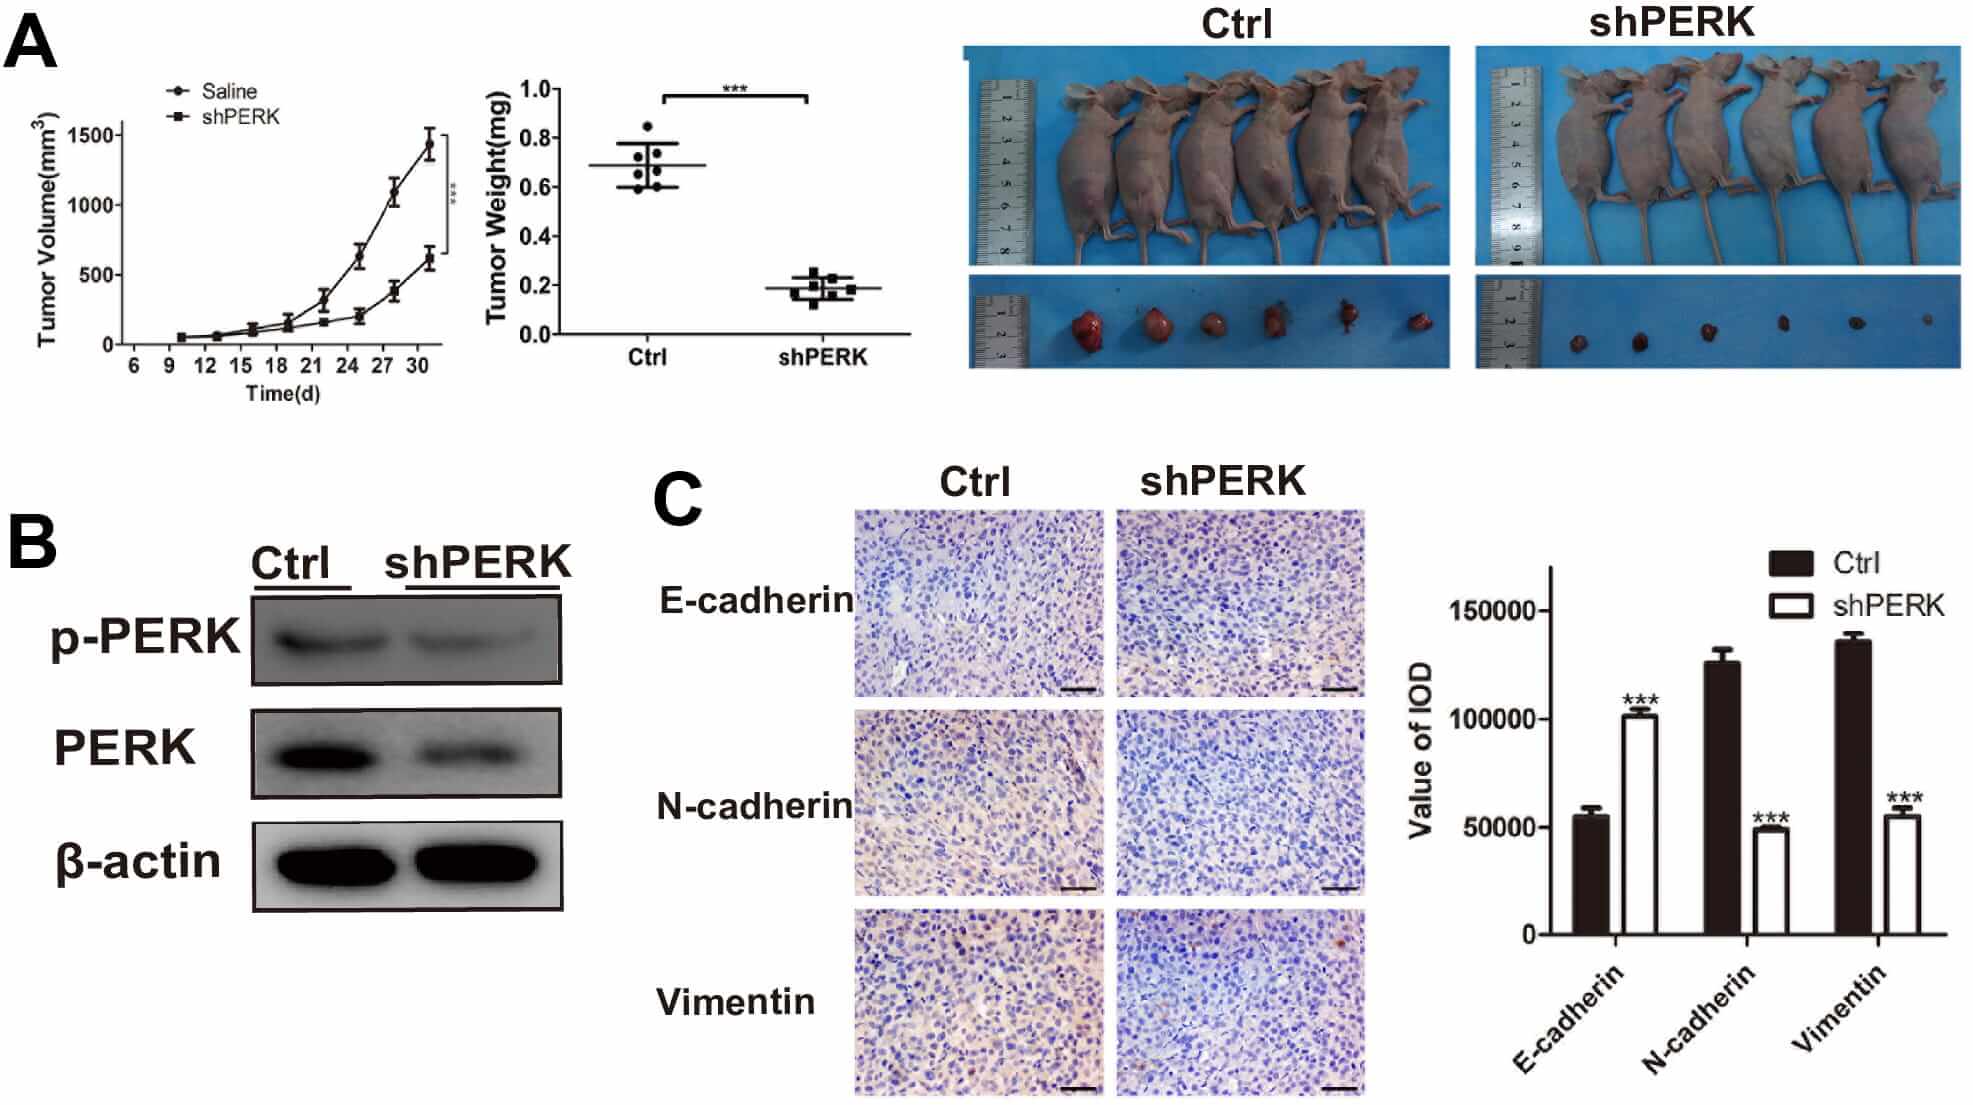 Fig. 5.
PKR-like endoplasmic reticulum kinase (PERK) silencing
suppresses glioma growth and the epithelial-mesenchymal transition (EMT) process
in vivo xenografts. (A) Lenti-PERK shRNA and lenti-NC LN229 cells were
subcutaneously injected into BALB/c nude female mice. Tumour volume and tumour
weights were measured using the in vivo proliferation assay. (B) Western
blotting was performed for phosphorylated (p)-PERK and PERK in vivo. (C)
Representative photomicrographs of immunohistochemical analyses for E-cadherin,
N-cadherin, and vimentin in vivo. Scale bar: 50 µm. *** p
The potential role of PERK-high glioma cells in the tumor immune microenvironment was then explored through a CellChat analysis. Compared with the low PERK group, the high PERK group exhibited significantly enhanced signal outputs (Fig. 6A, Supplementary Fig. 2C,E), primarily concentrated in Macrophage migration inhibitory factor (MIF), SPP1, midkine (MK), and VEGF signaling pathways (Supplementary Fig. 2D). SPP1 signaling analysis revealed more active interactions between tumor cells with high PERK activity and macrophages than in the low PERK group (Fig. 6B, Supplementary Fig. 2F). Using publicly available spatial transcriptomics datasets, we analyzed two cases of low-grade and two of high-grade glioma samples. Hypoxic regions in the glioma were identified using the AddModuleScore, followed by differential gene expression and enrichment analyses (Supplementary Fig. 2G). These hypoxic regions were enriched for focal adhesion, endoplasmic reticulum lumen, and undold protein binding pathways, consistent with our bulk RNA-seq findings (Fig. 6C). Using SPOTlight, we deconvoluted single-cell data into spatial transcriptomics data and found that tumor cells with high PERK activation were more abundant in high-grade gliomas, whereas low PERK macrophages were more abundant in low-grade gliomas, even in the same GBM tissue, the tumor cells with high PERK expression were closer to the tumor core area, while the tumor cells with low PERK expression were located at the tumor border (Fig. 6D, Supplementary Fig. 2H). Spatial feature mapping of the EMT pathway using AddModuleScore and subsequent correlation analysis revealed that regions with denser distribution of high PERK activation glioma cells exhibited elevated EMT (Fig. 6E,F, cor = 0.6). Finally, we examined the spatial correlation between PERK-HIGH gliomas and TAMs and found a strong correlation between them (Fig. 6G, Supplementary Fig. 2I). Furthermore, regions enriched in PERK-high glioma cells also exhibited high expression of SPP1 and CD44, suggesting spatial consistency of this signaling axis (Fig. 6H).
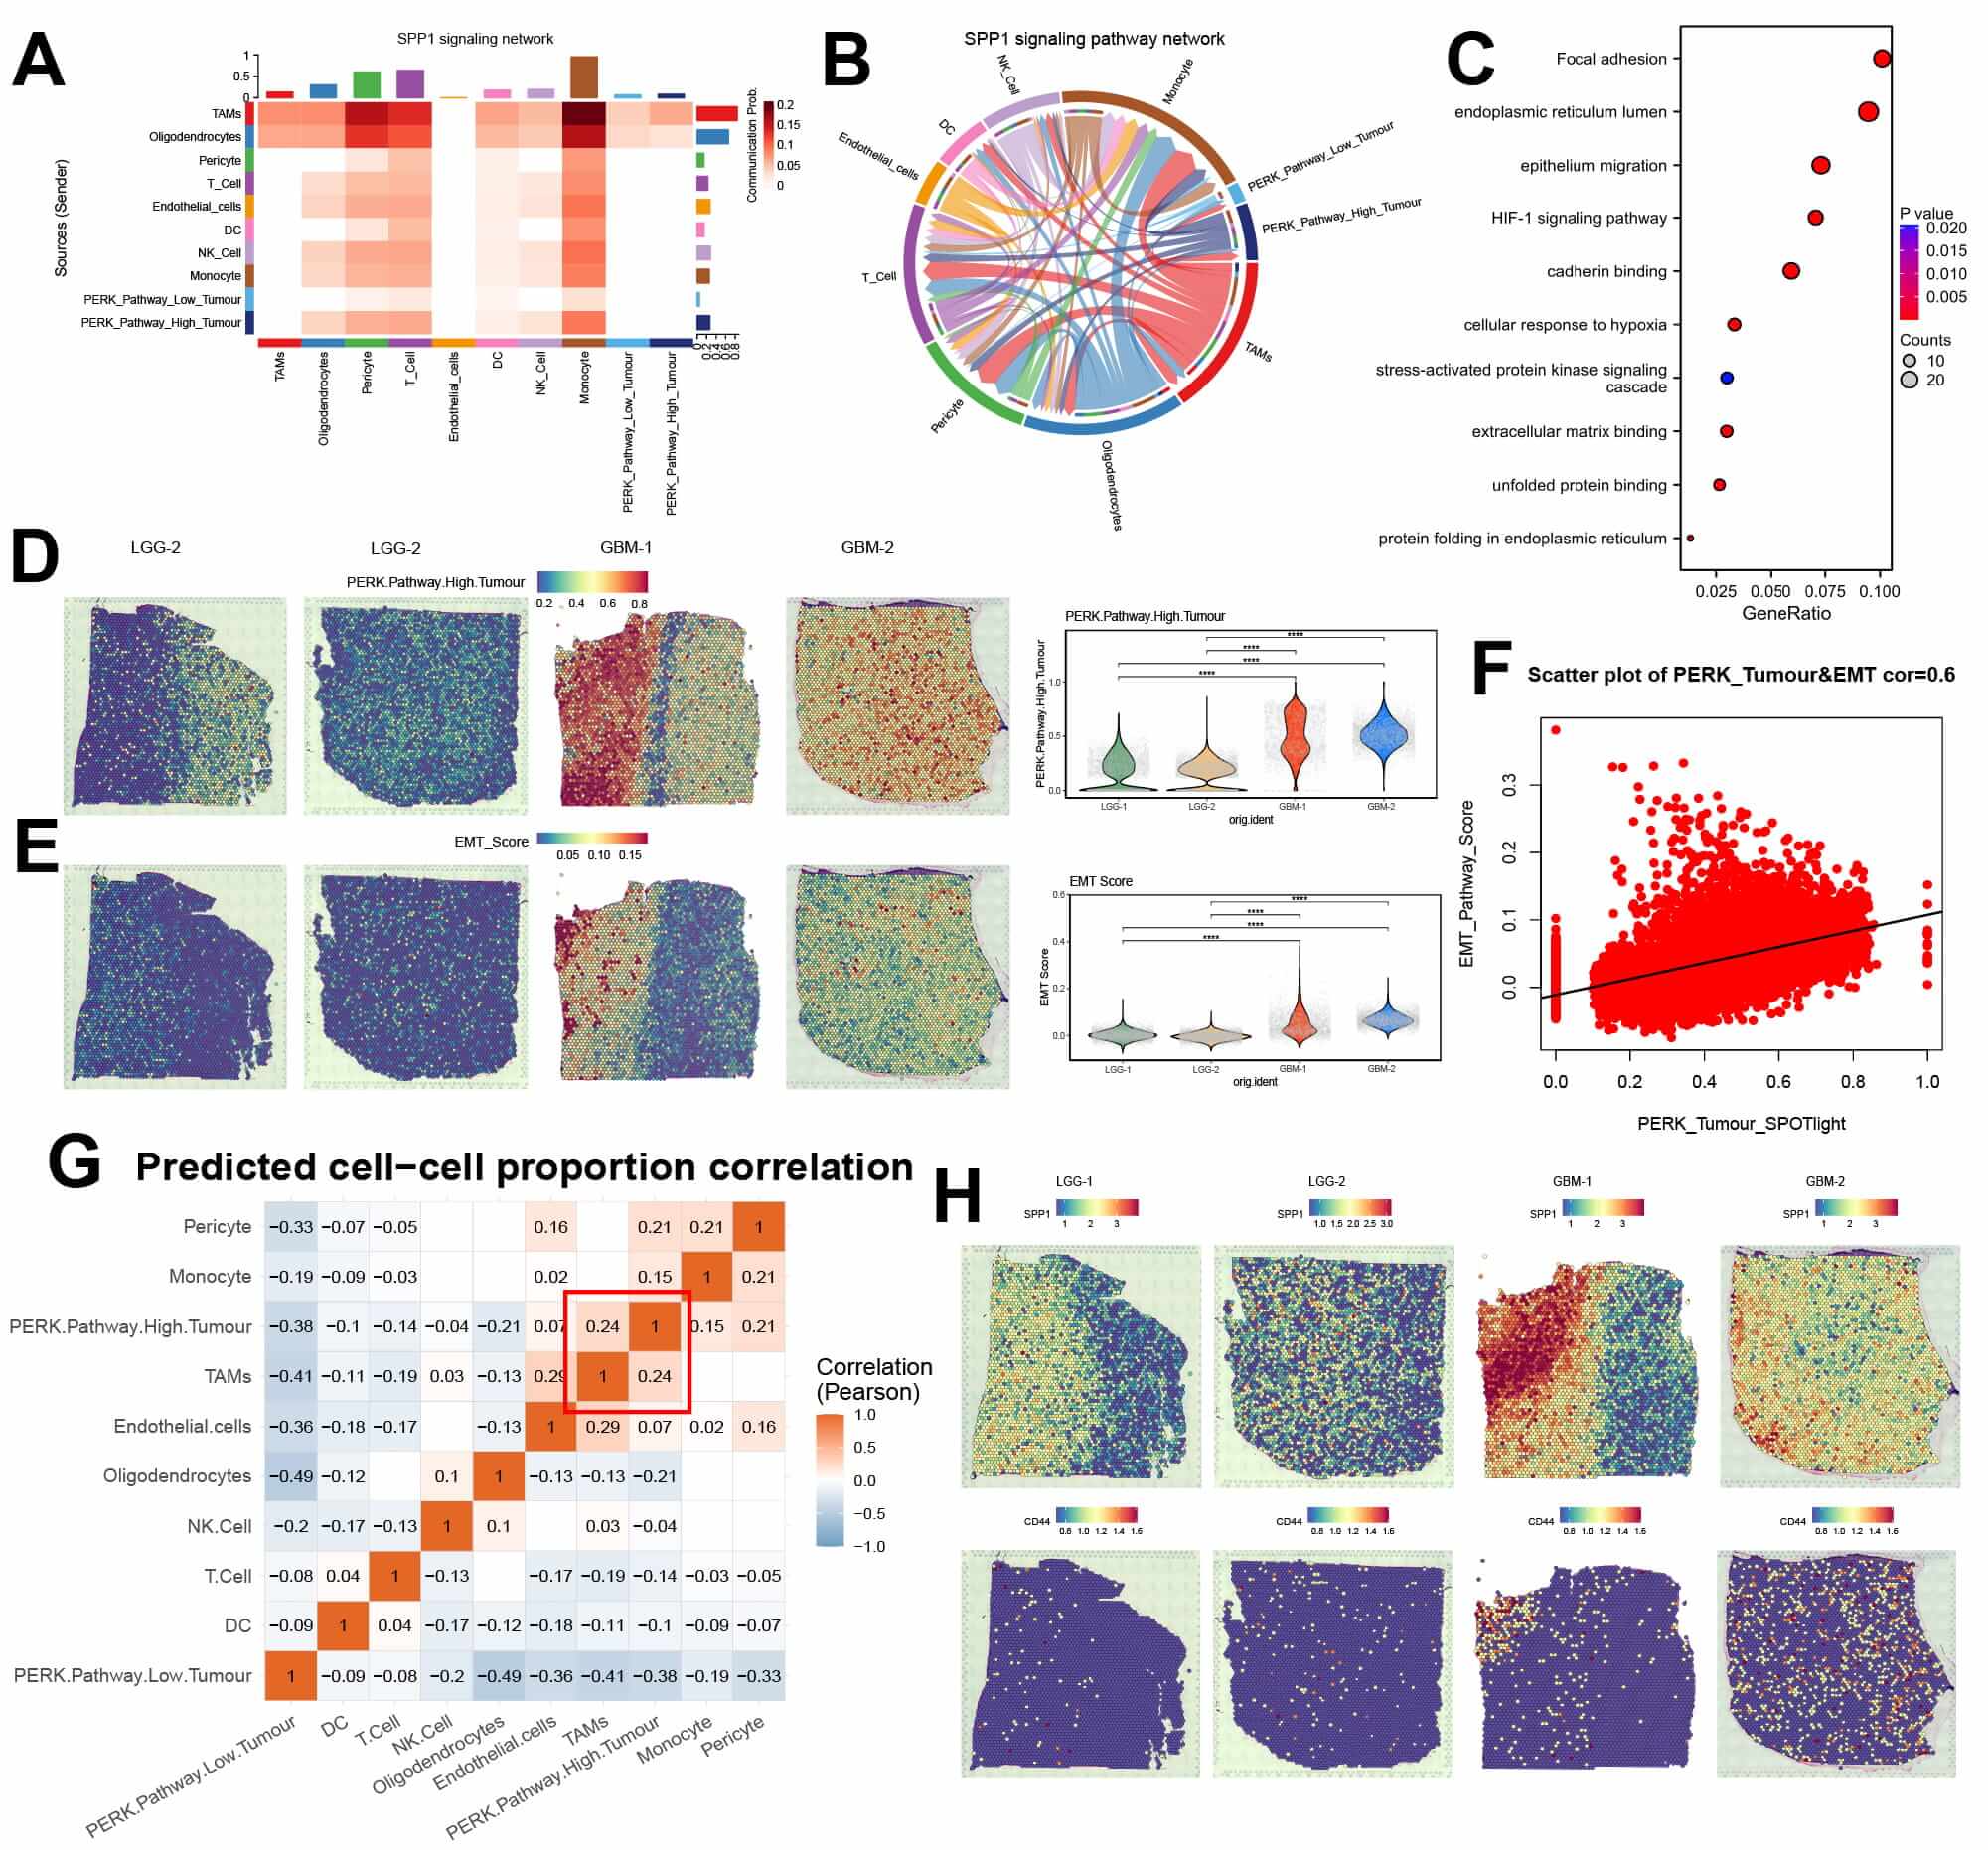 Fig. 6.
Spatial transcriptomics and cell communication analyses
suggest that tumor cells with high PKR-like endoplasmic reticulum kinase (PERK)
activation may induce epithelial-mesenchymal transition (EMT) by enhancing
secreted phosphoprotein 1 (SPP1)-CD44 signaling. (A) Heatmap of cell
communication signaling via SPP1 in gliomas. (B) A Chordal diagram of SPP1 signal
communication between glioma cells. (C) Enrichment analysis of hypoxic niche and
other regional differential genes in the spatial transcriptome. (D) A feature map
of high PERK activation glioma cells after SPOTLight deconvolution analysis. (E)
Spatial feature map of EMT in glioma tissues. (F) Scatter plot showing the
spatial correlation between high PERK activation glioma cells and the EMT
pathway. (G) A heatmap of spatial cell communication correlations in glioma
tissues. (H) Spatial distribution feature map of SPP1 and CD44 in glioma tissues.
**** p
Glioma, the most common cancer of the central nervous system, characterizes high metabolic activity, resulting in a prevalent hypoxic stress environment within tumor tissues [3]. This hypoxic condition overwhelms or disrupts protein folding functions in the endoplasmic reticulum, leading to ERS [36]. EMT, regulating cell adhesion, migration, and invasion, is frequently observed in cancer, and is often associated with the hypoxic tumor microenvironment [4, 37]. In our study, analysis of the CGGA database revealed significant activation of hypoxia, PERK, and EMT pathways in high-grade gliomas. Single-cell sequencing revealed pronounced PERK pathway activation in MES-like glioma cells, concurrent with EMT pathway activation during the transition to the MES subtype. PERK silencing inhibited EMT, leading to a significant reduction in glioma cell invasion and migration. In vivo models further confirmed that PERK silencing had an inhibitory effect on glioma growth, an effect partially mediated by decreased EMT activity. In addition, glioma cells with high PERK activation showed stronger cellular crosstalk with TAMs. Spatial transcriptomics confirmed the spatial co-localization of aforementioned molecules, signaling pathways, and cell subtypes. These findings collectively suggest that ERS can affect glioma cell invasion and migration by regulating the EMT process, thus affecting the malignancy of glioma cells.
As the grade of glioma increases, the tumor core becomes highly hypoxic and necrotic, reshaping the immune cell microenvironment, including macrophages [38]. Hypoxia places glioma cells under stress, reducing the capacity of the ER, leading to the accumulation of unfolded or misfolded proteins [11]. Consistent with previous research, we initially analyzed bulk glioma data from the CGGA database and observed a significantly higher activation of hypoxia pathways in high-grade gliomas than in low-grade ones. Additionally, the PERK pathway was significantly activated at the transcriptional level in high-grade gliomas, suggesting that the hypoxic environment within glioma tissues can activate the PERK pathway, which may enhance glioma cell survival under low-oxygen conditions.
Glioblastomas are challenging to cure and often recur within 8 months post-surgery, and EMT, a hallmark of invasiveness, is significantly activated at both the transcriptional and protein levels in glioblastomas [1, 2]. Using the REACTOME database and applying GSVA scoring, we categorized glioma cells into high- and low-PERK activation groups, and conducted differential gene expression and enrichment analyses. Glioma tissues in the high PERK-activation group exhibited significant enrichment of hypoxia and EMT pathways, underscoring their interrelation.
Single-cell sequencing, a powerful tool for exploring tumor heterogeneity, revealed that the MES subtype exhibits the highest PERK activation levels. The MES subtype is characterized by high metabolic activity, hypoxia, and aggressive invasiveness [39, 40]. A study has suggested that this subtype predominates in the core regions of gliomas, where it promotes macrophage polarization and enhances glioma invasiveness [38]. Our study is the first to identify the highest PERK activation levels in the MES subtype of glioma cells, suggesting that PERK silencing may be a potential target to reduce glioma invasion and treat gliomas. Employing the AddModuleScore method, we subdivided glioma cell subtypes into those with high- and low-PERK activation. The subset with high PERK activation exhibited pronounced hypoxia, elevated EMT, and increased angiogenesis, consistent with our bulk RNA-seq findings. Next, pseudo-time analysis indicated that both the MES subtype and the high PERK activation subset of cells occur predominantly at the end stage of pseudo-time glioma development, aligning with prior research. Genes such as SPP1 and VEGFA, associated with EMT and hypoxia, were also upregulated towards the end of pseudo-time points, suggesting concurrent activation with PERK. The literature also demonstrates that PERK activation in gliomas can regulate angiogenesis through multiple signaling pathways, including VEGFA [41, 42]; this pathway has been shown to upregulate SPP1 in smooth muscle cells [43]. Our analysis highlights the role of PERK activation in shaping glioma subtypes and highlights potential therapeutic targets for mitigating glioma invasiveness.
PERK knockdown using lentiviral shRNA revealed a decrease in the expression of p-PERK, accompanied by a reduction in EMT-related protein levels. These molecular changes were functionally validated through in vitro invasion and migration assays, which showed impaired cell motility and invasiveness in PERK-silenced glioma cells. In vivo, subcutaneous tumor implantation experiments in nude mice further substantiated these findings. PERK knockdown resulted in significantly diminished tumor size and weight compared to control groups, highlighting the role of PERK in sustaining tumor growth and progression. Western blot analysis of tumor tissues confirmed sustained suppression of p-PERK. Additionally, immunohistochemical analysis revealed decreased vimentin and N-cadherin staining alongside increased E-cadherin in PERK-silenced tumors, suggesting that PERK inhibition not only attenuates tumor growth but also promotes less aggressive state.
Given the influence of PERK on the tumor microenvironment, further analysis of the glioma immune microenvironment using CellChatindicated markedly upregulated signals for MIF, SPP1, and VEGF in the high PERK activation group. MIF is currently recognized as an upstream regulator of PERK in the UPR signaling pathway [44], PERK itself can modulate angiogenesis in various malignant tumors through the VEGF signaling [41, 45]. SPP1-positive macrophages are now acknowledged to promote cancer progression and suppress immune responses in hepatocellular carcinoma, head and neck squamous cell carcinoma, and other cancers [23, 46, 47]. A high expression of SPP1 in gliomas has also been shown to be a poor prognostic indicator [48, 49]. Therefore, gliomas with high PERK activation may have enhanced invasion through various signaling pathways, promoting macrophage polarization toward an M2-type and contributing to a pro-tumorigenic immune microenvironment.
Finally, spatial transcriptomics analysis further corroborated with these findings. Deconvolution analysis revealed that cells with high PERK activation are predominantly localized in GBM regions. Spatial cell communication analysis further showed a close interconnection between glioma cells with high PERK activation and TAMs, corroborating our earlier hypotheses. Additionally, correlation analysis showed a strong correlation (cor = 0.6) between EMT and glioma cells with high PERK activation, consistent with our previous findings. The spatial distribution of SPP1 and CD44 closely overlapped with the distribution of glioma cells with high PERK activation, underscoring the reliability of our cell communication analyses.
Our research highlights the critical role of PERK in glioma invasion and migration, highlighting its association with EMT and ERS pathways. Additionally, this study also revealed significant variation in PERK activation among different glioma cell subtypes for precision therapy considerations. Our pioneering use of spatial transcriptomics to investigate the relationship between PERK and EMT significantly strengthens the credibility of our previous findings. Nonetheless, this study has limitations. First, we did not examine whether PERK silencing leads to of the suppression of the SPP1 signaling pathway. Second, further research is needed to elucidate the precise molecular mechanisms and clinical applications of PERK silencing. Future studies involving larger spatial transcriptomics cohorts or orthogonal validation using techniques like multiplexed immunofluorescence or flow cytometry will be essential to confirm the robustness and prevalence of the PERK/SPP1/CD44 spatial interaction network across a wider population of gliomas. Third, the 24-hour interval used in our wound healing assays, while optimized for measurable differences under hypoxia and PERK knockdown conditions, may limit the resolution of dynamic changes, future studies could benefit from more frequent time-point imaging. Moving forward, addressing these limitations will be essential for advancing our understanding of the role of PERK in glioma progression and its potential therapeutic implications.
In summary, our study demonstrates that under hypoxic conditions, PERK activation promotes EMT in glioma cells possibly through signaling pathways such as SPP1, facilitating glioma invasion and migration. These data provide evidence supporting PERK silencing as a potential target for glioma treatment, potentially through blocked EMT activation and reducing invasion and migration.
Our study demonstrates that hypoxia-induced PERK activation drives EMT in glioma, establishing a critical link between endoplasmic reticulum stress and tumor progression. Integrated multi-omics analyses, functional assays, and spatial transcriptomics consistently show that the PERK-EMT axis promotes invasion. Our findings identify PERK and its associated signaling network as promising therapeutic targets for countering glioma aggressiveness, providing a mechanistic basis for future translational interventions.
The data that support the findings of this study are available from the corresponding author upon reasonable request.
LG and JY designed the experiment, interpreted the data, and wrote the manuscript. JG and YK performed bioinformatic analysis, interpreted the results. XW and HT performed research and contributed reagents. YL and TZ contributed to literature search, draft and revising the manuscript and created figures for the manuscript. JG and YK contributed equally to this manuscript. All authors read and approved the final manuscript. All authors contributed to editorial changes in the manuscript. All authors have participated sufficiently in the work and agreed to be accountable for all aspects of the work.
Animal experiments were reviewed and approved by the Institutional Animal Care and Use Committee (IACUC) of Shanghai General Hospital (ID:2021SQ054). All experimental procedures involving animals were conducted adhering strictly with the Guide for the Care and Use of Laboratory Animals (NIH Publication No. 86-23, revised 1985, U.S. National Academy of Sciences), with predefined humane endpoints (tumor volume
Not applicable.
The present study was supported by the Songjiang District science and technology research project (Grant No.18sjkjgg19, No.18sjkjgg20, and No.18sjkjgg34).
The authors declare no conflict of interest.
Supplementary material associated with this article can be found, in the online version, at https://doi.org/10.31083/FBL46692.
References
Publisher’s Note: IMR Press stays neutral with regard to jurisdictional claims in published maps and institutional affiliations.