


1 Department of Gastroenterology, The First Affiliated Hospital of Harbin Medical University, 150006 Harbin, Heilongjiang, China
2 Key Laboratory of Hepatosplenic Surgery, Ministry of Education, The First Affiliated Hospital of Harbin Medical University, 150006 Harbin, Heilongjiang, China
3 Fifth Department of Medicine (Nephrology/Endocrinology/Rheumatology, Pneumonology), University Medical Center Mannheim, University of Heidelberg, 69117 Mannheim, Baden-Wurttemberg, Germany
4 Endoscopy Center, Department of Gastroenterology, Shanghai East Hospital, School of Medicine, Tongji University, 200092 Shanghai, China
†These authors contributed equally.
Abstract
Ulcerative colitis (UC) is a chronic inflammatory disorder primarily affecting the rectum and colon. This study aimed to identify potential therapeutic targets that may inhibit UC progression and mitigate patient suffering.
UC-related datasets were retrieved from the Gene Expression Omnibus database. Differential expression analysis, weighted gene co-expression network analysis, immunoinfiltration analysis, and pyroptosis scoring were employed to identify key pyroptosis-related genes implicated in UC pathogenesis. A dextran sulfate sodium salt (DSS)-induced mouse model of UC was established, and neutrophil extracellular traps (NETs) were induced in neutrophils by stimulation with phorbol 12-myristate 13-acetate (PMA). Histopathological changes in mouse colon tissues were assessed by hematoxylin-eosin staining, and NET formation was evaluated via immunofluorescence. The expression of aquaporin 9 (AQP9), peptidylarginine deiminase 4 (PAD4), zonula occludens 1 (ZO-1), occludin, and proteins related to pyroptosis and the JAK2-STAT3 pathway was determined by Western blotting. Levels of inflammatory cytokines were measured by enzyme-linked immunosorbent assay (ELISA), production of reactive oxygen species was assessed using fluorescent probes, and intestinal epithelial cell viability and death were evaluated using the cell counting kit-8 (CCK-8) and terminal deoxynucleotidyl transferase dUTP nick end labeling (TUNEL) assays, respectively.
Five hub genes (AQP9, S100A8, S100A9, S100A12, and VNN2) were identified through bioinformatics analysis, with AQP9 selected for further investigation. Single-cell analysis and immunofluorescence revealed that AQP9 was predominantly expressed in neutrophils and upregulated in the colon tissues of mice with UC and PMA-stimulated neutrophils. Knockdown of AQP9 in PMA-treated neutrophils led to suppression of the JAK2-STAT3 pathway, reduced pyroptosis, and decreased NET formation. Upon co-culture with intestinal epithelial cells, AQP9 knockdown resulted in enhanced epithelial cell viability, reduced apoptosis, and upregulation of ZO-1 and occludin. Conversely, treatment of neutrophils from the PMA+si-AQP9 with a JAK2-STAT3 pathway agonist increased pyroptosis, enhanced the formation of NETs, and induced epithelial cell injury. Similarly, treatment with a pyroptosis agonist enhanced both pyroptosis and the formation of NETs, further aggravating epithelial damage.
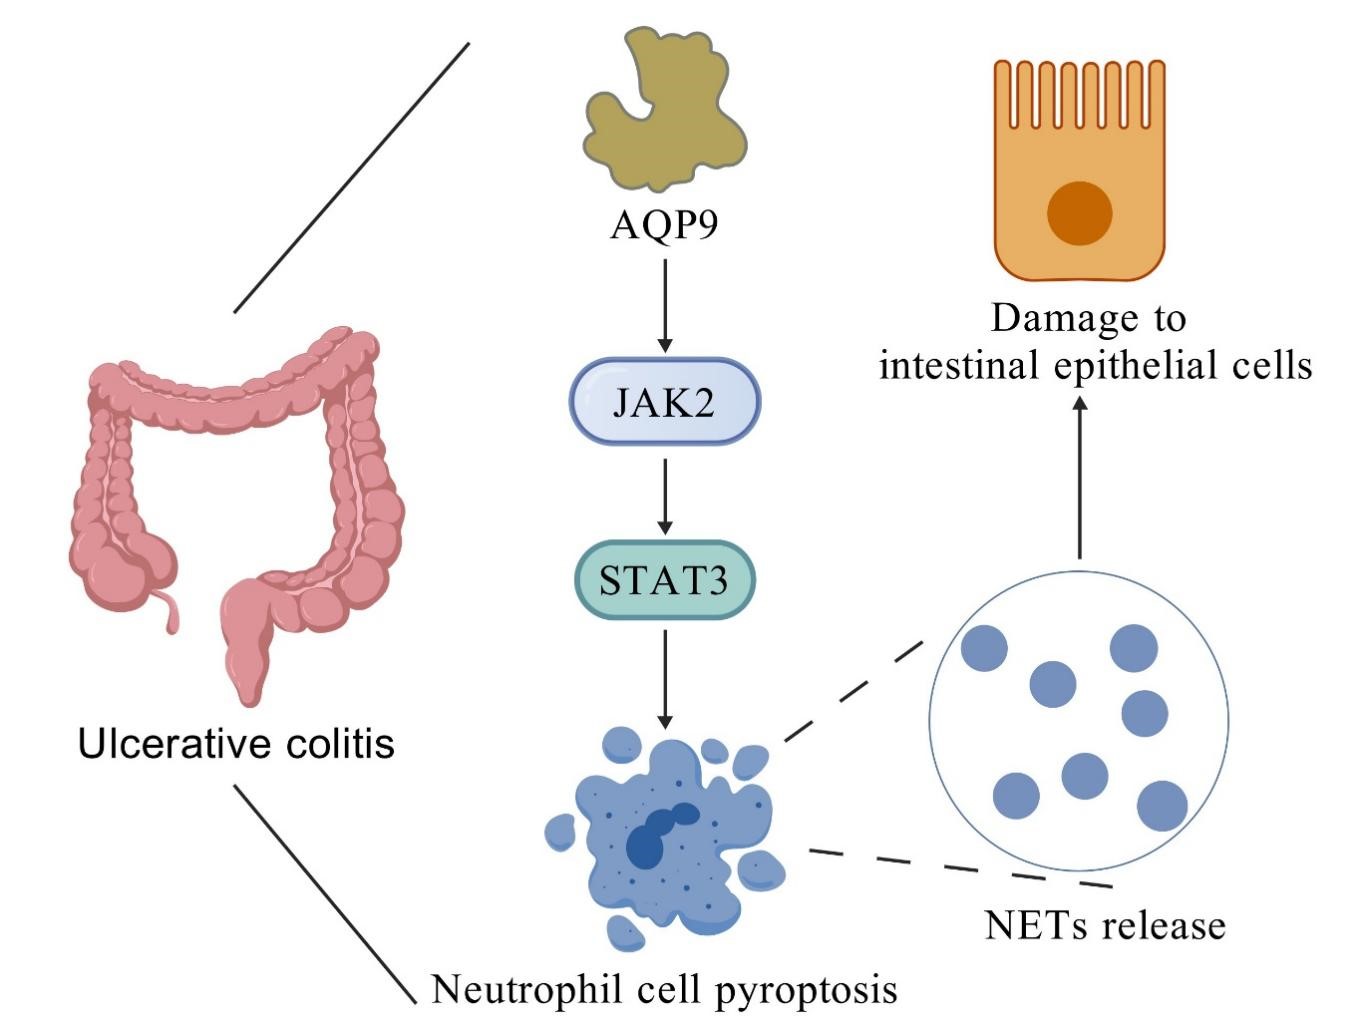
Knockdown of AQP9 inhibits JAK2-STAT3 pathway-mediated pyroptosis, thereby reducing the formation of NETs and attenuating intestinal epithelial cell injury.
Graphical Abstract
Keywords
- colitis
- pyroptosis
- neutrophil
- extracellular traps
Ulcerative colitis (UC) is a recurrent and remitting inflammatory bowel disease (IBD) [1]. It is frequently characterized by intestinal mucosal epithelial injury and disruption of intestinal homeostasis. Clinically, patients with UC present with symptoms including abdominal pain, hematochezia, fatigue, and fecal incontinence [2]. In recent years, the incidence of UC has been steadily increasing, which has contributed to a parallel rise in the prevalence of colorectal cancer. Currently, pharmacological therapy, often in combination with colectomy, constitutes the mainstay of UC management [3, 4]. However, the use of therapeutic agents is frequently associated with adverse effects. For instance, 5-aminosalicylic acid has been reported to induce high-grade fever and severe allergic reactions, and corticosteroids have been linked to reduced bone mineral density, an elevated risk of fractures and infections, as well as hepatotoxicity and nephrotoxicity [5]. Moreover, the complex pathophysiology of UC, compounded by inter-individual variability, often limits the efficacy of conventional pharmacotherapy. Consequently, growing attention has been directed toward the development of targeted therapies for UC. Such approaches are increasingly guided by cytokine profiles associated with disease stage and patient-specific expression patterns [6]. Identifying novel therapeutic targets is therefore an essential step toward improving the safety and effectiveness of UC treatment.
Neutrophils, as short-lived effector cells of the innate immune system, play a paradoxical and context-dependent role in acute inflammation [7]. In response to microbial invasion or inflammatory stimuli, neutrophils migrate to sites of mucosal injury. At these sites, they contribute to host defense by releasing reactive oxygen species (ROS) and forming neutrophil extracellular traps (NETs), which together facilitate the clearance of intestinal pathogens [7]. Nonetheless, excessive neutrophil activation can aggravate tissue injury, disrupt intestinal homeostasis, and elevate the risk of thrombosis [8, 9]. In recent years, NETs have attracted increasing attention for their involvement in various diseases, including arteriosclerosis, cancer, and immune-mediated diseases. In UC, Vincenzo Dinallo et al. [10] reported that mucosal injury generally occurs in regions infiltrated by neutrophils, and NETs are primarily localized within mucosal areas of active inflammation. Therefore, NETs maintain the inflammatory signal of UC.
Pyroptosis is a form of programmed cell death that not only affects the rupture of the plasma membrane of neutrophils but also plays an important role in the release of NETs [11]. Therefore, this study aimed to identify pyroptosis-related genes that may affect the progression of UC and regulate the formation of NETs via bioinformatics analysis.
Raw count data were retrieved from the GSE193677 and GSE214695 datasets available in the Gene Expression Omnibus database (http://www.ncbi.nlm.nih.gov/geo/). The GSE193677 dataset includes 872 UC and 461 Control samples, whereas the GSE214695 dataset consists of 6 UC and 6 Control samples. Ensembl IDs in both datasets were converted to gene symbols using the reference genome hg19. The count expression matrices were subsequently processed using the “edgeR” package (v 3.40.1) in R (v 4.2.2, R Foundation for Statistical Computing, Vienna, Austria) to compute average values and normalize expression levels for genes with multiple entries.
The “edgeR” package was employed for screening differentially expressed genes
(DEGs), with the screening criteria set as
Single-cell analysis was carried out using the “Seurat” package (v 4.3.0.1).
Cells were screened based on the criteria of 200
Pyroptosis-related genes were obtained through a systematic literature review [12]. Differential expression analysis of these genes was performed using the GSE193677 dataset. Heatmaps were plotted using the “pheatmap” package. Gene set variation analysis (GSVA) was carried out using the “GSVA” package to calculate pyroptosis scores for each sample group.
The “WGCNA” package (v 1.71) was applied for conducting WGCNA on the identified key genes, and the “clusterProfiler” package was employed for performing Kyoto Encyclopedia of Genes and Genomes (KEGG) and Gene Ontology (GO) enrichment analyses.
The STRING database (https://string-db.org/, v 11.5) was used for carrying out protein-protein interaction (PPI) analysis. The MCODE plug-in in Cytoscape (v 3.9.1) was employed to identify key genes within the PPI networks. Hub gene screening was performed using the following three machine learning approaches: LASSO regression using the “glmnet” package (v 4.1-4), random forest analysis using the “randomForest” package (v 4.7-1.1), and support vector machine-recursive feature elimination (SVM-RFE) using the “CARET” (v 6.0-92) and “e1071” (v 1.7-11) packages. Venn diagrams were generated with the “Venn” package. Single-sample gene set enrichment analysis (ssGSEA) of aquaporin 9 (AQP9) was performed using GSEA (v 4.3.2).
Immune cell infiltration analysis was performed on normalized expression data using the “CIBERSORT” package (v 1.04). Bar plots were generated to visualize the relative proportions of immune cells. Correlation analysis among immune cell types was conducted using the “corrplot” package (v 0.92), with scatter plots and boxplots created using the “ggplot2” and “ggpubr” (v 0.6) packages.
Male C57BL/6 mice (SPF, 6–8 weeks old) were obtained from Beijing Vital River Laboratory Animal Technology Co., Ltd., and housed in an 18–22 °C facility with ad libitum access to water and food. Following a one-week acclimatization period, twelve mice were randomly assigned to two groups: Control (n = 6) and UC (n = 6). Mice in the UC group were continuously administered with drinking water containing 2% (w/v) dextran sulfate sodium salt (DSS) (Sigma, Shanghai, China, 265152-M) for 7 days, while mice in the Control group were fed with normal drinking water. Predefined humane endpoints were established such that mice exhibiting signs of severe pain during the experiment would be euthanized prior to the study completion. However, none of the mice were euthanized, and all mice survived until the end of the experiment. After 7 days of treatment as described above, mice were euthanized for colon tissue collection to evaluate whether the model was successfully constructed. Euthanasia was performed using CO2 inhalation at a controlled replacement rate of 30%–70% of the container volume/minute to ensure rapid and humane loss of consciousness. This experiment was approved by the Ethics Committee of Laboratory Animal Management and Welfare of the First Affiliated Hospital of Harbin Medical University (Approval No.: IACUC-2023053), and was conducted following the ARRIVE guidelines.
Human neutrophils (Immocell, Xiamen, Fujian, China, IMP-H209) and human intestinal epithelial cells (YaJi Biological, Shanghai, China, YS3102C) were utilized in this study. Neutrophils were cultured in a specialized medium (Immocell, Xiamen, Fujian, China, IMP-H209-1), while intestinal epithelial cells were maintained in Opti-MEM medium supplemented with fetal bovine serum (ThermoFisher, Shanghai, China, A5256701), EGF, and GlutaMAX™ (ThermoFisher, Shanghai, China, 42360032). Cells were cultured under standard conditions (37 °C, 5% CO2). Formation of NETs was induced by stimulating neutrophils with 100 nM/L phorbol 12-myristate 13-acetate (PMA) for 4 h. Cells were transfected with either the constructed AQP9-targeting siRNA or si-NC. Pyroptosis was induced by treating the cells with 10 µM nigericin for 24 h. Activation of the JAK2-STAT3 pathway was achieved by exposing the cells to 20 µM Colivelin for 12 h. All cell lines were validated by STR profiling and tested negative for mycoplasma.
Tissue samples were fixed in 4% paraformaldehyde, embedded in paraffin, and sectioned into 4 µm slices. Sections were stained with HE (Beyotime, Shanghai, China, C0105S) and examined microscopically.
1
Total protein was extracted from colon tissues or cultured cells using a lysis
buffer containing 1% protease inhibitor, and then quantified using the BCA kit
(Beyotime, Shanghai, China, P0012S). Electrophoresis, membrane transfer, antibody
incubation, and color development were subsequently performed. The antibodies
used included cleaved N-terminal gasdermin D (GSDMD-N, Cell Signaling Technology,
Danvers, MA, USA, 36425), GSDMD (Cell Signaling Technology, Danvers, MA, USA,
39754), p-STAT3 (Cell Signaling Technology, Danvers, MA, USA, 9145), p-JAK2 (Cell
Signaling Technology, Danvers, MA, USA, 3776), JAK2 (Cell Signaling Technology,
Danvers, MA, USA, 3230), STAT3 (Cell Signaling Technology, Danvers, MA, USA,
12640), AQP9 (Invitrogen, Shanghai, China, PA5-114872), ZO-1 (Invitrogen,
Shanghai, China, 61-7300), and occludin (Cell Signaling Technology, Danvers, MA,
USA, 91131).
The expression levels of corresponding inflammatory factors were measured using
the following ELISA kits: mouse interleukin (IL)-1
Total RNA was extracted from colon tissues using the TRIzol reagent. RNA purity and integrity were assessed via agarose gel electrophoresis, and the A260/A280 ratio was measured by NanoDrop 2000 spectrophotometry. cDNA synthesis was performed using the PrimeScript RT kit (TaKaRa, Beijing, China, RR014A). qRT-PCR was conducted with PowerTrack™ SYBR Green Master Mix (Applied Biosystems, Shanghai, China, A46012) as per the manufacturer’s instructions. Primer sequences are listed in Table 1. The relative expression of mRNA was calculated using the 2-ΔΔCt method.
| Primer | Primer sequences |
| mmu-AQP9-F | 5′-CGGATGAAGGGACAAGGTAGCC-3′ |
| mmu-AQP9-R | 5′-ACAGAGAGCCACTAAGGAAGAAAGG-3′ |
| mmu-GAPDH-F | 5′-GATCATCAGCAATGCCTCCT-3′ |
| mmu-GAPDH-R | 5′-TGTGGTCATGAGTCCTTCCA-3′ |
AQP9, aquaporin 9; GAPDH, glyceraldehyde-3-phosphate dehydrogenase.
CCK-8 assay was carried out according to the manufacturer’s manual (Beyotime, Shanghai, China, C0037). A total of 2000 cells were added to each well of the 96-well plate and incubated for 24 h. Subsequently, 10 µL of the CCK-8 solution was added to each well, and incubation was performed at 37 °C for 2 h. Absorbance at 450 nm was measured using a microplate reader.
Cell death was detected using a TUNEL assay kit (Beyotime, Shanghai, China, C1086). Briefly, cells were fixed with 4% paraformaldehyde for 30 min, and incubated with PBS containing 0.3% Triton X-100, at room temperature for 5 min. Subsequently, cells were incubated with 50 µL of TUNEL reaction mixture at 37 °C for 60 min. After mounting with an anti-fade sealing solution, samples were analyzed via fluorescence microscopy.
Intracellular ROS levels were measured using a DCFH-DA probe (Beyotime,
Shanghai, China, S0033S). Briefly, 5
GraphPad Prism 9.0.0 (GraphPad Software, Boston, MA, USA) was
utilized for carrying out statistical analysis and data visualization. Data were
expressed as mean
Differential expression analysis was performed on the GSE193677 dataset using
the thresholds of
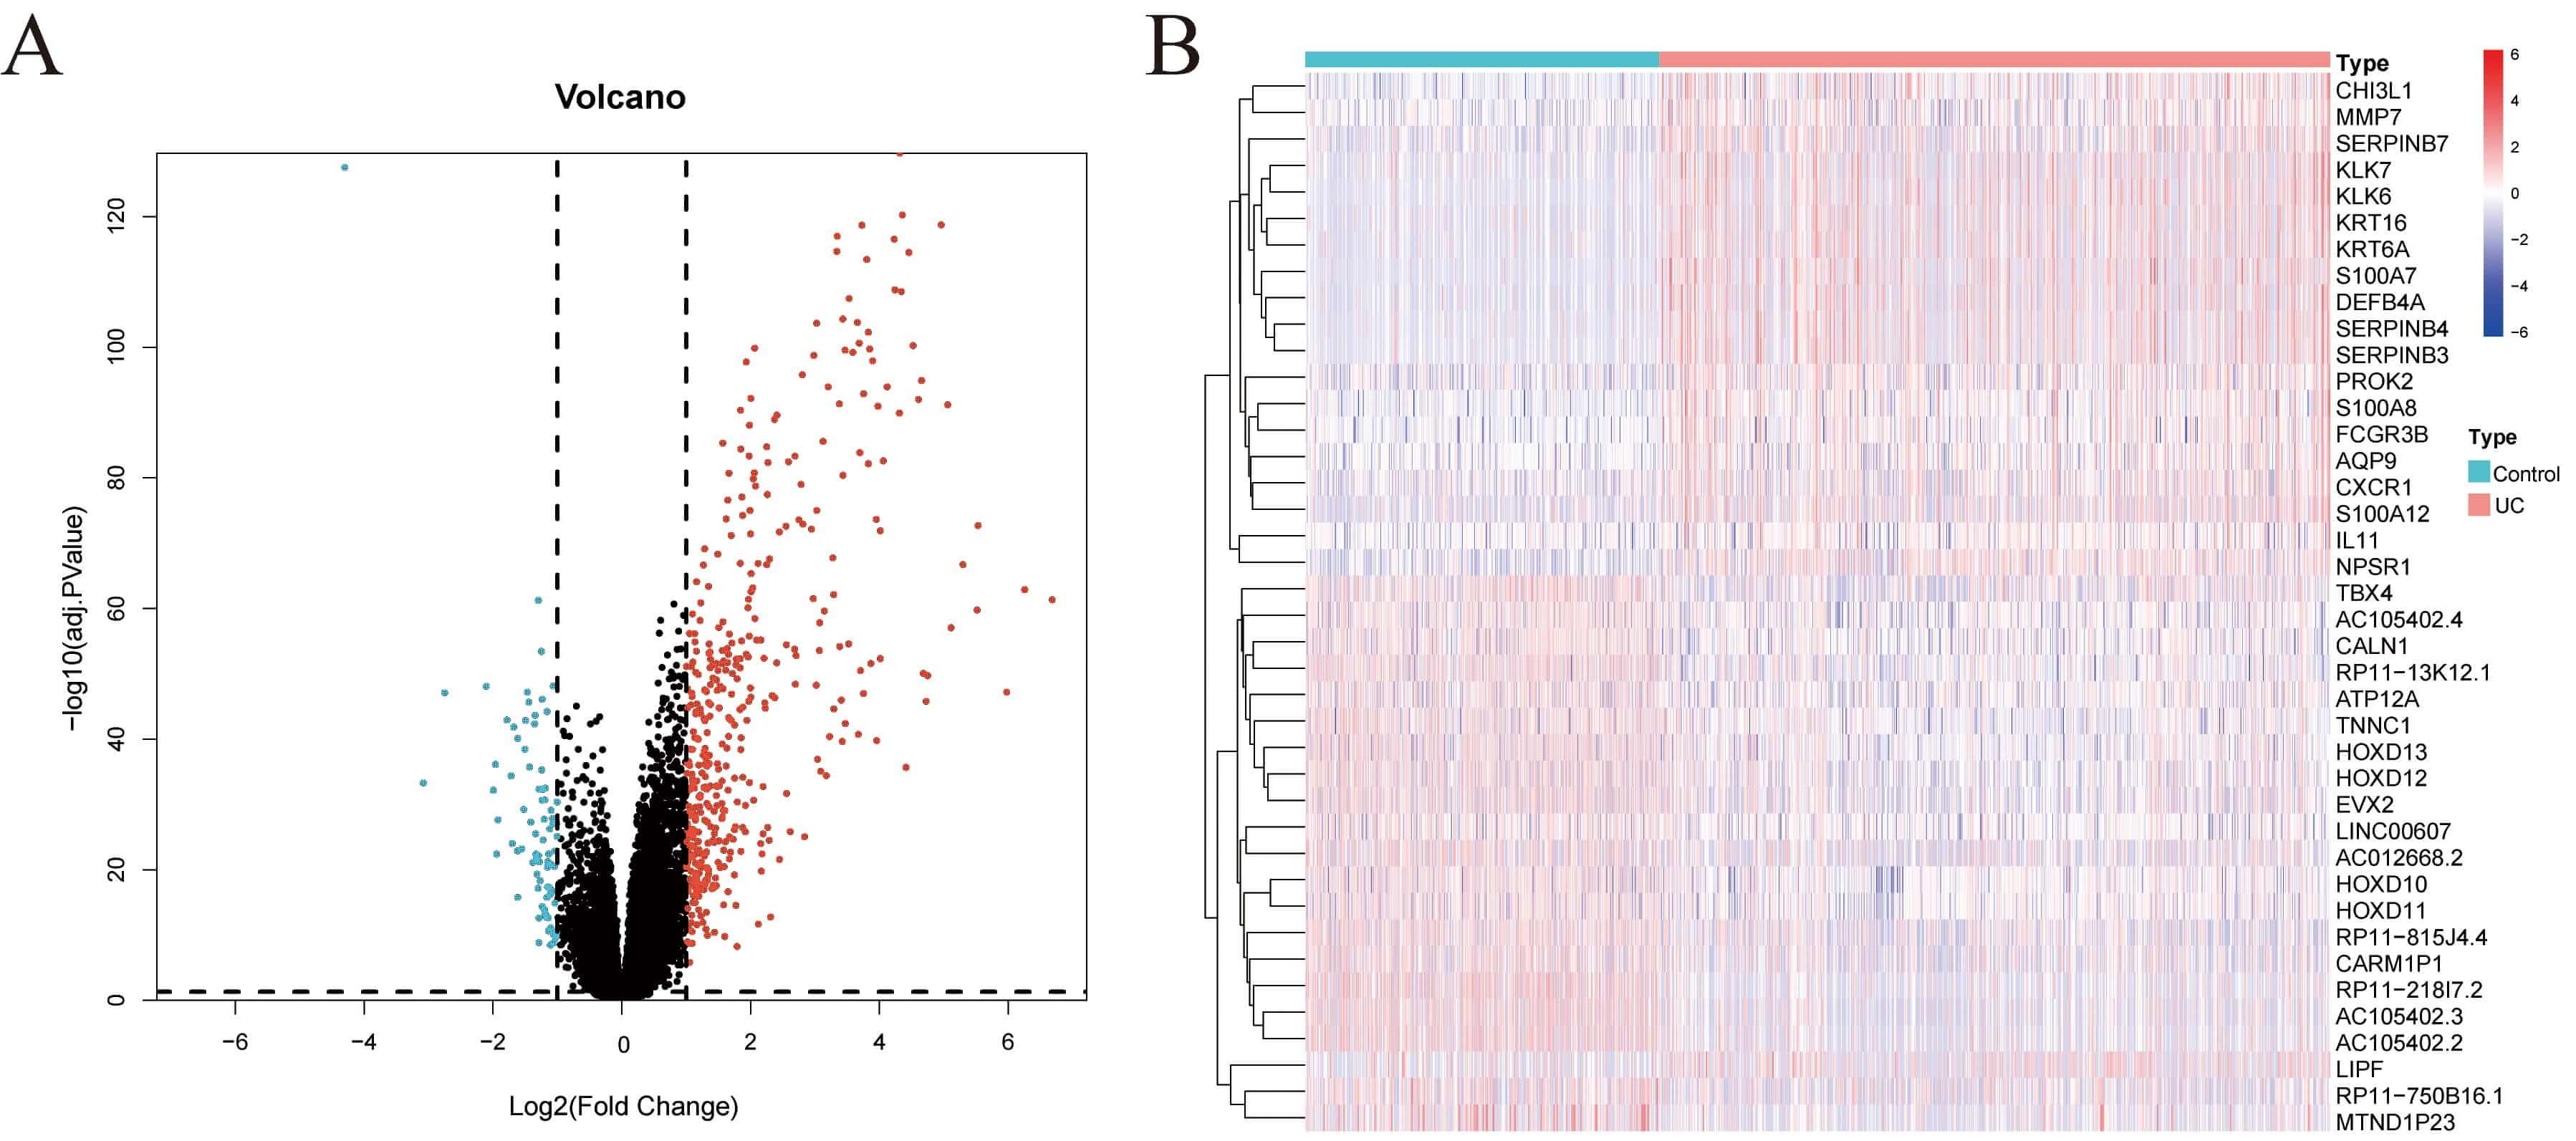 Fig. 1.
Screening of DEGs. (A) Volcano map showing the results of differential expression analysis from the GSE193677 dataset. (B) Heatmap showing the expression of DEGs across samples from different groups in the GSE193677 dataset. DEGs, differentially expressed genes.
 Fig. 2.
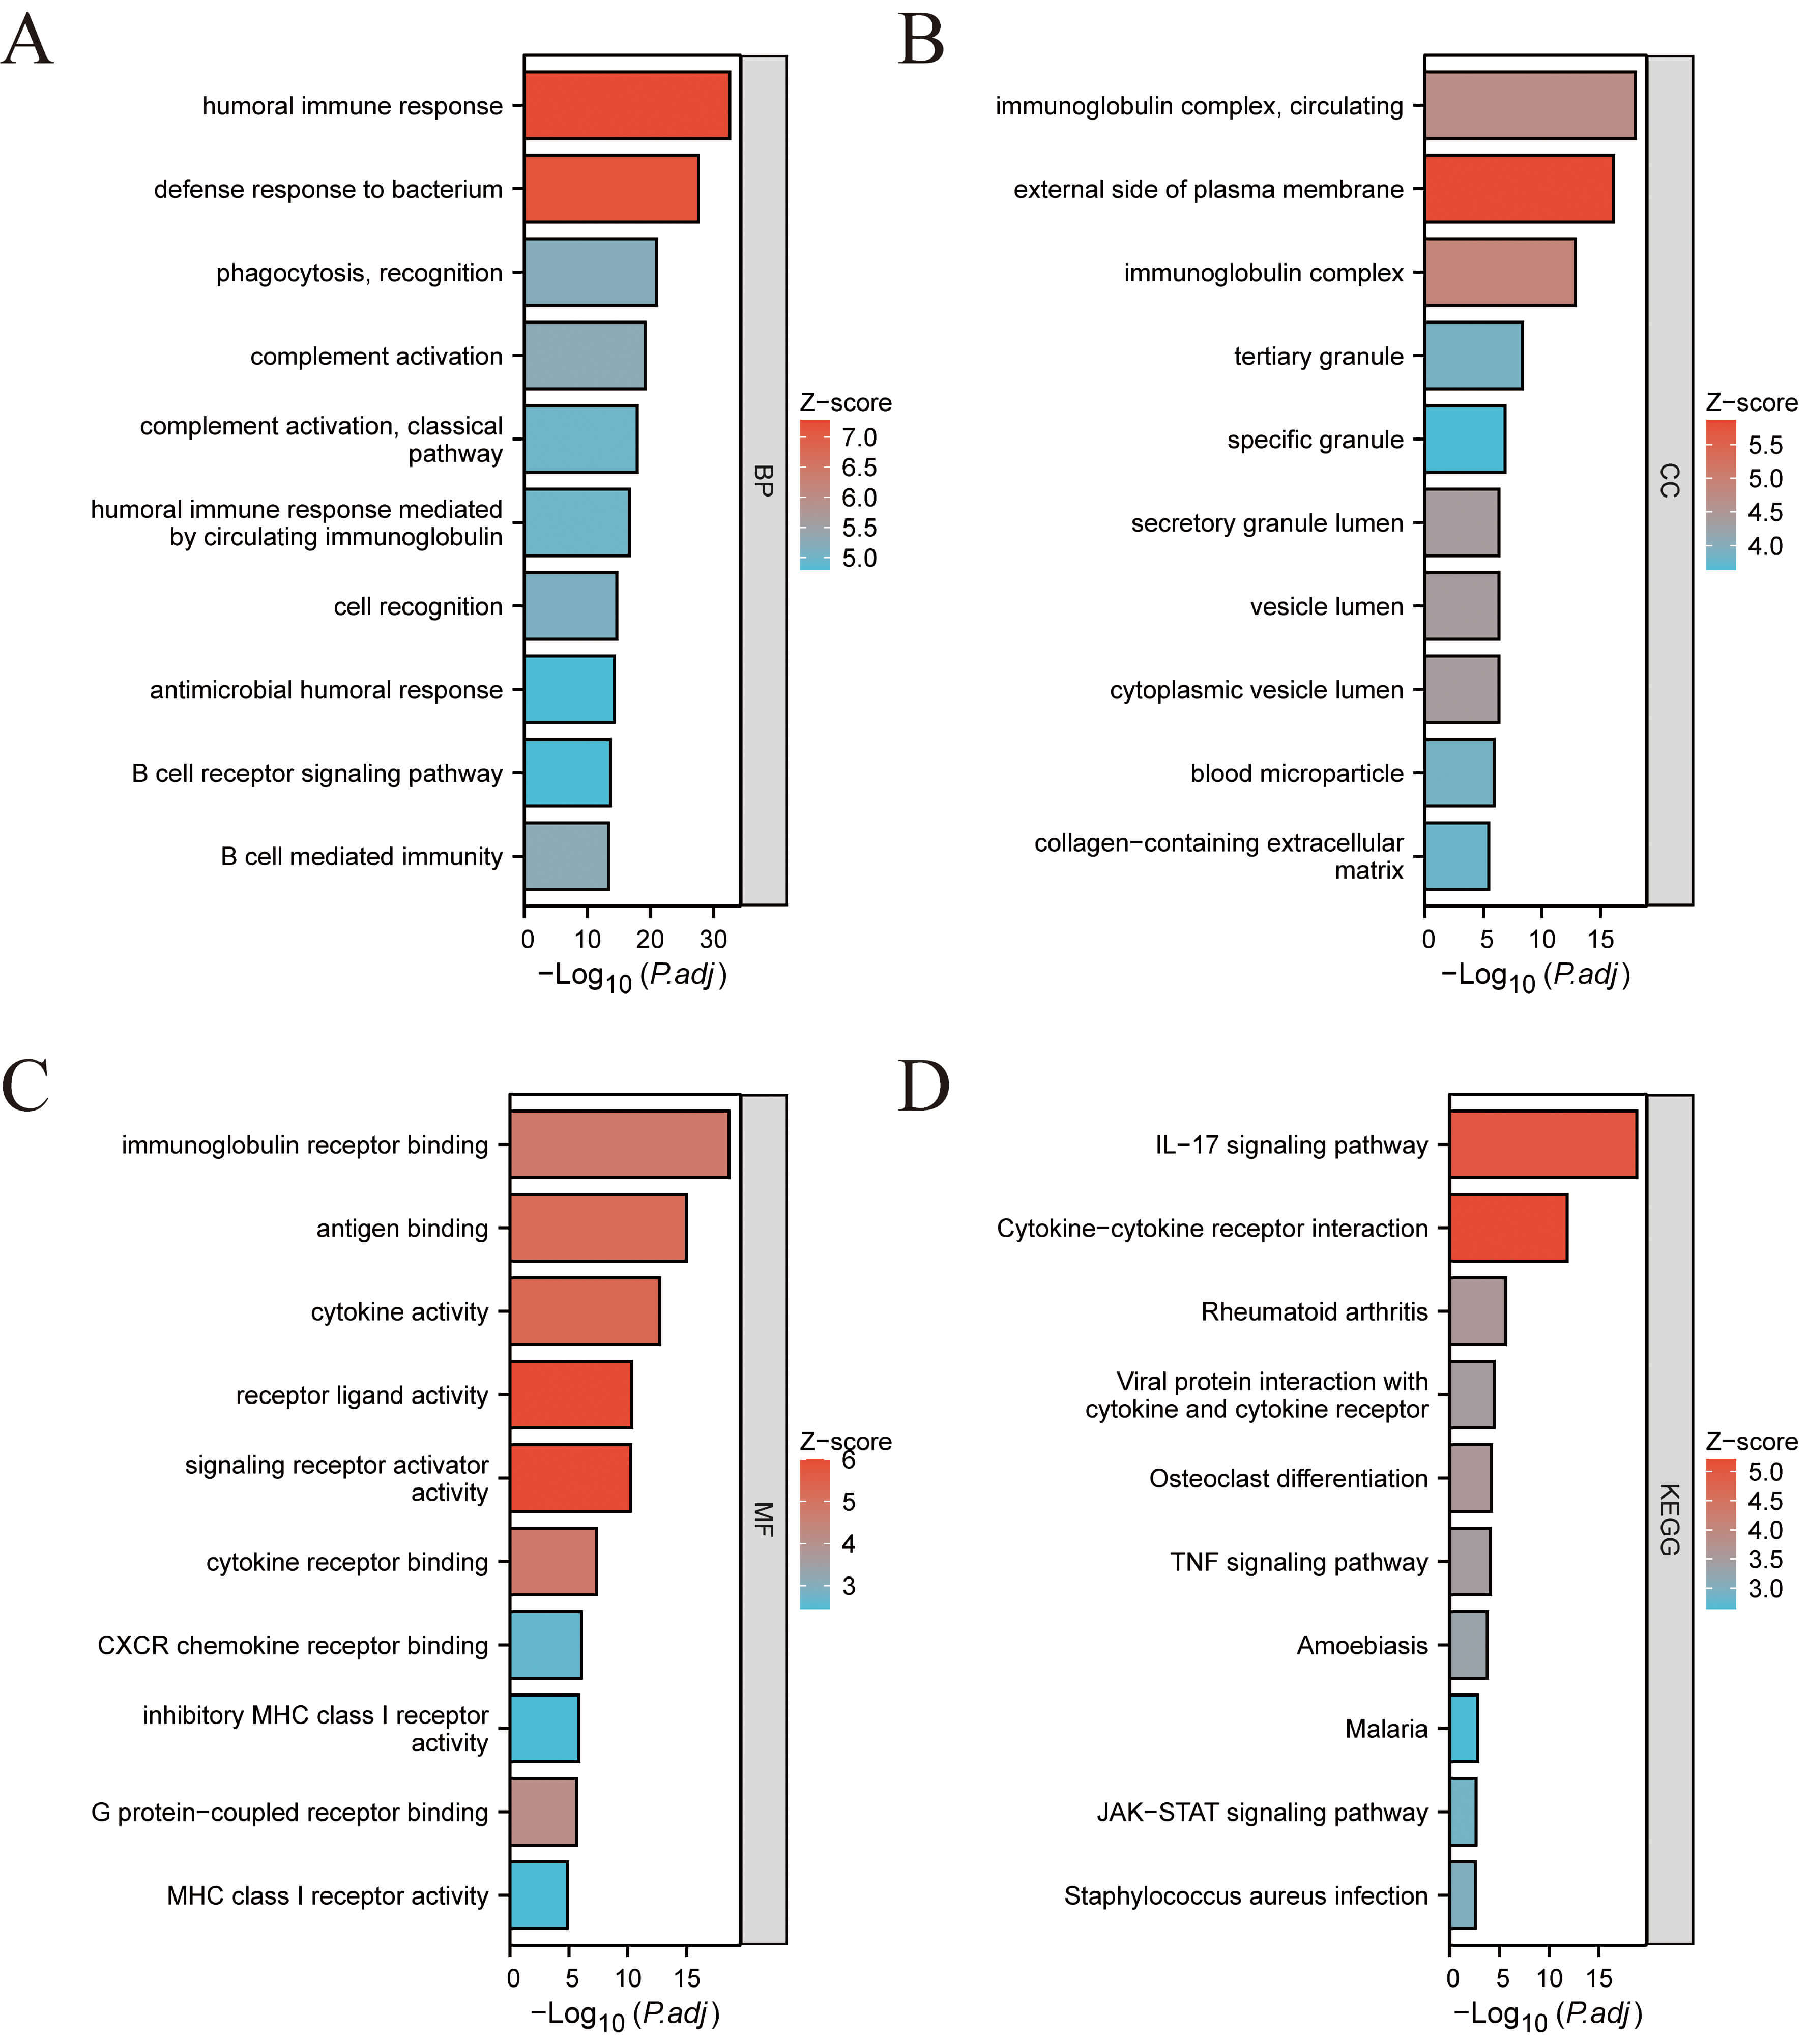
Functional enrichment analysis of the identified DEGs. (A) GO-BP. (B) GO-CC. (C) GO-MF. (D) KEGG pathway enrichment analysis results. GO, gene ontology; BP, biological process; CC, cell component; MF, molecular function; KEGG, kyoto encyclopedia of genes and genomes.
Differential expression analysis was conducted on pyroptosis-related genes within the GSE193677 dataset, with the results presented in Fig. 3A. Pyroptosis scores for each sample were calculated via GSVA. The results demonstrated that the UC group exhibited elevated pyroptosis scores compared with the Control group (Fig. 3B).
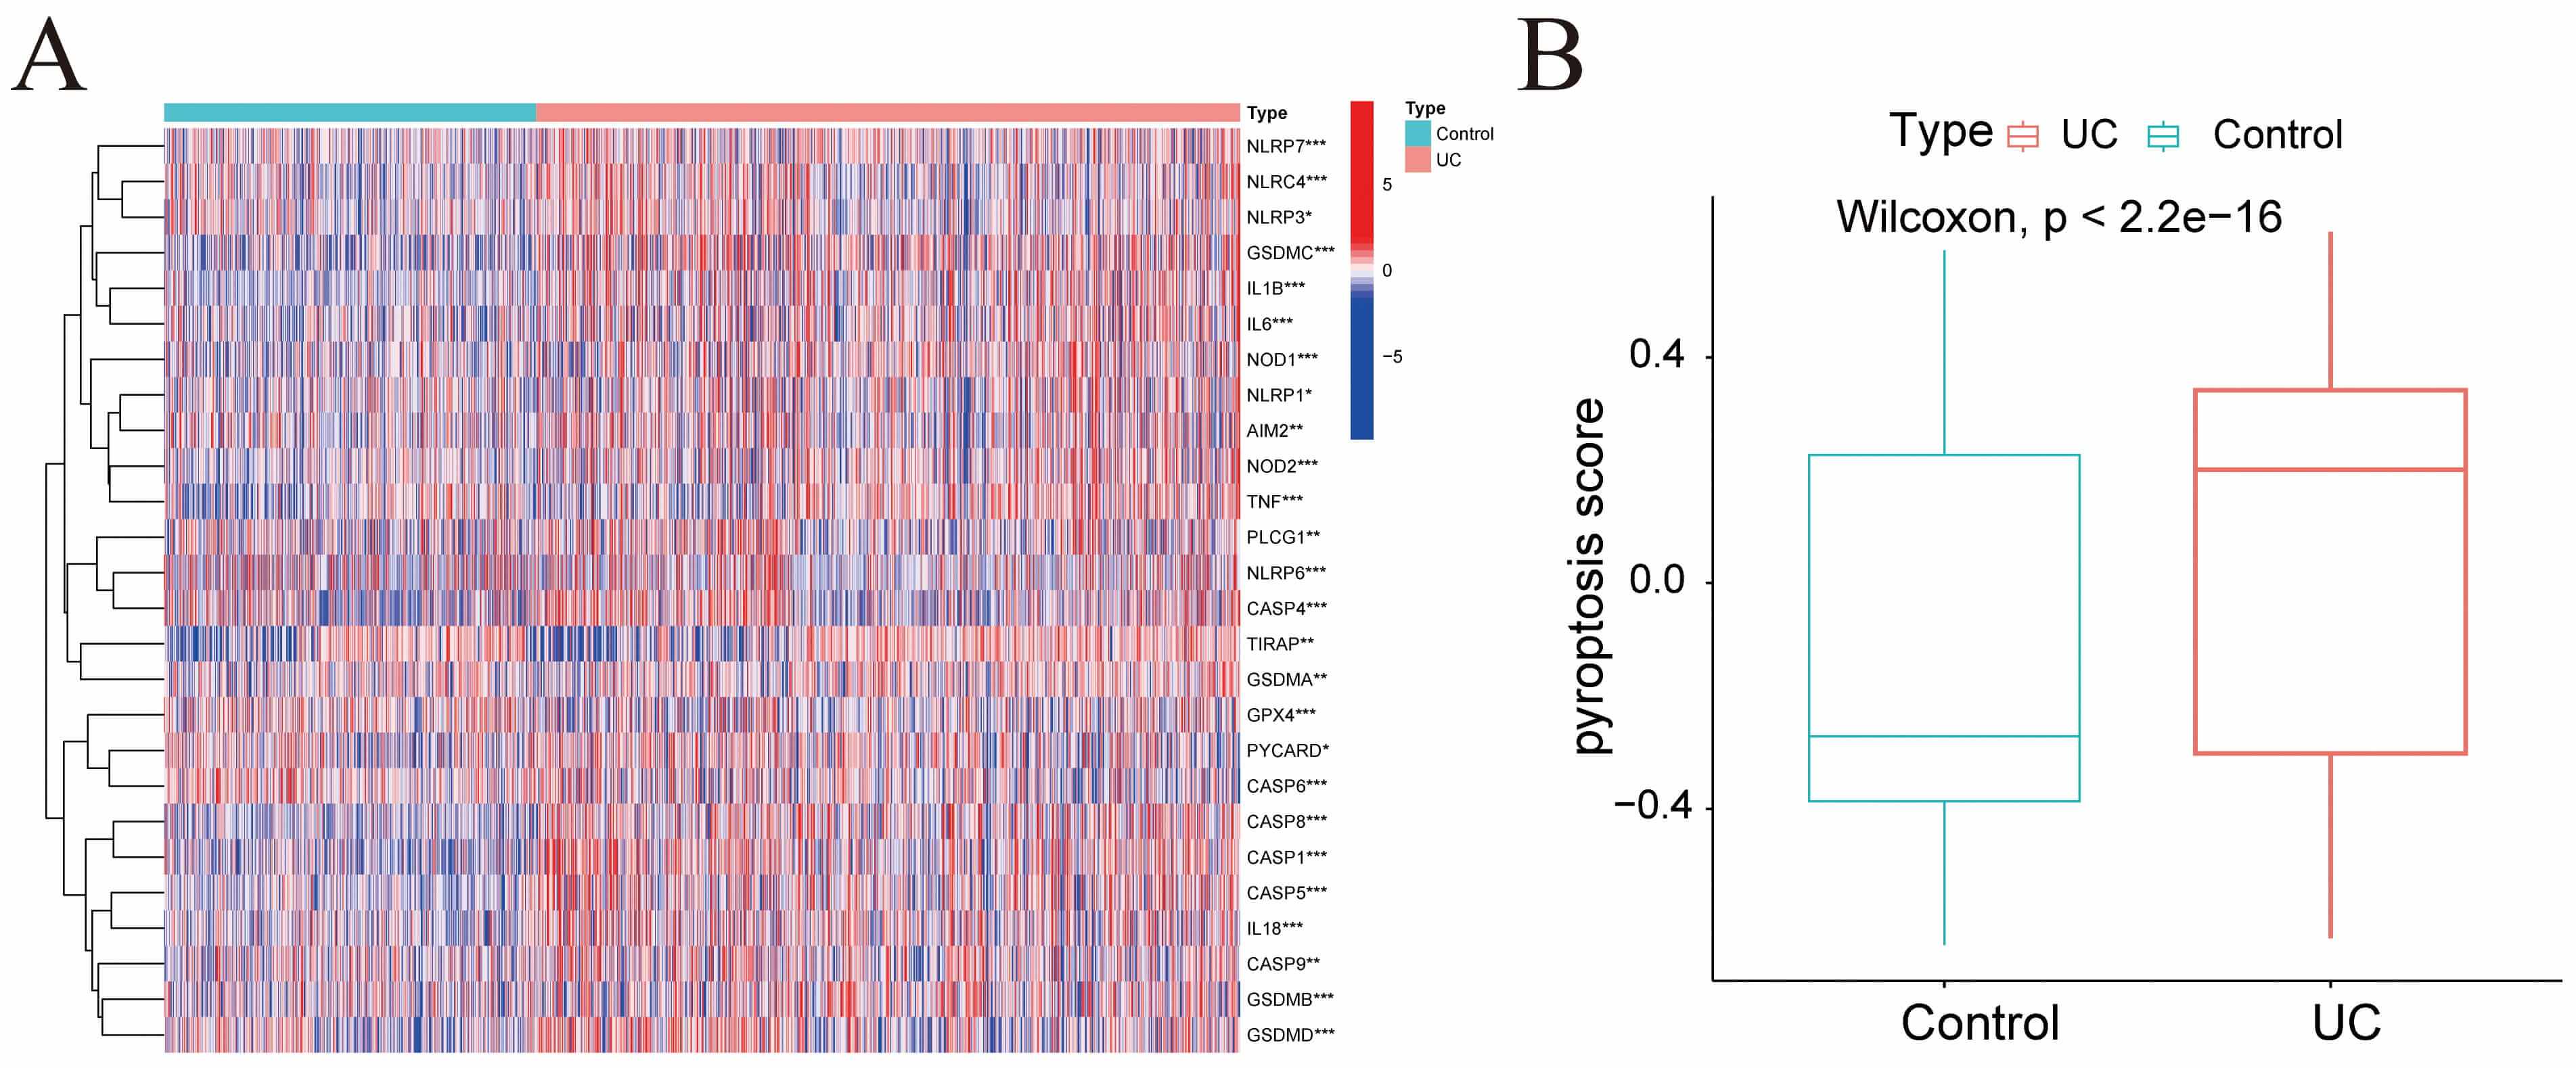 Fig. 3.
Pyroptosis score. (A) Heatmap illustrating the expression of
pyroptosis-related genes across samples from different groups in the GSE193677
dataset. (B) Bar chart showing the pyroptosis scores for each group. *p
WGCNA was performed on the identified DEGs. Initial sample clustering led to the
exclusion of four outlier samples (Fig. 4A), after which the remaining samples
were re-clustered and a heatmap of clinical features was generated (Fig. 4B).
Based on the scale-free topology criterion, a soft-thresholding power of 7 was
selected to construct the weighted co-expression network (Fig. 4C–E). A
topological overlap matrix (TOM) was then constructed (Fig. 4F), and inter-module
correlations were analyzed (Fig. 4G). Through correlation analysis between
clinical traits (pyroptosis score and UC status) and gene modules (Fig. 4H), two
modules, blue (76 genes) and turquoise (252 genes), were identified with strong
correlations (p
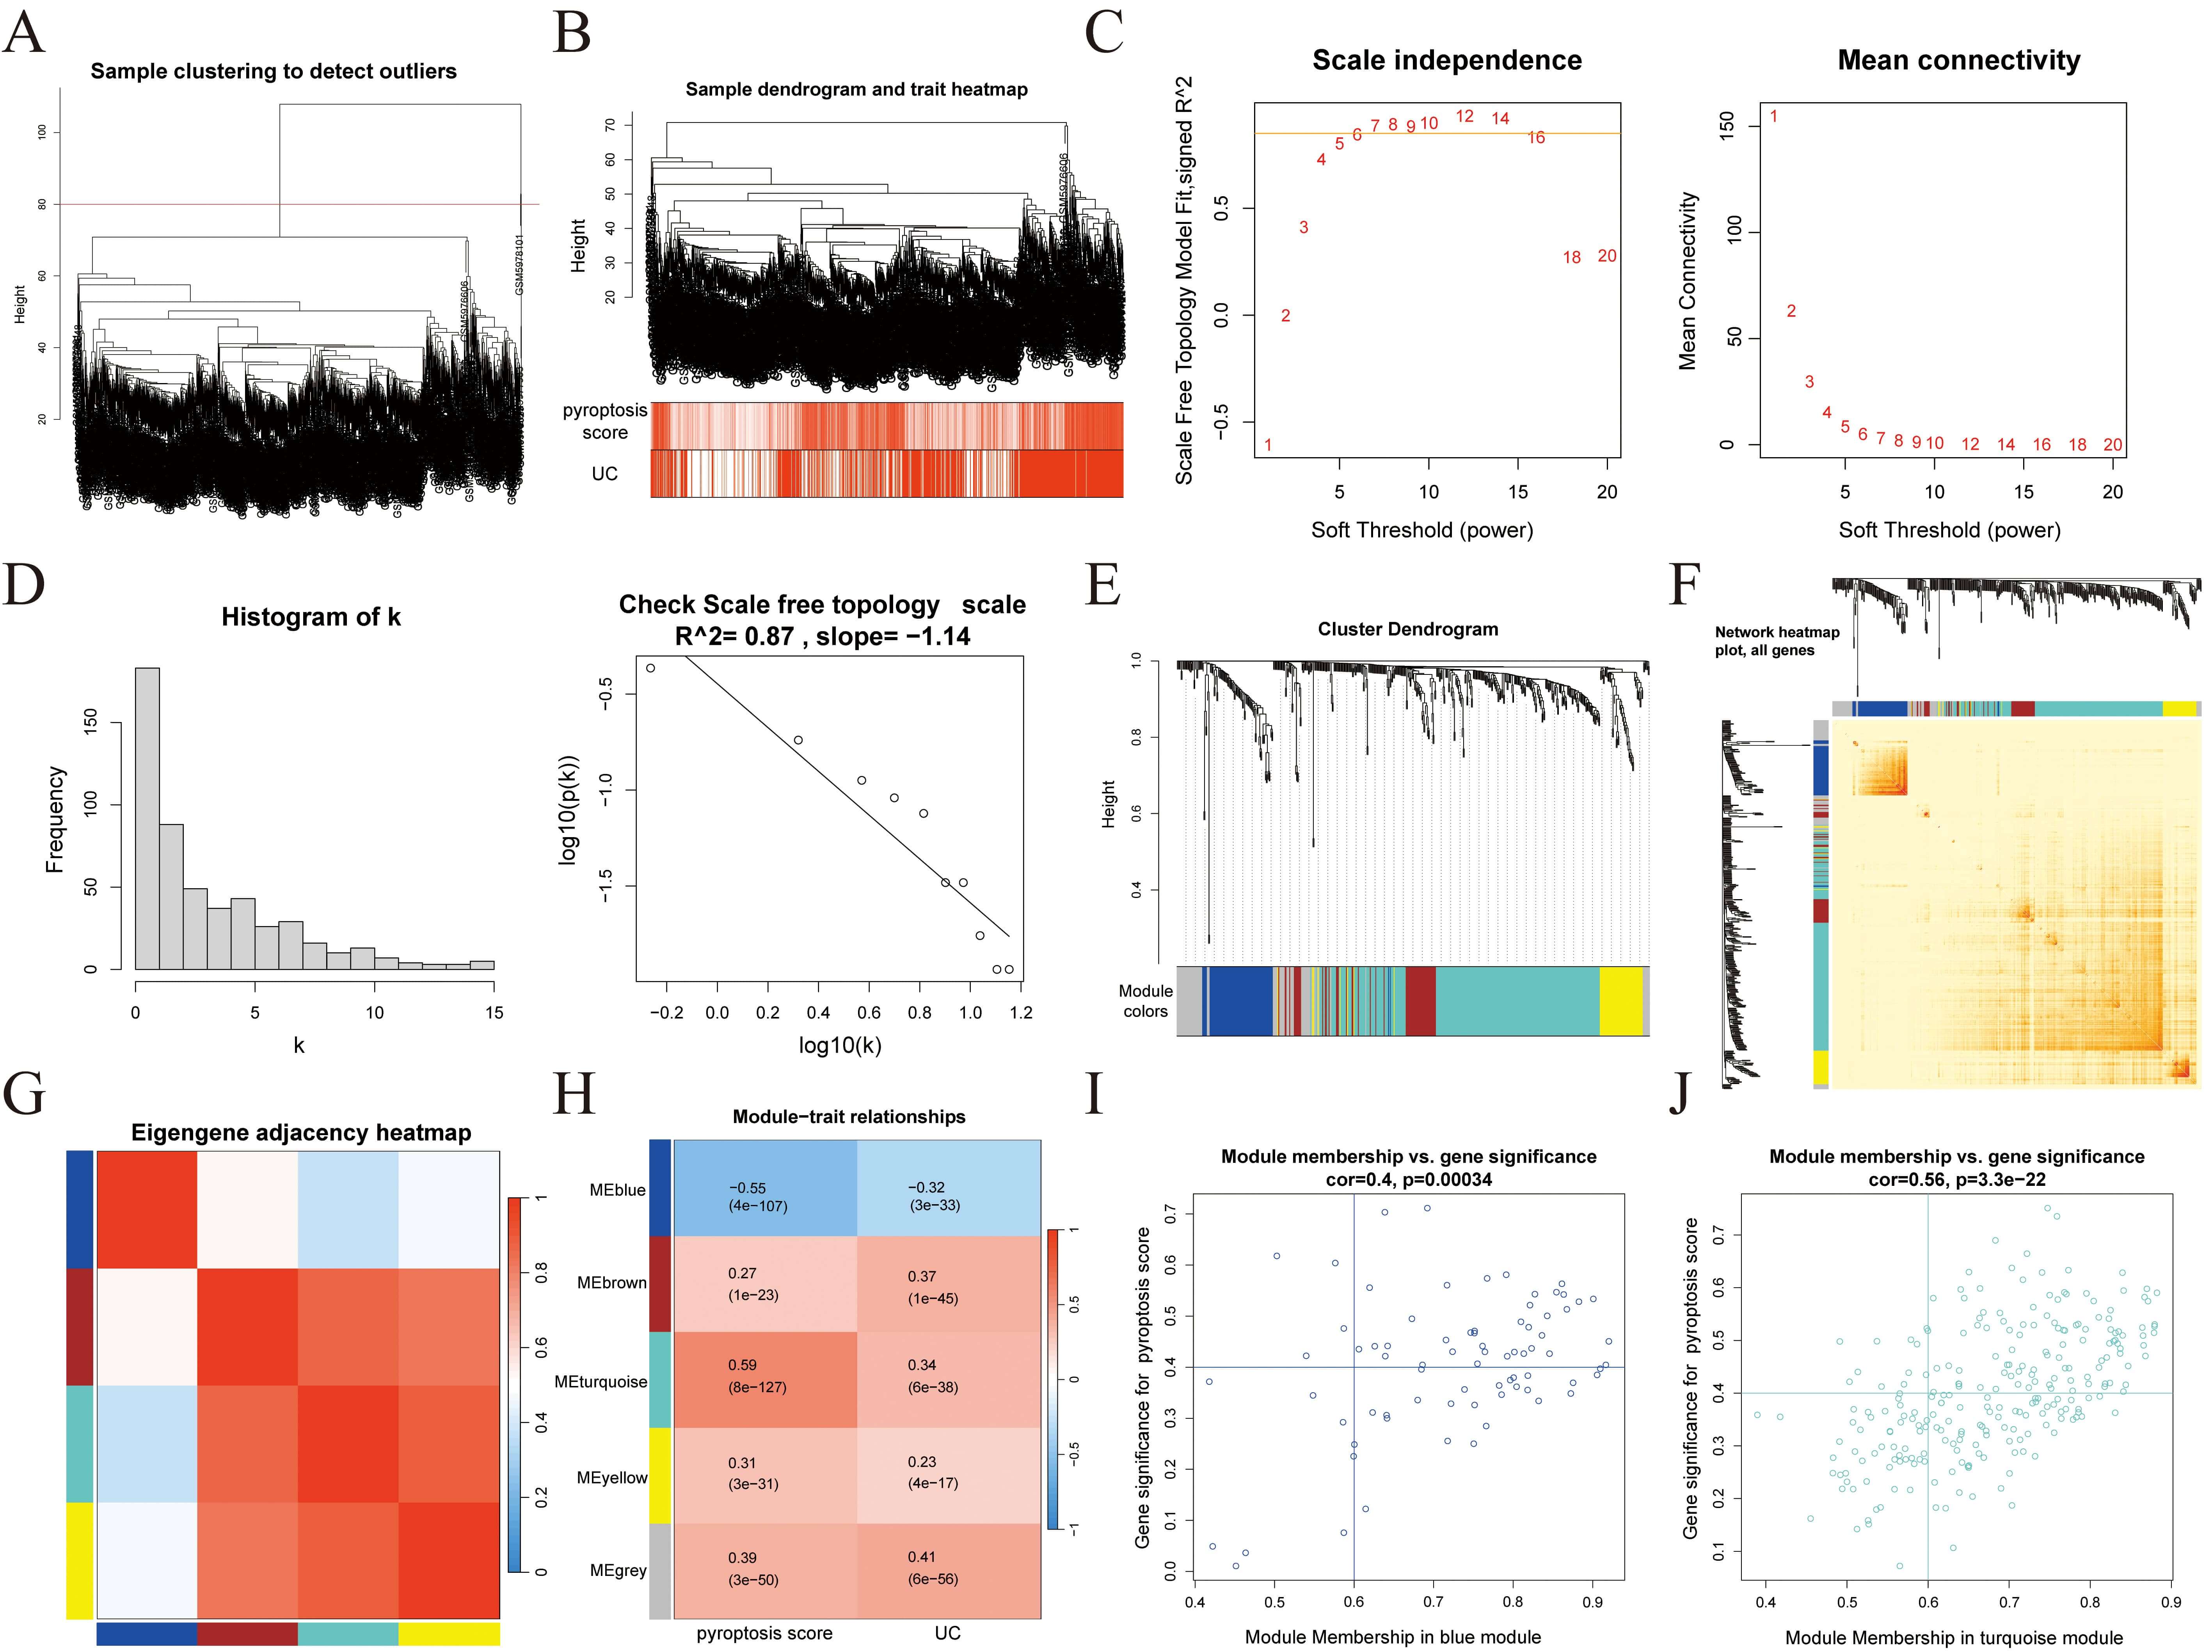 Fig. 4.
WGCNA. (A) Sample clustering. (B) Sample clustering and clinical feature heatmaps. (C) Scale-free fitting index and average connectivity analysis under different soft threshold powers. (D) Visual testing of scale-free topologies. (E) Heatmap showing the correlation between module characteristic genes and clinical status. (F) TOM diagram. (G) Heatmap showing the correlation between modules. (H) Heatmap showing the correlation between modules and clinical features. (I) Correlation analysis of the blue module with UC. (J) Correlation analysis of the turquoise module with UC. WGCNA, weighted gene co-expression network analysis; TOM, topological overlap matrix; UC, ulcerative colitis.
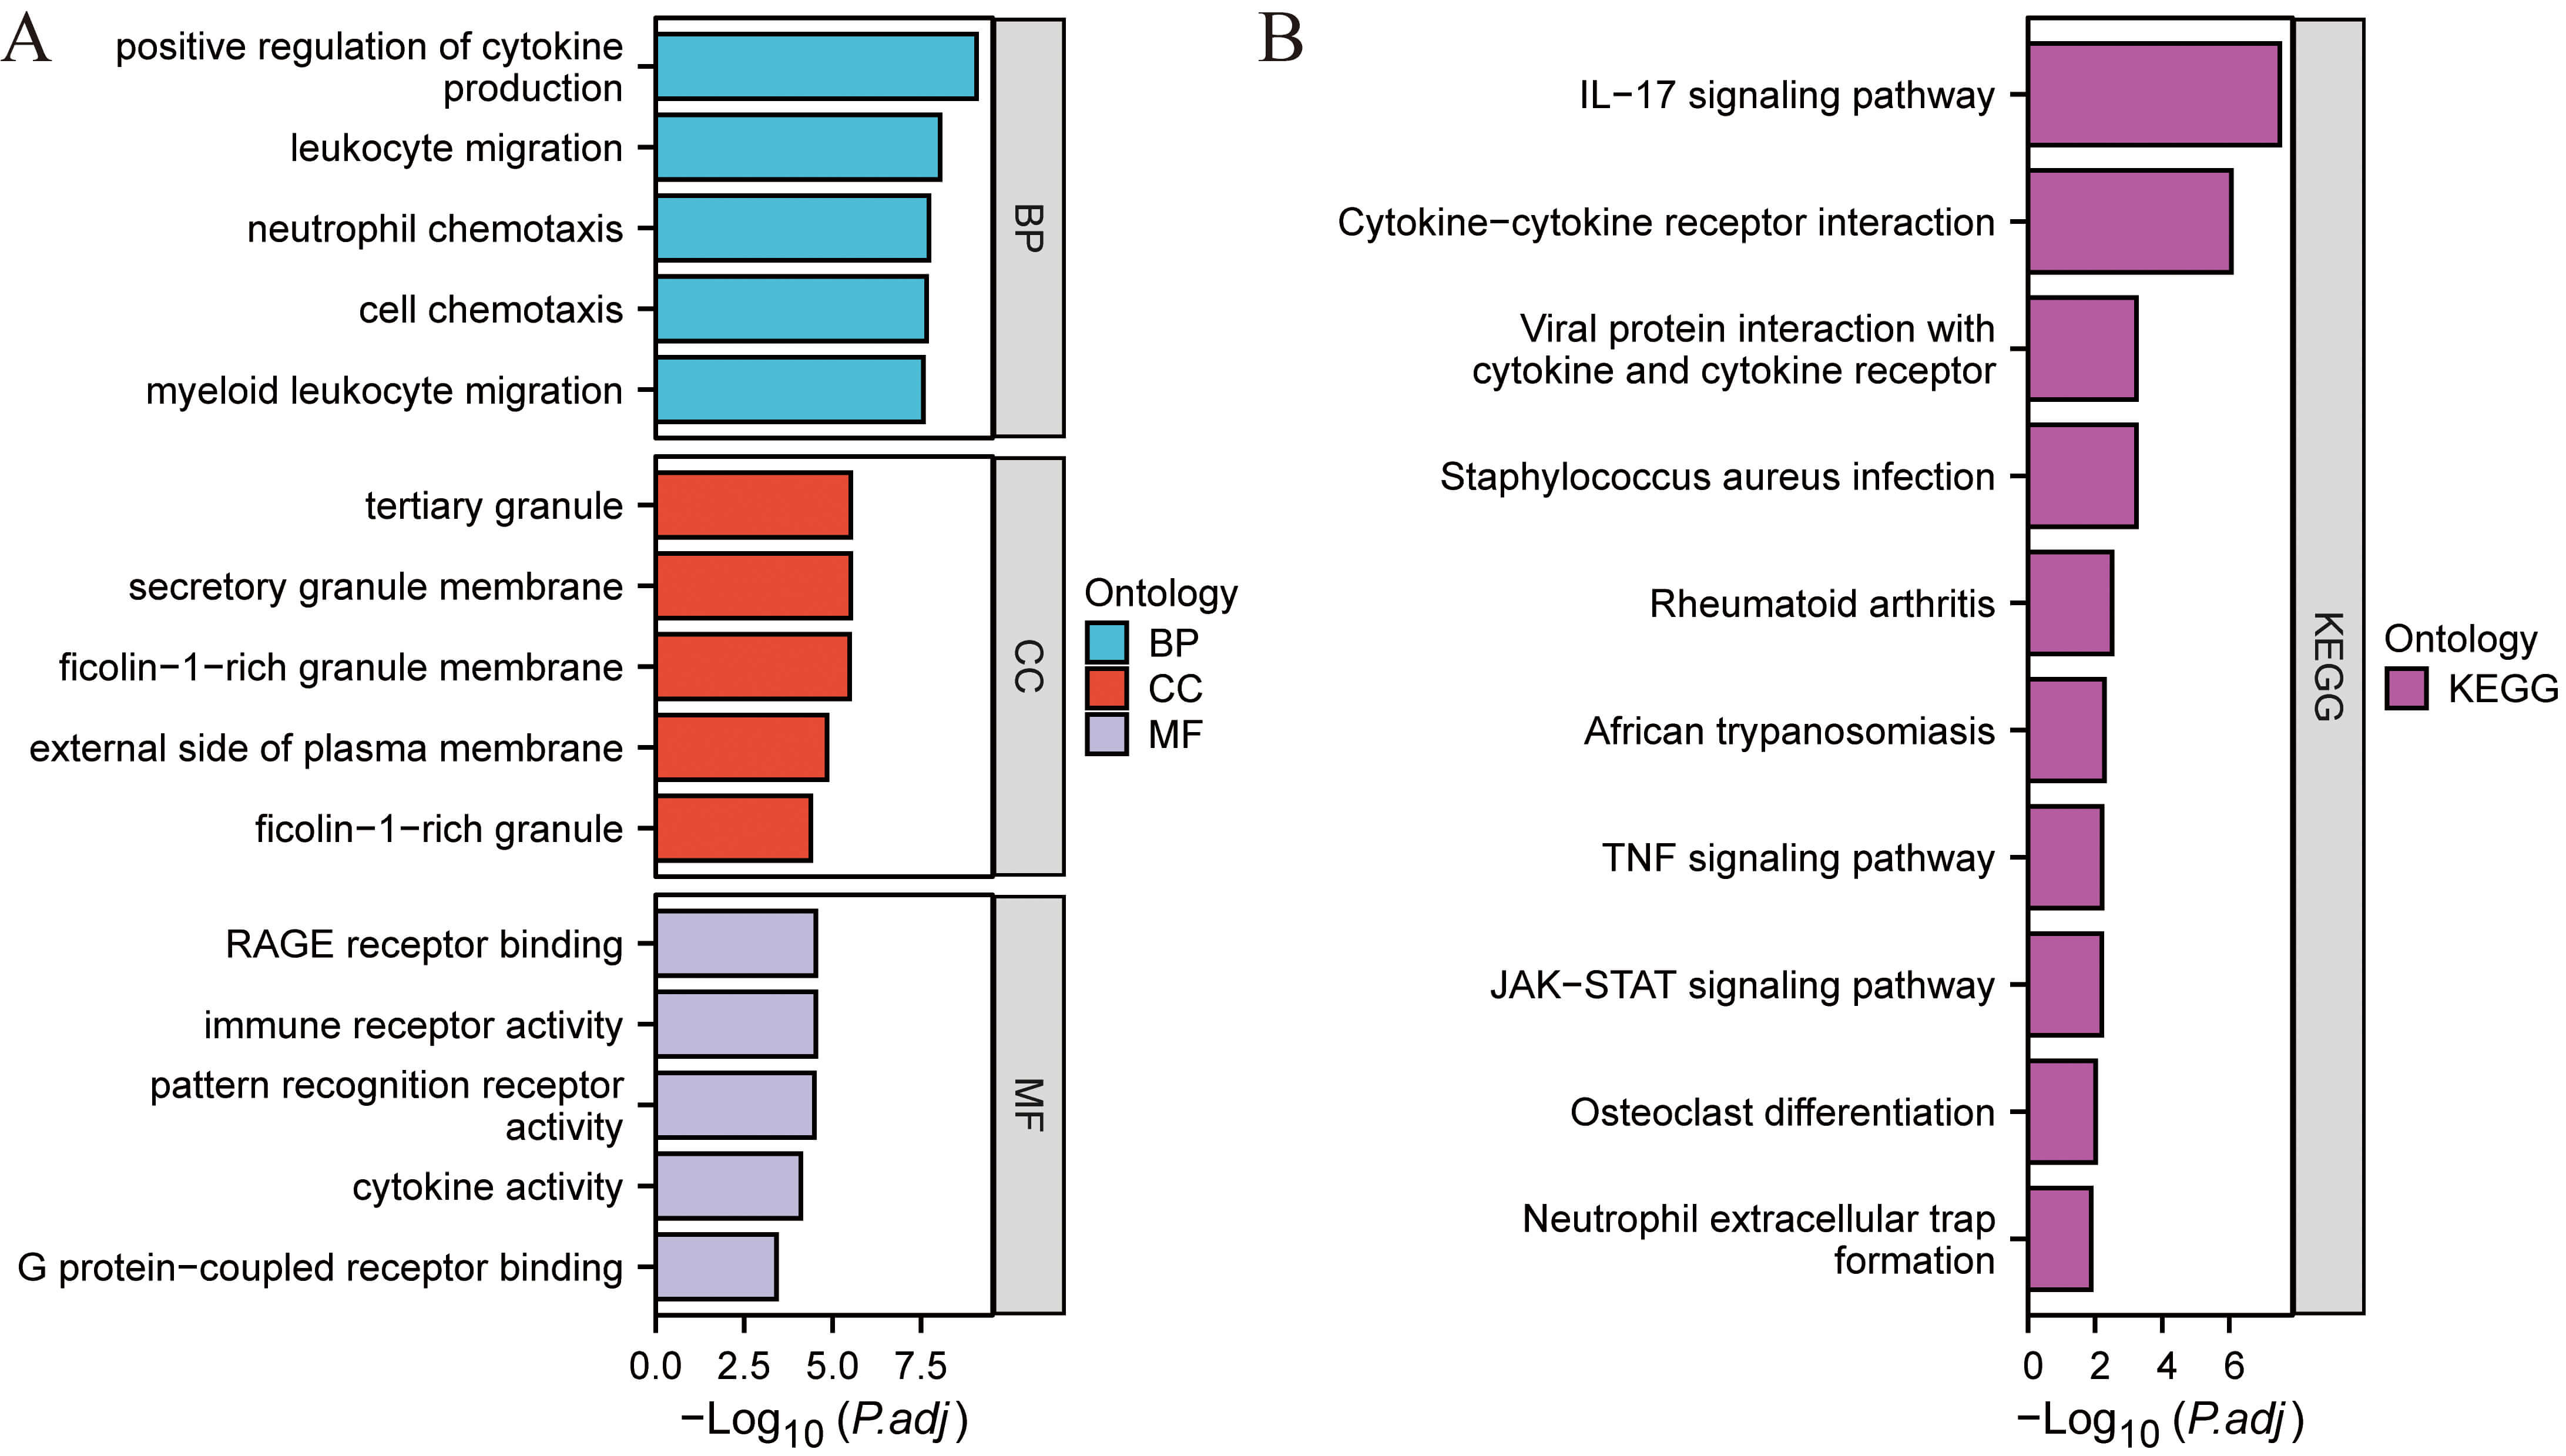 Fig. 5.
Functional enrichment analysis. (A) GO enrichment. (B) KEGG pathway enrichment.
PPI analysis was conducted on the 149 key genes identified through WGCNA (Fig. 6A). Using Cytoscape, a core network comprising 12 genes (all upregulated in the UC group) was generated (Fig. 6B). Three machine learning algorithms were applied to these 12 genes to further identify hub genes: LASSO regression (Fig. 6C,D), random forest (Fig. 6E,F), and SVM-RFE (Fig. 6G). The intersection of results from all three algorithms yielded five hub genes: AQP9, S100A8, S100A9, S100A12, and VNN2 (Fig. 6H).
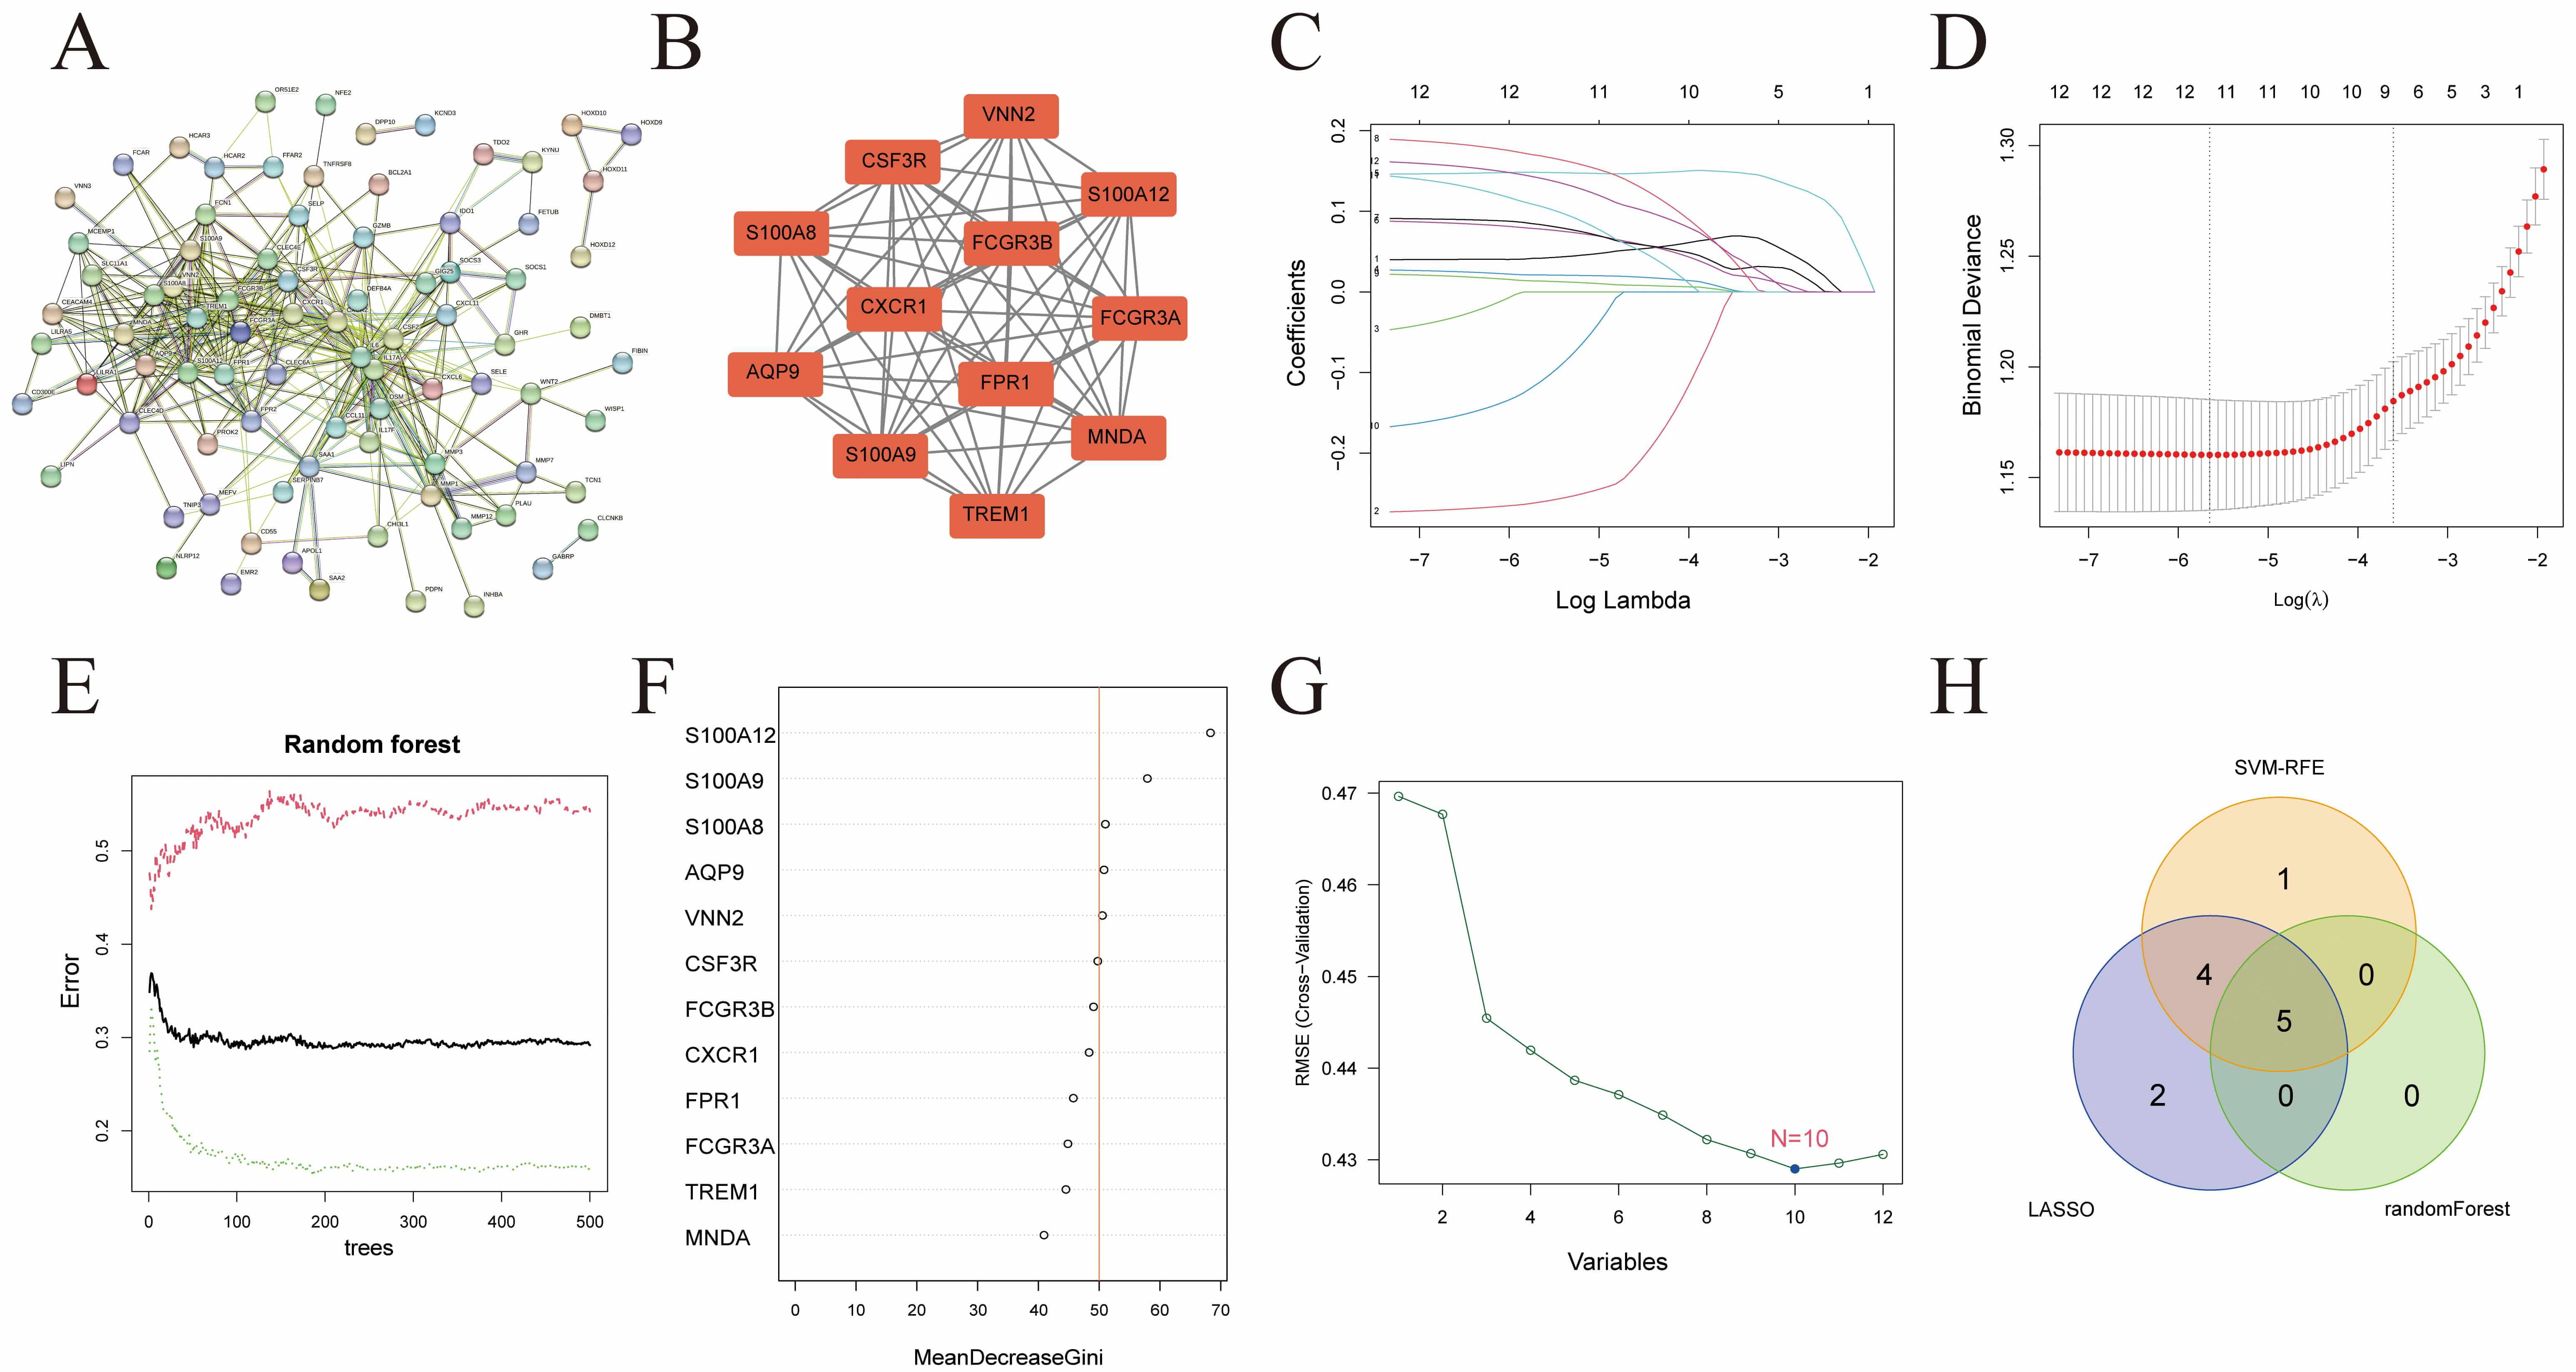 Fig. 6.
Hub gene screening. (A) PPI network of 149 WGCNA-derived genes. (B) Key genes identified within the PPI network. (C) Calculation of regression coefficients. (D) Best forecasting models. (E) The effect of the decision tree number on error rate. (F) Results of the Gini coefficient method in a random forest classifier. (G) RMSE evaluates SVM regression models. (H) A Venn diagram illustrating the similarities and differences among the results of the three machine learning algorithms. PPI, protein-protein interaction; RMSE, root mean square error; SVM, support vector machine.
Immunoinfiltration analysis was conducted on the GSE193677 dataset (Fig. 7A), and inter-correlations among immune cell populations were assessed (Fig. 7B). A strong positive correlation was revealed between neutrophils and Gamma delta T cells. The relative abundance of individual immune cell types was compared between the UC and Control groups (Fig. 7C), with statistically significant differences observed in 17 of 22 immune cell types. Notably, AQP9 expression was positively correlated with neutrophils, macrophages M1, and plasma cells, while negatively correlated with resting mast cells, memory B cells, naïve CD4+ T cells, resting dendritic cells, and macrophages M2 (Fig. 7D). These results suggest that AQP9 may modulate immune cell infiltration, thereby contributing to the pathogenesis of UC.
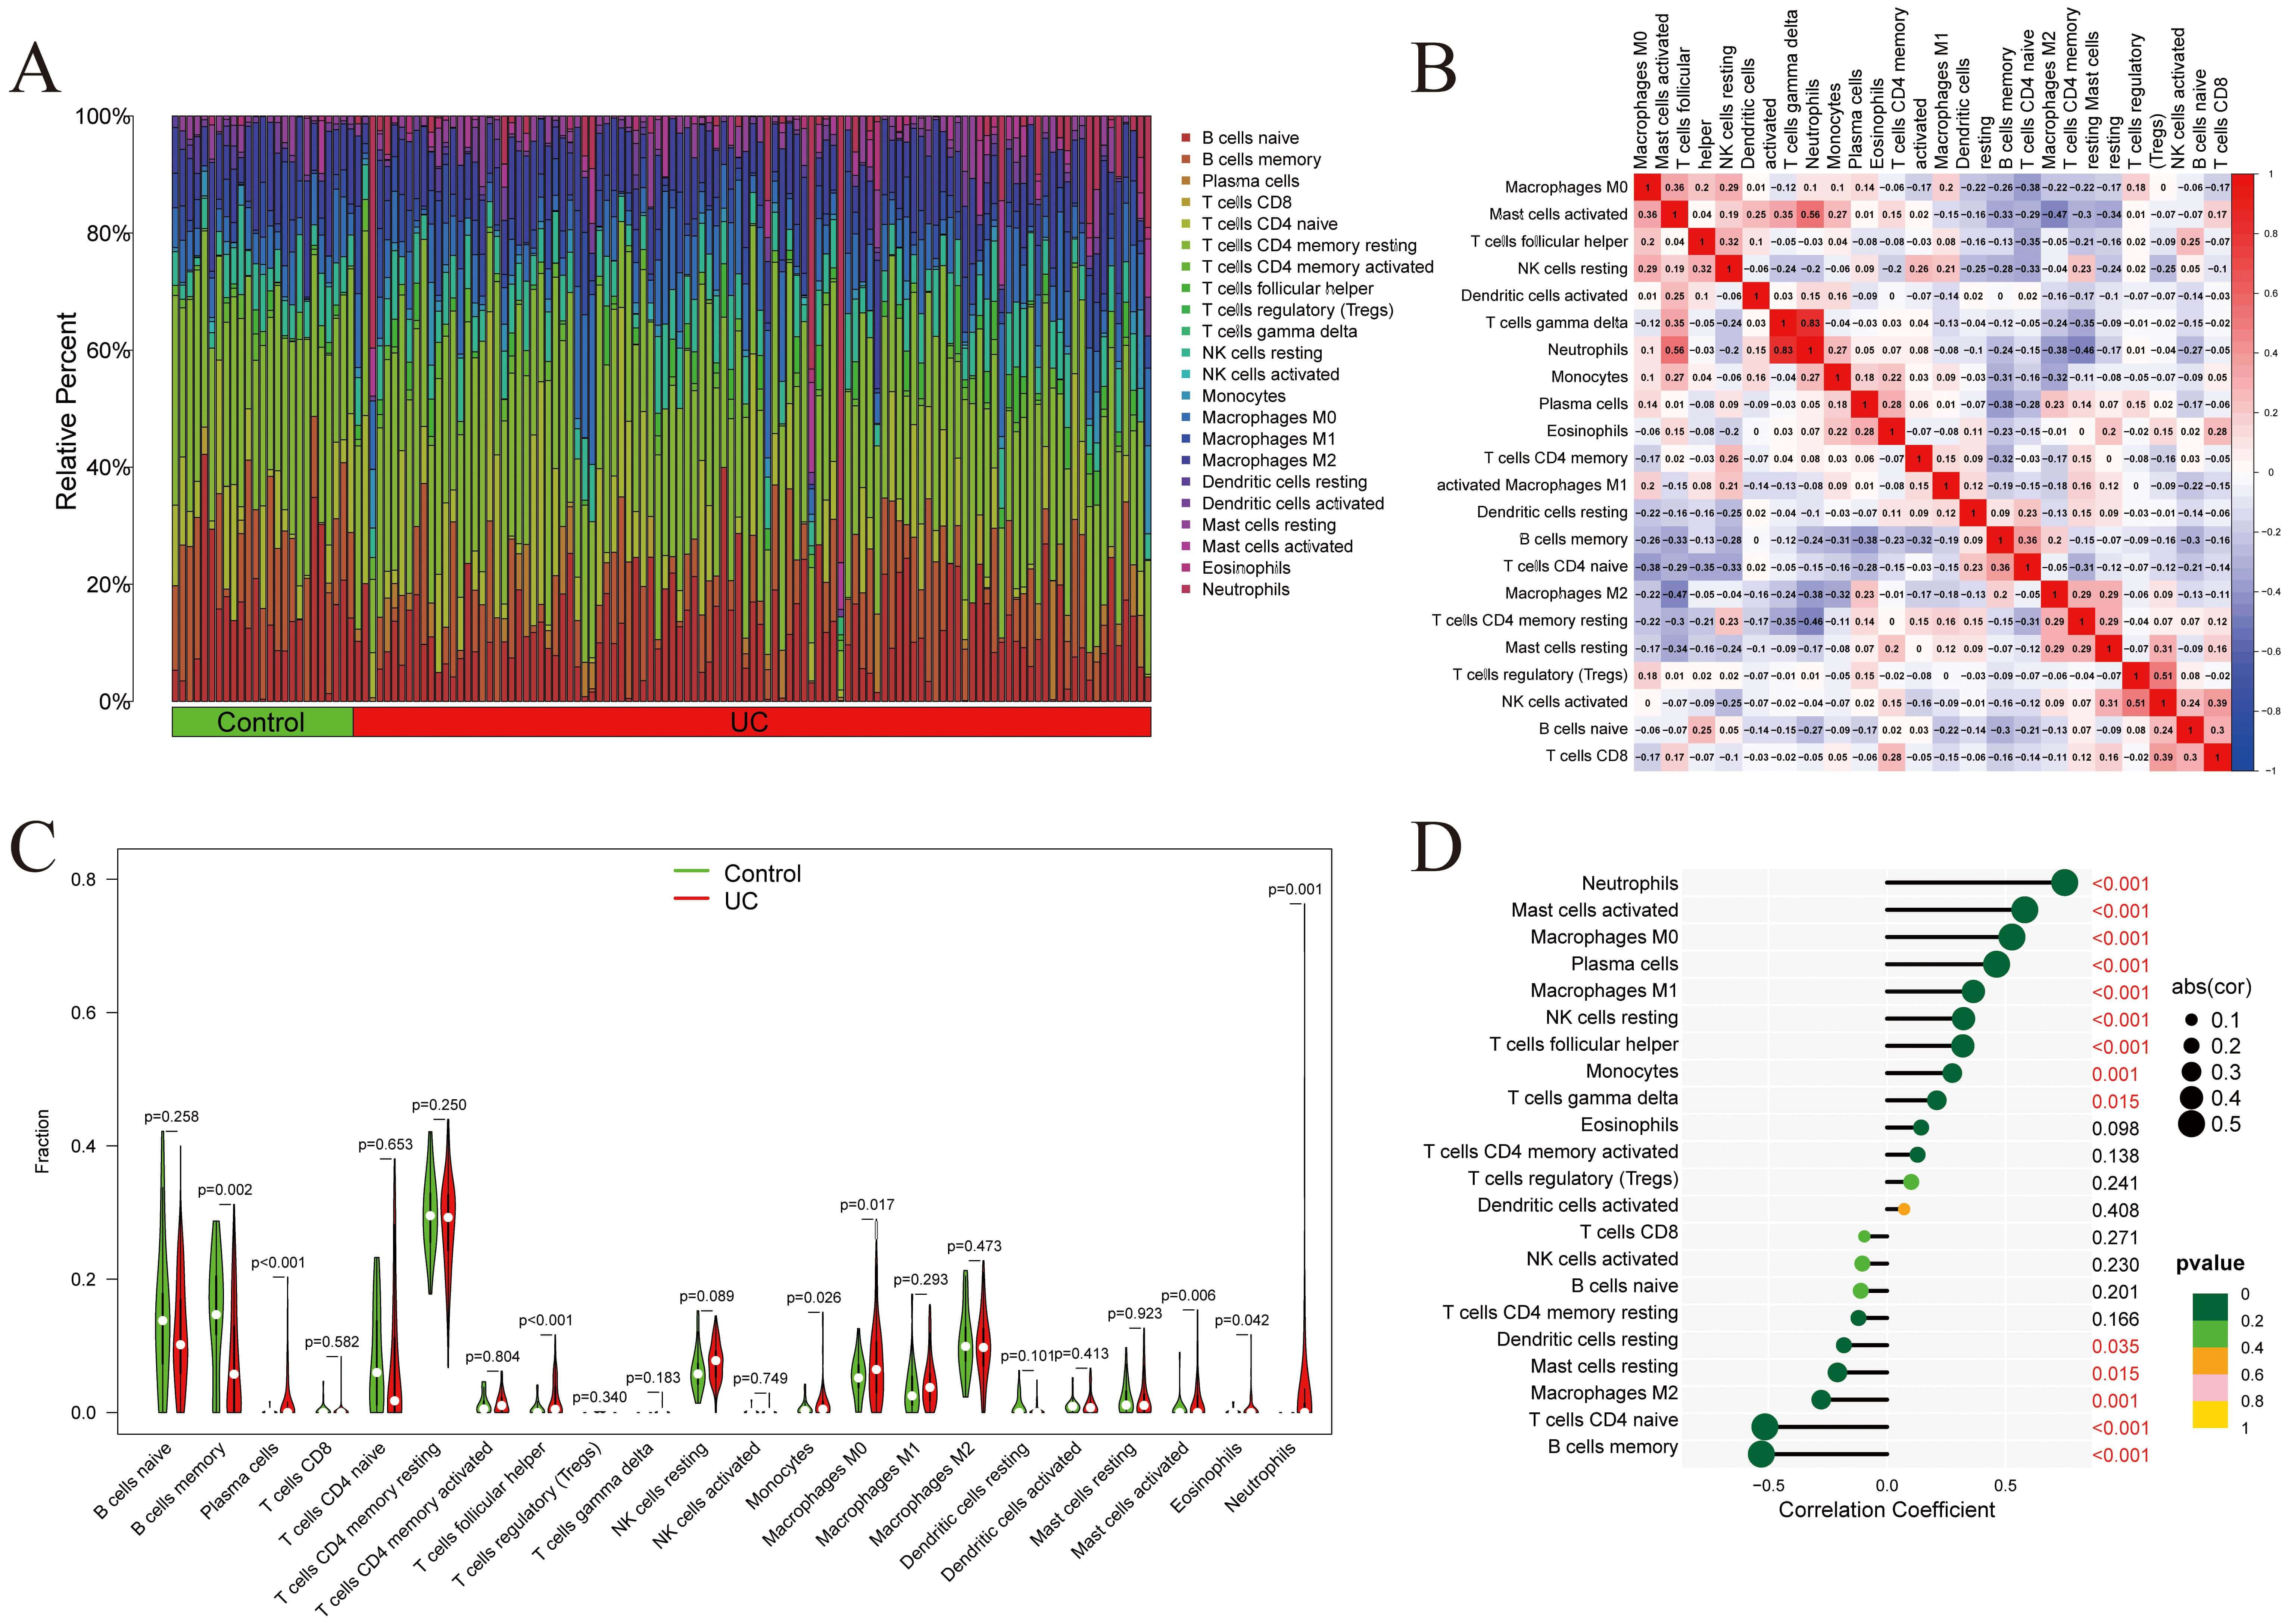 Fig. 7.
Immunoinfiltration analysis. (A) Proportions of 22 immune cells in the samples within the GSE193677 dataset. (B) Correlations between immune cells. (C) Comparison of the differences in immune cells between the Control and UC groups. (D) Lollipop plot showing the correlation between immune cells and AQP9 expression (In the lollipop plot, the color of the circles represents the statistical significance of the correlation between genes and immune cells).
Correlation analysis revealed a significant association between AQP9 expression and pyroptosis scores (Fig. 8A). Consistently, AQP9 was upregulated in the UC group within the GSE193677 dataset (Fig. 8B). ssGSEA indicated that AQP9 may influence the JAK-STAT pathway (Fig. 8C). According to recent literature, the JAK-STAT pathway plays a pivotal role in the regulation of pyroptosis [13].
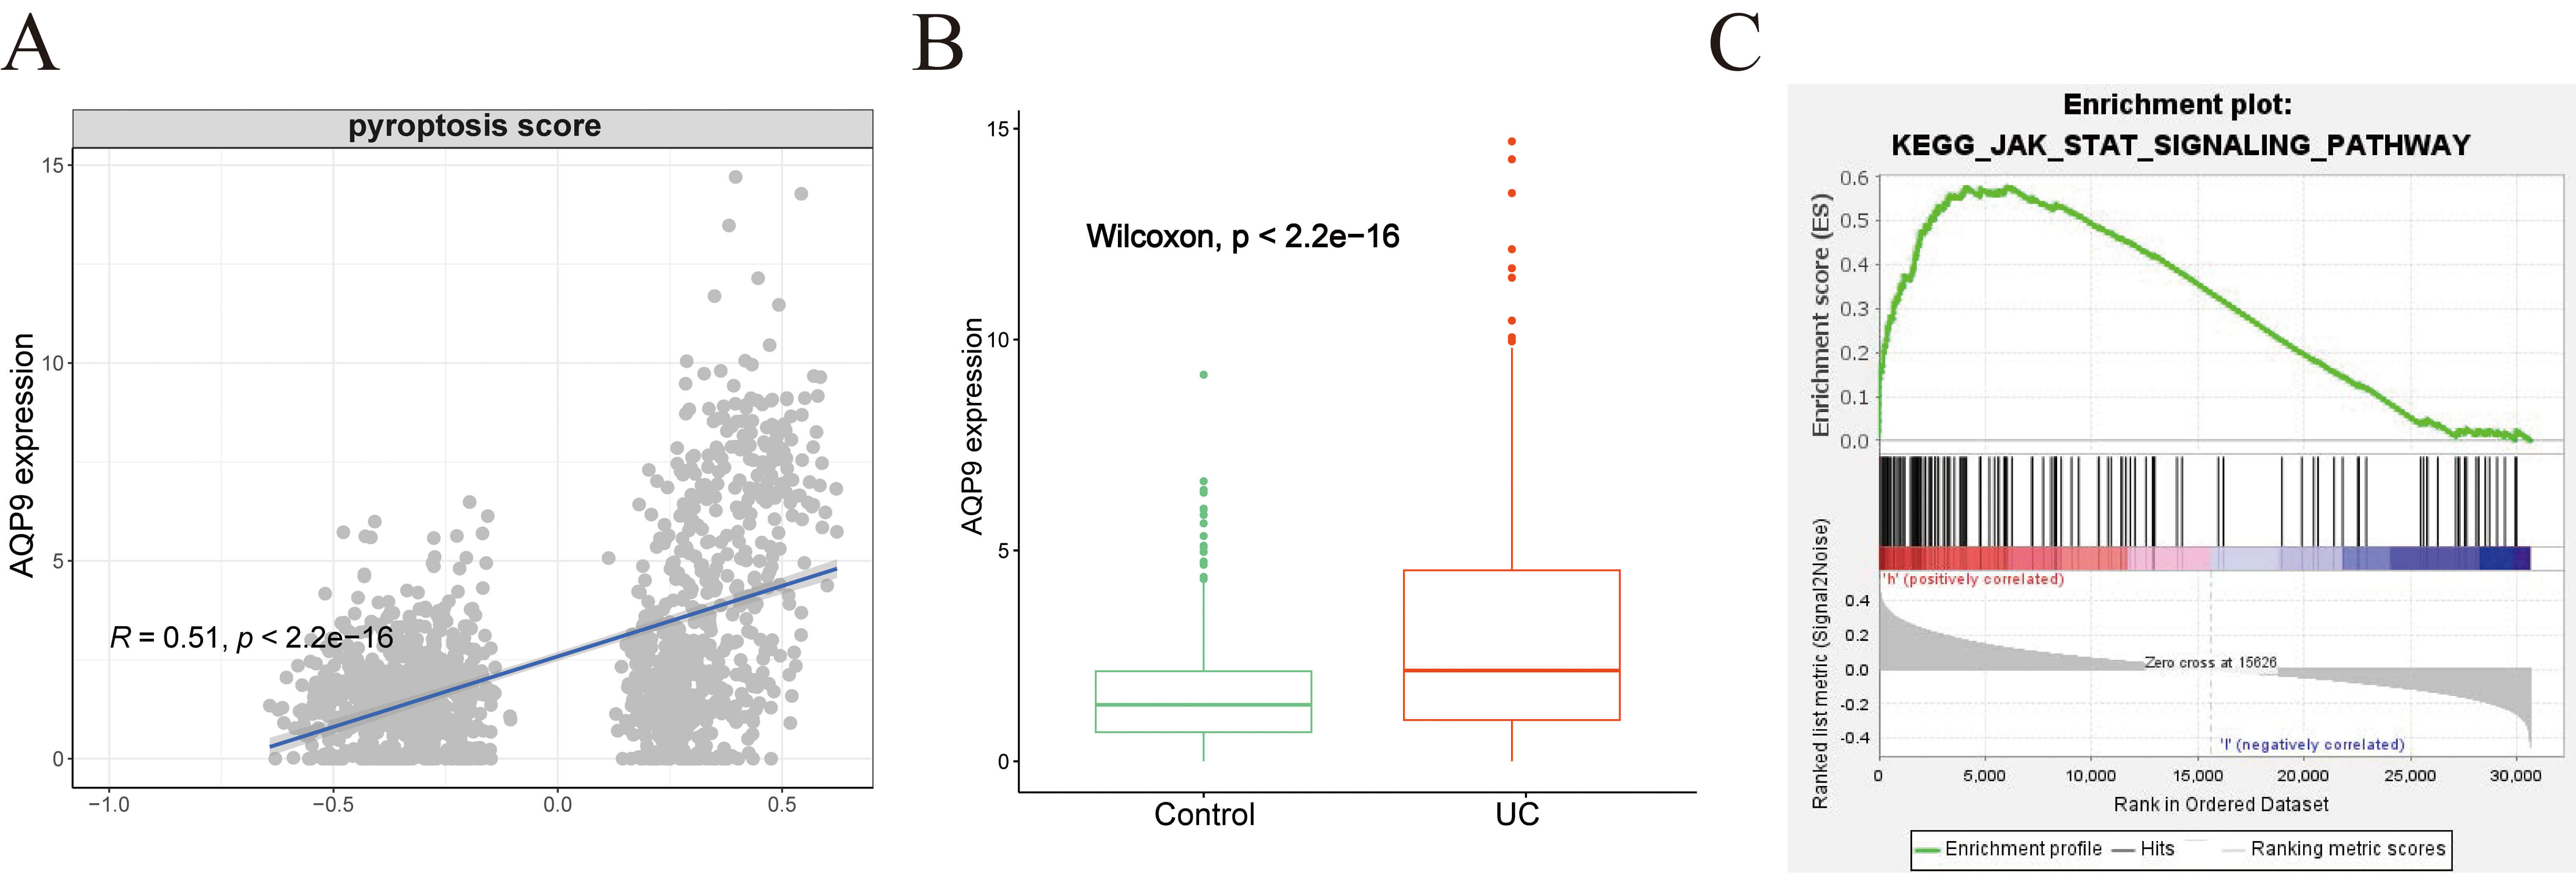 Fig. 8.
Correlation between AQP9 and pyroptosis. (A) Correlation between AQP9 expression and pyroptosis scores. (B) Boxplot showing the expression of AQP9 in both the UC and Control groups. (C) Association between AQP9 expression and JAK-STAT pathway activity assessed by ssGSEA. ssGSEA, single-sample gene set enrichment analysis.
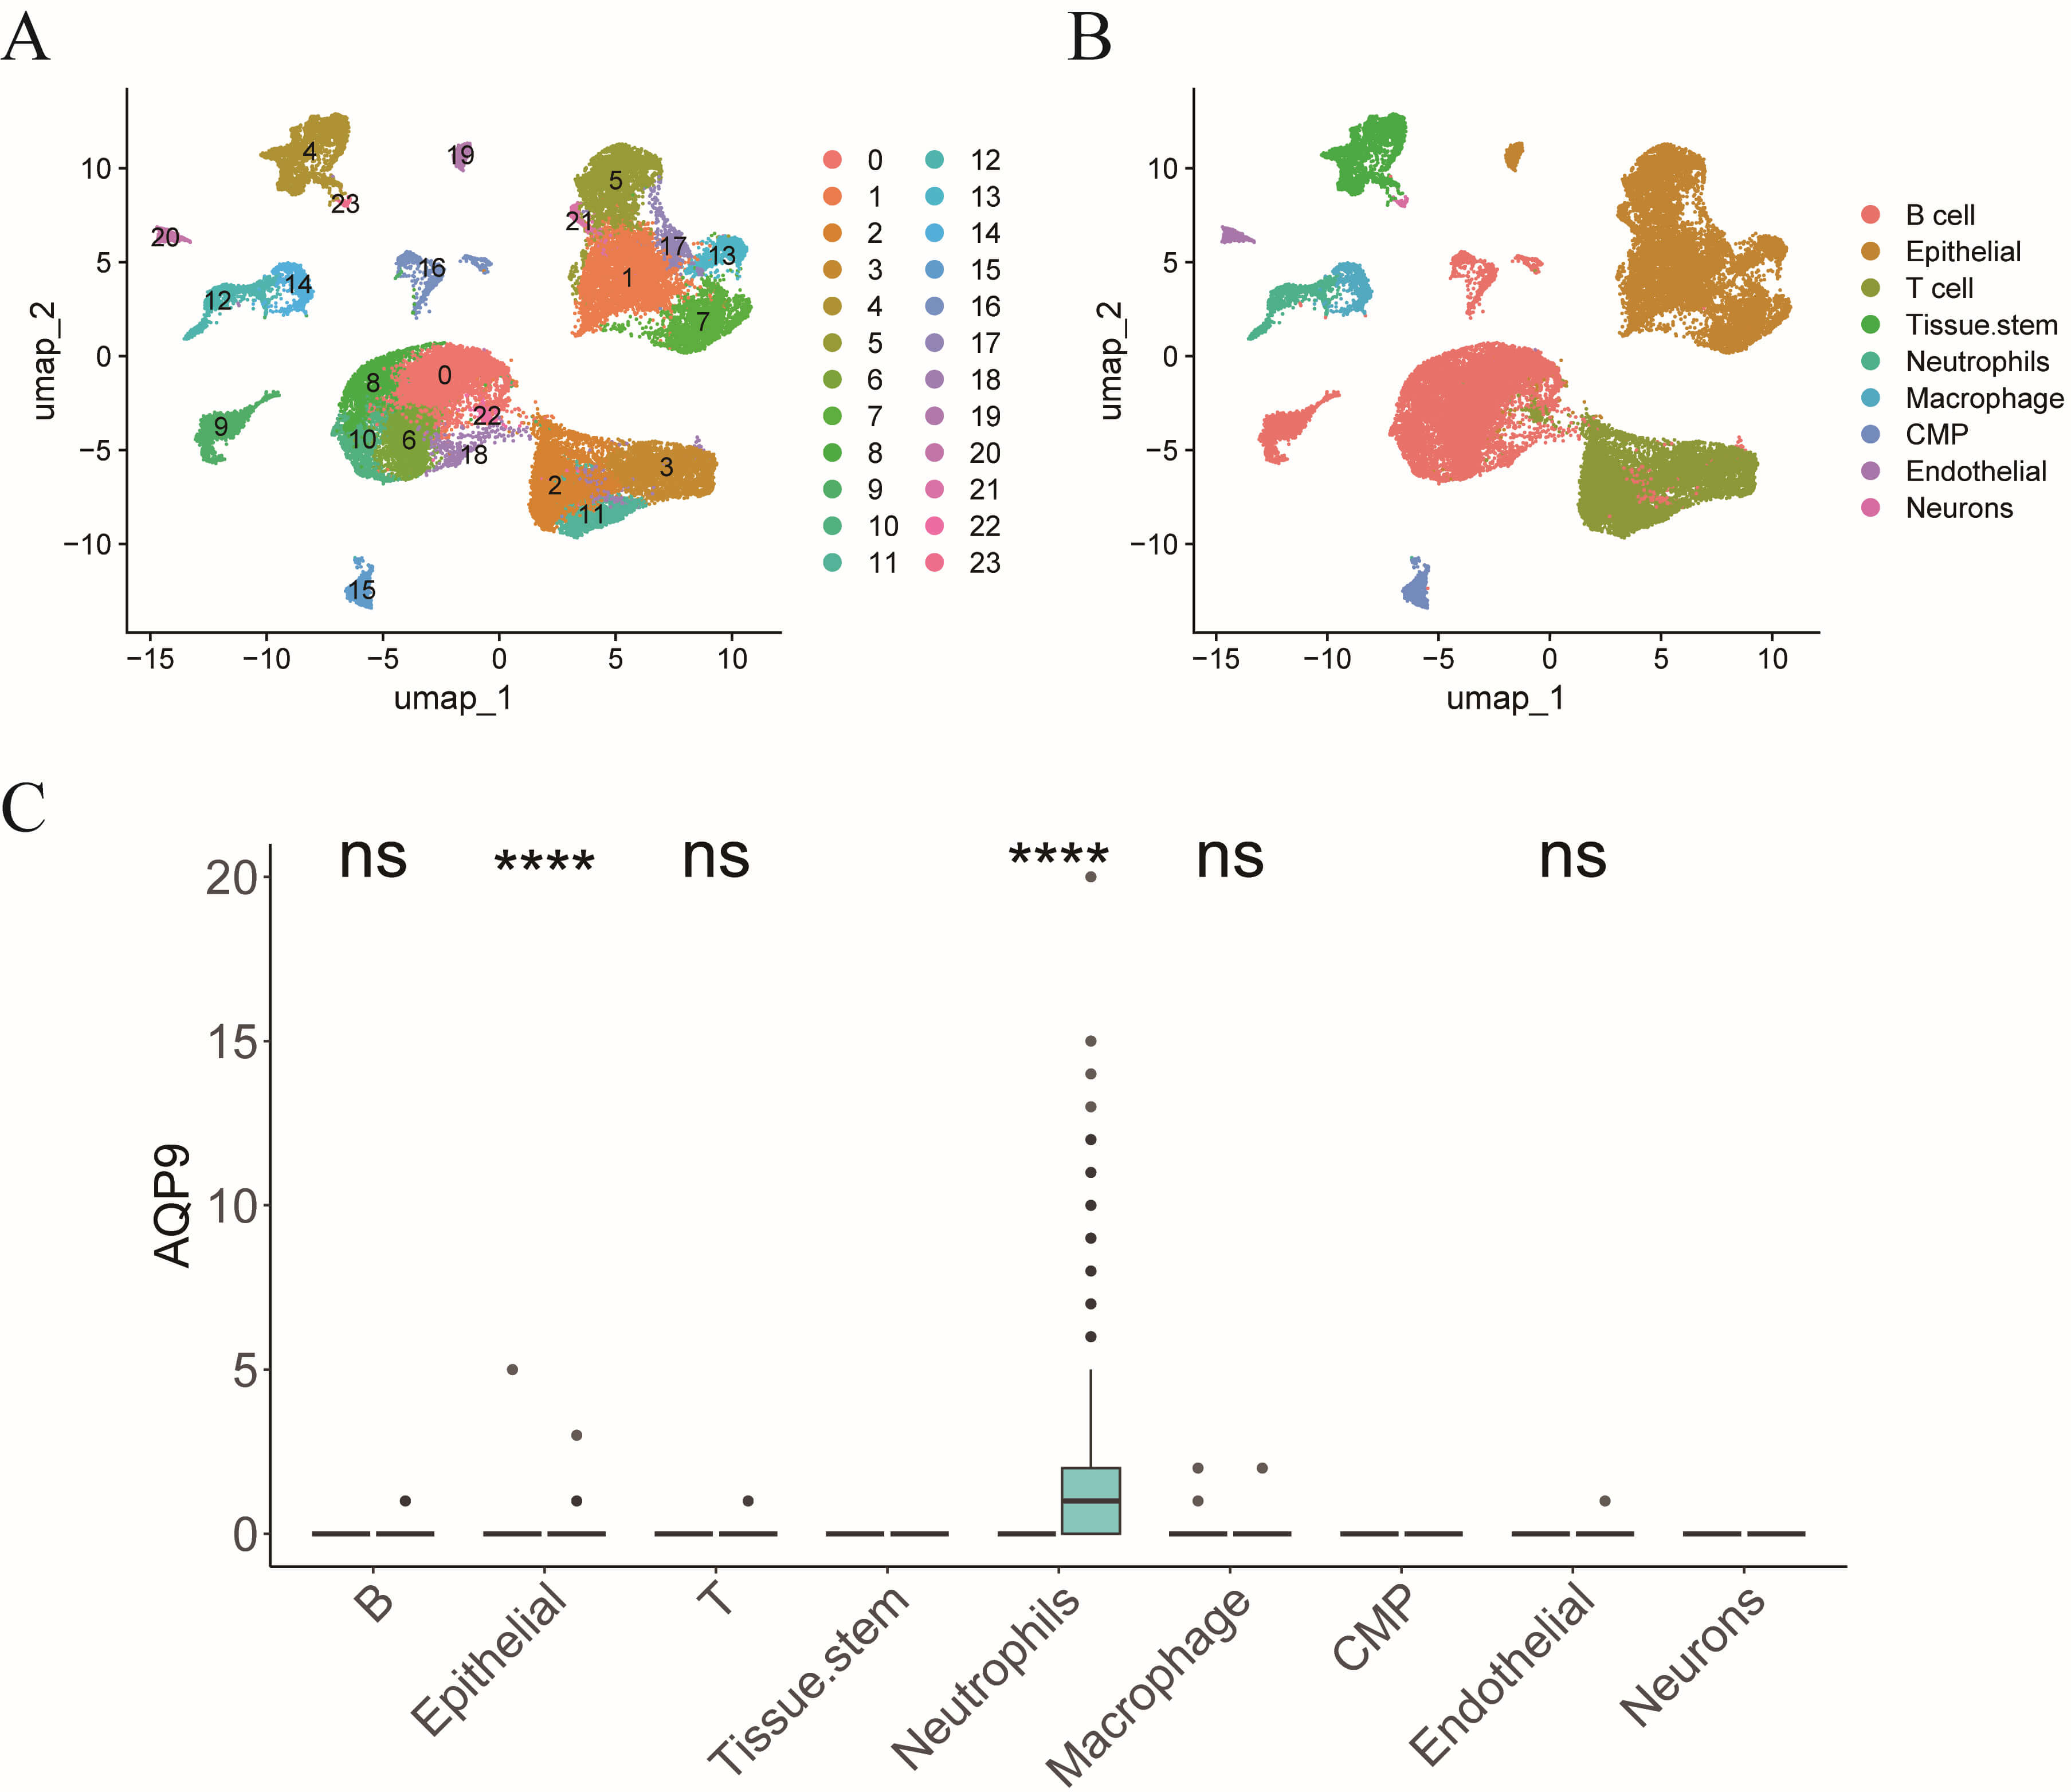
We interrogated the single-cell RNA sequencing dataset GSE214695 to pinpoint the specific cell type in which AQP9 exerts its influence on the pathogenesis of UC. Upon clustering, a total of 24 distinct cell clusters were identified (Fig. 9A). These clusters were subsequently annotated into nine cell types: T cells, tissue stem cells, neutrophils, epithelial cells, macrophages, B cells, common myeloid progenitors, endothelial cells, and neurons (Fig. 9B). Differential expression analysis of AQP9 across these cell types revealed significant upregulation of AQP9 in epithelial cells and neutrophils, with no significant differential expression observed in B cells, T cells, endothelial, or macrophages and no expression in the remaining cell types (Fig. 9C). Therefore, AQP9 is predominantly expressed in neutrophils and, notably, its expression is elevated in neutrophils from UC patients compared to those from individuals in the Control group (Fig. 9C).
 Fig. 9.
AQP9 is predominantly expressed in neutrophils. (A)
t-distributed stochastic neighbor embedding (t-SNE) plot showing cell clustering.
(B) t-SNE plot illustrating cell annotation situation. (C) Bar chart displaying
the differential expression of AQP9 in each cell across groups. CMP, common
myeloid progenitors. nsp
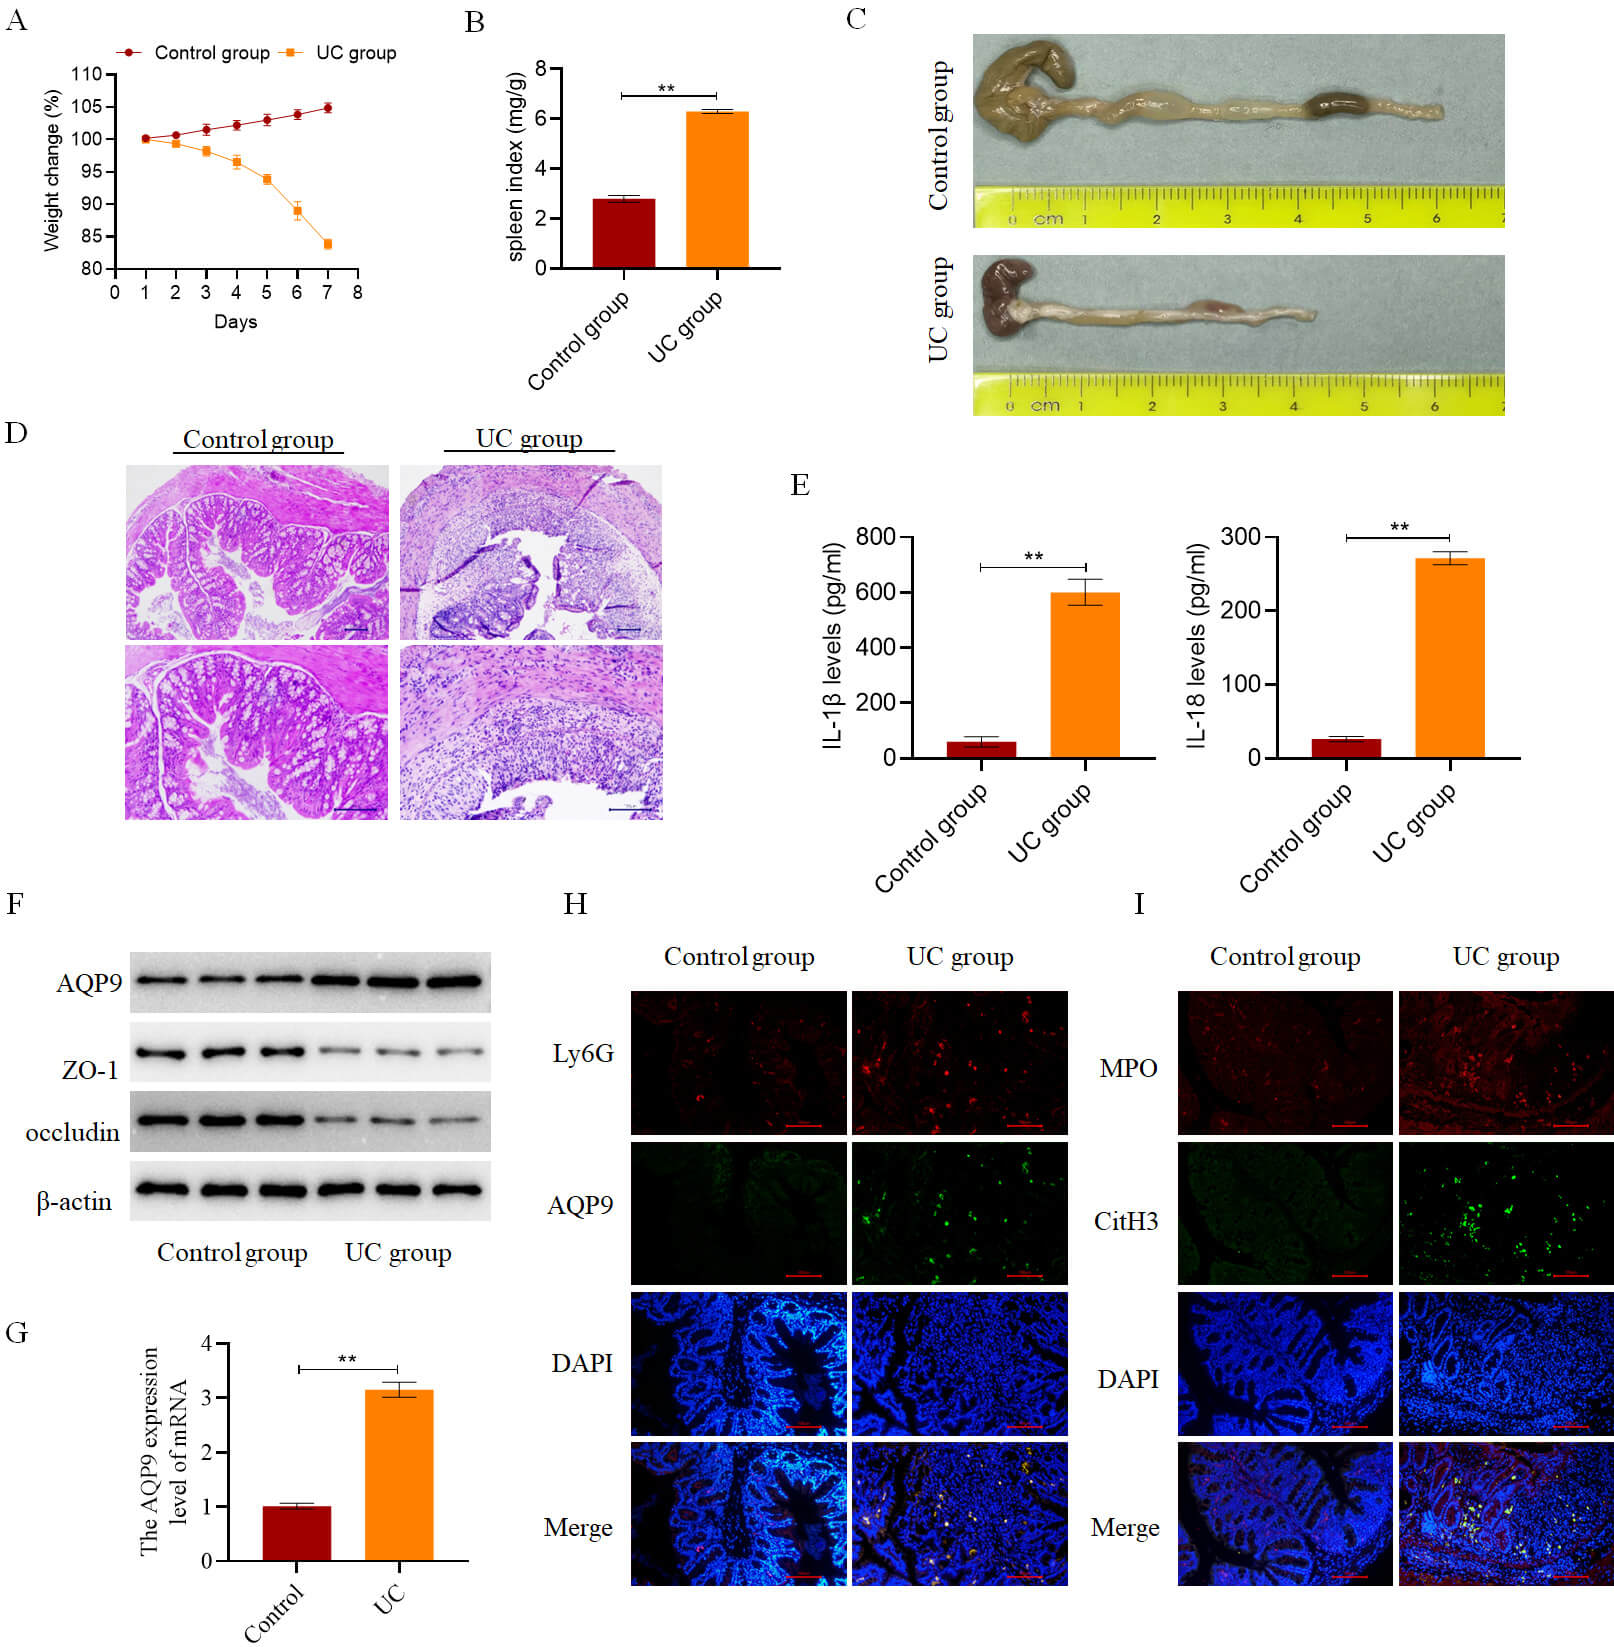
To validate findings from the bioinformatics analysis described above, a mouse
model of UC was established. Mice in the Control group were maintained on a
standard diet and water intake, and they exhibited normal activity and stable
body weight. In contrast, mice in the UC group displayed reduced activity, curled
postures, and significant body weight loss after 4–5 days of modeling (Fig. 10A). Additionally, the spleen index was elevated in the UC group compared to the
Control group (Fig. 10B). Macroscopically, colon tissues from the Control group
showed no signs of hemorrhage or ulceration, whereas those from the UC group
exhibited marked intestinal congestion, hemorrhagic changes, and substantial
colon shortening (Fig. 10C). Histological examination revealed that colonic
architecture was preserved in the Control group, with intact glandular
structures, well-aligned epithelial cells, normal crypt morphology, and preserved
lamina propria and muscular layers. In contrast, the UC group demonstrated
extensive inflammatory cell infiltration, disrupted mucosal architecture, crypt
loss, ulceration, and epithelial necrosis (Fig. 10D). Consistent with these
pathological changes, the expression of pro-inflammatory cytokines IL-18 and
IL-1
 Fig. 10.
AQP9 is highly expressed in the colon tissues of mice with UC.
(A) Daily body weight changes of mice in both the Control and UC groups (n = 6).
(B) Spleen index was measured in mice from both the Control and UC groups on day
7 post-modeling (n = 6). (C) Colon length was measured in mice from both the
Control and UC groups on day 7 post-modeling (n = 6). (D) Histopathological
changes in mouse colon tissue were examined in both the Control and UC groups on
day 7 post-modeling (n = 6, scale bar = 100 µm). (E) Measurement of the
levels of IL-18 and IL-1
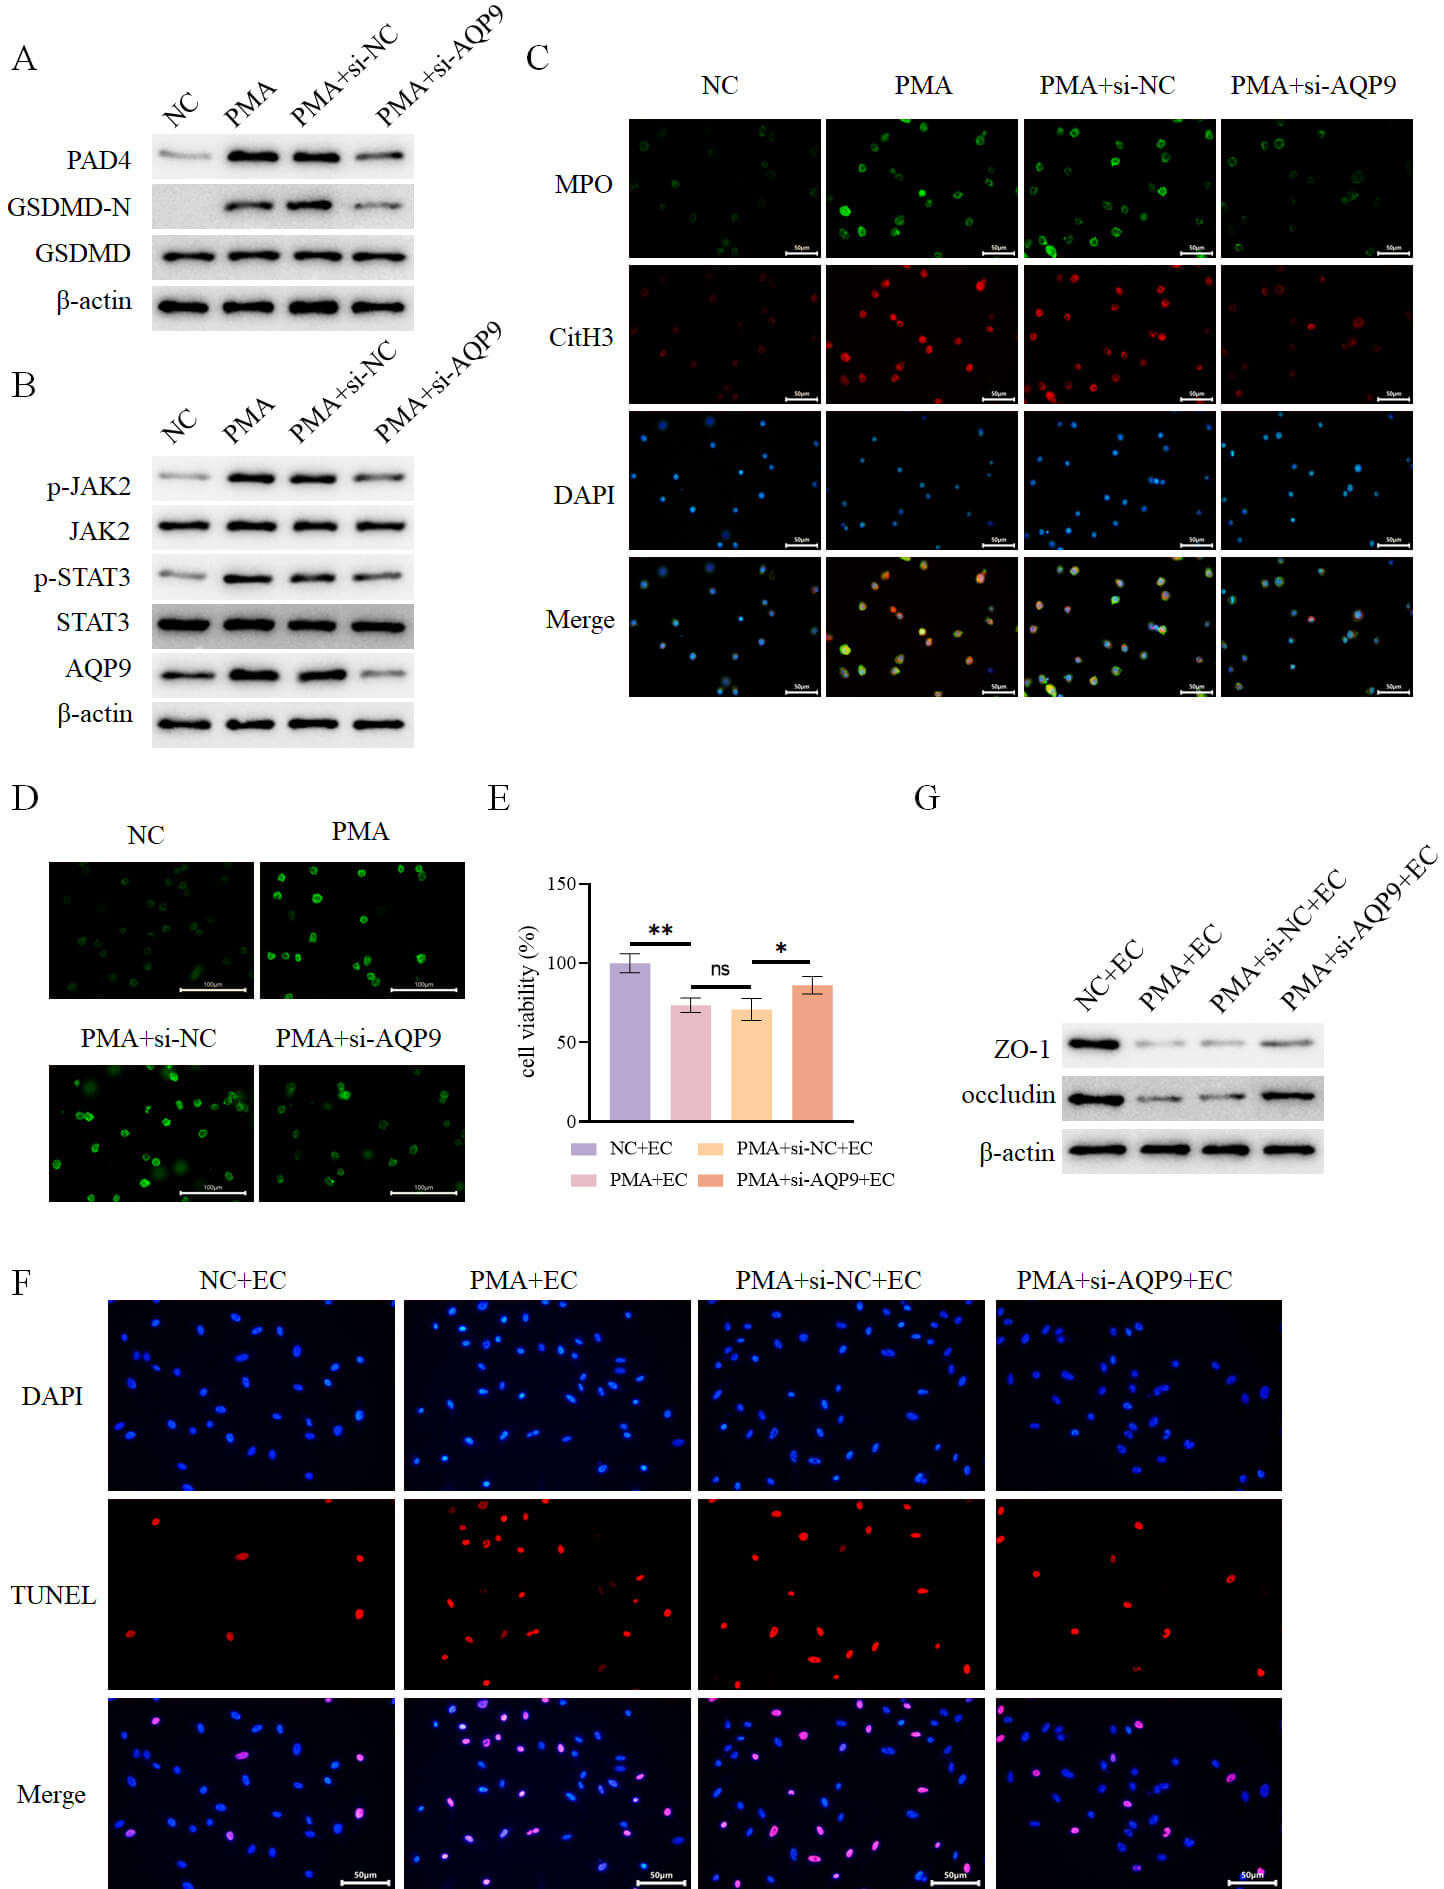
Neutrophils were treated with PMA in vitro to induce the formation of
NETs. PMA stimulation was revealed to promote the expression of NETs markers
peptidylarginine deiminase 4 (PAD4), CitH3, and MPO (Fig. 11A,C), the expression
of pyroptosis marker GSDMD-N (Fig. 11A), as well as the expression of p-JAK2 and
p-STAT3 (Fig. 11B). Additionally, PMA treatment upregulated AQP9 expression (Fig. 11B), elevated ROS levels (Fig. 11D), and increased IL-1
 Fig. 11.
AQP9 knockdown inhibits PMA-induced formation of NETs to
alleviate intestinal epithelial cell injury. (A) Detection of intracellular
expression of PAD4, GSDMD-N, and GSDMD in different groups by WB (n = 3). (B)
Detection of intracellular expression of AQP9 and JAK2-STAT3 pathway-related
proteins in different groups by WB (n = 3). (C) Assessment of intracellular
expression of MPO and CitH3 in different groups by immunofluorescence (n = 3,
scale bar = 50 µm). (D) Determination of intracellular ROS levels in
different groups using a fluorescent probe (n = 3, scale bar = 100 µm). (E)
Assessment of intestinal epithelial cell viability in each group after co-culture
with the aforementioned neutrophils using the CCK-8 assay (n = 3). (F) Evaluation
of intestinal epithelial cell death in each group by TUNEL assay (n = 3, scale
bar = 50 µm). (G) Determination of the expression of ZO-1 and occludin in
intestinal epithelial cells from each group by WB (n = 3). nsp
To further elucidate the interplay between AQP9, pyroptosis, and the formation
of NETs, neutrophils from the PMA+si-AQP9 group were treated with the pyroptosis
agonist Nigericin. Nigericin treatment did not alter AQP9 expression (Fig. 12A),
but significantly enhanced GSDMD-N expression (Fig. 12B), upregulated the
expression of NETs markers PAD4, MPO, and CitH3 (Fig. 12B,C), elevated ROS levels
(Fig. 12D), and increased the levels of IL-1
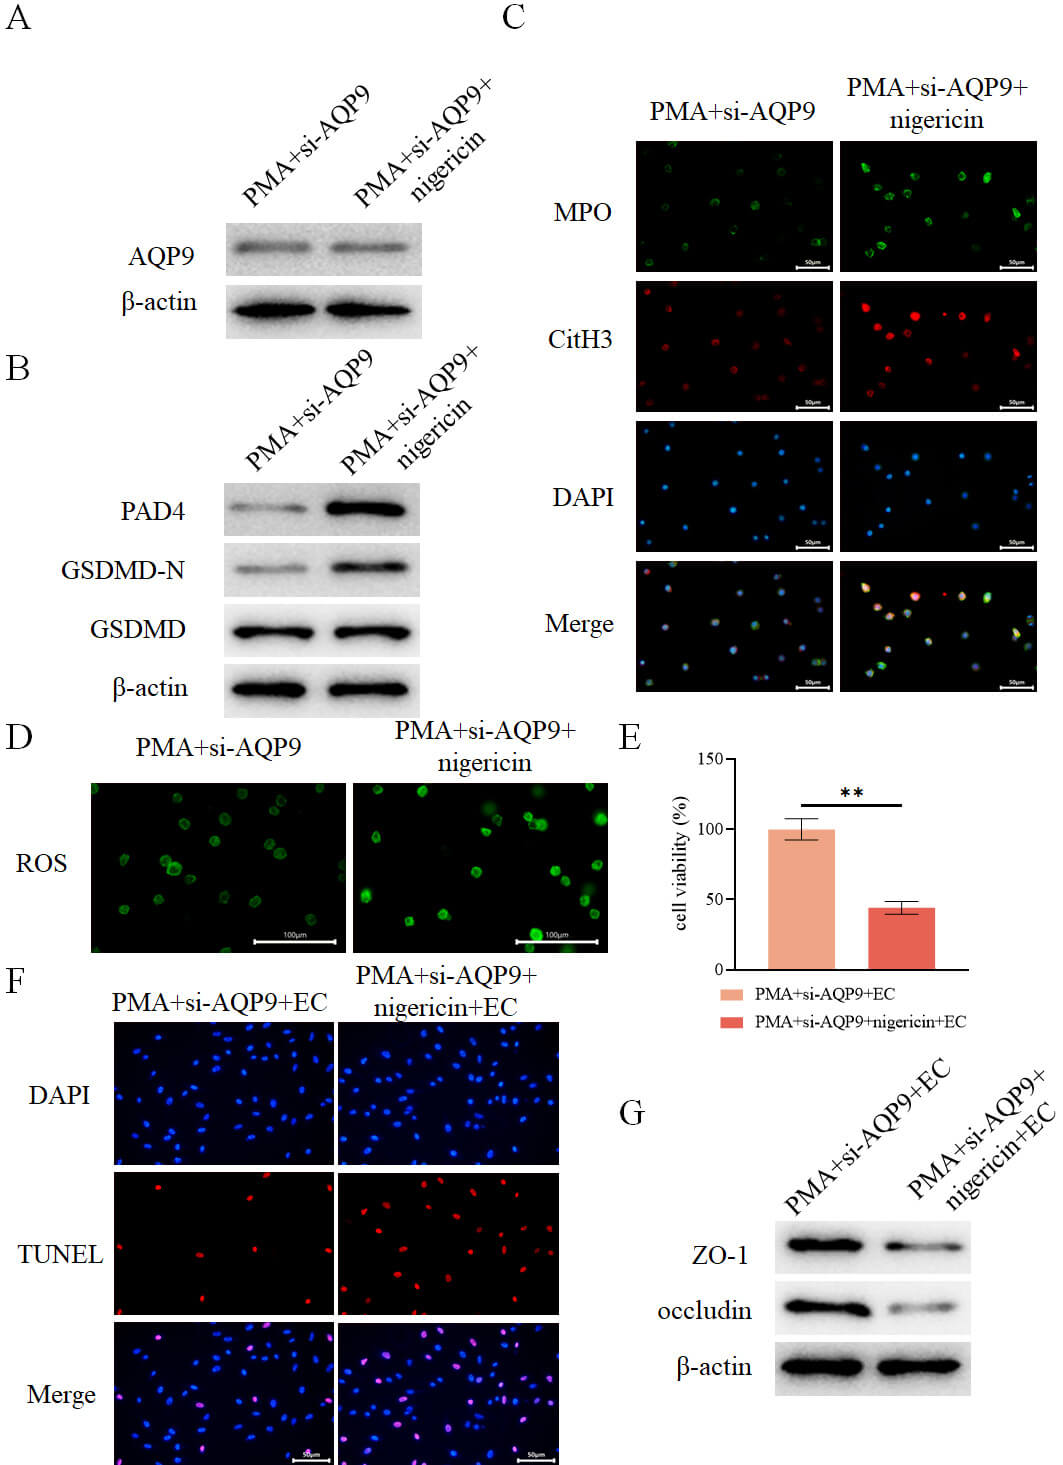 Fig. 12.
AQP9 knockdown inhibits pyroptosis-mediated formation of NETs
to alleviate intestinal epithelial cell injury. (A) Detection of intracellular
AQP9 expression in different groups by WB (n = 3). (B) Detection of intracellular
expression of PAD4, GSDMD-N, and GSDMD in different groups by WB (n = 3). (C)
Assessment of intracellular expression of MPO and CitH3 in different groups by
immunofluorescence (n = 3, scale bar = 50 µm). (D) Measurement of
intracellular levels of ROS in different groups using a fluorescent probe (n = 3,
scale bar = 100 µm). (E) Assessment of intestinal epithelial cell viability
in each group after co-culture with the aforementioned neutrophils using the
CCK-8 assay (n = 3). (F) Evaluation of intestinal epithelial cell death in each
group by TUNEL assay (n = 3, scale bar = 50 µm). (G) Determination of the
expression of ZO-1 and occludin in intestinal epithelial cells from each group by
WB (n = 3). **p
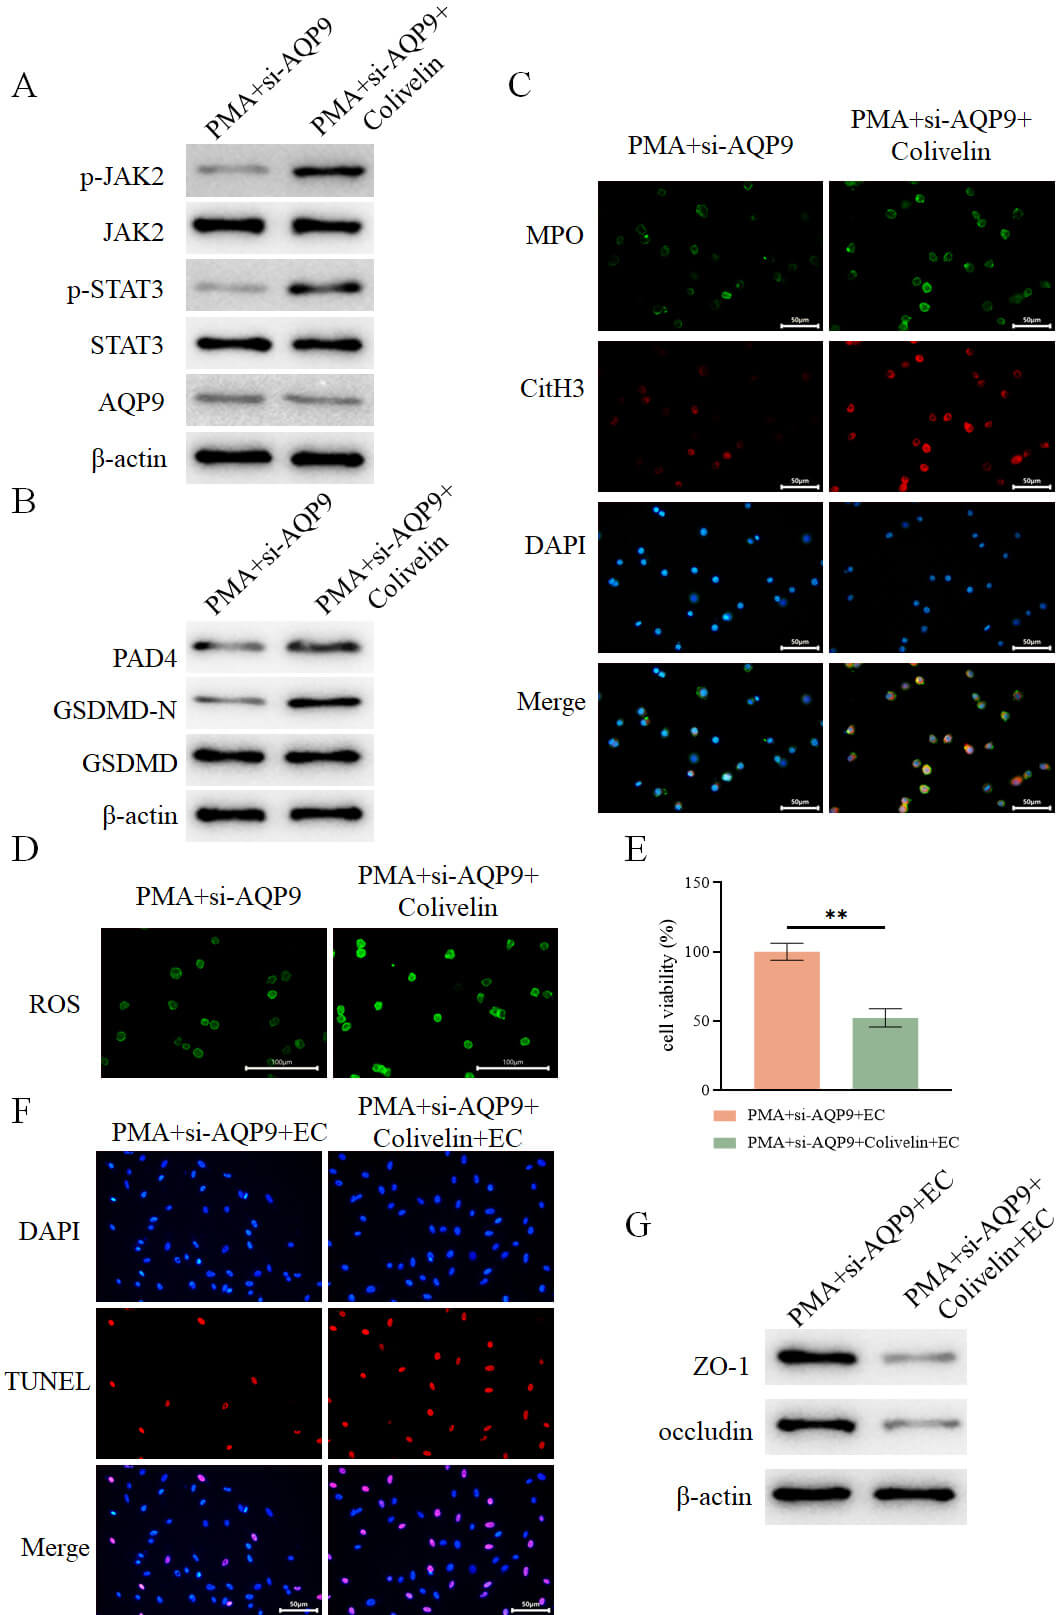
Based on the results from our previous experiments showing that AQP9 knockdown
suppresses the JAK2-STAT3 pathway (Fig. 11B), we hypothesized that AQP9 may
regulate pyroptosis via modulation of this pathway. To make further validation,
neutrophils from the PMA+si-AQP9 group were treated with the JAK2-STAT3 pathway
agonist Colivelin. It was revealed that treatment with Colivelin did not affect
AQP9 expression (Fig. 13A) but markedly enhanced the expression of JAK2, STAT3,
and GSDMD-N (Fig. 13A,B). Additionally, the levels of NET-associated proteins
PAD4, MPO, and CitH3 were upregulated (Fig. 13B,C), ROS levels were elevated
(Fig. 13D), and levels of IL-1
 Fig. 13.
AQP9 knockdown inhibits the JAK2-STAT3 pathway to regulate
pyroptosis-mediated formation of NETs to alleviate intestinal epithelial cell
injury. (A) Detection of intracellular expression of AQP9 and JAK2-STAT3
pathway-related proteins in different groups by WB (n = 3). (B) Detection of
intracellular expression of PAD4, GSDMD-N, and GSDMD in different groups by WB (n
= 3). (C) Assessment of intracellular expression of MPO and CitH3 in different
groups by immunofluorescence (n = 3, scale bar = 50 µm). (D) Measurement of
intracellular ROS levels in different groups using a fluorescent probe (n = 3,
scale bar = 100 µm). (E) Assessment of intestinal epithelial cell viability
in each group after co-culture with the aforementioned neutrophils using the
CCK-8 assay (n = 3). (F) Evaluation of intestinal epithelial cell death in each
group by TUNEL assay (n = 3, scale bar = 50 µm). (G) Determination of the
expression of ZO-1 and occludin in intestinal epithelial cells from each group by
WB (n = 3). **p
UC is clinically characterized by persistent or recurrent diarrhea, abdominal pain, and other systemic manifestations, posing considerable challenges for effective treatment [2]. The disease substantially reduces patients’ quality of life and has a significant impact on patients’ mental health [14]. In the present study, 516 DEGs were screened out from UC-related datasets. Functional enrichment analysis revealed that these DEGs were predominantly associated with immunoglobulin receptor binding, humoral immune responses, circulating immunoglobulin complexes, antigen binding, defense responses to bacterial pathogens, cytokine activity, and cytokine-cytokine receptor interactions. Aberrant immune responses involving the gut microbiota are widely recognized as central to the pathogenesis of IBD [15]. Previous study have demonstrated that the damage-related protein high mobility group box 1 protein (HMGB1) in intestinal epithelial cells can regulate autophagy through STAT3, thereby protecting the intestine from bacterial infection and damage [16]. Additionally, lactate has been reported to regulate macrophage polarization both in vitro and in vivo, inhibit the production of pro-inflammatory cytokines, and modulate the intestinal microbiota to attenuate DSS-induced colitis in murine models [17]. Moreover, the combination of ziyuglycoside II, syringin, and pedunculoside has been reported to suppress cytokine-cytokine receptor interaction pathways and maintain the integrity of the intestinal mucosal barrier, thereby influencing the progression of UC [18].
Pyroptosis is a known form of programmed cell death. Its inhibition has emerged as a promising therapeutic strategy to slow the progression of UC. Study have reported that engineered lactic acid-producing probiotic yeasts can inhibit macrophage pyroptosis, regulate gut microbiota composition, and mitigate mucosal damage in animal models. This intervention enhances the mucosal barrier and dampens intestinal immune responses, thereby effectively delaying disease progression [17]. In addition, salidroside has been shown to attenuate UC by inhibiting macrophage pyroptosis [19], while Shen-Ling-Bai-Zhu-San has shown the potential to improve DSS-induced colitis by suppressing caspase-1/caspase-11-mediated pyroptosis of colonic mucosal epithelial cells [20]. Based on these findings, our study aimed to identify key molecular factors associated with pyroptosis that may influence UC progression. Pyroptosis scores were calculated for each sample, revealing a significant difference between UC patients and healthy controls. Subsequently, WGCNA was performed on the identified DEGs to identify gene modules significantly correlated with pyroptosis and UC. To further screen core genes within the key modules, PPI network analysis and three distinct machine learning algorithms were employed, leading to the identification of five hub genes: AQP9, S100A8, S100A9, S100A12, and VNN2.
AQP9 is a water-selective membrane channel that has been documented in various diseases, including hepatitis [21], clear cell renal cell carcinoma [22], lung cancer [23], and acute myelogenous leukemia [24]. In colon cancer, AQP9 participates in lactate transport within tumor-associated macrophages and influences macrophage polarization [25]. Moreover, AQP9 functions as an immune-related prognostic biomarker, regulating the migration, proliferation, and invasion of laryngeal cancer cells [26] and hepatocellular carcinoma cells [27]. Based on single-cell transcriptomic analysis and immunofluorescence validation, it is hypothesized that AQP9 may play a regulatory role in neutrophils in the context of UC. Notably, study addressing the interplay between neutrophils and pyroptosis in UC remain limited. Therefore, the present study sought to further investigate the role of AQP9 in modulating UC progression via neutrophil-mediated mechanisms.
GSEA revealed that AQP9 may regulate the JAK-STAT pathway, a pathway crucial for various important biological processes. As reported, the JAK-STAT pathway plays a pivotal role in the pathogenesis of various diseases. JAK inhibitors have been approved for the treatment of multiple autoimmune conditions, including UC [28], rheumatoid arthritis, psoriasis, and atopic dermatitis [29]. Notably, a polypeptide (Moringa oleifera Lam. Peptide) isolated from oil sunflower seeds was demonstrated to reshape the intestinal mucosal barrier by inhibiting activation of the JAK-STAT pathway and regulating the gut microbiota, thereby improving UC [30]. Similarly, preclinical study demonstrated that Sishen Pill, a classical Chinese medicinal formulation, exerts therapeutic effects on UC. Its mechanism involves restoring immune homeostasis mediated by memory follicular T cells and memory T cells through suppression of the JAK/STAT pathway [31]. In Drosophila, ursolic acid was found to attenuate SDS-induced intestinal injury via inhibition of the JNK/JAK/STAT pathway, thereby exerting protective effects against UC [32]. In the present study, silencing AQP9 inhibited activation of the JAK2-STAT3 pathway, thereby suppressing neutrophil pyroptosis and the formation of NETs. Consistently, in models of acute kidney injury, dimethyl fumarate was shown to mitigate pyroptosis in HK-2 renal epithelial cells through inhibition of the JAK2-STAT3 signaling axis [13]. Moreover, guanylate binding protein 5 (GBP5) induces classical pyroptosis in ovarian cancer cells via the JAK2/STAT1 pathway, thereby inhibiting tumor progression [33]. While existing studies have demonstrated that NETs can target the secretion of pro-inflammatory cytokines through the JAK/STAT pathway, the regulation of NETs by the JAK/STAT pathway remains unexplored. To clarify that the JAK2-STAT3 pathway can regulate pyroptosis of neutrophils, we treated neutrophils from the PMA+si-AQP9 group with JAK2-STAT3 pathway agonists and observed enhanced pyroptosis of neutrophils and the formation of NETs.
Kanako Watanabe-Kusunoki et al. [34] reported that GSDMD regulates neutrophil maturation and subsequent necrosis, and that the formation of NETs is reduced in GSDMD-/- mice in the context of thrombotic microangiopathy. Likewise, Huang et al. [35] demonstrated that ficolin-A aggravates the formation of NETs through GSDMD in LPS-mediated lung injury. Furthermore, Weijie Chen et al. [36] showed in zebrafish that Edwardsiella piscicida induces the formation of NETs by regulating pyroptosis-related proteins caspase-B and GSDMEb. Collectively, the foregoing findings suggest a potential link between neutrophil pyroptosis and NET formation. To validate this hypothesis, neutrophils from the PMA+si-AQP9 group were treated with a pyroptosis agonist, which significantly enhanced NET formation. Our results indicate that AQP9 knockdown inhibits JAK2-STAT3-mediated pyroptosis and subsequently suppresses NET formation. Furthermore, co-culture experiments with treated neutrophils and intestinal epithelial cells revealed that silencing AQP9 attenuates epithelial cell injury by inhibiting JAK2-STAT3-mediated pyroptosis and NET formation, highlighting a potential therapeutic strategy for preserving intestinal barrier function in UC.
In this study, AQP9 was identified through bioinformatics analysis as a key gene related to neutrophil pyroptosis and the progression of UC. Subsequent animal and cell experiments confirmed that AQP9 knockdown inhibits pyroptosis mediated by the JAK2-STAT3 pathway to suppress the formation of NETs, thereby alleviating intestinal epithelial cell injury. According to our findings, AQP9 can function as a potential target for regulating the formation of NETs, which offer novel insights into the mechanisms underlying the progression of UC. Nevertheless, certain limitations remain. While this study provides preliminary evidence that AQP9 may act as an upstream regulator of the JAK2-STAT3 pathway to modulate neutrophil pyroptosis and NET formation, the precise molecular mechanisms by which AQP9 regulates this pathway remain to be elucidated. Additionally, although we primarily investigated the role of AQP9 knockdown in NET formation, future studies involving AQP9 overexpression are necessary to conclusively establish its regulatory role in the JAK2-STAT3 pathway. Furthermore, the other four genes identified through bioinformatics analysis, S100A8, S100A9, S100A12, and VNN2, have not yet been experimentally investigated in the context of UC. Future studies should focus on elucidating their regulatory roles and underlying mechanisms in the pathogenesis of UC.
UC, ulcerative colitis; NETs, neutrophil extracellular traps; IBD, inflammatory bowel disease; ROS, reactive oxygen species; GEO, gene expression omnibus; DEGs, differentially expressed genes; GSVA, gene set variation analysis; KEGG, kyoto encyclopedia of genes and genomes; GO, gene ontology; PPI, protein-protein interaction; ssGSEA, single-sample gene set enrichment analysis; HE, hematoxylin-eosin; CST, cell signaling technology; GO-BP, biological process; GO-CC, cellular component; GO-MF, molecular function; TOM, topological overlap matrix; GS, gene significance; MM, module membership; CMPs, common myeloid progenitors; DSS, dextran sulfate sodium salt; PMA, phorbol 12-myristate 13-acetate; AQP9, aquaporin 9; PAD4, peptidylarginine deiminase 4; ZO-1, zonula occludens 1; ELISA, enzyme-linked immunosorbent assay; CCK-8, cell counting kit-8; TUNEL, terminal deoxynucleotidyl transferase dUTP nick end labeling; SVM-RFE, support vector machine-recursive feature elimination; MPO, myeloperoxidase; CitH3, citrullinated histone H3; GSDMD-N, cleaved N-terminal gasdermin D; IL, interleukin; GAPDH, glyceraldehyde-3-phosphate dehydrogenase; RMSE, root mean square error; SVM, support vector machine; Ly6G, lymphocyte antigen 6 complex locus G6D; HMGB1, high mobility group box 1 protein; GBP5, guanylate binding protein 5.
The datasets used and analysed during the current study are available from the corresponding author on reasonable request.
ZW and YS originated the research conception, designed the study, performed formal analysis, and prepared the first draft of the manuscript. XZ and JS performed the experiments, analyzed the data, and prepared the figures and tables. LS provided both methodological and administrative support and was a major contributor in reviewing and editing the manuscript. All authors contributed to editorial changes in the manuscript. All authors read and approved the final manuscript. All authors have participated sufficiently in the work and agreed to be accountable for all aspects of the work.
The animal experiment was approved by the Ethics Committee of Laboratory Animal Management and Welfare of the First Affiliated Hospital of Harbin Medical University (Approval No.: IACUC-2023053), and conducted following the ARRIVE guidelines.
Not applicable.
This work was supported by the Open Fund of Key Laboratory of Hepatoaplenic Surgery, Ministry of Education, Harbin, China (Grant No. GPKF202309).
The authors declare no conflict of interest.
Supplementary material associated with this article can be found, in the online version, at https://doi.org/10.31083/FBL46505.
References
Publisher’s Note: IMR Press stays neutral with regard to jurisdictional claims in published maps and institutional affiliations.