


 , Chunxi Long 1,*
1 Department of Neurosurgery Children’s Hospital of Chongqing Medical University, National Clinical Research Center for Children and Adolescents’ Health and Diseases, Ministry of Education Key Laboratory of Child Development and Disorders, Chongqing Municipal Health Commission Key Laboratory of Children’s Vital Organ Development and Diseases, Chongqing Key Laboratory of Child Neurodevelopment and Cognitive Disorders, Intelligent Application of Big Data in Pediatrics Engineering Research Center of Chongqing Education Commission of China, 401122 Chongqing, China
Abstract
High-risk neuroblastoma (NB) remains a therapeutic challenge with a poor prognosis, necessitating the identification of novel prognostic biomarkers and effective therapeutics.
We analyzed transcriptomic datasets from public repositories using weighted gene co-expression network analysis to identify gene modules associated with prognosis. Consensus clustering stratified patients into distinct subgroups. Differential expression analysis, integrated with 80 machine learning algorithm combinations, prioritized hub genes to construct a risk-scoring model, which was implemented via an online platform. We then screened the new drug eugenol using the proximity algorithm and explored its feasibility through in vitro trials.
Consensus clustering based on prognosis-associated modules revealed two patient subgroups with significantly different survival differences (p < 0.001). A set of six hub genes (chromosome 21 open reading frame 58 (C21orf58), cannabinoid receptor 1 (CNR1), laminin alpha 4 (LAMA4), leptin receptor (LEPR), solute carrier family 25 member 10 (SLC25A10), and telomerase reverse transcriptase (TERT)) was identified and used to build a risk-scoring model, accessible at online platform. Leveraging this model, we identified eugenol as a potential therapeutic candidate. Transcriptome analysis showed that eugenol selectively targeted high-risk NB cell populations predicted by the model. Preliminary in vitro experiments investigating its mechanism of action indicated that eugenol primarily functions by inhibiting the MYC-cyclin D1 (CCND1) axis.
This study establishes an integrated precision medicine framework for NB, identifying a new high-risk group and suggesting eugenol as a promising therapeutic candidate for this group, potentially acting through MYC-CCND1 axis suppression.
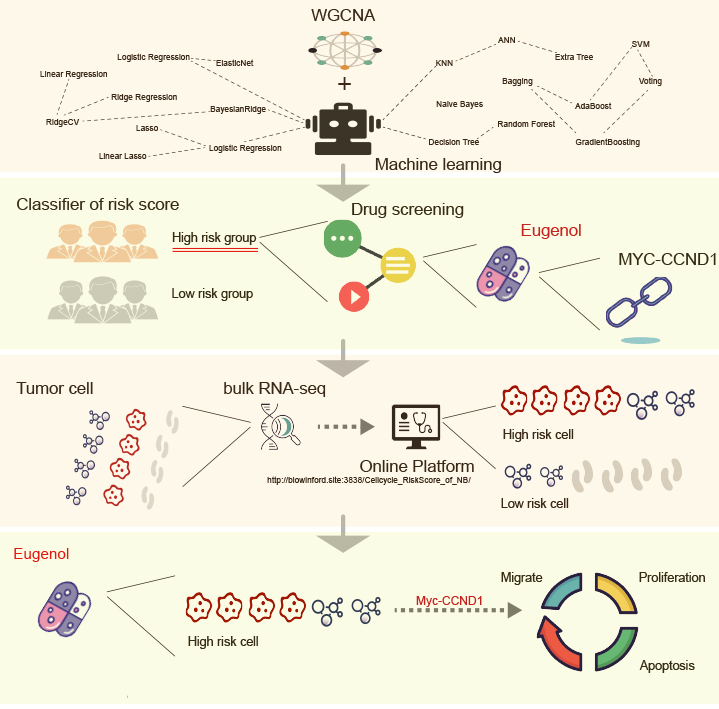
Graphical Abstract
Keywords
- neuroblastoma
- transcriptome
- machine learning
- eugenol
Neuroblastoma (NB) represents a formidable challenge in pediatric oncology, with high-risk (HR) patients exhibiting 5-year survival rates persistently below 50% despite decades of therapeutic intensification [1, 2, 3]. Current risk stratification systems—relying on clinical variables (age, stage) and limited molecular markers (MYCN oncogene [MYC NB] amplification, 11q deletion)—fail to address the profound genetic heterogeneity inherent to this malignancy [4, 5, 6]. Over 40% of HR-NB cases lack actionable prognostic biomarkers, while static diagnostic biopsies cannot capture dynamic resistance mechanisms evolving during treatment [7, 8]. Critically, no existing framework bridges molecular risk assessment to mechanism-based therapeutic discovery [9]. Transcriptomic signatures have emerged as promising tools for resolving disease complexity: mesenchymal/adrenergic classifications identify chemo-resistant subpopulations [10], and weighted gene co-expression network analysis (WGCNA) modules demonstrate robust prognostic value (area under the curve [AUC] = 0.82) [11]. However, these advances remain confined to specialized bioinformatics environments, inaccessible to most clinicians and disconnected from drug development pipelines. This translational gap necessitates an integrated platform that translates transcriptomic data into clinically operable risk scores—precisely the void our study aims to fill.
The evolution of computational methods now enables such prognostic innovations.
WGCNA provides a powerful foundation by capturing functional gene modules
reflective of biological pathways, thereby surpassing single-gene approaches
[12]. In NB studies, researchers such as Pan et al. [13] have leveraged
this technique to create a model predicting relapse (hazard ratio = 3.1,
p
Here, we established a novel risk quantification framework to drive precision medicine in NB. Our approach is anchored in three hypotheses. First, cross-algorithm consensus will yield HR-NB biomarkers resistant to dataset artifacts. Second, web-based implementation can democratize genomic risk assessment. Third, molecularly defined HR subpopulations hold the key to targeted drug discovery. To validate this paradigm, we engineered an open-access platform that calculates patient-specific risk scores using six ML-validated genes (chromosome 21 open reading frame 58 [C21orf58], cannabinoid receptor 1 [CNR1], laminin alpha 4 [LAMA4], leptin receptor [LEPR], solute carrier family 25 member 10 [SLC25A10], telomerase reverse transcriptase [TERT]), stratifying patients into molecularly discrete high- and low-risk groups. Critically, the platform performs solely as a risk stratification tool—it possesses no inherent drug screening capabilities. Instead, its rigorous identification of HR-NB patients enabled subsequent independent investigations into their transcriptomic vulnerabilities. Through offline analysis of these platform-defined high-risk signatures using the proximity, we identified eugenol as a compound capable of reversing pathological transcriptional patterns. This distinction is fundamental: our technology terminates at risk quantification, with drug discovery occurring through subsequent pharmacological interrogation of platform-identified subpopulations.
Methodological transparency underscores our findings’ validity. We harmonized
three NB cohorts via Combat batch correction prior to WGCNA module detection.
Ensemble ML ranked genes through 80 algorithm combinations: regularized Cox
regression enforced feature sparsity, survival Support Vector Machines (SVMs)
captured nonlinear effects, Random Forests (RFs) modelled variable interactions,
and boosting algorithms iteratively corrected prediction errors. Meta-learning
integrated these rankings using a consensus formula: consensus score, weighted by
cross-validated algorithm performance. Implemented via an R/Shiny interface with
encrypted data transmission, the platform calculates risk scores through
Risk Score = (0.035108026)
Validation of eugenol followed strict boundaries: cellular assays focused exclusively on platform-classified HR cell lines, demonstrating selective cytotoxicity. Mechanistic analyses were restricted to evaluating the modulation of the MYC-cyclin D1 (CCND1) axis; RNA sequencing (RNA-seq) provided evidence of a comprehensive reversal of the disease-associated transcriptome.
Our work introduces three transformative advances. First, we provide the first clinically deployable web tool for NB risk quantification, thereby overcoming the computational accessibility issues that hampered previous models. Consensus ML eliminated many cohort-specific bias genes, enabling cross-dataset portability. Second, the upstream and downstream regulatory relationship between MYC and CCND1 has been confirmed in NB, especially in HR-NB determined by our platform. Third, by leveraging this precise patient stratification, eugenol was identified as an HR-selective agent—a discovery mechanically anchored to the platform’s stratification rigor yet methodologically independent of its computational function. Limitations include the need for prospective clinical validation and adaptation to single-cell assays, but our framework establishes a paradigm for condition-specific therapeutic discovery. Ultimately, this study demonstrated how democratized risk quantification platforms can catalyze precision oncology—not through direct drug screening, but by illuminating therapeutic vulnerabilities in molecularly defined patient subsets.
Sequencing of bulk RNA data and corresponding clinical information of patients with NB were obtained from Therapeutically Applicable Research to Generate Effective Treatments (TARGET, n = 159), Gene Expression Omnibus (GSE4971, n = 498), and Array Express (AE) E-MTAB-8248 (AE, n = 223).
Based on the results of single gene analysis in the GSE49710 dataset, we
performed WGCNA to identify a set of genes associated with poor prognosis in the
pathway. Initially, we computed the median absolute deviation (MAD) for each gene
using the gene expression profile and excluded the bottom 50% of the genes with
the smallest MAD. We also eliminated the sample and gene outliers to construct a
scale-free co-expression network. Next, we merged modules with distances below
0.25 and generated scatter plots of module gene significance (GS) versus module
membership (MM) for genes in the modules strongly linked to poor prognosis. We
applied strict filters of GS
To further investigate the impact of CCG expression patterns on patients with NB, we conducted consensus clustering using the TARGET and GSE49710 databases. The k-means algorithm was used to identify distinct cell cycle-related expression patterns. The “ConsensusClusterPlus” R package was utilized to construct consistent clusters quantitatively, and we performed 1000 iterations to enhance the stability of these groups. Subsequently, we performed gene set variation analysis (GSVA) using the Kyoto Encyclopaedia of Genes and Genome (KEGG) gene set (c2.cp.kegg. v7.4) to examine differences in biological functions across the different subgroups. Furthermore, we examined the association between genomic expression and clinical variables across clusters.
To develop an accurate prognostic model for predicting survival outcome in NB
based on the cell cycle, differential analysis was conducted using the Lima
2.13.0 (Pacific Biosciences, Menlo Park, California, USA) on the two subgroups of the TARGET database.
Differential genes were identified based on
We excluded non-coding RNAs and subjected the final gene set to Multivariate Cox regression analysis. This approach allowed us to develop a prognostic model to calculate risk scores. However, due to the small sample size of the TARGET database, we validated our model using two external databases (AE and GSE49710). Then we used two R packages (TimeROC 0.4 (Paul Blanche, Copenhagen, Denmark) and SurvivalROC 1.0.3.1 (Patrick J. Healing, Seattle, Washington, USA)) to construct receiver operating characteristic (ROC) curves and calculate the AUC.
To facilitate the implementation of risk scores in clinical practice, we integrated these scores with four relevant clinical variables from TARGET: age at diagnosis, International NB staging system (INSS), Children’s Oncology Group (COG) risk classification system, and MYCN gene amplification status. Then we plotted a nomogram to predict the overall survival of patients with NB. We used the “rms” R package to generate line plots displaying the predicted survival probability at 1, 3, and 5 years. Additionally, we conducted a calibration curve and decision curve analysis to assess the performance, clinical usefulness, and external validity of the nomogram. Using clinical information from TARGET, GSE49710, and AE, we compared the value of risk scores to other clinical variables.
We built a web calculator based on the risk model using Shiny Server (“Shiny” package in R version 1.8.0). The risk score was calculated based on the expression values of the six signature genes and compared to the cutoff to assign a query sample to either a high- or low-risk group. Based on all the sample information from the above three public databases, we plotted survival curves on a web page for reference.
The proximity algorithm is based on the target gene database of the extracted drug and the hub gene of NB to perform omics correlation analysis on these two types of genes. In the human genome interaction network, the average shortest path of each drug target and disease-related gene recorded in the database is calculated. If the target gene of the drug is closer to the disease-related gene, it means that the drug plays a certain role in the treatment of the disease. The distance between the drug and the disease-related genes is called proximity, which is converted to a z-score. After 1000 random perturbations, the significant p value of each drug can be obtained to screen out the targeted drugs [18, 19, 20, 21].
Transcriptome sequencing analysis was performed on 12 samples using the following workflow: total RNA extraction, mRNA enrichment, double-stranded cDNA synthesis, end repair, A-addition, adapter ligation, fragment selection, PCR amplification (MiniAmp, Thermo Fisher, Waltham, Massachusetts, USA), library detection, and Illumina sequencing. This process generated a total of 132.86 Gb of clean data, with each sample contributing at least 12 Gb of clean data and a Q30 base percentage of 95% or higher.
SK-N-SH, SK-N-BE2, and SH-SY5Y cells were purchased from Wuhan Pricella Biotechnology Co., Ltd. (Wuhan, China). They were supplemented with 10% (v/v) fetal bovine serum (FBS; Hy Clone, Logan, UT, USA) and stored in a 37 °C humidified environment containing 5% CO2. The c-Myc (#10828-1-AP, Dilution ratio 1:1000), GAPDH (#10494-1-AP, Dilution ratio 1:1000), cyclin-dependent kinase 2 (CDK2) (#10122-1-AP, Dilution ratio 1:2000), cyclin E1 (CCNE1; #11554-1-AP, Dilution ratio 1:500), and Tubulin (#14555-1-AP, Dilution ratio 1:1000) antibodies were purchased from Protein tech (Wuhan, China). CDK4 (#sc-56277, Dilution ratio 1:1000) and CDK6 (#sc-53638, Dilution ratio 1:1000) antibodies were purchased from Santa Cruz (Dallas, TX, USA). The CCND1 (#A19038, Dilution ratio 1:2000) antibodies were purchased from ABclone (Wuhan, China). The cycle detection kit (#C1052), Edu detection kit (#C0078S), and gentian violet (#C0121) were purchased from Beyotime Biotechnology (Shanghai, China). Dimethyl sulfoxide (DMSO; #D2650) was purchased from Sigma-Aldrich (St. Louis, MO, USA). The apoptosis detection kit (#40302ES60) was purchased from Yeasen (Shanghai, China), and eugenol (#HY-N0337) was purchased from MedChemExpress (Shanghai, China). Eugenol was dissolved in DMSO to generate a 10 mM stock solution. The samples were stored at –80 °C for in vitro studies. Mycoplasma testing using Wuhan Procell’s Mycoplasma Detection Kit yielded negative results for all cell lines (no mycoplasma contamination). This study adhered to the principles of the Helsinki Declaration and was approved by the Ethics Committee of Children’s Hospital Affiliated to Chongqing Medical University (No. 2024312). All cell lines underwent short tandem repeat (STR) analysis for identification shortly before use, with the analysis performed by the analytical testing center of Wuhan Pricella Biotechnology Co., Ltd.
The proliferation rate of NB cells was detected using Cell Counting Kit-8 (CCK-8) assays. To assess the cell viability, we cultured 5000 cells/well in a 96-well plate for 48 h. The viability of SK-N-BE2 cells—which grew as both semi-adherent and semi-suspended cultures—was measured every 12 h using a CCK-8 kit (#SB-CCK8-100 mL; Share-Bio, Shanghai, China) every 12 h.
The cells and tissues were lysed with RIPA and PMSF (Product Code: P0013 and ST507, Beyotime Biotechnology, shanghai, China). The proteins were separated by 8–12% sodium dodecyl sulfate polyacrylamide gel electrophoresis and transferred to PVDF membranes. After being blocked in 5% BSA (Product Code: ST023, Beyotime Biotechnology, shanghai, China), the membranes were incubated with primary antibodies overnight at 4 °C, followed by incubation with horseradish peroxidase-conjugated secondary antibodies for 1 h at room temperature. The VIBER FUSION FX6 EDGE imaging system (Product Code: FX6 EDGE, Paris, France) was used to expose the membranes.
The DNA synthesis ability of NB cells was evaluated using the
BeyoClick™ Edu Cell Proliferation Kit with Alexa Fluor 488
(#C0071S; Beyotime), according to the manufacturer’s instructions. Notably, we
digested and collected all SK-N-BE2 cells before conducting the Edu assays due to
the suspended growth of some SK-N-BE2 cells. After Edu staining, cells were
visualized via a fluorescence microscope (Ti2-E PFS, Nikon, Japan), and the
percentage of Edu-positive cells was calculated as the number of Edu-positive
cells out of the total number of cells (100
Trans well chambers were used to detect cell migration. Cells (4
For cell cycle detection, the indicated cells were harvested and fixed in 75% ethanol at 4 °C for 24 h. The cell lysate was washed with phosphate-buffered saline, stained with RNase A and propidium iodide (#C1052; Beyotime) at 4 °C for 30 min, and then analyzed using the CytoFLEX flow cytometer (Beckman Coulter, Brea, CA, USA). For the detection of cell apoptosis, the indicated cells were harvested and resuspended in binding buffer, followed by Annexin-V-FITC and PI staining with an Annexin-V-FITC/PI Apoptosis Detection Kit (#40302ES60; Yeasen).
Statistical analyses were conducted for discrete variables using SPSS software
(version 25.0; IBM Co., Armonk, NY, USA) and R software (version 4.1.2) and
related packages for data processing, analysis, presentation, and
p-value calculations. Statistical significance was defined as p
Based on the public dataset GSE49710 and its association with adverse clinical outcomes (INSS stage 4, COG high-risk group, patient mortality, and MYCN amplification), we performed WGCNA. This identified two gene modules significantly correlated with poor prognosis in patients with NB (Fig. 1A,B). Given our group’s prior focus on cell cycle-related genes (Fig. 1C), we intersected genes from these four WGCNA modules with a predefined cell cycle gene set, yielding hub genes (Fig. 1D). Expression analysis revealed that these hub genes were consistently upregulated in deceased patients (Fig. 1E), suggesting their strong association with adverse clinical outcomes.
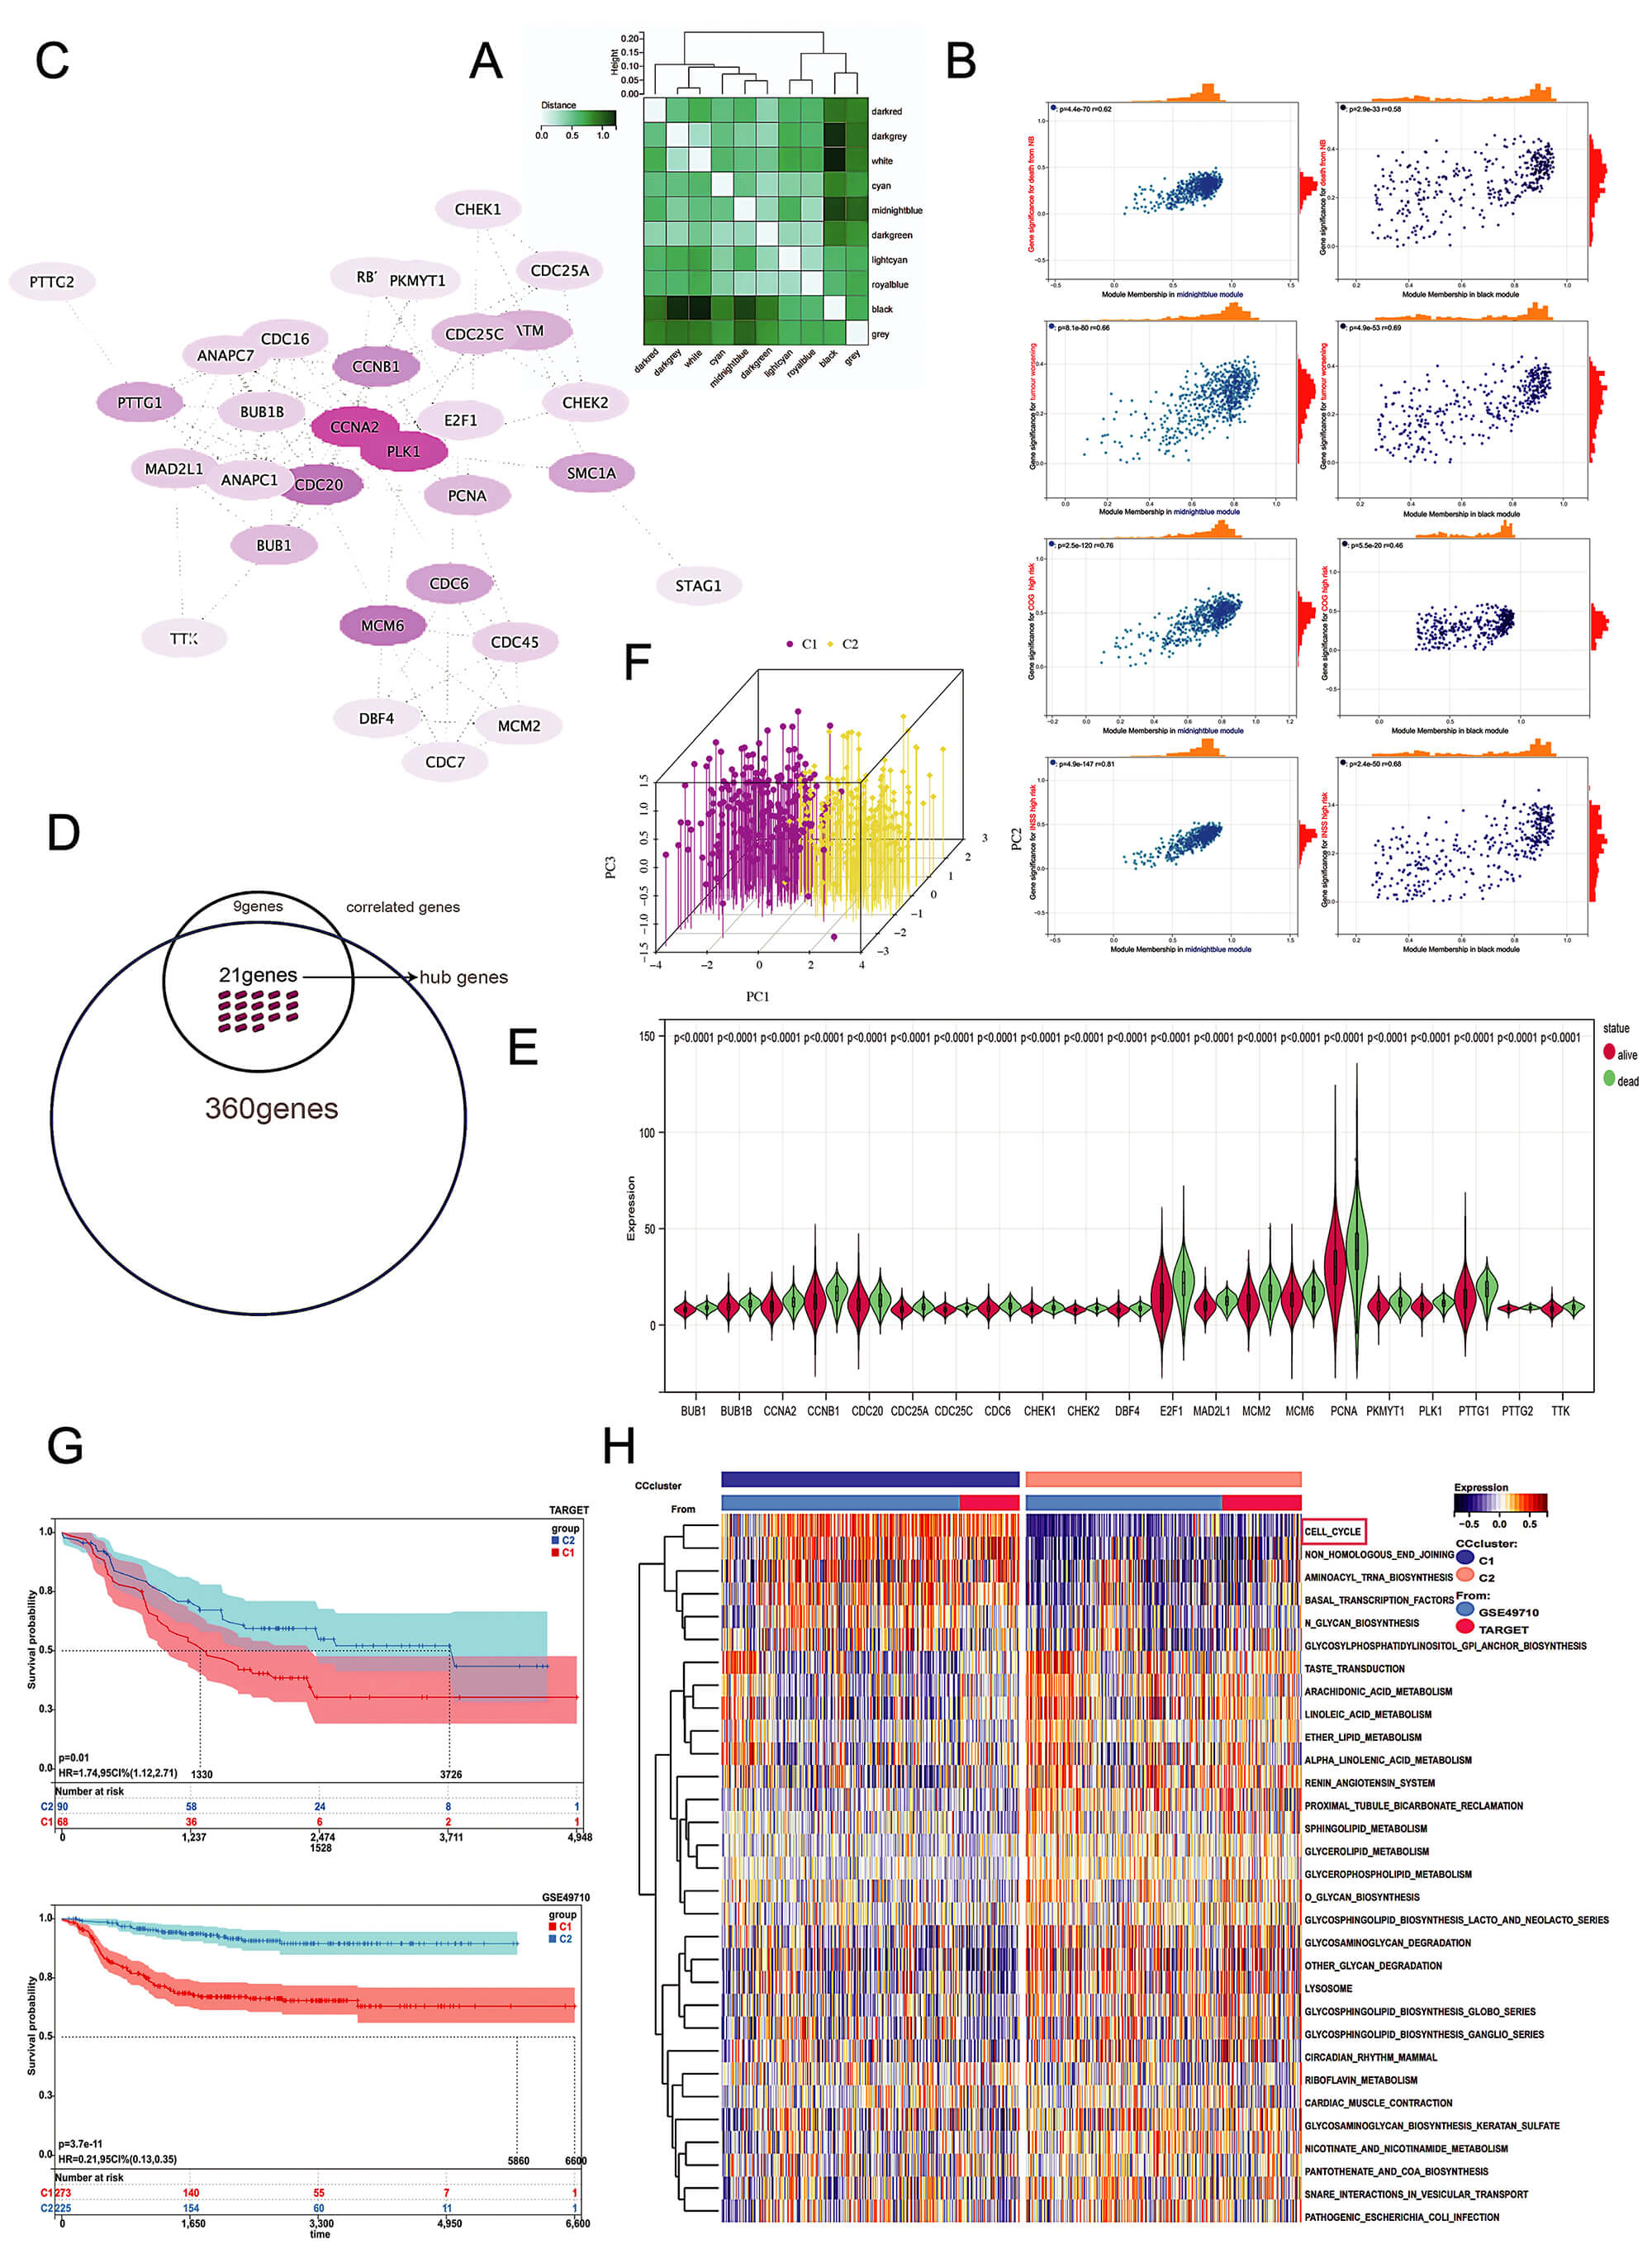 Fig. 1.
Groups. (A) After the division of WGCNA into different modules, the similarity between individual modules was visually represented by color intensity: a darker color indicates greater similarity between the two modules. (B) The midnight blue and black modules contain genes corresponding to adverse clinical prognostic outcomes. There are eight groups of genes, for a total of 360. (C) The set of 30 genes identified earlier, which we call “correlated genes”, has been mapped into a protein–protein interaction network. In this network visualization, the BC value determines the color intensity: a darker color indicates a higher BC value, placing the corresponding protein closer to the network’s core. (D) A Venn diagram analysis was used to identify 21 hub genes, defined as those genes present in the intersection of all 8 gene groups and their correlated counterparts. (E) All samples in GSE49710 and TARGET, based on two final clinical outcomes (survival and death) were divided into two groups, and hub genes showed differential expression in both groups. (F) All samples in GSE49710 and TARGET were divided into two non-overlapping categories based on hub genes, C1 and C2 groups. (G) KM survival analysis comparing the C1 and C2 groups within the GSE49710 and TARGET datasets, respectively. (H) The GSVA results of the C1 and C2 groups. WGCNA, weighted gene co-expression network analysis; BC, Betweenness Centrality; TARGET, Therapeutically Applicable Research to Generate Effective Treatments; KM, Kaplan-Meier; GSVA, gene set variation analysis.
Using consensus clustering based on hub genes, we stratified all patients from
the GSE49710 and TARGET datasets into two distinct subtypes (Fig. 1F).
Kaplan-Meier (KM) survival curves demonstrated significantly divergent survival
probabilities between these subtypes (p
To construct a more precise prognostic model, we applied univariate Cox regression analysis to identify 131 differential genes (Supplementary Table 1). These genes were further analyzed using linear and tree models, ultimately resulting in the selection of 24 genes (Supplementary Table 2). Subsequent LASSO regression refined these to 14 genes (AC015818.5, AC090505.2, AC123912.4, C21orf58, CNR1, fatty acid hydroxylase domain containing 2, H2A histone family member X, LAMA4, LEPR, meiotic double-stranded break formation protein 4, retrotransposon-like protein 1, SLC25A10, TERT, Z82196.1), with the “3+X” method proving optimal for feature selection (Fig. 2A). The final coding RNA-based risk score formula was as follows (Fig. 2B,C):
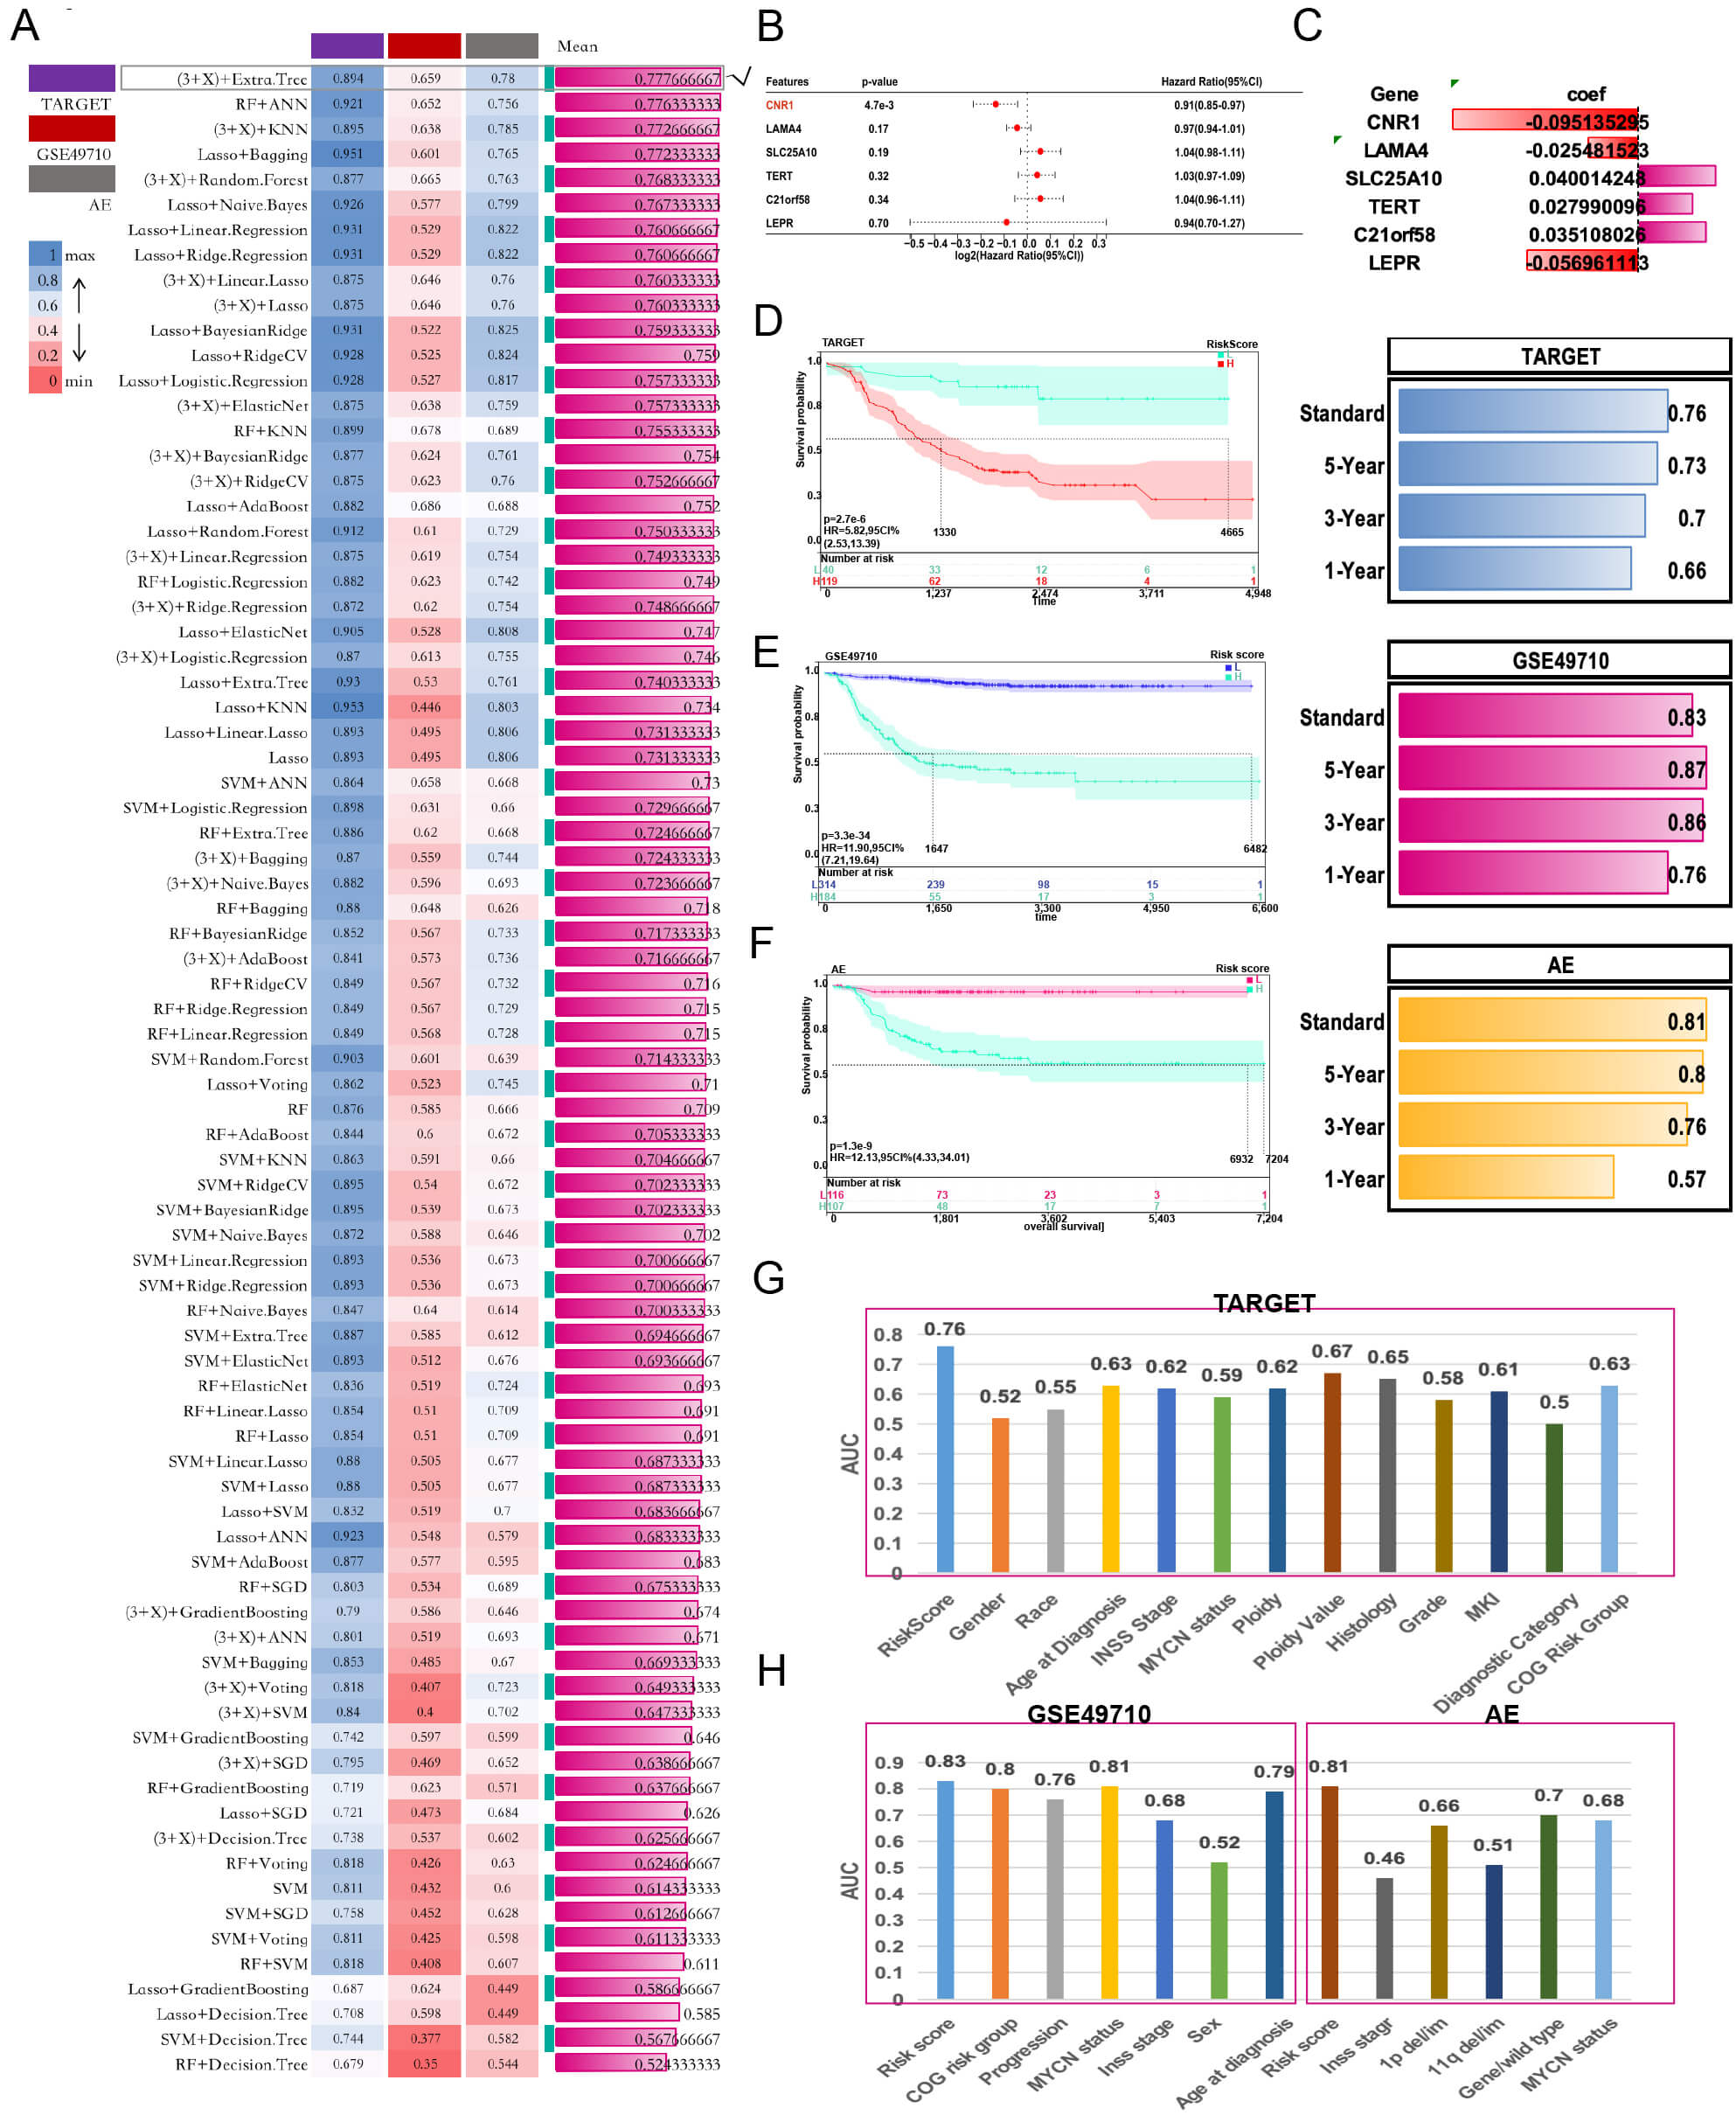 Fig. 2.
Construction of a prognostic model. (A) Eighty ML algorithms were combined to screen for characteristic genes. (B,C) Multicox forest plot and calculated coefficients for the characteristic genes. (D–F) KM curves of the training cohort and validation cohort and the AUC values. (G,H) Performance of the risk score was compared to other clinical and molecular variables in three cohorts. ML, Machine learning; AUC, area under the curve.
Risk score =
(0.035108026)
+ (–0.056961113)
In both the training (TARGET) and validation cohorts (GSE49710, AE), KM curves
showed significantly longer survival in low-risk versus high-risk groups
(p
Using a threshold of –0.81, we stratified patients into low-risk and high-risk groups. An online calculator was developed for clinical application (http://biowinford.site:3838/Cellcycle_RiskScore_of_NB/).
For example, inputting expression values (0.035, 0.095, 0.025, 0.056, 0.040, 0.028) yielded a risk score of 0.0164, classifying the patient as high-risk with an associated survival curve (Fig. 3A).
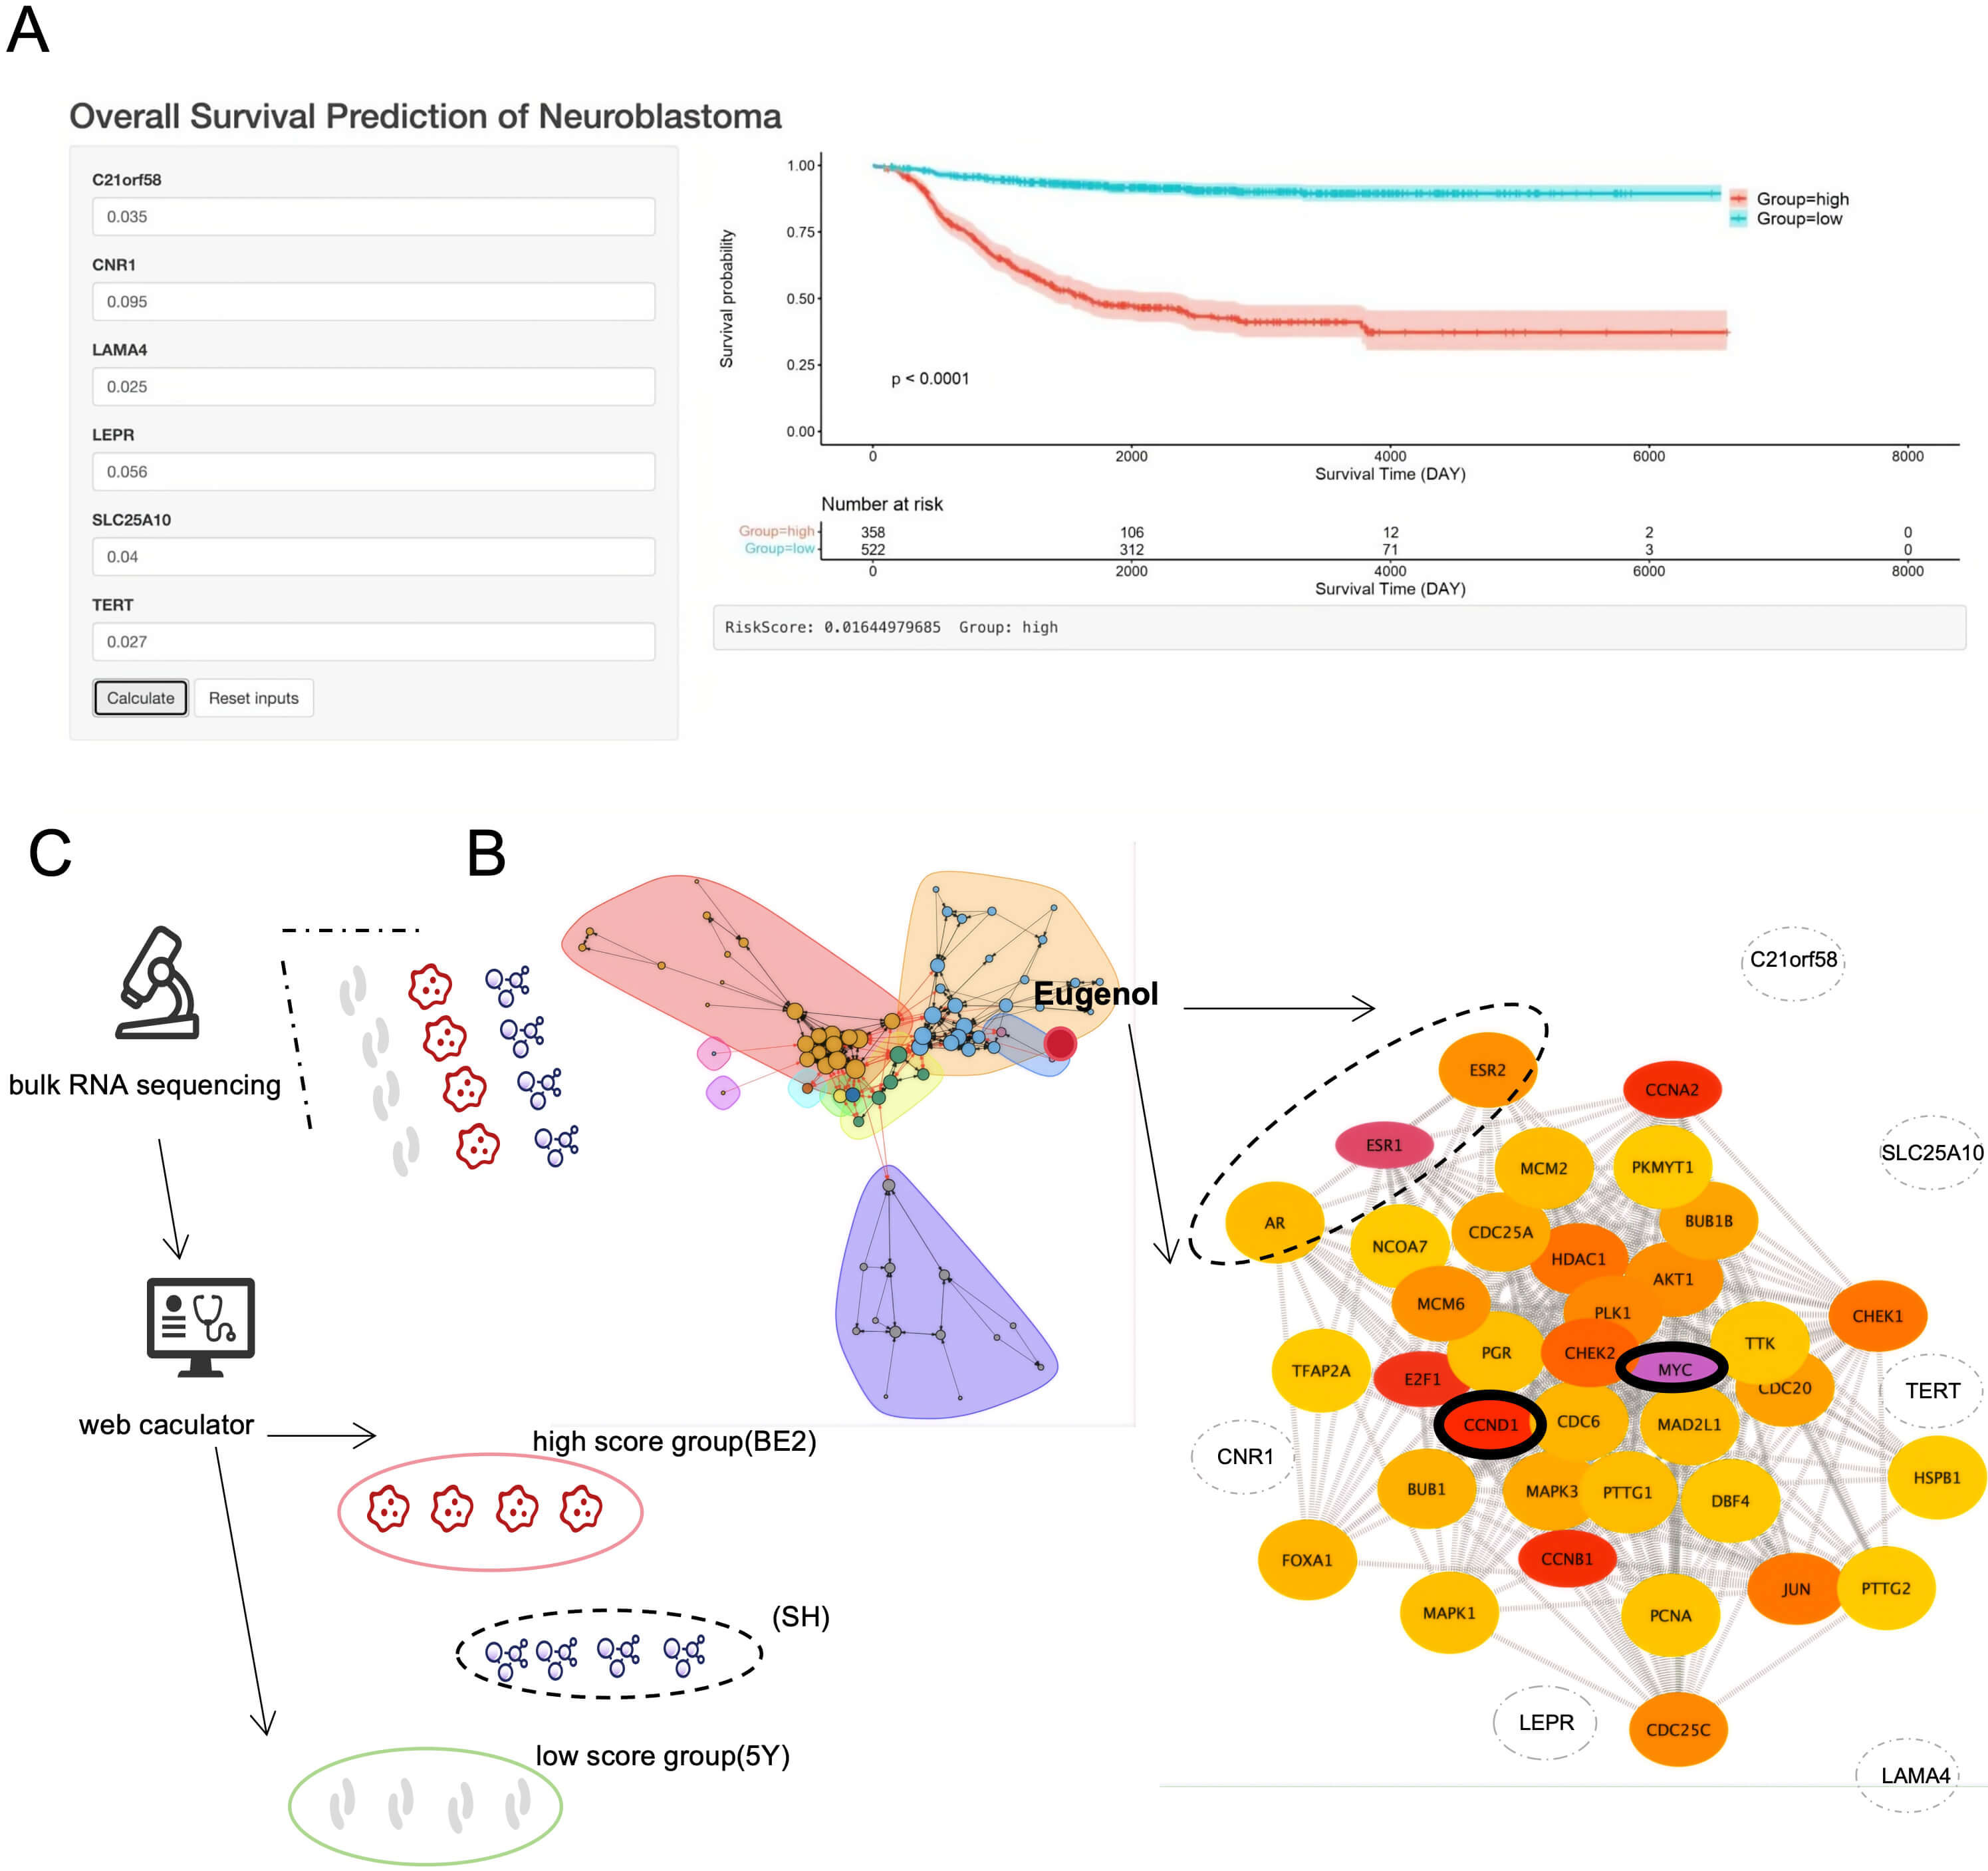 Fig. 3.
New drug. (A) Screenshot of online prognostic assessment platform (http://biowinford.site:3838/Cellcycle_RiskScore_of_NB/). (B) Eugenol was tested against three drug targets: ESR1, ESR2, and the AR. Both MYC and CCND1 achieved the highest BC values, with a darker colour indicating a more central position within the network. (C) The 12 groups of samples were sequenced by bulk RNA and then calculated using the online platform and divided into high- and low-risk groups. ESR1, estrogen receptor 1; AR, androgen receptor; MYC-CCND1, MYC-cyclin D1.
To identify targeted therapies for high-risk patients, proximity-based drug screening identified eugenol, which targets estrogen receptor 1 (ESR1), ESR2, and the androgen receptor (AR). Betweenness Centrality (BC) analysis revealed MYC and CCND1 as core nodes in its network (Supplementary Table 3), suggesting their key roles in eugenol’s mechanism (Fig. 3B).
We validated the risk model in 12 NB cell lines using bulk RNA-seq (Fig. 3C), focusing on how risk scores correlated with MYCN and c-MYC expression levels. SH-SY5Y cells (MYCN non-amplified with normal c-MYC expression) scored below –0.81 (indicating low risk) across all four replicates. SK-N-BE2 cells (MYCN-amplified with high c-MYC expression) scored above –0.81 (indicating high risk) across all four replicates. SK-N-SH cells (MYCN non-amplified with inducible c-MYC expression) showed mixed results, with two replicates scoring above –0.81 (high risk), and the other two scoring below –0.81 (low risk) (Fig. 4A,a). These results are in line with our knowledge and expectations for the three cell lines.
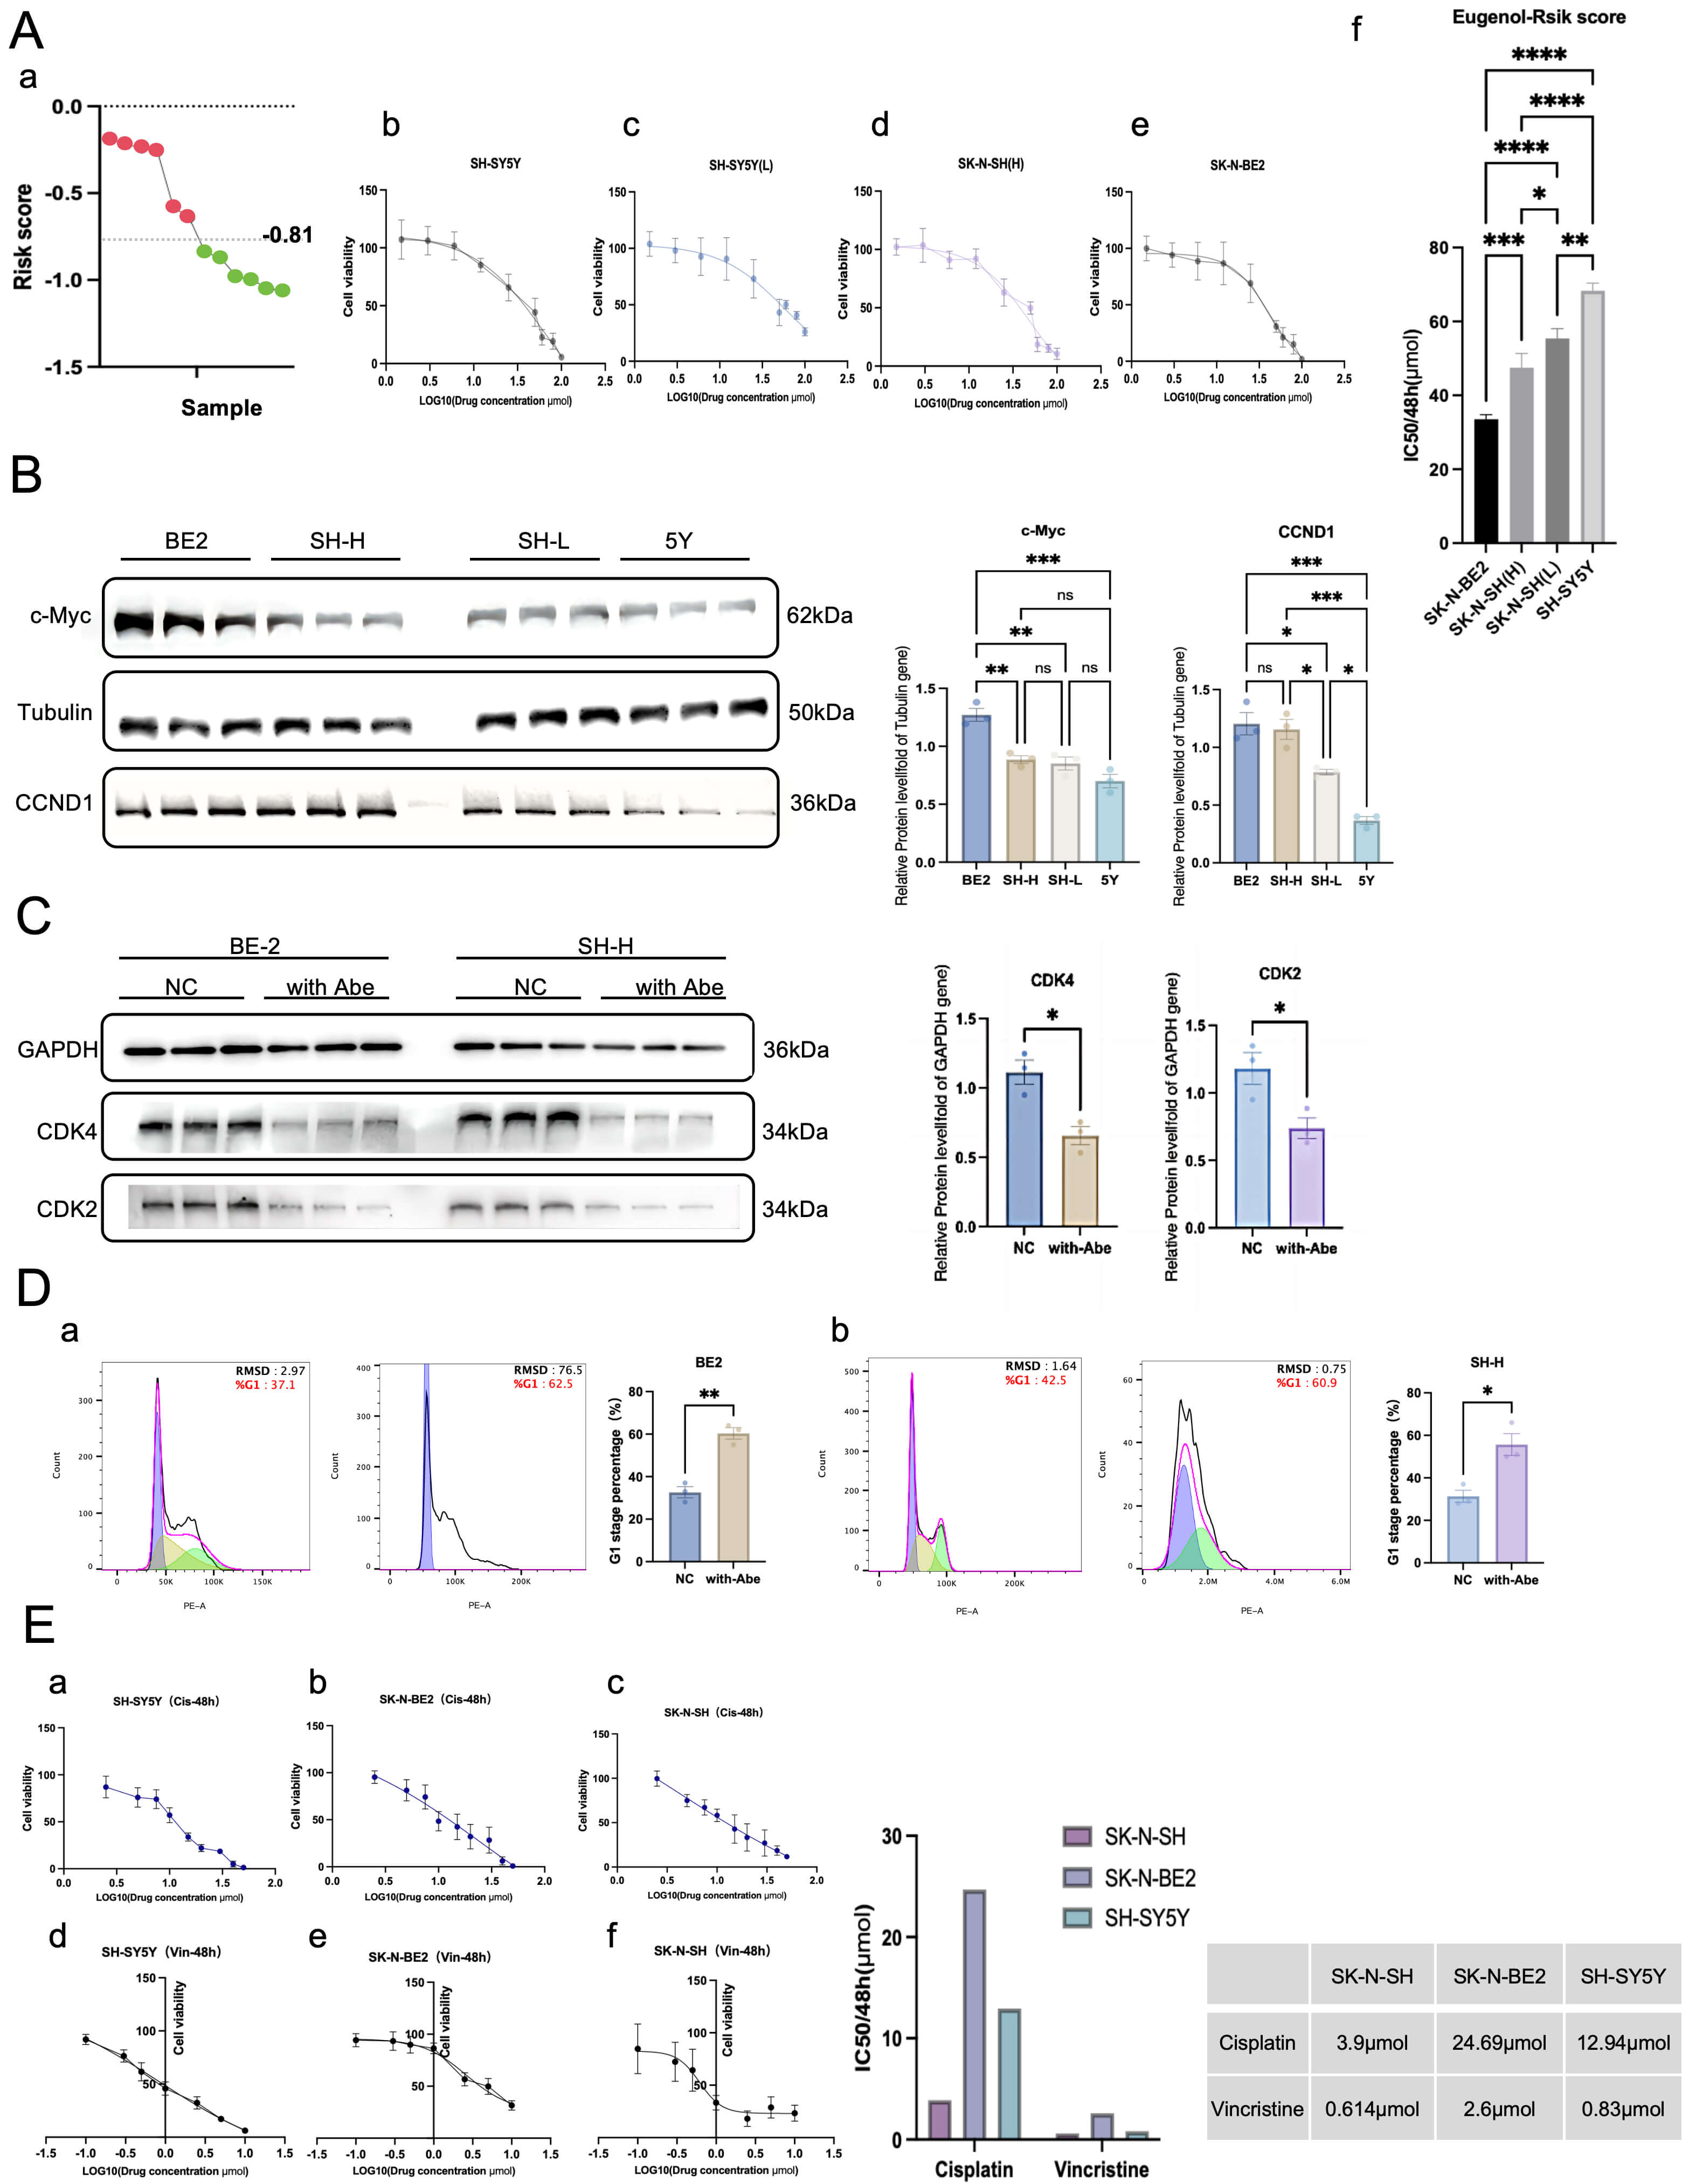 Fig. 4.
Mechanism. (A) (a) Grouping of cells following analysis of bulk
RNA seq data. (b–e) Visualization of cell visibility or viability across a range
of concentration gradients: 100, 80, 60, 50, 25, 12, 6, 3, and 1.5 µM.
SH-SY5Y/low-risk SK-N-SH: 66.0
Since SK-N-BE2 cells and some SK-N-SH cells were classified as high-risk groups, and SH-SY5Y cells and the remaining SK-N-SH cells were classified as low-risk groups, IC50 values were measured for each of these four cells. The IC50 detection of SH-SY5Y cells and SK-N-SH cells in the low-risk group was repeated three times; and the results were 66, 70, and 69 µM, respectively (for SH-SY5Y cells) and 55, 55.23, and 53 µM, respectively (for SK-N-SH cells) (Fig. 4A,b,c).
The IC50 assay of SK-N-BE2 cells and SK-N-SH cells in the high-risk group was repeated three times, and the results were 33, 32.61, and 35 µM, respectively (SK-N-BE2 cells); 43, 49.31, and 50 µM, respectively (SK-N-SH cells) (Fig. 4A,d,e). The statistical analyses showed that SK-N-BE2 cells were the most sensitive to eugenol, followed by SK-N-SH cells in the high-risk group (Fig. 4A,f). These results reveal the killing effect of eugenol on tumor cells of NB, which is worth further study.
Western blotting indicated progressive increases in c-MYC and CCND1 protein expression with increasing risk scores. Specifically, their expression levels increased gradually across different cell lines: lowest in SH-SY5Y cells, intermediate in SK-N-SH in the low-risk group, higher in SK-N-SH cells in the high-risk group, and highest in SK-N-BE2 cells. c-MYC protein expression was only highly expressed in SK-N-BE2 cells, whereas CCND1 protein was highly expressed in both SK-N-BE2 cells and SK-N-SH cells in the high-risk group. This differential expression pattern suggests that these proteins may be the primary targets through which eugenol exerts its effects (Fig. 4B).
The c-MYC protein increased the levels of the CCND1 protein by both promoting its gene expression directly and by stabilizing it indirectly through non-coding RNA. Because CCND1 forms a complex with the cell cycle proteins CDK4 or CDK6, the CDK4/6 inhibitor abemaciclib mesylate was used. Treatment with this inhibitor resulted in a detected decrease in the expression of CDK4 and CDK6 in high-risk SK-N-SH and SK-N-BE2 cell lines (Fig. 4C). The observed increase in the proportion of cells in the G1 phase of the cell cycle (Fig. 4D) confirmed target engagement. This finding lays the foundation for further research into whether CCND1 is critical to the onset of eugenol’s effects.
To compare eugenol’s efficacy against the conventional chemotherapy drugs cisplatin and vincristine, we measured and compared their respective 48-hour IC50 values in SK-N-BE2, SK-N-SH, and SH-SY5Y cell lines. Interestingly, we found that the IC50 of the two drugs was higher in SK-N-BE2 cells than in the other two cell lines (Fig. 4E), which indicates that high-risk NB tumors are resistant to commonly used medications. Thus, it is necessary to explore drugs that are more sensitive to high-risk NB. Edu incorporation assays demonstrated that eugenol could inhibit the proliferation of NB tumors, even in the low-risk group of SK-N-SH cells (Fig. 5A,a). In addition, the effect of eugenol on cell proliferation in SK-N-SH cells and SK-N-BE2 cells in the high-risk group was better than that of the conventional chemotherapy drugs cisplatin and vincristine; however, there was no such effect in SK-N-SH cells in the low-risk group (Fig. 5A,b). It is reasonable to infer that the c-MYC and CCND1 axes play a central role in the onset of eugenol, and after inhibiting the action of CCND1 with abemaciclib mesylate, it was found that eugenol could not continue to inhibit the proliferative state of cells (Fig. 5A,c).
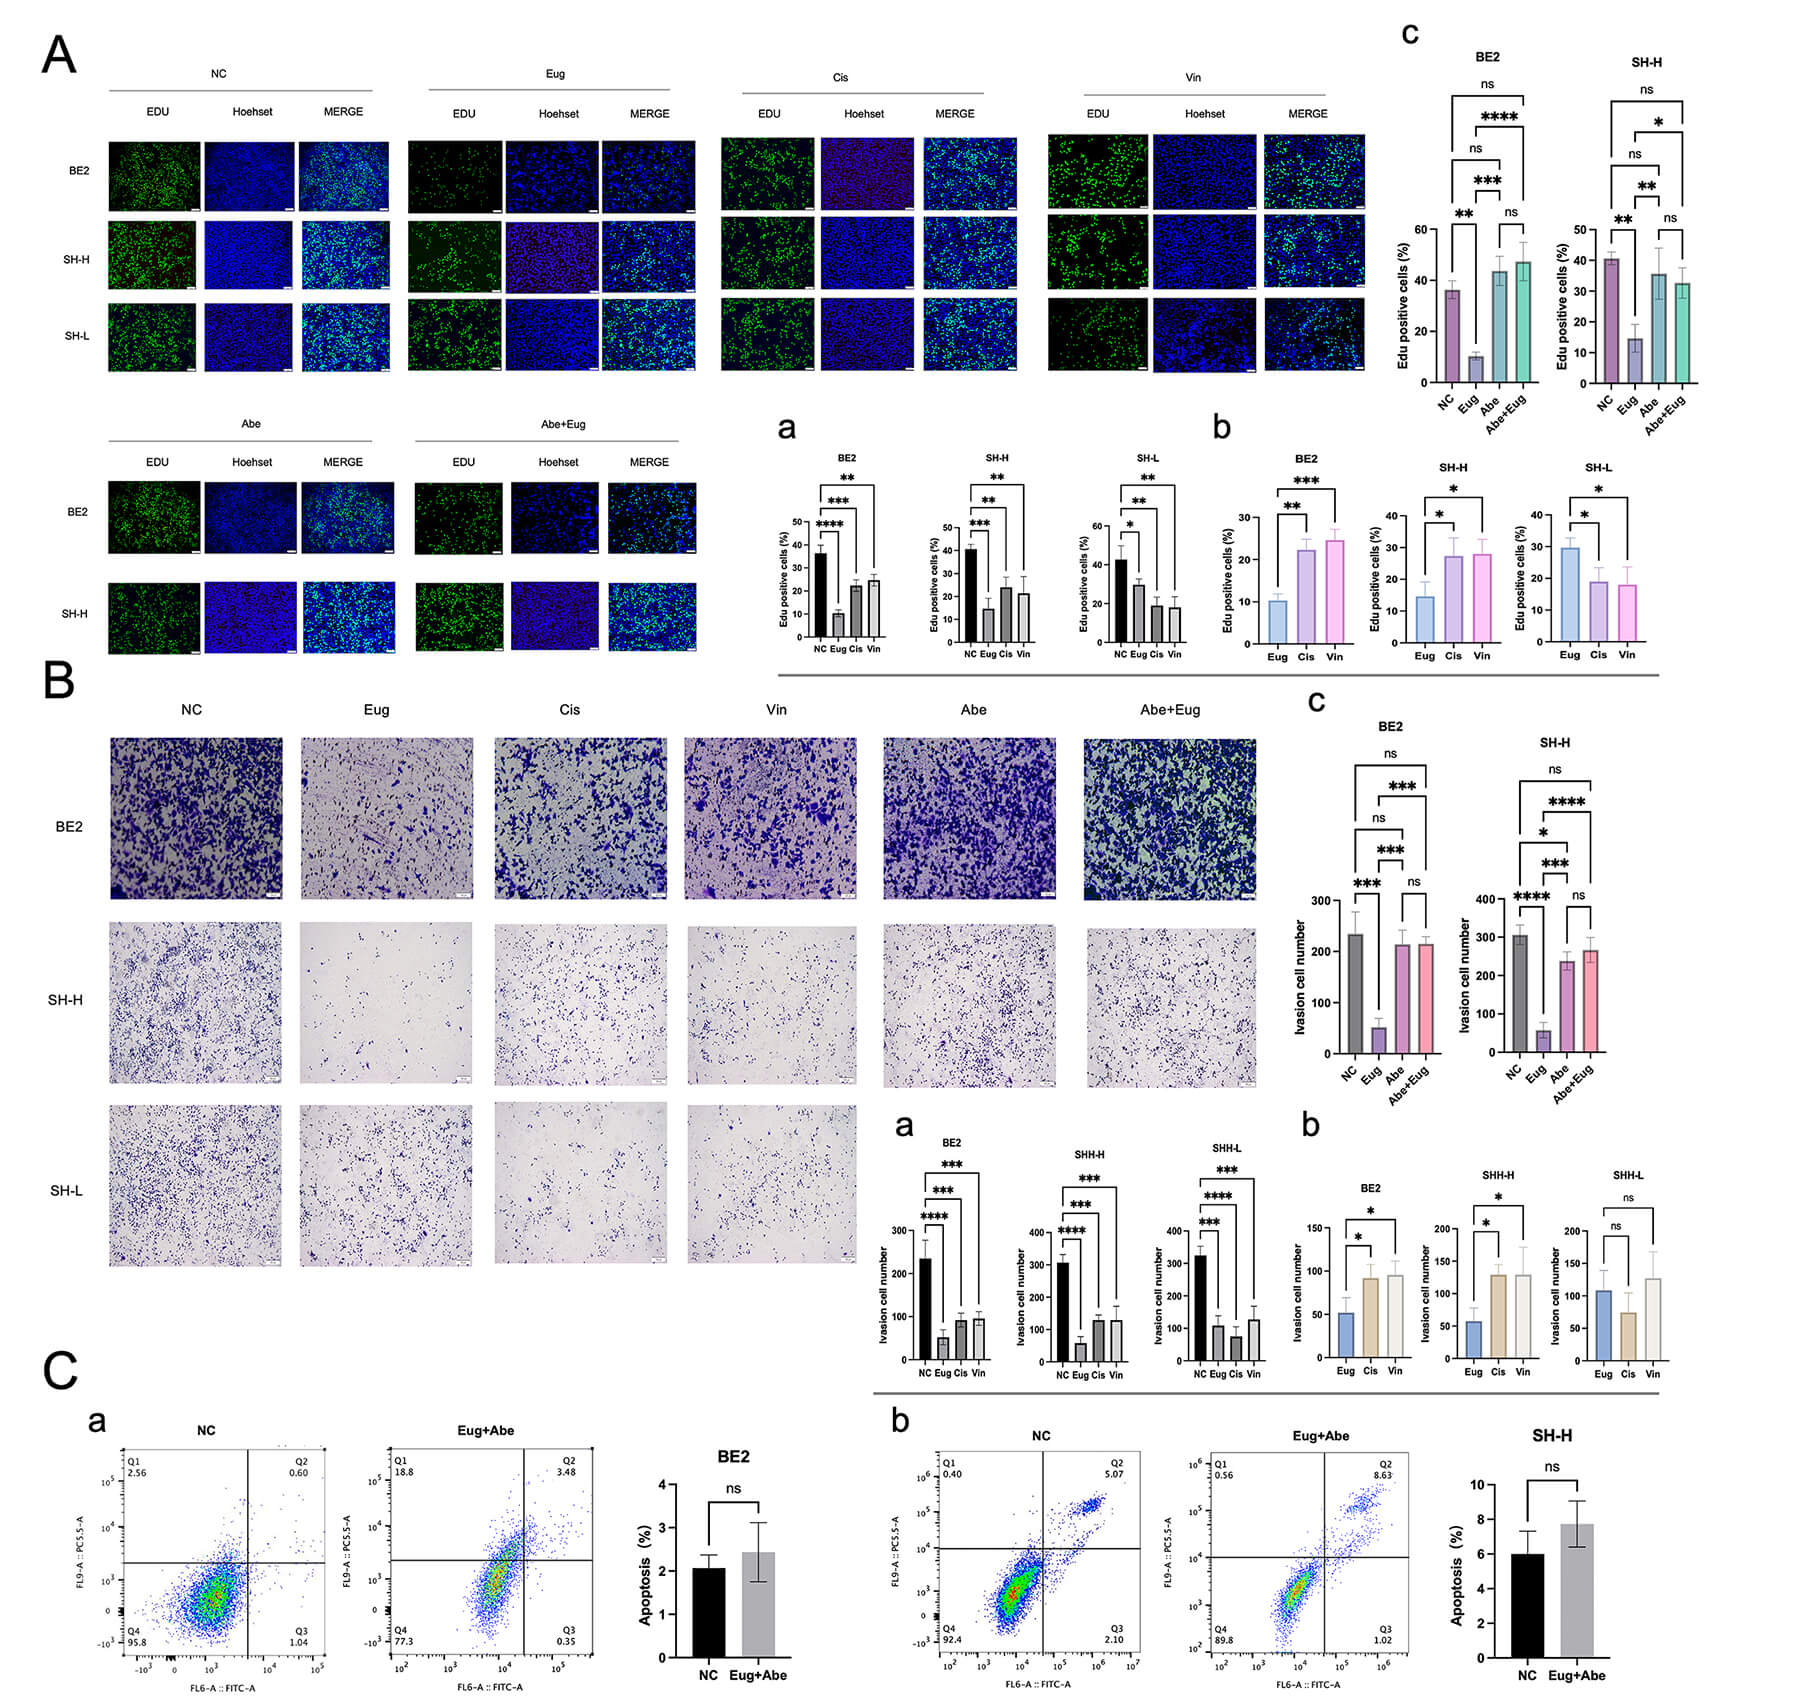 Fig. 5.
Phenotype. (A) (a) Effect of Eug/Cis/Vin on the proliferation
of BE2/SH-H/SH-L cells. (b) Effect of Eug on the cell proliferation ability of
BE2/SH-H/SH-L cells compared with that of Cis/Vin. (c) Effect of eugenol on the
proliferative ability of cells in high-risk groups after blocking CCND1
with Abe. The scale bar: 100 μm. (B) (a) Effect of Eug/Cis/Vin on the cell migration capabilities of
BE2/SH-H/SH-L cells. (b) Effect of Eug on the cell migration capabilities of
BE2/SH-H/SH-L cells was compared with that of Cis/Vin. (c) Effect of eugenol on
the migration capabilities of cells in high-risk groups after blocking
CCND1 with Abe. The scale bar: 100 μm. (C) (a,b) After blocking CCND1, BE2/SH-H cell
could not induce apoptosis. (*p
To further confirm that the c-MYC and CCND1 axes play a central role in the onset of eugenol, we tested the migration capacity of cells by a Trans well assay. Similarly, we found that eugenol had a better effect on cell migration in SK-N-SH cells and SK-N-BE2 cells in the high-risk group than with the conventional chemotherapy drugs cisplatin and vincristine (Fig. 5B,a,b). After blocking CCND1, eugenol could not affect the migration ability of tumor cells (Fig. 5B,c).
Furthermore, after inhibiting the effect of CCND1, eugenol lost the effect of inducing apoptosis in the high-risk group (SK-N-SH cells and SK-N-BE2 cells in the high-risk group) (Fig. 5C), which further confirmed our hypothesis that the c-MYC and CCND1 axes played a central role in the onset of eugenol.
This study establishes a novel precision medicine paradigm for NB through three transformative contributions: (1) an ensemble ML-driven prognostic platform stratifying patients into molecularly defined risk subgroups; (2) identification of eugenol as a high-risk-selective therapeutic agent; and (3) mechanistic validation of its dependence on MYC-CCND1 axis disruption. Crucially, our online calculator (http://biowinford.site:3838/Cellcycle_RiskScore_of_NB/) represents the first deployable tool translating transcriptomic signatures into real-time clinical risk assessment, overcoming a persistent translational barrier in pediatric oncology. The platform’s prognostic robustness is evidenced by consistent AUCs of 0.76–0.83 across independent cohorts—surpassing existing NB models (PAM: AUC 0.68–0.79; MES signature: AUC 0.71–0.81) that suffer from batch-effect susceptibility. By consolidating the six hub genes (C21orf58, CNR1, LAMA4, LEPR, SLC25A10, and TERT) into a simplified risk algorithm, we circumvented the “gene signature fatigue” hampering complex molecular classifiers. Intriguingly, our consensus clustering revealed distinct high-risk subpopulations where conventional markers such as MYCN amplification failed to predict outcomes—mirroring recent findings that 22% of MYCN non-amplified HR-NB exhibits cryptic MYC hyperactivation [22]. This underscores our platform’s capacity to uncover biological heterogeneity invisible to conventional stratification.
The selective vulnerability of high-risk NB to eugenol represents a
pharmacologically actionable extension of this stratification. Eugenol’s two-fold
lower IC50 in platform-defined high-risk cells (mean IC50 35 µM
in SK-N-BE2 vs. 68 µM in SH-SY5Y) aligns with the dose-response windows of
clinically approved natural products [23, 24]. Critically, its efficacy correlated
precisely with risk scores: SK-N-SH cells partitioned based on their
in-silico risk classification into eugenol-sensitive (high-risk:
IC50 47 µM) and eugenol-resistant (low-risk: IC50 69 µM)
populations. This confirmed our central hypothesis that computational risk
stratification can guide therapeutic targeting. More profoundly, the BC ranking
in protein interaction networks suggested MYC and CCND1 as
eugenol’s core targets—an insight corroborated by Western blots showing
stepwise increases in MYC/CCND1 expression along ascending risk
categories (SH-SY5Y
Our functional dissection firmly establishes the MYC-CCND1 axis as the mechanistic linchpin of eugenol’s efficacy. Three orthogonal lines of evidence converge on this conclusion: First, pharmacological uncoupling of CCND1 signaling via abemaciclib (CDK4/6 inhibitor) abolished eugenol’s anti-proliferative and anti-migratory effects [28]. This mirrors synthetic lethality observed when combining bromodomain and extra-terminal (BET) inhibitors (targeting MYC) with CDK4/6 blockade in retinoblastoma-positive cancers [29]. Second, the Edu incorporation and Trans well assays demonstrated eugenol’s superior suppression of proliferation and migration specifically in high-risk cells—effects extinguished upon CCND1 inhibition. Third, apoptosis induction by eugenol was contingent upon intact CCND1 signaling: pretreating cells with abemaciclib prevented apoptosis in high-risk populations. Collectively, these data argue that CCND1 is more than a passive biomarker—it is an indispensable executor of eugenol’s therapeutic effect. Nevertheless, unanswered questions persist regarding upstream modulation. Given eugenol’s interaction with estrogen receptors (ESR1/ESR2 identified via proximity screening), we speculate potential crosstalk with G protein-coupled estrogen receptor (GPER)-mediated mitogen-activated protein kinase inhibition—a pathway implicated in CCND1 degradation [30]. Alternatively, the LEPR-downregulation hallmark of high-risk tumors suggests leptin-MYC synergy may be disrupted [31, 32]. Resolving these upstream events presents compelling future directions.
Beyond mechanistic insights, our work illuminates the broader context of cell
cycle targeting in pediatric oncology. While CDK4/6 inhibitors show
efficacy in adult cancers, pediatric trials have revealed limited benefits and
concerning hepatotoxicity in NB [33, 34]. Eugenol’s selectivity may circumvent
this: its CCND1-centric action spares CDK1/2-dependent cell
cycle phases, potentially mitigating myelotoxicity—particularly critical for
developing bone marrow. Moreover, the differential protein expression pattern
(CCND1 high in SK-N-BE2/high-risk SK-N-SH vs. MYC restricted to
SK-N-BE2) implies distinct dependencies: MYC amplification may mandate
MYC-targeted approaches, while CCND1-overexpressed tumors could
respond to CDK inhibitors or eugenol analogues. This biological
stratification has clinical parallels: ALK inhibitors benefit only
ALK-mutated NB, while ALK-wildtype tumors require alternative
strategies [35]. Our finding that eugenol outperforms cisplatin/vincristine in
migration suppression (80% reduction vs.
Notwithstanding these advances, eugenol faces translational hurdles shared by
many natural compounds: bioavailability constraints (oral bioavailability
~19%) and undefined pharmacokinetics [36, 37]. Our discovery that
the IC50 window (35–69 µM) overlaps with serum concentrations
achievable via nano formulation (
Several study limitations warrant acknowledgement. First, in vitro validation employed MYC-driven models (SK-N-BE2, c-MYC-inducible SK-N-SH); however, orphan MYC-independent high-risk subsets require expanded characterization. Second, eugenol’s polypharmacology may engage off-target effects beneficial or detrimental—comprehensive kineme profiling is ongoing. Third, the clinical relevance of established IC50 values needs confirmation in patient-derived xenograft (PDX) models with human-relevant pharmacokinetics. However, our integrative approach presents a replicable framework: combining prognostic AI, network pharmacology, and functionally defined target validation. This methodology could transcend NB—pan-cancer analyses suggest cell cycle dysregulation affects 79% of malignancies, but therapeutic strategies remain tumor-agnostic. Our stratification-based precision approach provides a template to rectify this.
In conclusion, we have established a computational-experimental pipeline transforming NB management. (1) The web-based risk platform democratizes genomic prognostication, outperforming legacy systems through consensus ML. (2) Its application identifies high-risk subpopulations exhibiting selective vulnerability to eugenol, a natural compound previously unexplored in MYC/CCND1-driven contexts. (3) Mechanistic dissection revealed that this vulnerability stems from eugenol’s disruption of the MYC-CCND1 axis—the same pathway driving chemoresistance to conventional agents. Looking forward, validating eugenol in platform-stratified PDX models and initiating biomarker-directed Phase I trials represent critical next steps. Ultimately, this study demonstrates how bridging computational risk assessment with targeted therapy can overcome the heterogeneity roadblock in pediatric cancers.
We constructed a risk stratification model for NB based on six hub genes (C21orf58, CNR1, LAMA4, LEPR, SLC25A10, and TERT), which was established by integrating multiple ML algorithms. Leveraging this model, we identified eugenol as a potential therapeutic agent. In vitro experiments confirmed its selective efficacy against high-risk patient-derived cell populations, and preliminary mechanistic investigation suggested that its antitumor activity is mediated through suppression of the MYC-CCND1 axis. Nevertheless, further in vivo validation and detailed pharmacokinetic profiling will be essential to advance these findings toward clinical application.
Bulk RNA data presented in this study can be accessed in online repositories. The names of the repositories and their accession numbers can be accessed in the article. The datasets used and analyzed during the current study are available from the corresponding author on reasonable request.
RW and CL were responsible for the overall conception and design of this study. RW performed most of the experiments and data analyses, collected the data, and wrote the manuscript. Both authors contributed to editorial changes in the manuscript. Both authors read and approved the final manuscript. Both authors have participated sufficiently in the work and agreed to be accountable for all aspects of the work.
This study was approved by Institutional Review Board of Children’s Hospital of Chongqing Medical University (No. 2024312).
We wish to thank Dr. Jin Ying Xiang and Dr. Jun Bao Du from the Chongqing Medical University Children’s Hospital for their assistance in the successful implementation of this study.
This research was supported by Children’s Hospital of Chongqing Medical University Nursing Department-Level Research Project CHCQMU2024.11.
The authors declare no conflict of interest.
During the preparation of this work, the authors used Cici and Deepseek to ensure the correct use of punctuation throughout the text, and checked for spelling and grammatical errors. After using these tools, the authors reviewed and edited the content as needed and took full responsibility for the content of the publication.
Supplementary material associated with this article can be found, in the online version, at https://doi.org/10.31083/FBL46406.
References
Publisher’s Note: IMR Press stays neutral with regard to jurisdictional claims in published maps and institutional affiliations.