


 , Feng Cao 2,†, Zhihua Shui 3, Xinyu Zhang 3, Mengjie Lv 3, Hanmeng Xu 3, Juan Ran 3, Wenjing Ding 3, Endi Zhou 1, Daoxiang Zhang 3, Fubao Liu 1,*
1 Hepatopancreatobiliary Surgery, Department of General Surgery, The First Affiliated Hospital of Anhui Medical University, 230031 Hefei, Anhui, China
2 Medical Faculty, University of RWTH Aachen, 52074 Aachen, Germany
3 School of Life Sciences, Anhui Medical University, 230012 Hefei, Anhui, China
†These authors contributed equally.
Abstract
Pancreatic neoplasms, particularly pancreatic adenocarcinoma (PAAD), are aggressive malignancies marked by extensive infiltration of cancer-associated fibroblasts (CAFs) and a highly complex tumor immune microenvironment. These pathological features are strongly associated with poor patient survival. However, the precise mechanisms underlying the role of CAFs in PAAD have not been determined.
To systematically analyze the functions of CAFs in PAAD and their associations patient outcomes, an integrative approach combining multi-omics data with experimental validation was used.
Integrated weighted gene co-expression network and protein–protein interaction network analyses revealed CAF-related genes with functional significance. Experimental verification was performed to examine the influence of candidate CAF-related genes identified using multi-database analyses on tumor cell behavior. COL28A1, TGFB2, TGFBI, PLOD2, and COL22A1 were core genes closely associated with CAFs. Patients in the high-risk group demonstrated a higher immune escape ability and lower predictive response rate to immunotherapy than those in the low-risk group. Several potential targeted therapeutic compounds were identified, including dihydrorotenone and sorafenib. Single-cell RNA sequencing and expression analyses confirmed elevated expression of TGFBI and PLOD2 in CAFs. Functional experiments demonstrated that PLOD2 promotes tumor progression by regulating extracellular matrix remodeling.
This study provides insights into the molecular mechanisms underlying PAAD and establishes a theoretical foundation for the development of CAF-targeting therapeutic strategies.
Keywords
- pancreatic neoplasms
- cancer-associated fibroblast
- tumor microenvironment
- extracellular matrix
Pancreatic adenocarcinoma (PAAD), a highly malignant cancer, is responsible for approximately 300,000 deaths globally each year [1]. It is characterized by strong invasiveness and a high propensity for metastasis. Despite available treatment modalities, such as surgery, radiotherapy, chemotherapy, and immunotherapy, the overall therapeutic efficacy remains suboptimal, with a 5-year survival rate below 10% [2]. The primary determinant of the poor prognosis of PAAD is the complex tumor immune microenvironment (TIME), which involves various components, including stromal cells, immune cells, and a dense extracellular matrix (ECM) [3, 4]. The ECM leads to vascular collapse, increased interstitial fluid pressure, and obstruction of lymphatic return, thereby hindering effective drug delivery, deep penetration, and immune cell infiltration [5, 6]. Cancer-associated fibroblasts (CAFs), key cellular components of the ECM, are closely linked to tumor malignancy [7]. Consequently, an in-depth investigation of the functions of CAFs and their associated genes in PAAD holds promise for the development of targeted PAAD therapies.
CAFs arise from the activation and transformation of normal fibroblasts within
the TIME by various stimuli, such as transforming growth factor-
However, the key pathways by which CAFs contribute to PAAD and their impact on patient survival remain unclear. This research integrates advanced computational frameworks—such as weighted gene co-expression network analysis (WGCNA), protein–protein interaction (PPI) networks, and single-cell RNA sequencing (scRNA-seq)—with targeted functional experiments to deconstruct the role of CAFs in PAAD progression. We hypothesize that a distinct gene expression signature in CAFs drives ECM remodeling and immune suppression in PAAD and that targeting these molecular mediators could overcome immunotherapy resistance. Our findings illuminate the molecular mechanisms underlying PAAD and provide a basis for the development of actionable clinical tools for improving immunotherapeutic interventions and tailoring drug regimens based on individual drug sensitivity profiles.
The microarray datasets GSE57495 (GPL15048 plat-form) and GSE62452 (GPL6244), involving 63 and 69 (total n = 69; 4 samples excluded due to missing clinical data) PAAD samples with corresponding clinical information, respectively, were retrieved from the Gene Expression Omnibus database (https://www.ncbi.nlm.nih.gov/geo/). Each dataset was processed and normalized independently. Data were normalized using the “normalize.quantiles” function of the “preprocessCore” package (version 1.68.0; Bioconductor, Fred Hutchinson Cancer Center, Seattle, WA, USA) in R software (version 4.4.2; R Foundation for Statistical Computing, Vienna, Austria). Gene symbols were assigned to probe sets based on manufacturer annotation files. Ambiguous mappings (where one probe corresponded to multiple genes) were removed. For genes detected by multiple probes, their expression values were averaged to obtain a single representative value per gene. When the two datasets were integrated for a combined analysis (e.g., during model construction and validation), we applied the removeBatchEffect function from the “limma” R package (version 3.62.2; Bioconductor, Fred Hutchinson Cancer Center, Seattle, WA, USA) to adjust for potential technical batch effects arising from different platforms.
CAF scores were calculated via the MCPcounter.probesets and MCPcounter.genes functions of the “MCPcounter” R package (version 1.2.0; developed by the Tumor Microenvironment and Cancer Immunology research team, INSERM U1138, Cordeliers Research Centre, Paris, France), based on a fibroblast-specific gene signature (e.g., COL1A1, COL3A1, COL6A1, COL6A2, DCN, PAMR1, TAGLN and GREM1) [15]. To identify gene expression modules linked to CAF abundance, a Weighted Gene Co-expression Network Analysis was executed using the WGCNA package (version 3.5.2; Peter Langfelder and Steve Horvath, University of California, Los Angeles, CA, USA) [16]. In this method, a co-expression network is constructed based on pairwise correlations between gene profiles. Genes are then grouped into discrete modules according to a topological overlap measure [17]. During this process, an automatically selected soft-thresholding power was used to ensure a scale-free network architecture. Finally, relationships between each module and the CAF score were assessed by calculating Pearson correlation coefficients, identifying key regulatory modules.
To pinpoint genes central to CAFs, we initially built a PPI network using the
STRING database (version 12.0,
https://string-db.org). After filtering
interactions with a minimum confidence score of 0.4 and eliminating isolated
nodes, we employed the CytoHubba plugin within Cytoscape (version 3.8.2; The Cytoscape Consortium, University of California, San Diego, CA, USA). Specifically, by applying the Maximum Neighborhood
Component (MNC) algorithm, we identified the top 50 most influential genes [18].
These candidate genes were then subjected to a survival analysis via Cox
proportional hazards regression and variable selection using Least Absolute
Shrinkage and Selection Operator (LASSO) regression in R. The optimal penalty
parameter (
The TIDE score assesses how well a tumor can evade the immune system, helping predict the effectiveness of immunotherapy in different patient risk groups. High-scoring tumors exhibit robust immune evasion, whereas low scores indicate a heightened likelihood of responding positively to immune checkpoint inhibitor (ICI) therapy. As PAAD is not a distinct category within the TIDE database, expression data were submitted with the tumor type designated as “Other” and the “prior immunotherapy” option set to “No” to exclude the confounding effects of prior treatments.
To investigate whether distinct risk strata exhibit differential drug responses, we utilized computational models trained on the Genomics of Drug Sensitivity in Cancer (GDSC) repository to forecast therapeutic sensitivity. GDSC cell line expression data served as the training set, whereas samples from the constructed risk model served as the test set. Batch effect correction was applied using the “eb” (Empirical Bayes) method to control for systematic bias. The prediction parameters were set as variation cut-off = 0.2 and minimum sample size = 10 to ensure model robustness. Sensitivity prediction scores for each test sample were obtained for various drugs.
To confirm distinct transcriptional activity of preselected candidate genes between tumor cells and fibroblasts, RNA-seq datasets were acquired from the CCLE repository (https://depmap.org/portal/ccle). After curating focused expression data for our genes of interest from available PAAD cell lines and fibroblast samples, we performed a comparative analysis. This was executed in the R computing environment, employing the moderated t-test in the limma framework (version 3.62.2; Bioconductor), alongside the ggpubr add-on (version 0.6.0; available via the Comprehensive R Archive Network) for data presentation. Given potential deviations from a normal distribution, we used rank-based, non-parametric tests. p-values were subsequently adjusted using established false discovery rate (FDR) control procedures to ensure statistical reliability.
The scRNA-seq data were analyzed using the SCAR_Atlas_0799 dataset and the
ScarAtlas online platform (http://www.scaratlas.com/). Cells were initially
filtered based on platform-preset quality control criteria (number of detected
genes: 200–6000; mitochondrial gene percentage:
PAAD cell lines, CAPAN-1, SW1990 and Miapaca-2, were obtained from Zhang DX Laboratory
(Hefei, China). Cells were cultured in Dulbecco’s modified Eagle’s medium (DMEM;
Gibco, Thermo Fisher Scientific, Waltham, MA, USA) containing 10% fetal bovine
serum at 37 °C in a humidified atmosphere comprising 5% CO2. CAFs
(Nanjing, China, Cat# JY-J883) were purchased from Jinyuan Biotechnology Co.
(https://www.ssrcc.com.cn/). A short tandem repeat (STR) analysis was leveraged
to validate the purity and ensure cell line stability. To control for
potential off-target effects of CRISPR/Cas9, two independent sgRNAs (sg1-PLOD2
and sg2-PLOD2) targeting distinct sequences of the PLOD2 gene were used
for knockout. Detailed information on the plasmid vectors and the
precise sgRNA sequences (sg1-PLOD2 and sg2-PLOD2) are provided in
Supplementary Table 1. To prepare conditioned media from CAFs (CAF-CM)
and CAFs with PLOD2 knockout (sgCAF-CM), CAFs or sgCAFs were cultured in
serum-free medium. Cells in the logarithmic growth phase were harvested and
resuspended to a concentration of 106 cells/mL. Twenty milliliters of the
cell suspension were seeded into culture flasks. Upon reaching 80% confluence,
the supernatant was collected, centrifuged at 300
Cells were lysed using RIPA buffer (Beyotime Biotechnology, Shanghai, China, Cat# P0013B). Total proteins (10 µg per lane) were separated by SDS-PAGE and then transferred onto PVDF membranes. The membranes were blocked with 5% non-fat milk in TBST for 1 hour at room temperature and then incubated overnight at 4 °C with primary antibodies against TGFBI (rabbit polyclonal, ZEN BIO, Chengdu, China, Cat# 380025; 1:2000 dilution) and PLOD2 (mouse monoclonal, Proteintech, Wuhan, China, Cat# 66342-1-Ig, 1:2000 dilution). After washing, the membranes were incubated with HRP-conjugated secondary antibodies, including goat anti-rabbit IgG (Abbkine, Redlands, CA, USA, Cat# A21020; 1:5000) and goat anti-mouse IgG (Abbkine, Redlands, CA, USA, Cat# A21010; 1:5000), for 2 hours at room temperature. Protein bands were visualized using an ECL detection kit (Vazyme, Nanjing, China, Cat# E412-01). The chemiluminescent signals were captured and quantified using ImageJ software (version 1.52a; National Institutes of Health, Bethesda, MD, USA).
The capacity for clonogenic survival was assessed by seeding approximately 1000 treated cells into each well of a 6-well plate. Cultures were maintained at 37 °C in a humidified atmosphere containing 5% CO2 for approximately 14 days or until distinct colonies became evident. Colony visualization was achieved by fixing with 4% paraformaldehyde (Beyotime Biotechnology, Shanghai, China, Cat# P0099) for 15 min and staining with 0.1% crystal violet (Solarbio, Beijing, China, Cat# C8470) for 20 minutes. Upon air-drying, digital images of the stained colonies were captured, and the total number of colonies per well was determined using ImageJ software (version 1.52a; National Institutes of Health, Bethesda, MD, USA).
Starting with a density of 3
The contractile capacity of CAFs was evaluated using a collagen-based assay kit
(Cell Biolabs, Inc., San Diego, CA, USA, Cat#CBA-201) following the
manufacturer’s two-step model. Control CAFs (CON) and PLOD2-knockout CAFs
(sg1-PLOD2, sg2-PLOD2) were prepared. Cells were mixed with cold Collagen Gel
Working Solution to a final density of 0.5–1
Statistical analyses were performed using R (version 4.4.2; R Foundation for
Statistical Computing, Vienna, Austria) and GraphPad Prism (version 9.0.0;
GraphPad Software, San Diego, CA, USA). Data are presented as means
A survival analysis based on CAF MCPcounter scores revealed that patients with
higher CAF scores exhibited significantly worse overall survival (OS) than that
of patients with lower CAF scores (p
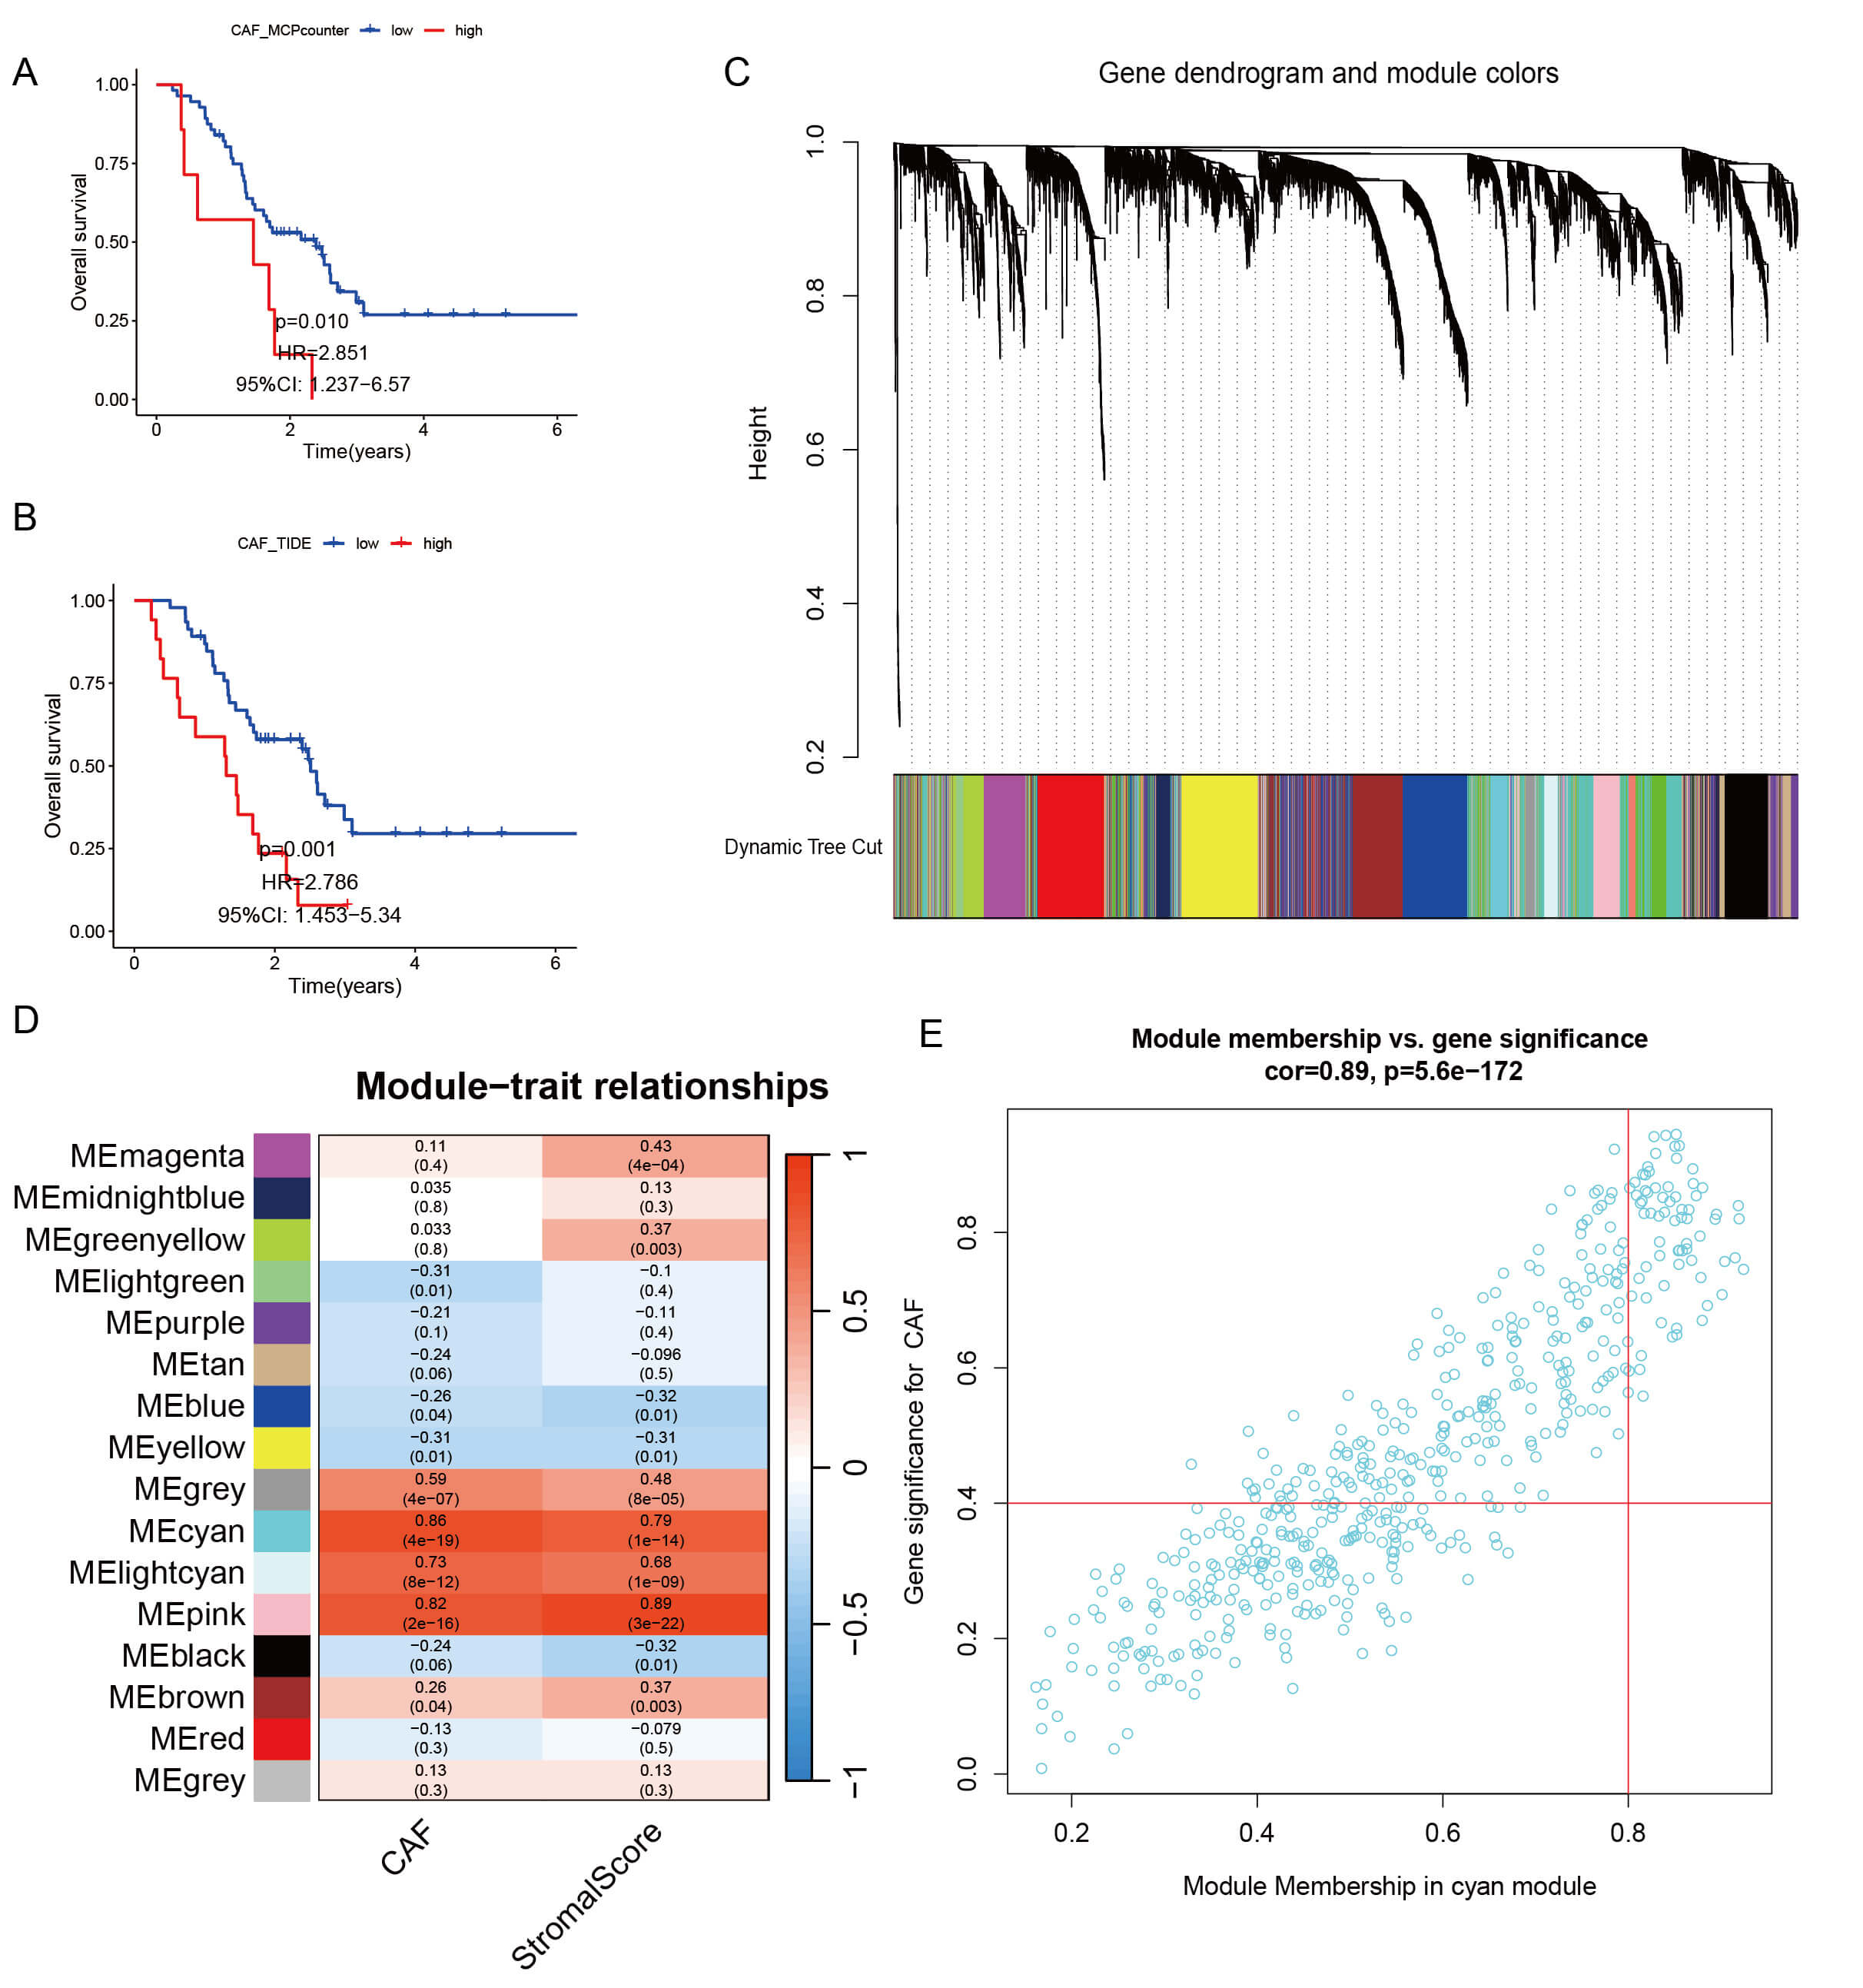 Fig. 1.
Overall survival based on CAF scores and WGCNA of CAF-related genes. (A)
Kaplan–Meier survival curves for patients with PAAD from GSE57495 (n = 63)
stratified by CAF scores (MCPcounter) (p = 0.010, log-rank test). (B)
Kaplan–Meier survival curves for patients with PAAD from GSE57495 (n = 63)
stratified by CAF scores (TIDE) (p = 0.010, log-rank test). (C) Gene
dendrogram and modules before merging in the GSE57495 dataset. (D) Correlation
analysis between MEcyan module eigengenes and CAF score (left, r = 0.86, p
This description is inaccurate and should be replaced with: A PPI network was constructed using 501 genes from the Cyan module. After removing 185 isolated nodes that lacked interactions with other proteins, a connected network was obtained for subsequent analysis.(Supplementary Fig. 1) Subsequently, the MNC algorithm was applied, yielding a network cluster containing 50 key genes, including LOXL2, MMP3, PLOD2, and P4HA3, involved in stromal remodeling (Fig. 2).
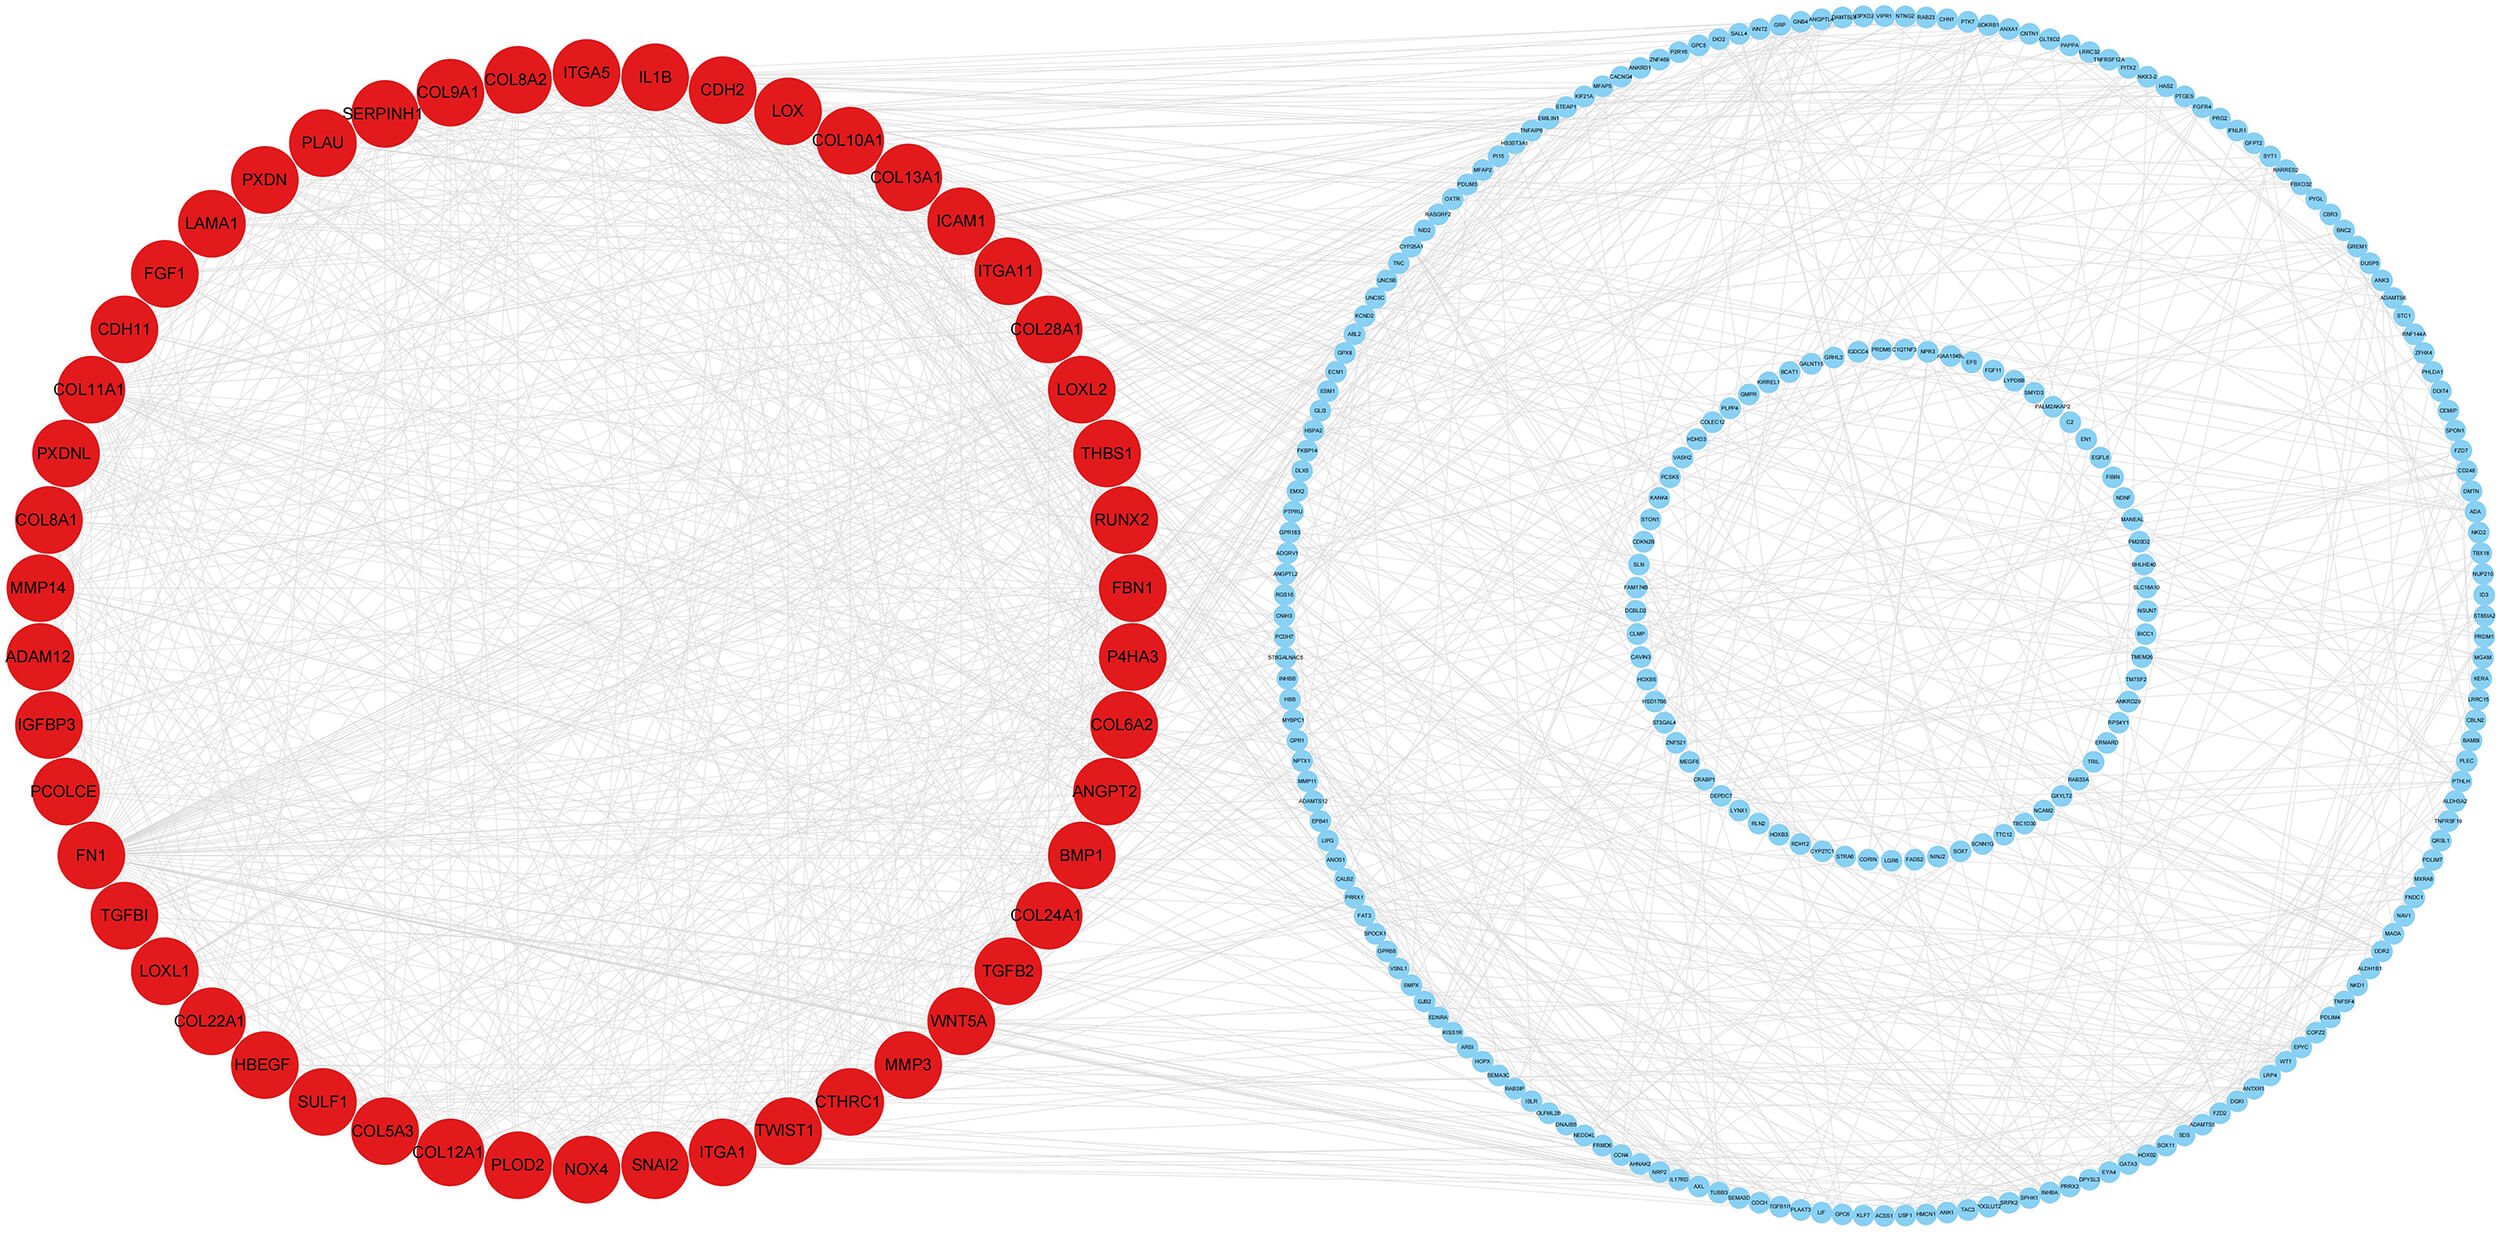 Fig. 2.
Key protein–protein interaction (PPI) cluster in the Cyan module identified using the MNC algorithm. A PPI network was constructed using 501 genes from the cyan module, with a minimum confidence score of 0.4. Isolated nodes were removed, and the MNC algorithm was applied to identify the top 50 hub genes. Red indicates core proteins with high connectivity.
Univariate Cox regression analyses of the 50 candidate genes identified using
the MNC algorithm were performed. COL28A1, TGFB2,
CDH2, MMP14, TGFBI, pLOD2, COL22A1, and RUNX2 demonstrated significant associations with overall survival
(p
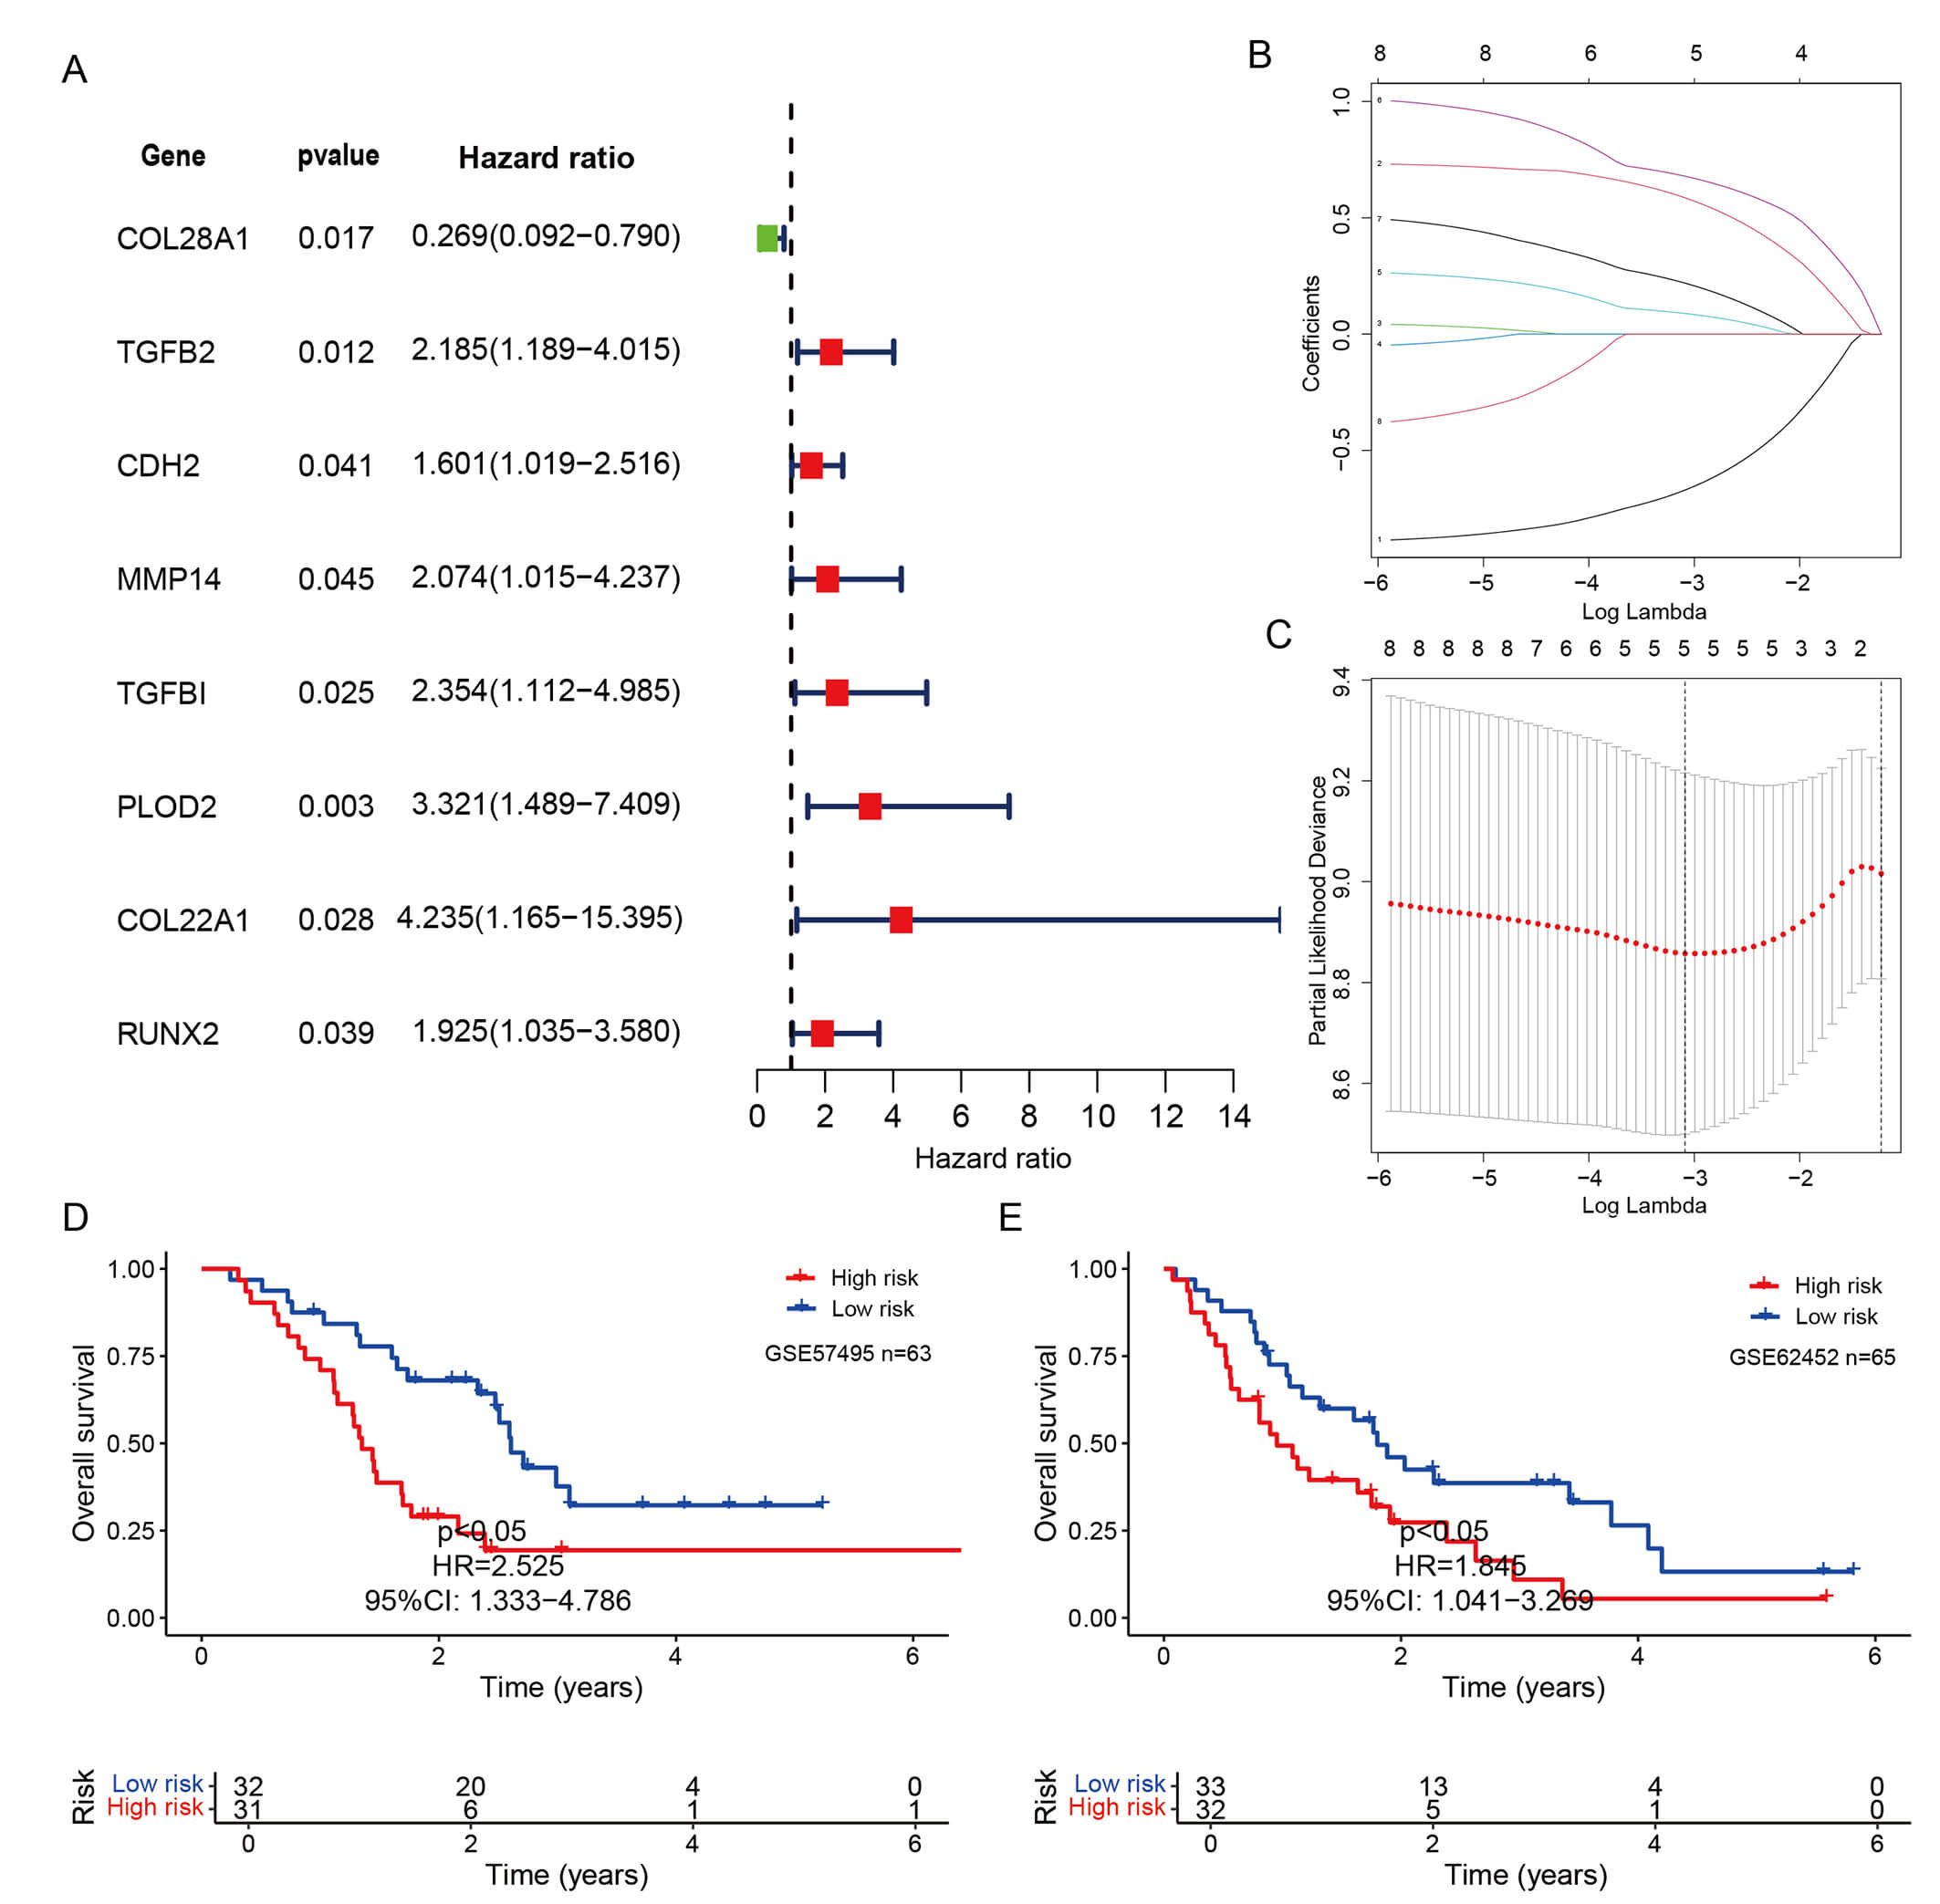 Fig. 3.
Establishment and identification of a risk signature. (A) Univariate Cox
regression analysis of 50 candidate genes identified using the MNC algorithm.
Genes with p
The putative CAF marker genes served as a foundation, informed by prior
investigations in the field. For visualization, a comprehensive heatmap was
employed to juxtapose the expression dynamics of the selected genes with those of
recognized CAF markers within the final risk estimator. Spearman’s method
demonstrated significant, positive correlations (p
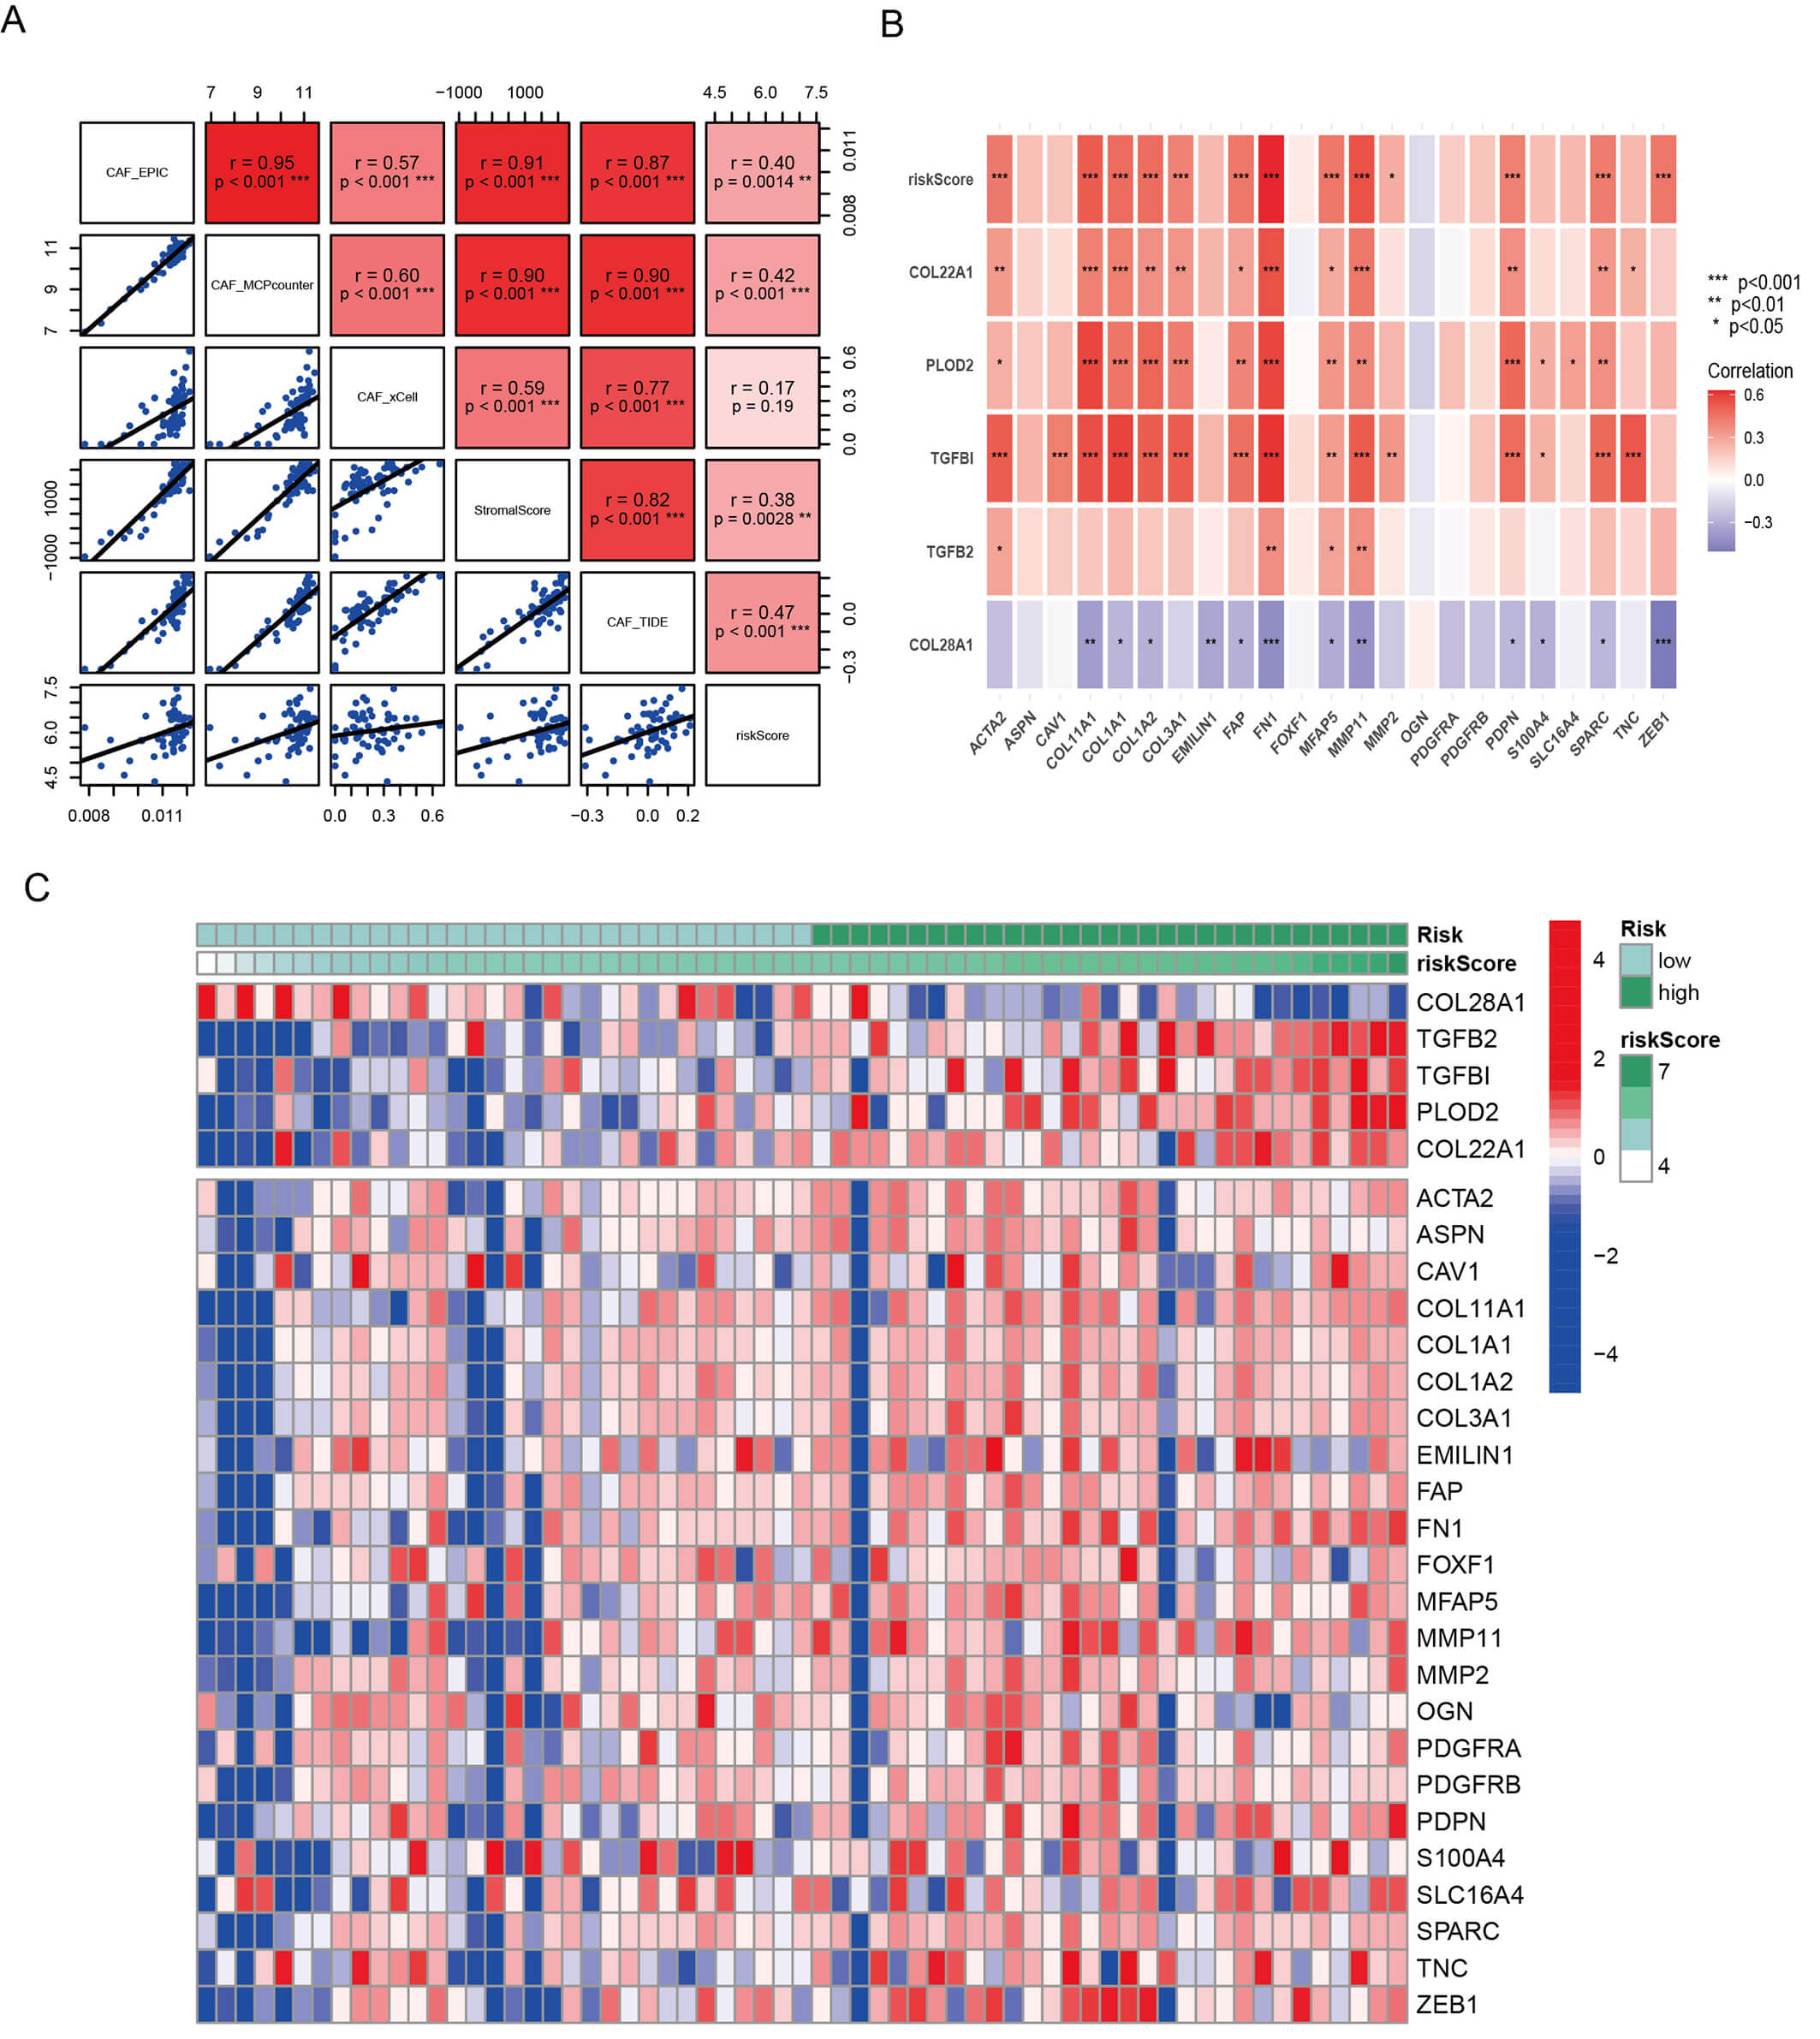 Fig. 4.
Expression levels of model genes and CAF marker genes. (A)
Correlations between the CAF score, stromal score, and risk score in GSE57495 (n
= 63). Spearman’s correlation coefficients were used. (B) Correlation analysis between model
genes and CAF marker genes in GSE57495 (n = 63). Spearman’s correlation was used,
with * indicating p
To evaluate the value of the CAF-associated risk model in predicting the
immunotherapy response, samples from the GSE57495 datasets were analyzed using
the TIDE platform. The TIDE scores quantified the immune escape potential and
predicted the sensitivity to ICIs for each sample. The immunotherapy response
differed significantly among risk groups (p
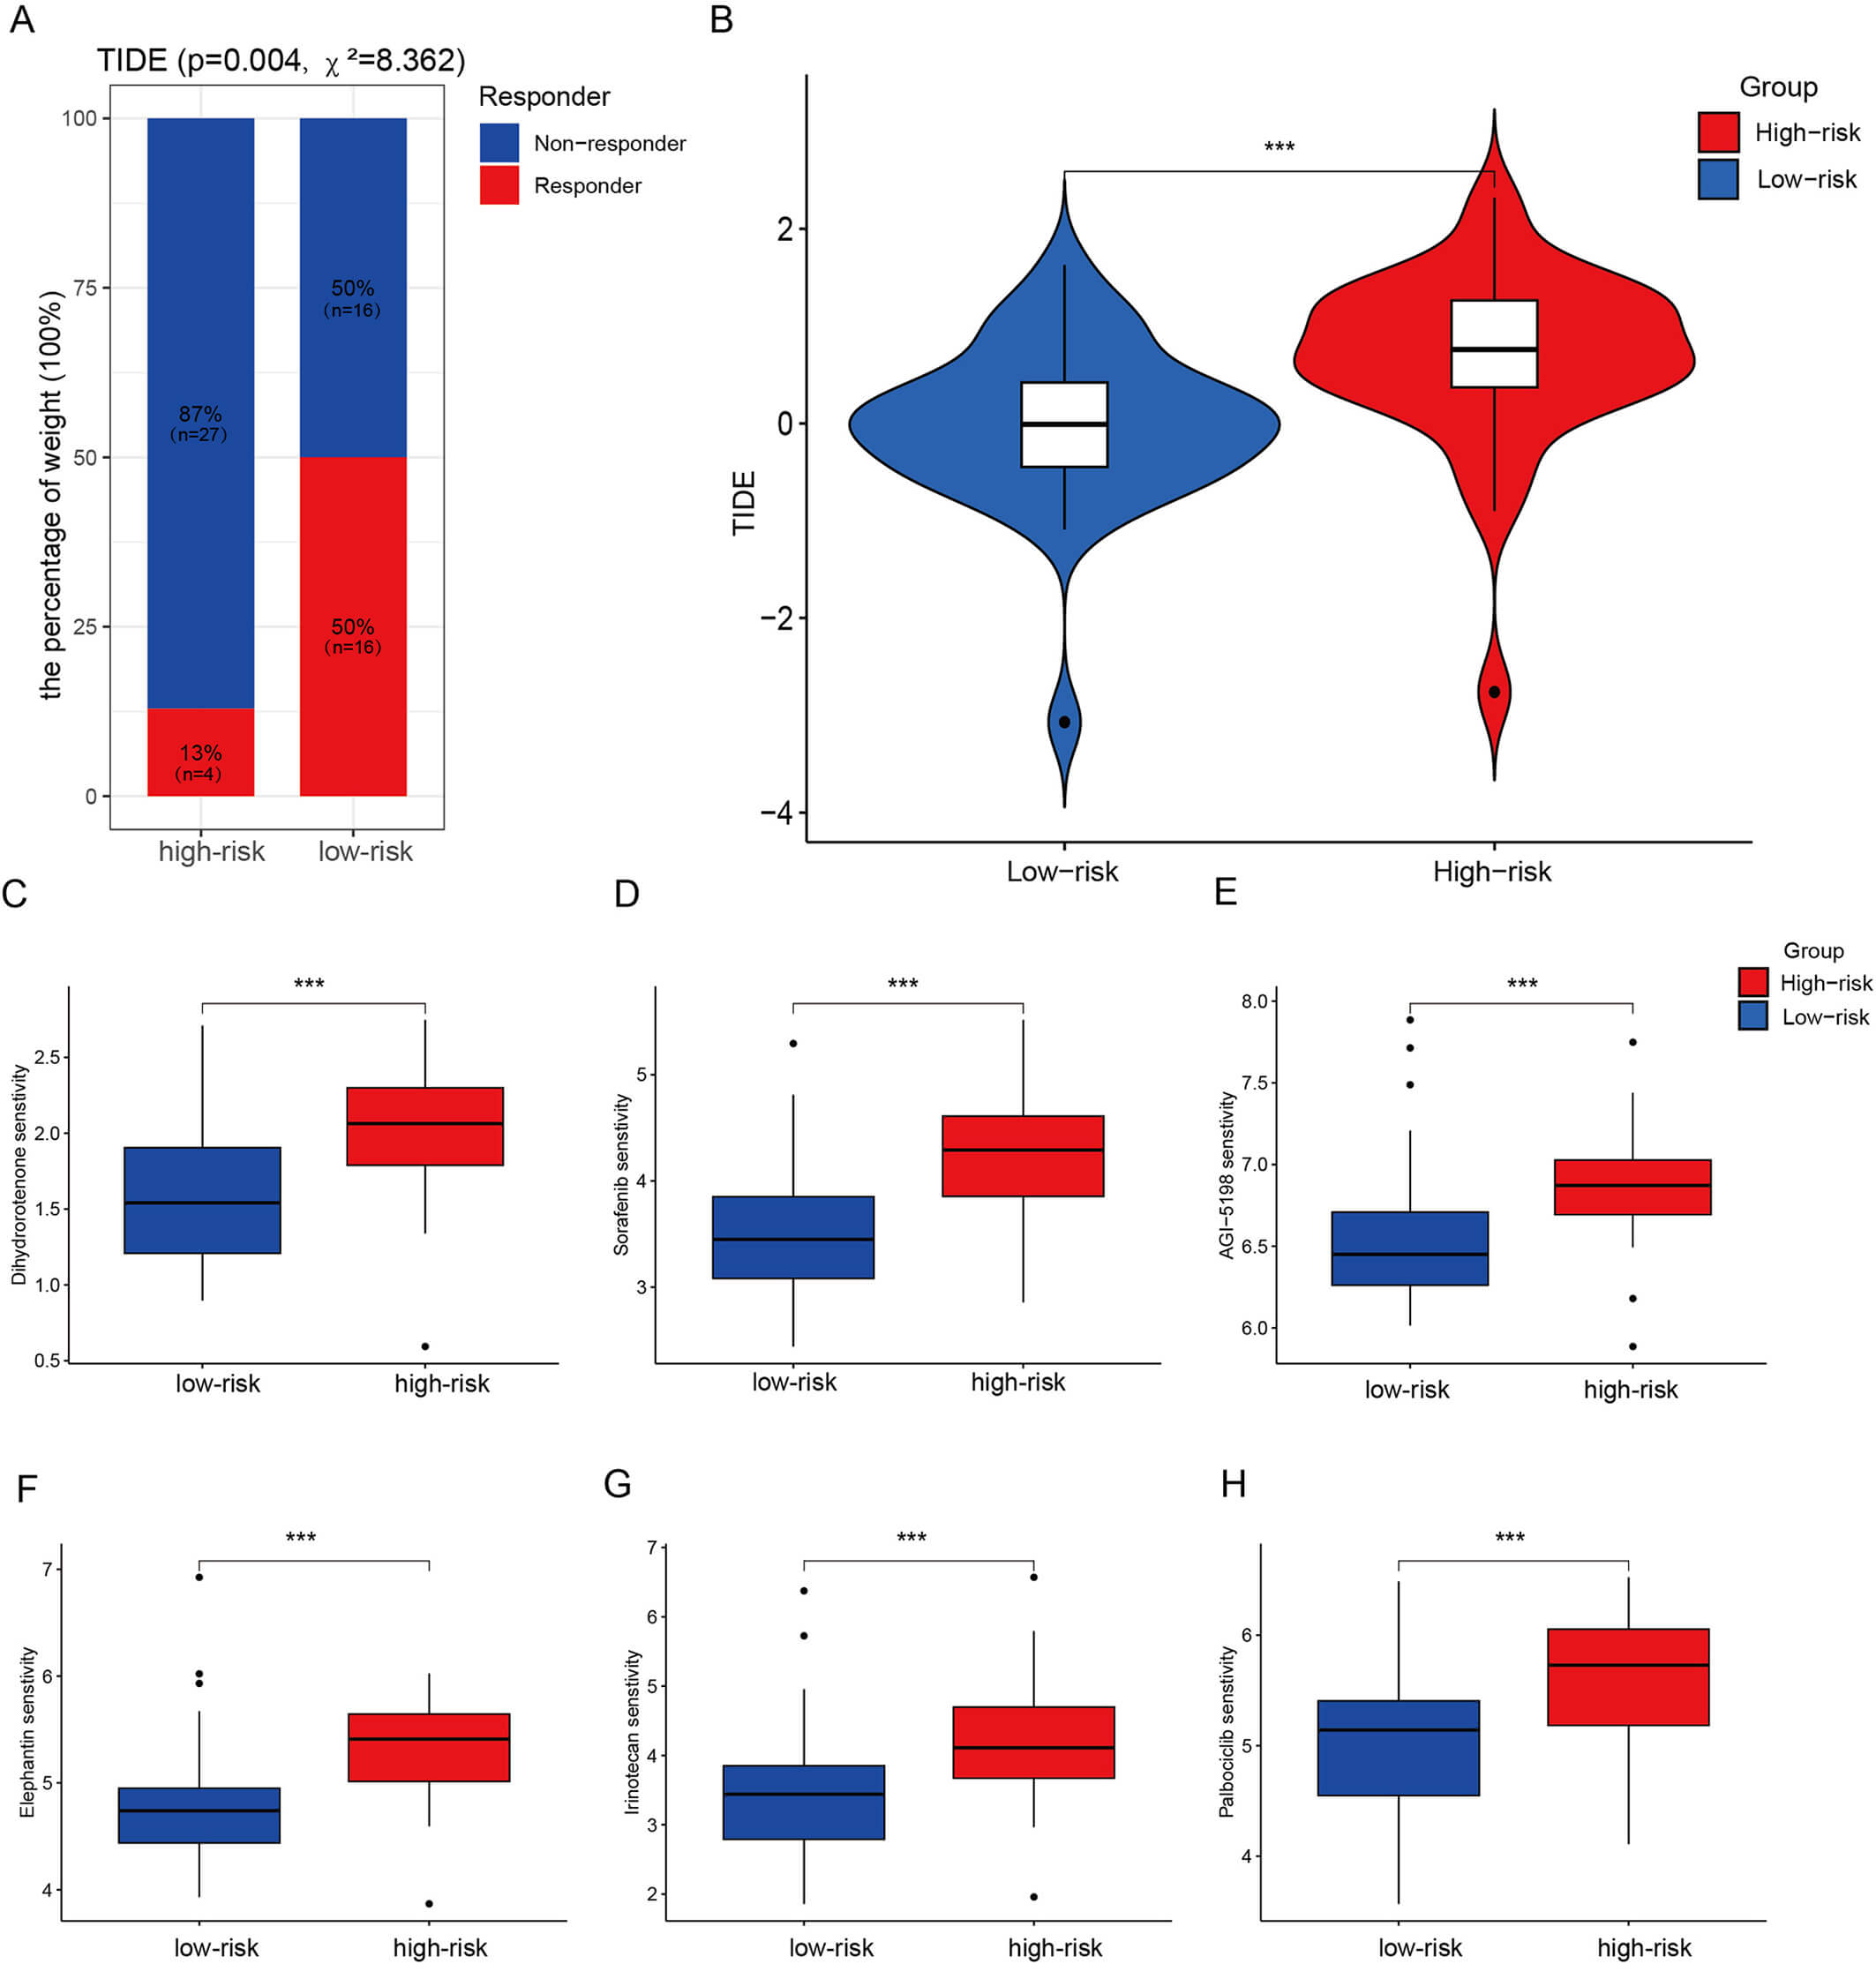 Fig. 5.
TIDE analysis and drug sensitivity analysis using risk models.
(A) Proportion of samples responding to immunotherapy in the high-risk (n = 31) and
low-risk (n = 32) groups in GSE57495 (n = 63) (p = 0.004, Chi-square test). (B)
TIDE scores in the high-risk (n = 31) and low-risk (n = 32) groups (p = 0.0035, Student’s
t-test). (C–H) Sensitivity analysis of drugs in the risk model. Box
plots show the estimated IC50 values for AGI-5198 (C, p
To determine whether the CAF-related genes included in the signature originated
primarily from CAFs, multidimensional validation was performed, including cell
line and scRNA-seq analyses. RNA-Seq data were collected from 47 fibroblast and
37 PAAD cell lines. As determined using the “limma” package (Fig. 6A) and
Wilcoxon tests (Fig. 6B), COL28A1 expression levels were significantly
lower and TGFB2, TGFBI, pLOD2, and COL22A1 levels were significantly higher in fibroblasts than in PAAD cell lines.
The two genes (TGFBI and PLOD2) showing the most significant
differences were selected for validation. The scRNA-seq analysis successfully
resolved four major cell populations (Fig. 6C): CD8+ T cells, fibroblasts,
malignant epithelial cells, and monocytes/macrophages. The fibroblast population
exhibited a prominent fibrotic gene expression signature. Specifically, the
collagen cross-linking enzyme gene PLOD2 showed a higher pctExpress in
fibroblasts than in other cell types (Fig. 6D,F). Similarly, the TGF-
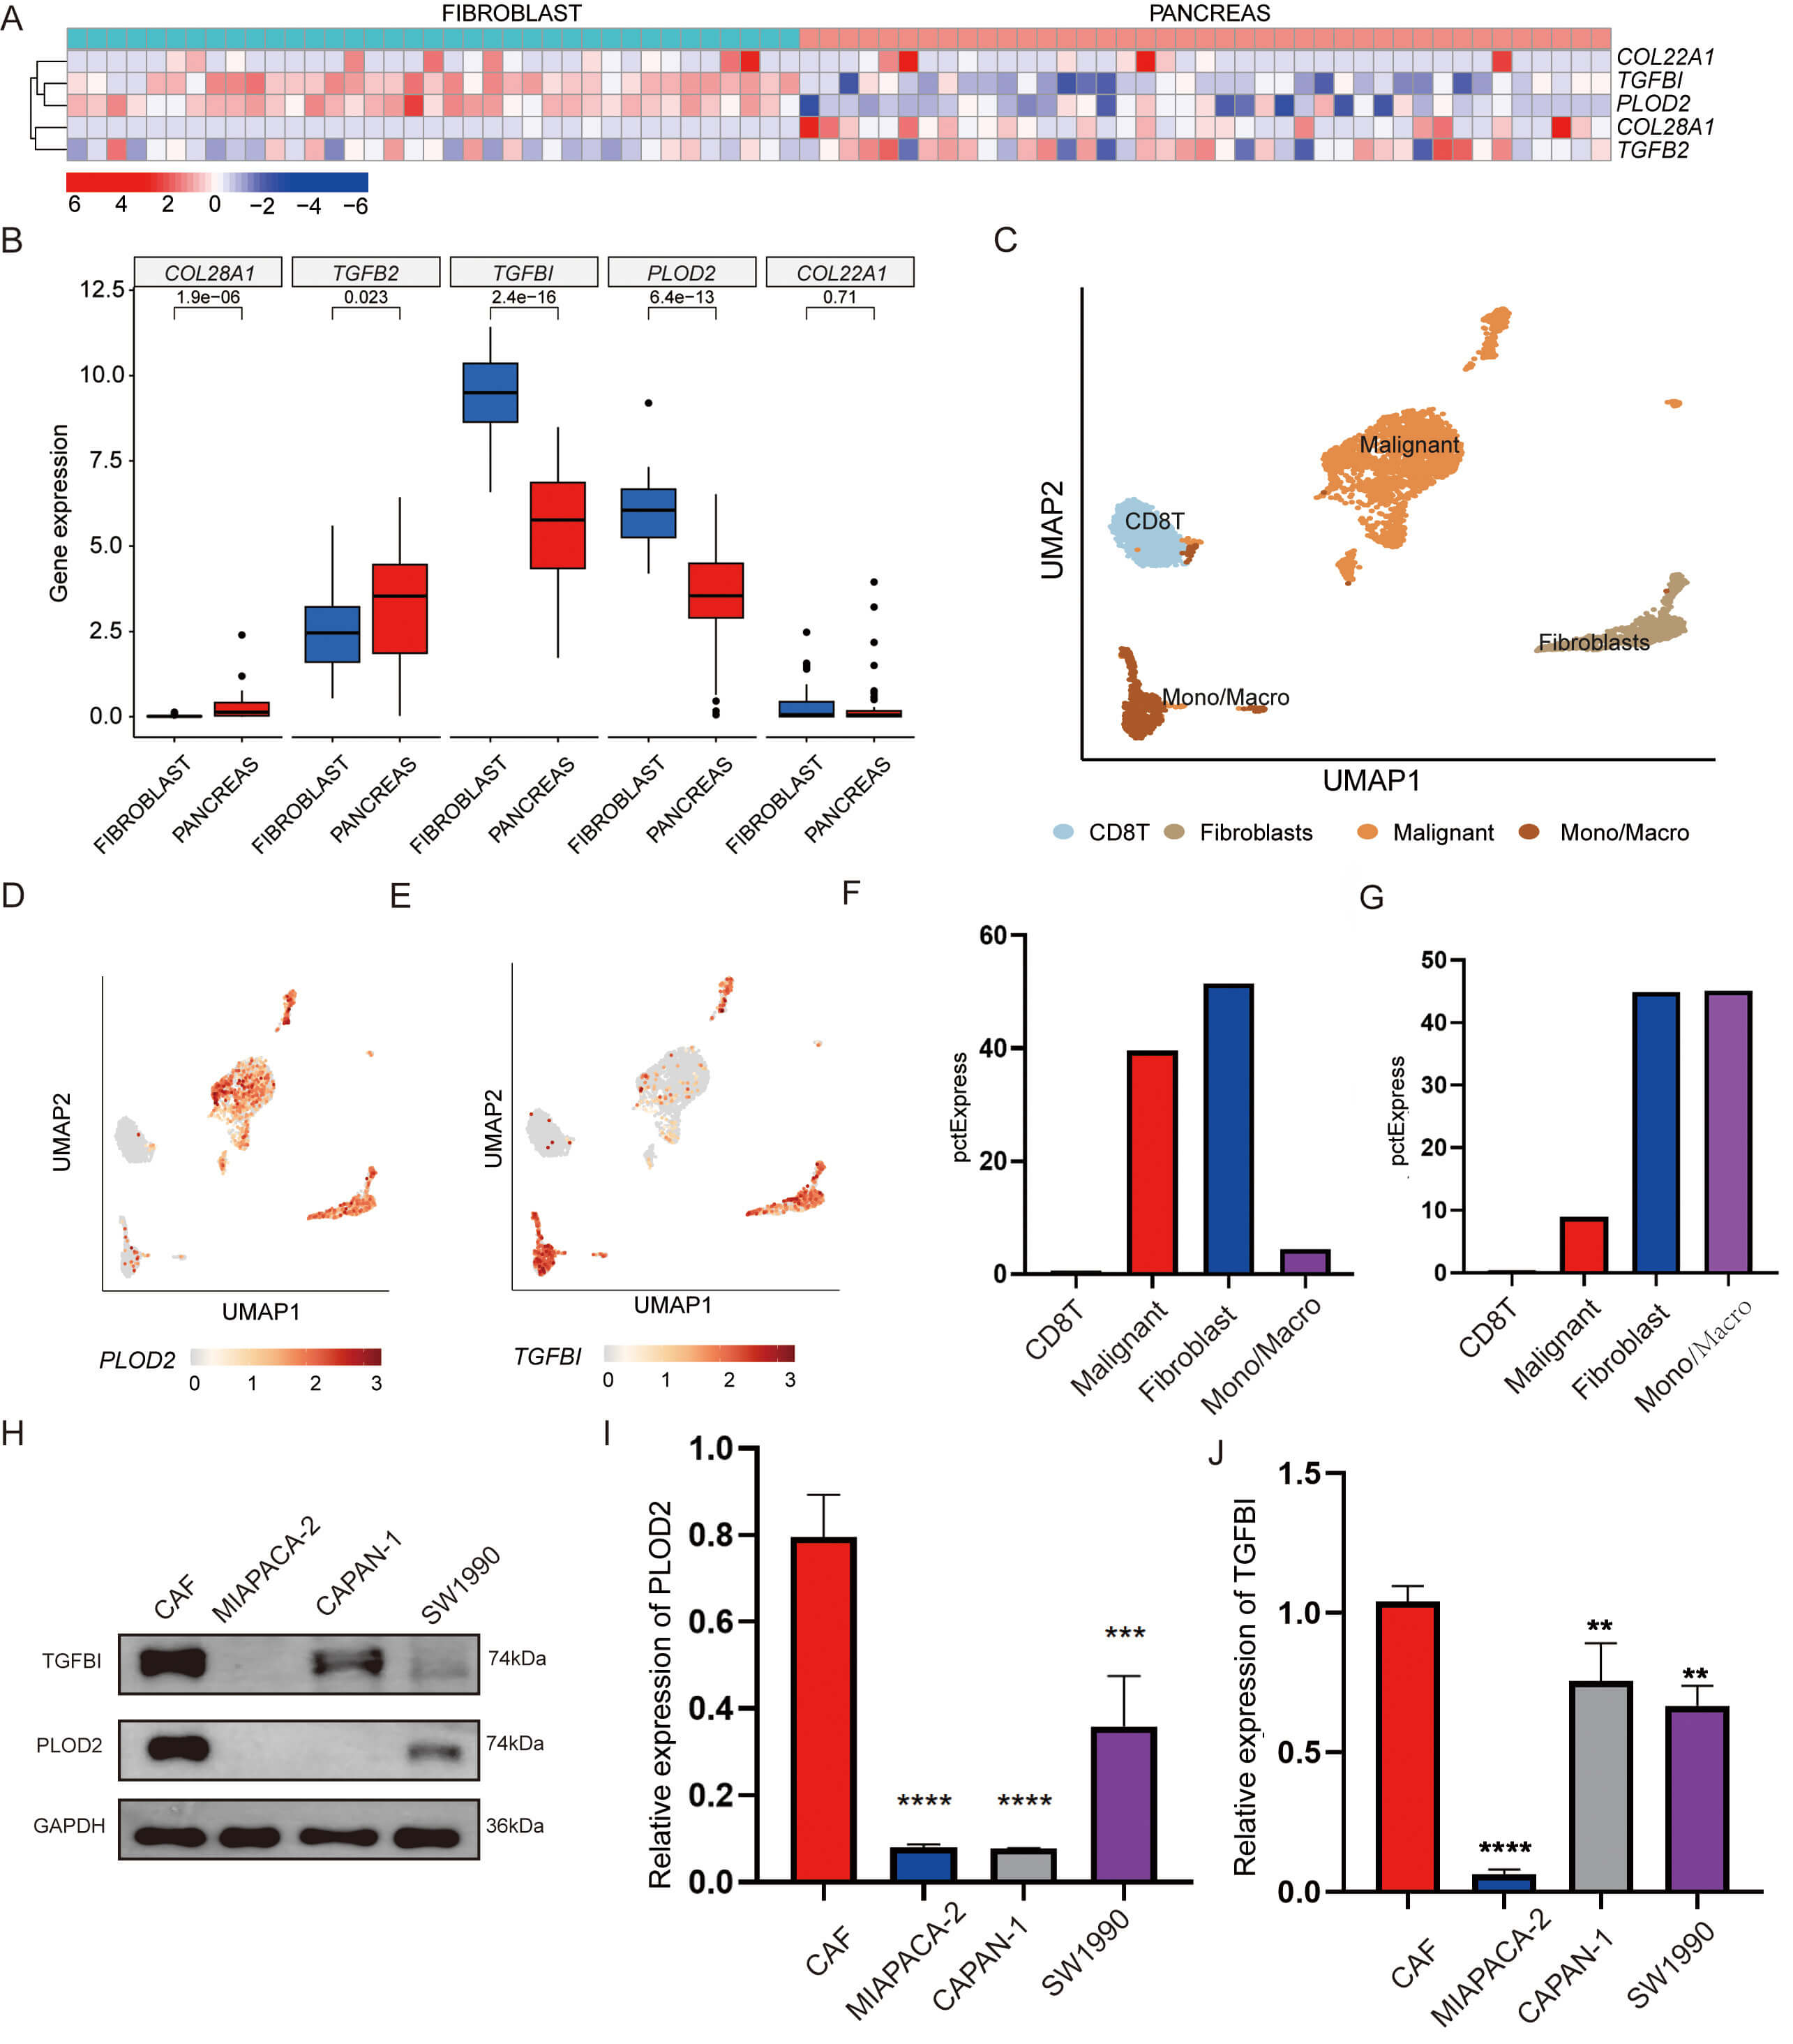 Fig. 6.
Multidimensional expression validation. (A) Heat map of
candidate gene expression in CAFs (n = 47) and PAAD cell lines (n = 37) from
CCLE. (B) Box plot of candidate gene expression in CAFs and PAAD cell lines.
p-values were calculated by the Wilcoxon test (COL28A1,
p
To validate the effect of CAF-derived PLOD2 on pancreatic cancer cells, sgRNAs
targeting PLOD2 (sg1-PLOD2 and sg2-PLOD2) were transduced into CAFs for
PLOD2 gene knockout. Fig. 7A shows the transfection efficiency. CAFs
were cultured in serum-free DMEM for 48 hours, and the collected supernatant (CM)
was co-cultured with pancreatic cancer cells (Fig. 7B). Colony formation assays
demonstrated that the CM from control CAFs (CON-CM) resulted in significantly
greater clonogenic survival and proliferation of CAPAN-1 and SW1990 pancreatic
cancer cells than those for the negative control (NC) medium (p
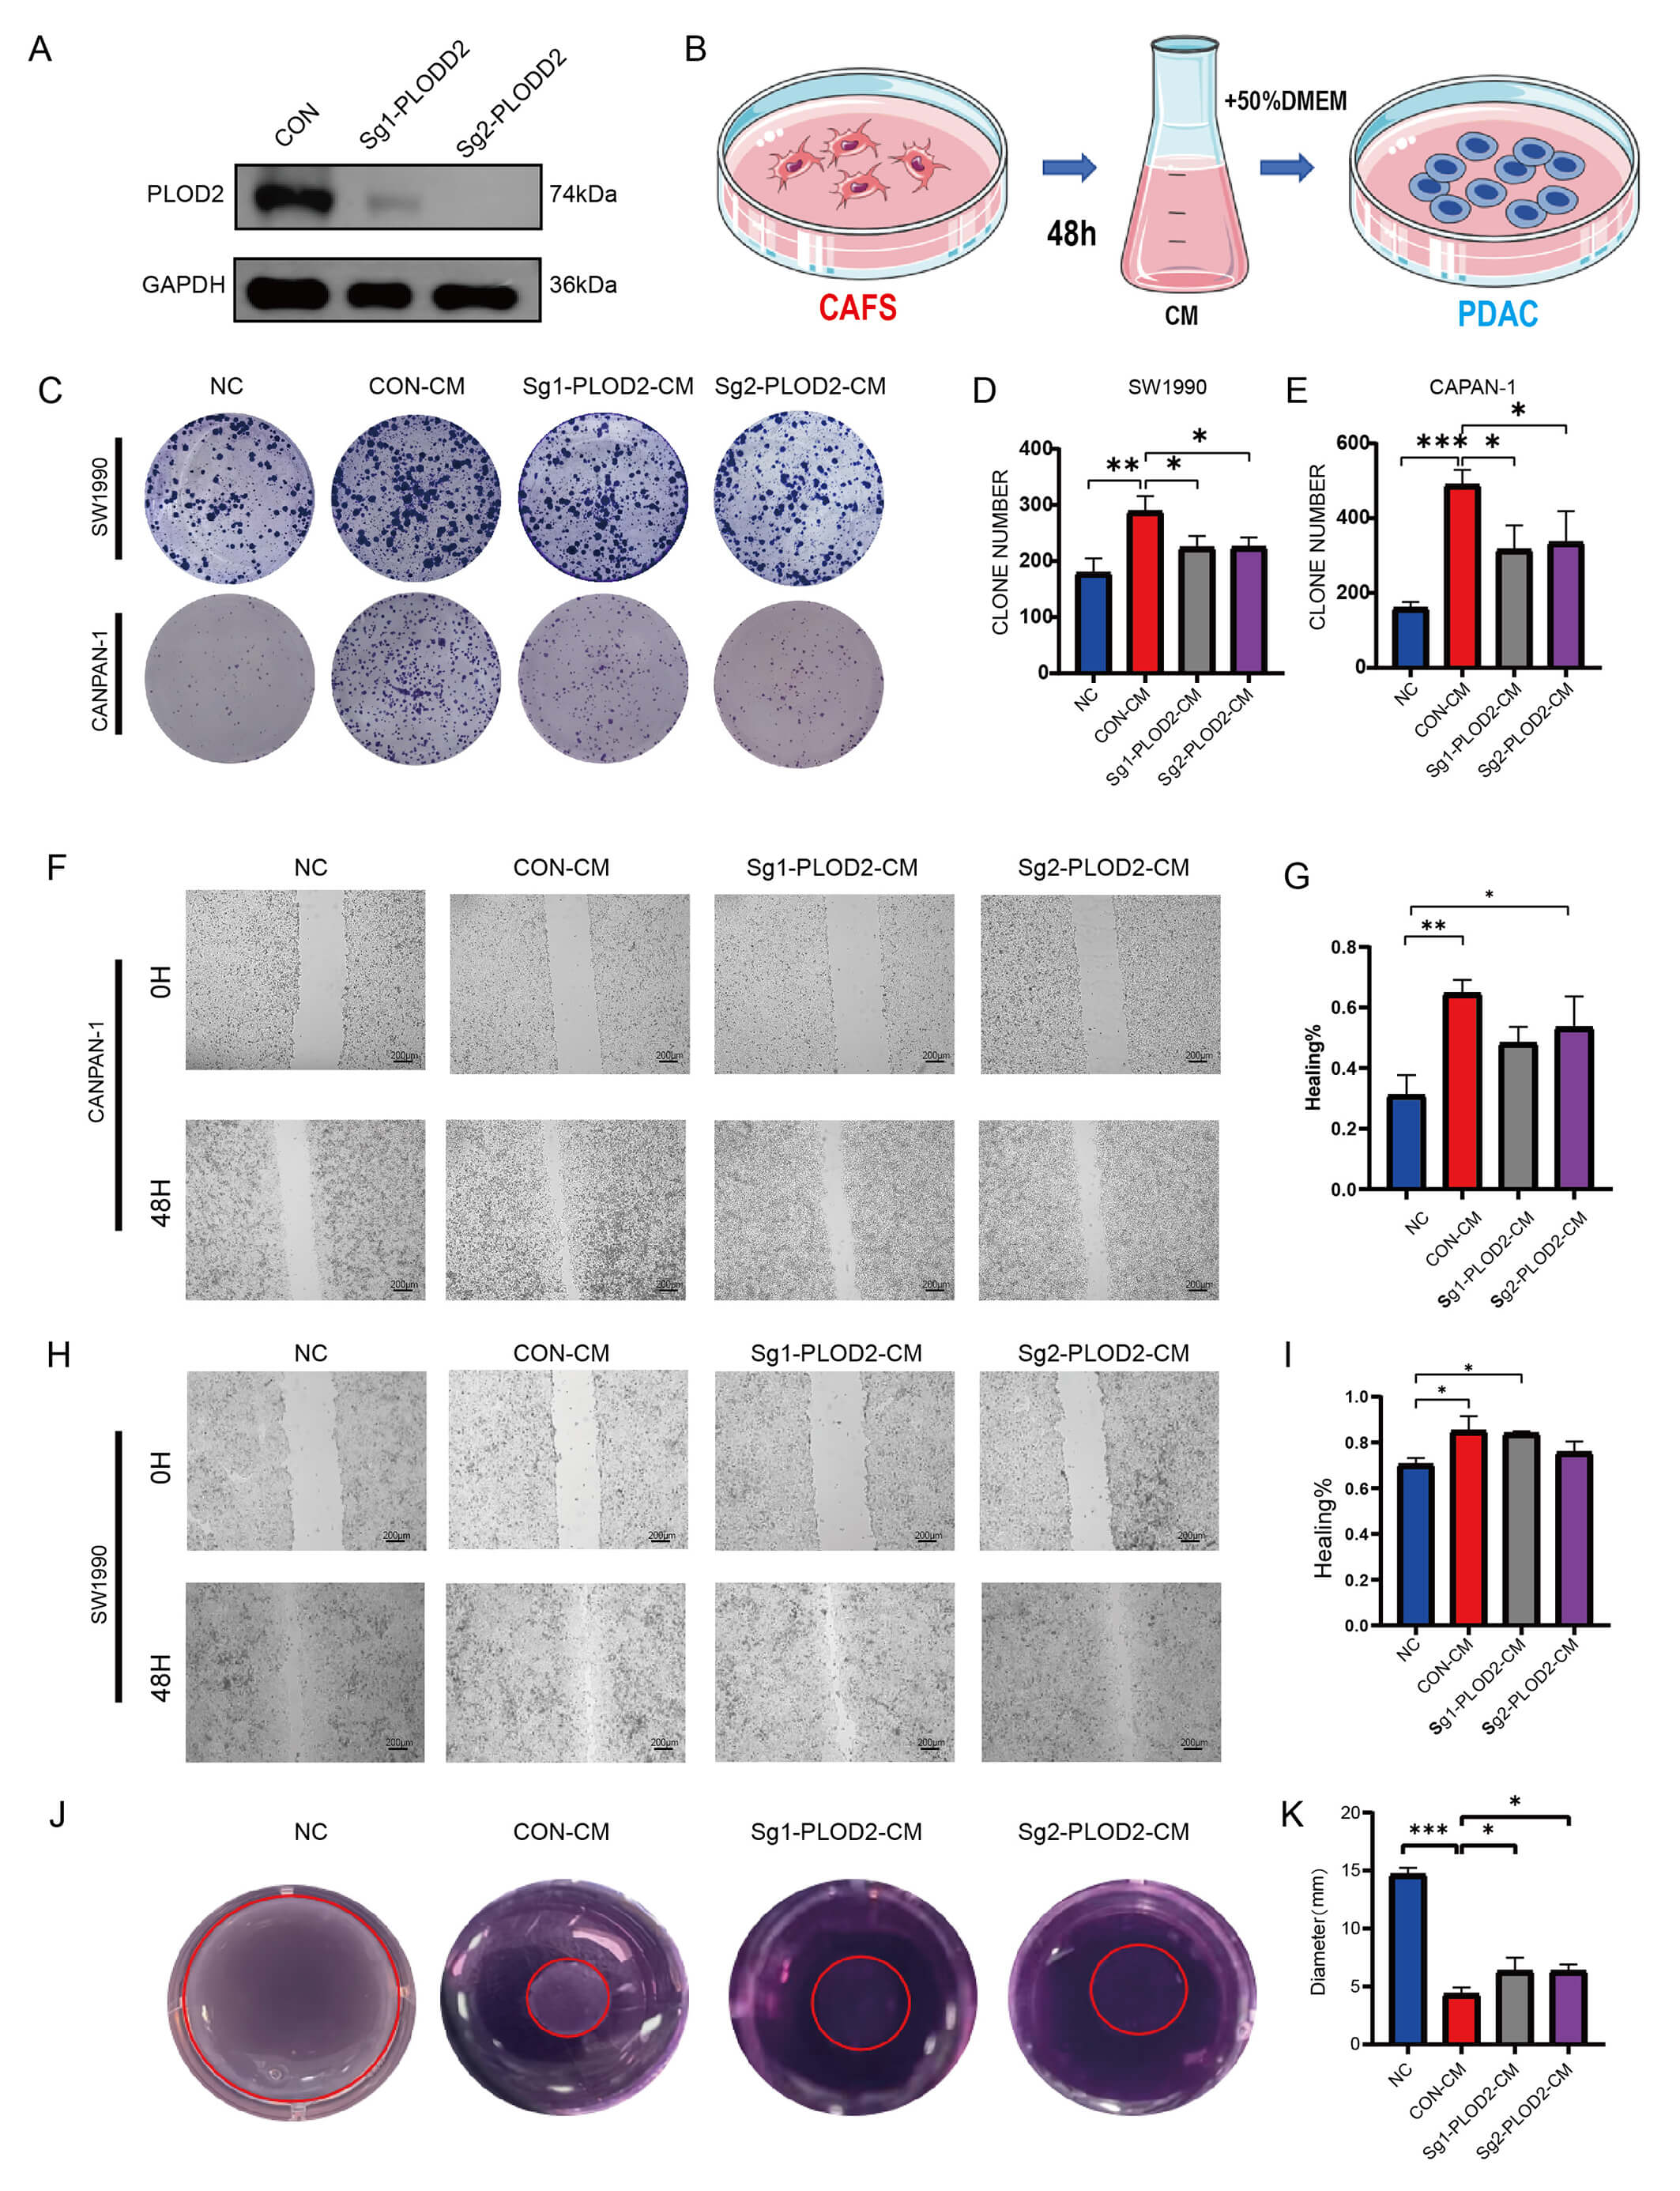 Fig. 7.
In vitro analysis of PLOD2. (A) Western blot showing
the PLOD2 knockout efficiency in CAFs. Two sgRNAs (sg1-PLOD2 and sg2-PLOD2) were
used. (B) Schematic diagram of the co-culture experiment. CAFs were cultured in
serum-free DMEM for 48 hours, and the conditioned medium (CM) was collected to
treat pancreatic cancer cells. (C,D) Colony formation assay of CAPAN-1 (n = 3)
(C) and SW1990 (D) cells treated with CM from control CAFs (CON-CM) or
PLOD2-knockout CAFs (sgPLOD2-CM). NC, negative control (fresh serum-free DMEM). *p
Pancreatic cancer, a malignancy with a dismal prognosis, is characterized by a TIME composed of dense ECM and extensive inflammatory cell infiltration. CAF enrichment within the TIME, which promotes tumor progression, is linked to poor patient outcomes [19]. The prognostic value of CAFs has been established in some cancers, such as hepatocellular carcinoma and ovarian cancer [20], highlighting their potential as therapeutic targets in PAAD.
Our results demonstrated that a high CAF-associated risk score and stromal score are correlated with worse OS in patients with PAAD and predict lower response rates to immunotherapy. This is likely attributable to the dense desmoplastic stroma and abundant immune cell infiltration typically accompanying high CAF scores, which collectively foster immune escape [21]. Although immunotherapy has achieved remarkable success in the treatment of various malignancies, patients with pancreatic cancer generally exhibit poor immune responses, partly because the dense ECM acts as a physical barrier [22]. As a crucial cellular component within the TIME, CAFs contribute to angiogenesis as well as tumor cell infiltration and metastasis [23]. Recent research underscores the key role of CAFs in shaping the immune landscape of the TIME by modulating the ECM-mediated anchoring and trafficking of immune cells and suppressing immune activation [24]. Yu et al. [25] revealed that CAFs promote tumor immune escape by affecting immune checkpoint activity through high CD73 expression. We stratified patients into high- and low-risk groups based on CAF-associated risk scores, revealing that the high-risk group possessed stronger immune escape potential and lower immunotherapy efficiency, confirming that CAFs affect immune evasion through multiple pathways.
We identified a panel of potential therapeutic agents targeting CAFs. For instance, dihydrorotenone, an inhibitor of mitochondrial electron transport chain complex I, effectively inactivates CAFs, thereby slowing the progression of transplanted gastric cancer in mice [26]. In triple-negative breast cancer, Zhang et al. [27] showed that dasatinib increases the permeability and therapeutic sensitivity of anti-PD-1 agents by modulating CAFs. These studies offer new perspectives for targeted PAAD therapy; however, the clinical efficacy of these agents requires further validation.
Through multidimensional analyses, we systematically elucidated the expression characteristics and functional mechanisms of key genes in PAAD CAFs. Using WGCNA, PPI analysis, and Cox/LASSO regression algorithms, we identified a signature based on five key genes (COL28A1, TGFB2, TGFBI, PLOD2, and COL22A1). Expression levels of TGFB2, TGFBI, PLOD2, and COL22A1 were significantly positively correlated with levels of established CAF markers, whereas COL28A1 showed a negative correlation. PLOD2 and TGFBI were expressed at particularly high levels in CAFs, providing novel insight into the molecular basis of CAF regulation in the PAAD microenvironment.
Among collagen family members, COL28A1 and COL22A1 exhibited distinct expression
patterns. Although COL28A1 expression was relatively low, its positive
correlation with CAF markers suggests an indirect regulatory role in TME
remodeling [28]. TGFBI was overexpressed in CAFs. As an ECM protein downstream of
the TGF-
Based on our CAF-associated risk stratification, we identified several potential therapeutic agents targeting CAFs. Dihydrorotenone (DHR), a mitochondrial complex I inhibitor, effectively inactivates CAFs and delays transplanted gastric cancer progression in mice [26]. This effect may be mediated by metabolic reprogramming, wherein DHR-induced mitochondrial dysfunction promotes CAF reversion to a quiescent state [36]. Similarly, dasatinib has CAF-targeting potential via ECM remodeling rather than direct cytotoxicity [27]. By reducing ECM production and collagen cross-linking, dasatinib alleviates matrix stiffness, enhances drug penetration, and promotes cytotoxic T lymphocyte infiltration into tumor cores [37]. These findings provide a mechanistic rationale for targeting CAFs to reprogram the fibrotic tumor microenvironment and overcome immunotherapy resistance in PAAD.
In functional experiments, the CM increased the proliferation and invasion of pancreatic cancer cells significantly. Crucially, this pro-tumorigenic effect was significantly attenuated upon PLOD2 knockout in CAFs, indicating a pivotal role for PLOD2 in CAF-mediated tumor progression. PLOD2, a member of the lysyl hydroxylase family, catalyzes the hydroxylation of lysine residues in collagen, promoting collagen fibril cross-linking and stabilization [38]. Our results provide experimental support that inhibiting PLOD2 in CAFs can disrupt their role in cancer cell aggressiveness. PLOD2 knockout reduces collagen cross-linking, altering the physical properties of the ECM and, consequently, diminishing its tumor-promoting effects, consistent with previous findings [39]. High PLOD2 expression enhances ECM rigidity and density and activates mechanosignaling pathways (e.g., YAP/TAZ) via increased matrix tension, promoting tumor cell infiltration and metastasis [40, 41]. Thus, PLOD2 promotes tumor progression through multiple mechanisms (ECM remodeling, mechanosignaling activation, and secretory regulation) and its knockout effectively inhibits these effects. Future studies should further investigate the downstream molecular networks.
This study clarifies the role of CAFs in pancreatic cancer; however, several limitations warrant acknowledgment. The use of public datasets with limited sample sizes may affect the reliability of the findings. Furthermore, the reliance on cell-based experiments, without in vivo confirmation, represented a constraint. The mechanisms by which PLOD2 remodels collagen remain unclear, and the efficacy and safety of promising drugs should be verified in living organisms. Future work should include larger patient cohorts, develop animal models for PLOD2 targeting, and advance promising treatments into clinical trials.
In conclusion, our study establishes a CAF-centric risk model that predicts patient survival and immunotherapy resistance in pancreatic cancer and identifies PLOD2 as a key stromal therapeutic target. The functional link between CAF-derived PLOD2 and tumor progression underscores the value of targeting the stromal compartment. This work provides a framework for developing stroma-directed combination therapies and emphasizes the need for further research focused on PLOD2 inhibition to overcome treatment resistance in PAAD.
The original contributions presented in the study are included in the article/Supplementary Material. Further inquiries can be directed to the corresponding author.
PC and WD performed the advanced bioinformatics analysis and wrote the manuscript. FC helped to verify the analysis results. ZS, EZ and DZ participated in the experimental design.XZ performed basic bioinformatics analysis of data. ML and FL assisted with lit erature retrieval and proofread the manuscript. HX took the lead in designing the study and overseeing the experimen tal framework. JR played a critical role in data analysis and drafting the manuscript. All authors contributed to editorial changes in the manuscript. All authors read and approved the final manuscript. All authors have participated sufficiently in the work and agreed to be accountable for all aspects of the work.
Not applicable. This study involved the analysis of existing, de-identified data from public repositories (GEO, STRING, CCLE) and experiments using commercially purchased cell lines. As such, it did not require ethical approval from an institutional review board.
We thank Liwen Bianji (Edanz) (www.liwenbianji.cn) for editing the English text of a draft of this manuscript.
This work was funded by the Anhui Province Science and Technology Innovation Tackle Plan Project (202423k09020009), the Graduate Research and Practice Innovation Project of Anhui Medical University (YJS20240022) and the National Natural Science Foundation of China (82073372).
The authors declare no conflict of interest.
Supplementary material associated with this article can be found, in the online version, at https://doi.org/10.31083/FBL46316.
References
Publisher’s Note: IMR Press stays neutral with regard to jurisdictional claims in published maps and institutional affiliations.