
 , Smaragdi Antonopoulou 1, Elizabeth Fragopoulou 1,*
1 Department of Nutrition and Dietetics, School of Health Sciences and Education, Harokopio University, 17676 Athens, Greece
Abstract
Platelet aggregation and inflammation play a crucial role in atherothrombosis. Wine contains micro-constituents of proper quality and quantity that exert cardioprotective actions, partly through inhibiting platelet-activating factor (PAF), a potent inflammatory and thrombotic lipid mediator. However, wine cannot be consumed extensively due to the presence of ethanol. Alternatively, winery by-products are abundant in similar-to-wine micro-constituents that could be used in food fortification and dietary supplements. Also, the vinification process produces millions of tons of by-products worldwide, posing an environmental matter of waste management. Therefore, the purpose of this literature review is to update the existing data concerning the in vitro anti-platelet and anti-inflammatory properties of winery by-product extracts and their possible health effects through controlled clinical trials in humans, specifically focused on their effects on PAF’s actions. Data from in vitro studies report that winery by-product compounds are able to inhibit platelet aggregation against several aggregation factors, as well as to downregulate inflammatory markers. Among their actions, extracts or phenolic compounds present in winery by-products inhibit PAF’s actions, a potent inflammatory and thrombotic mediator. Similar conclusions have been drawn from human supplementation studies, which suggest that winery by-product extracts may have beneficial biological effects on the cardiovascular system. Evidence from long-term studies shows that consumption may lower total and low density lipoprotein (LDL) cholesterol, improve insulin sensitivity, decrease lipid and protein oxidative damage, enhance antioxidant capacity, and have mild anti-inflammatory action toward reducing cytokine expression and levels. Data from the limited postprandial studies report that the acute consumption of winery by-product extracts improves glycemic response and reduces platelet reactivity to aggregatory stimuli. Although wine extracts and phenolic compounds have been reported to inhibit PAF’s actions and reduce the activity of its biosynthetic enzymes, no data exist concerning the influence of winery by-product extracts. In the future, additional long-term randomized controlled trials or postprandial studies are needed to draw definitive conclusions and establish a viable cardioprotective strategy that incorporates the sustainable use of winery by-products.
Keywords
- PAF
- winery by-products
- platelet aggregation
- inflammation
- oxidative stress
- cardioprotective effects
Atherosclerosis is a chronic arterial disease with clinical manifestations that include coronary heart disease, stroke and peripheral artery disease. Lipid storage in the arterial wall is gradually developed in atheromatous plaques, the rapture of which causes local thrombosis, leading to partial or total vascular blockage [1].
Oxidative, inflammatory and thrombotic mechanisms are crucial for the initiation
and the prolongation of atherosclerosis. The oxidative modification of
low-density lipoprotein cholesterol (LDL) is an important step in the initiation
of the plaque formation. In the first stages, the peroxidation of polyunsaturated
fatty acids (PUFAs) in LDL’s surface occurs and proceeds to the peroxidation of
core lipids, resulting in a various range of biologically active molecules
capable of activating endothelial cells, such as oxidized sterols, oxidized fatty
acids and oxidized phospholipids [2, 3]. Platelet-activating factor (PAF) is a
crucial inflammatory and thrombotic mediator, which is thought to play a key role
in the initiation and prolongation of atherosclerosis [4] and is a main
contributor to the pathogenesis of cardiovascular diseases [5]. Structurally, PAF
is a phospholipid and particularly a
1-
Many experimental data revealed that the atherogenic actions of oxidized LDLs
(ox-LDL) could be attributed to PAF and PAF-like lipids (oxidized phospholipids),
which render these molecules as the initiators of atherosclerosis [4, 7]. In early
stages of atherogenesis, oxidized phospholipids participate in the activation of
the immune system, while in late stages, they contribute to platelet aggregation
and plaque disruption [8]. Activated endothelial cells express several types of
adhesion molecules that are recognized by monocytes, which are recruited and
infiltrated into the subendothelial area. PAF triggers inflammatory response in
endothelial cells and at the same time activates blood cells through its specific
receptor (PAFR) which is a member of the G-protein-coupled seven-transmembrane
receptor superfamily. The interaction of PAF with its receptor leads to increased
endothelium permeability which is a crucial event in the initiation of
atherosclerosis [9]. Activated endothelial cells rapidly produce and display PAF
as well as P-selectin on their cell surface, which act as juxtacrine signals for
activation and adhesion of neutrophils and monocytes. Cytokines, such as tumor
necrosis factor-
Other pathophysiological conditions such as insulin resistance (in the presence
or absence of hyperglycemia) promote the risk for cardiovascular disease.
Atherosclerosis and plaque progression can be facilitated in an insulin resistant
state along with the presence of hyperglycemia, dyslipidemia, hypertension and
pro-inflammatory conditions. Impaired insulin signaling may also take place in
endothelial cells, macrophages and vascular smooth muscle cells, as these types
of cells express the insulin receptor [18]. In diabetic patients, PAFR is
up-regulated and hyperglycemia is associated with the downregulation of Sirtuin 1
(SIRT1) that can be abolished by the PAFR antagonist CV3988 [19]. PAF has also
been reported to contribute to the progression of non-alcoholic fatty liver
disease (NAFLD) through its ability to activate several signaling pathways
(5-hydroxytryptamine, inositol triphosphate, AA, diacylglycerol) that eventually
promote insulin resistance, inhibition of lipid
The beneficial properties of wine consumption were firstly established in 1979 when an inverse association between red wine consumption and cardiovascular disease mortality was reported [21]. The term “French Paradox” was initially established in 1992, leading to the escalation of scientific research concerning wine consumption. The term describes the epidemiological observation that the French had relatively low incidence of coronary heart disease despite their rich-in saturated fatty acids diet and despite the presence of similar risk factors with other populations [22]. The J-shaped association between moderate wine consumption and stroke incidence as well as cardiovascular mortality has been stated in a meta-analysis. In contrast, the above study found a weaker association concerning beer consumption and cardiovascular disease and no association for other alcoholic beverages [23]. More recently, a meta-analysis has confirmed the protective effects of wine consumption regarding all-cause mortality as opposed to alcohol consumption from non-wine sources [24].
According to scientific literature, the beneficial effects of wine consumption are mainly attributed to its bioactive compounds. In this area, our previous studies revealed that wine contains potent micro-constituents that exert anti-platelet effects and among other actions, reduce PAF-induced platelet aggregation and PAF biosynthetic enzymes activities in leukocytes both in vitro and in vivo [25, 26, 27, 28]. Nevertheless, the fact that wine contains ethanol should be taken into consideration since excess ethanol consumption is detrimental for health through various mechanisms. A recent meta-analysis reported that all-cause mortality is highly associated with ethanol consumption and concludes that concerning alcohol consumption, “the risk of all-cause mortality, and of cancers specifically, rises with increasing levels of consumption, and the level of consumption that minimizes health loss is zero” [29]. However, the same group 4 years later, based on new statistical models modulated their statement to “there is strong evidence to support recommendations on alcohol consumption varying by age and location” [30]. Also, it should be mentioned that they did not take under consideration the type of alcohol consumed or the frequency of drinking during the week. There are data supporting that regular moderate wine consumption is not associated with negative effects and in some cases, especially cardiovascular diseases, it is associated with positive outcomes [31, 32].
Considering the above data and the existence of phenolic compounds in wine, several researchers have focused on the health effects of individual phenolic compounds, such as resveratrol, in the form of dietary supplements [33, 34]. However, wine is a complex mixture of compounds and its health benefits may be attributed to the co-existence of other micro-constituents apart from phenolic compounds. Due to existing evidence, it can be hypothesized that wine contains a micro-constituent’s mixture in proper quality and quantity that provide cardiovascular protection through synergistic action. This hypothesis is supported by the fact that individual phenolic compounds do not or exert weaker biological actions compared to their mixtures or wine extracts [35].
On the other hand, it should be noted that the isolation process of these beneficial wine micro-constituents is non-profitable from an economic aspect. Alternatively, winery by-products are cheap and rich-in similar-to wine constituents sources. Especially, during the vinification process of red grapes, the grape skins and seeds are present in the must, which is fermented for a significant amount of time. Many beneficial micro-constituents are being transferred to wine and yet, the by-products are still an abundant-in bioactive compounds source. The vinification process produces millions of tons of by-products which also poses an environmental matter of waste management. In this direction, their sustainable use is highly considered [36].
Winery by-products consist of grape pomace (GP) (seeds and skins), stems, leaves and lees. Several environmental factors (such as grape variety, cultivation) as well as grape processing procedures can affect the chemical composition of winery by-products. Grapes are subjected to various invasive processing stages, yet, their chemical composition concerning bioactive compounds is not significantly altered [37].
Phenolic acids contain benzoic and cinnamic acid derivatives, with hydroxycinnamic acids being the largest subcategory in winery by-products. These molecules are usually bound to glycosylated derivatives, shikimic, quinic or tartrate acid esters. Gallic acid is the most frequent hydroxybenzoic acid derivative in stems, skin and seeds, syringic acid in stems and procatechuic acid in grape pomace. Hydroxycinnamic acids are present in grapes and especially in skins. Mainly, caftaric and coutaric acid are found in white grape skins, whereas chlorogenic acid is found in red grape skins [38]. The relative amount of phenolic acids is also dependent on the extraction solvent. In our previous study, the aqueous ethanolic GP extract contained mainly vanillic acid, gallic acid, syringic acid, salicylic acid and p-coumaric acid [39].
Flavonoids refer to a group of compounds composed by low molecular weight molecules, with a structure of 15 carbon atoms. Winery by-products’ flavonoids are integrated by flavonols, flavanols, anthocyanins and proanthocyanidins [40]. Flavonols are characterized by the existence of a double bond between C2 and C3 carbons and a hydroxyl group at C3 carbon. Different sugars can be connected to flavonols resulting in glucosides, galactosides and diglucosides. In red variety stems, quercetin is abundant in the form of quercetin-3-glucoronide, -3-glucoside, -3-galactoside and -3-ramnoside. Red and white varieties express a similar compounds profile and the red varieties have higher concentrations of these molecules [38]. Flavanols have a hydroxyl group in the C3 carbon and no carbonyl group in the C4 carbon and they are the main substances responsible for the astringency of wine. Catechin is the main molecule in both red and white varieties and its concentration appears to be 4-fold higher than epicatechin [40]. Anthocyanins are responsible for the color of red grapes and wine and they possess an aromatic ring (A) bound to a heterocyclic ring (C) that contains oxygen, which is bound to a third aromatic ring (B). The aromatic ring B is bound to sugars or organic acids and is responsible for the different colors of anthocyanins. Malvidin-3-glucoside and peonidin-3-glucoside are the most abundant anthocyanins found in grape skins [37, 38]. Condensed tannins or proanthocyanidins consist of flavanol monomer subunits and their structures vary depending on the subunits compounds, the polymerization degree and the coupling sites. Regarding red varieties the most frequent proanthocyanidin is procyanidin B3, whereas in white varieties is procyanidin B1. Procyanidins are mostly present in white varieties compared to the red ones and especially in stems compared to skin and seeds [38]. In accordance with the aforementioned, we have shown that an aqueous ethanolic GP extract contained mainly catechin, epicatechin, quercetin and malvidin-3-glucoside [39].
Stilbenes are phenolic compounds with two aromatic rings attached to an ethylene bridge. They are mostly found in grape skins and also in stems and seeds. Grapes produce stilbenes for protection from ultraviolet (UV) radiation [38]. Resveratrol is the most common stilbene and in our previous study we confirmed its existence in an aqueous ethanolic GP extract from red varieties. Tyrosol and hydroxytyrosol that belong to the simple phenolic compounds category were also detected in the above aqueous ethanolic extract [39].
The aim of this review is to update the existing data concerning the in vitro anti-platelet and anti-inflammatory properties of winery by-product extracts as well as their possible health effects through controlled clinical trials. Especially, focus is given on the potent inflammatory and thrombotic lipid mediator PAF.
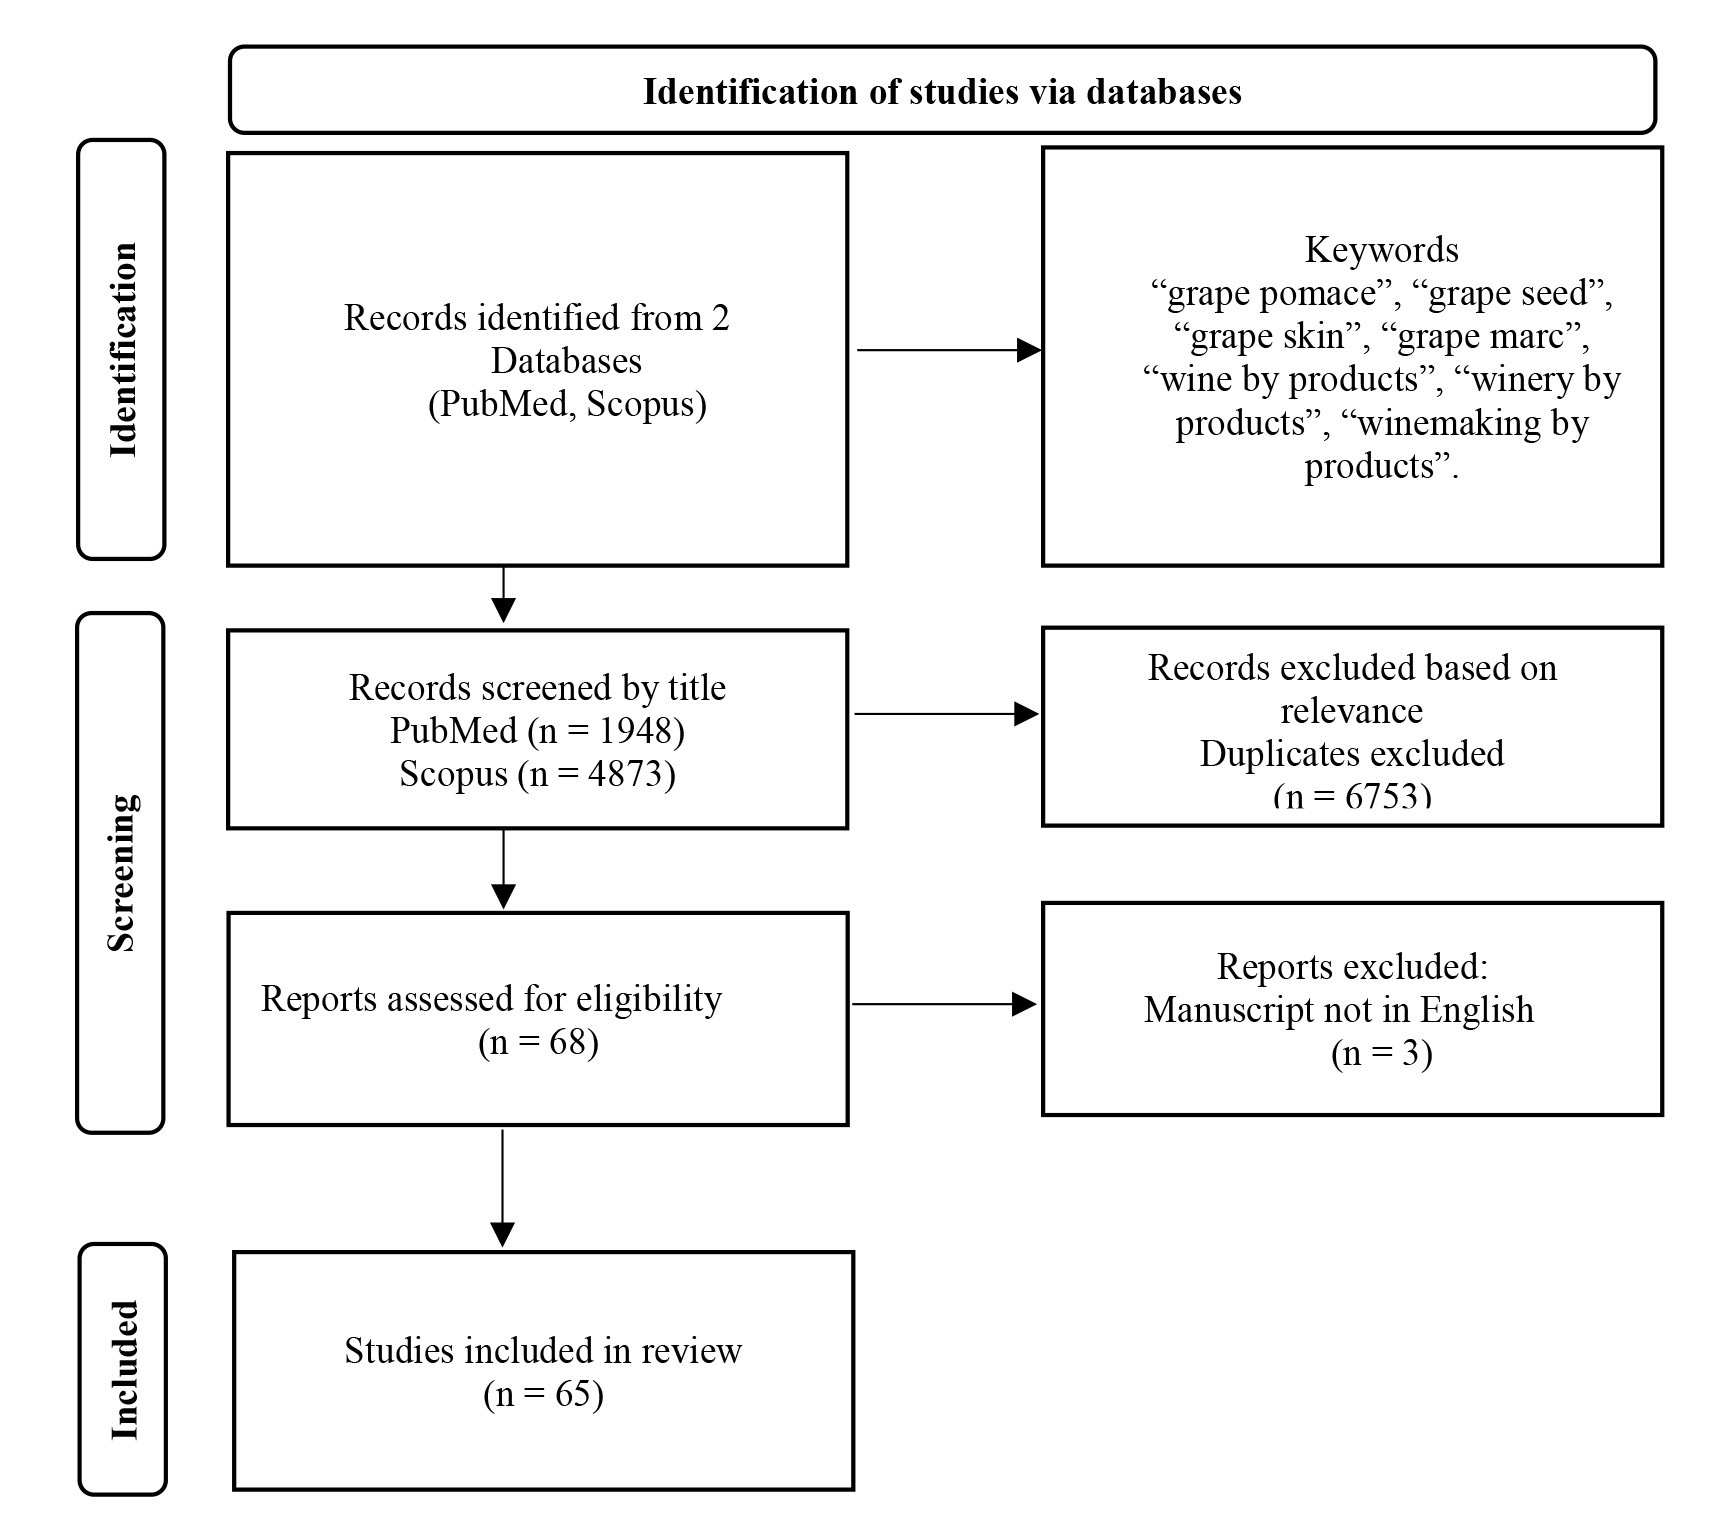
The PubMed and Scopus databases were reviewed from 2000 up to December 2023, using the following keywords: “grape pomace”, “grape seed”, “grape skin”, “grape marc”, “wine by products”, “winery by products”, “winemaking by products”. The search yielded 1948 publications from the PubMed database and 4873 items from the Scopus database. The titles of the studies were screened and the appropriate ones were reviewed and included in the manuscript. Additional searches were also carried out using keywords suitable for each individual table of studies. The flowchart of the literature search is presented in Fig. 1.
 Fig. 1.
Flowchart of the literature search.
For the in vitro anti-platelet actions, the search focused on human platelet aggregation studies using winery by-product extracts. For the in vitro anti-inflammatory actions, studies where human cells (mostly cell lines) were incubated with winery by-product extracts and inflammatory proteins or signal transduction molecules were evaluated, were included. Cell proliferation, cytotoxicity and cell migration assays were out of the scope of this review. Also, controlled clinical studies that administered winery by-product extracts in the form of dietary supplements in human subjects were included in this review. Outcomes including effects in weight management, satiety and hematological markers were not included.
The studies examining the in vitro anti-platelet effects of winery by-products (Table 1, Ref. [39, 41, 42, 43, 44, 45, 46, 47, 48, 49, 50, 51]) have used human washed platelets, whole blood or platelet-rich plasma (PRP) against several aggregation factors. The winery by-product extracts examined, were mostly dietary supplements from grape skins (GSK) or/and seeds (GS). In this context in our previous study GP extracts from four red grape varieties (Sour Black, Syrah, Cabernet Franc, Cabernet Sauvignon) were prepared using different solvents and were tested for their ability to inhibit platelet aggregation (in PRP) against several agonists. The results indicated that the extracts’ anti-platelet effect was not grape-variety dependent, whereas the solvent used for the extraction that determines the extracted micro-constituents was the crucial factor. In specific, the aqueous ethanolic GP extracts exhibited more potent anti-platelet action compared to the lipoid extracts using the Bligh-Dyer method, while the aqueous and the hexanoic extracts exhibited no anti-platelet effect [39]. In our early studies [25, 26], potent anti-platelet actions against PAF were reported in the wine lipid extracts using the Bligh and Dyer method. However, this method utilizes chloroform and methanol, which are not suitable solvents for products consumed by humans. Therefore, the discovery of potent inhibitors of platelet aggregation in aqueous ethanolic extracts is promising for the development of dietary supplements and food enrichment.
| Type of extract | Platelet sample | Aggregation factors | Experimental procedures | Results | Ref |
| GS | WB | Collagen | WP pre-incubation (5 min) in the absence of extracts or with: | 12.7% inhibition (100 µg/mL GS) | [49] |
| GSK | - GS (50–100 µg/mL) | 40.5% inhibition (50 µg/mL GS + 250 µg/mL GSK) | |||
| - GSK (250–500 µg/mL) | 96.5% inhibition (100 µg/mL GS + 500 µg/mL GSK) | ||||
| - GS (50 µg/mL) + GSK (250 µg/mL) | |||||
| - GS (100 µg/mL) + GSK (500 µg/mL) | |||||
| GS | WP | TRAP | WP pre-incubation (30 min) in the absence of extracts or with: | 36% inhibition (100 µg/mL GS) | [48] |
| GSK | - GS (50–100 µg/mL) | 50% inhibition (250 µg/mL GSK) | |||
| - GSK (250–500 µg/mL) | 64% inhibition (500 µg/mL GSK) | ||||
| - GS (50 µg/mL) + GSK (250 µg/mL) | 60% inhibition (50 µg/mL GS + 250 µg/mL GSK) | ||||
| - GS (100 µg/mL) + GSK (500 µg/mL) | 74% inhibition (500 µg/mL GS + 100 µg/mL GSK) | ||||
| GS | WP | Thrombin | WP pre-incubation (5 min) in the presence or absence of extracts (5, 7.5, 10, 25 and 50 µg/mL) | IC50 = 24 µg/mL | [44] |
| GS | WP | Thrombin | WP pre-incubation (1 min) in the presence or absence of extracts (0.5, 5, and 50 mg/mL) | IC50 TRAP = 50 µg/mL | [45] |
| TRAP | IC50 thrombin = 25 µg/mL | ||||
| GS | WP | Thrombin | WP pre-incubation (5 min) in the absence of extracts or with: | GS 10 µg/mL: | [47] |
| - GS (2.5–10 µg/mL) | 43.6% inhibition (reduced homocysteine assay) | ||||
| - GS (2.5–10 µg/mL) + reduced D, L-homocysteine (100 µM) | 42.1% inhibition (thiolactone assay) | ||||
| - GS (2.5–10 µg/mL) +D, L-homocysteine thiolactone (1 µM) | |||||
| GS | WP | Thrombin | WP pre-incubation (10 min) in the presence or absence of extracts (0.5, 5, and 50 mg/mL) | IC50 = 5 µg/mL | [46] |
| GS | WP | ADP | HUVECs pre-incubation (24 h) in the presence or absence of extract (1, 2.5, 5, 10 mg/mL) | GS 1 µg/mL: 15% inhibition in the expression of the activated form of GPIIb/IIIa compared to platelets incubated with untreated HUVECs | [41] |
| WP pre-incubation with HUVECs (10 min) | |||||
| GS | WP | Collagen | WP pre-incubation (5 min) in the presence or absence of extracts (1, 5, 10, 50 µg/mL) | IC50 Collagen = 10 µg/mL | [51] |
| TRAP | IC50 TRAP = 10 µg/mL | ||||
| GS | WB | ADP | WB pre-incubation (15 min) in the presence or absence of extract (7.5 or 15 µg GAE/mL) | 7.5 µg GAE/mL: 19.4% AUC inhibition | [42] |
| 15 µg GAE/mL: 38.9% AUC inhibition | |||||
| GP | PRP | PAF | PRP pre-incubation (5 min) in the presence or absence of extracts (aqueous-ethanolic GP extracts, lipoid GP extracts) | Aqueous-Ethanolic extracts: | [39] |
| ADP | IC50 PAF = 162.1 |
||||
| TRAP | IC50 ADP = 181.2 |
||||
| IC50 TRAP = 156.3 |
|||||
| Lipoid extracts (Bligh-Dyer method): | |||||
| IC50 PAF = 280.9 |
|||||
| IC50 ADP = 293.2 |
|||||
| IC50 TRAP = 284.8 |
|||||
| GP | PRP | ADP | PRP pre-incubation (3 min) in the presence or absence of extracts (1 mg/mL) | Petit Verdot GP: | [43] |
| TRAP | 67.1% inhibition of ADP-induced and 53.2% inhibition of TRAP-induced platelet aggregation | ||||
| GSK | PRP | PAF | PRP pre-incubation in the presence or absence of extracts | Muscat GSK IC50 = 19.7 µM GAE | [50] |
| Augoustiatis GSK IC50 = 26.6 µM GAE |
ADP, adenosine diphosphate; GAE, gallic acid equivalents; GS, grape seed; GSK, grape skin; HUVEC, human umbilical vein endothelial cell; IC50, half maximal inhibitory concentration; PAF, platelet activating factor; PRP, platelet rich plasma; TRAP, thrombin receptor activating peptide; WB, whole blood; WP, washed platelets; GP, grape pomace; AUC, area under the curve.
ADP as an aggregation factor was used in four studies. Luzak et al.
[41] reported that 1 µg/mL of extract exhibited weak anti-platelet action
as it failed to inhibit platelet aggregation above 15%. Bijak et al.
[42] examined an extract at 15 µg gallic acid equivalents (GAE)/mL which
reduced the area under the curve (AUC) by 38.9%. Out of the nine grape varieties
examined by another group, only the Petit Verdot GP extract significantly
inhibited platelet aggregation against ADP by 67.1% [43]. In our previous study,
the aqueous ethanolic GP extracts exhibited more potent action against ADP
compared to the lipoid extracts (Bligh-Dyer method), with half maximal inhibitory
concentration (IC50) values being 181.2
Thrombin was used in four studies and the GS extracts’ IC50 values ranged
between 5–25 µg/mL [44, 45, 46, 47]. Malinowska et al. [47] examined a
hyperomocysteine state in healthy subjects’ washed platelets and reported
inhibition of platelet aggregation by the extracts’ compounds. Thrombin receptor
activating peptide (TRAP) was also used as an aggregatory factor with IC50values ranging between 10–1000 µg of GS/ GP extract/mL. Also, the aqueous
ethanolic GP extracts inhibited platelet aggregation more effectively against
TRAP compared to the lipoid extracts (Bligh-Dyer method) as the IC50 values
revealed: 156.3
The synergistic action between the GS and GSK constituents is also observed in the study of Shanmuganayagam et al. [49] where collagen, as agonist, was used. Specifically, the combination of the two extracts, at concentrations where each one separately did not cause inhibition of platelet aggregation, led to a 40.5% inhibition of platelet aggregation [49].
PAF, apart from its pro-inflammatory actions, is considered a potent platelet agonist. High PAF levels, acting through its specific plasma membrane receptor (PAFR), enhance both inflammation and thrombosis. Indeed, the ex vivo platelets response to PAF or the in vitro inhibition of PAF-induced platelet aggregation, aside from estimation of the anti-platelet ability, is considered as an indirect method to estimate PAF’s actions in organism and bioactive compounds’ anti-inflammatory action [4]. We have shown that GP extracts inhibited PAF-induced platelet aggregation, with the aqueous ethanolic extracts being more potent inhibitors compared to the lipoid ones (Bligh-Dyer method) [39]. In another research study, GSK extracts from different grape varieties also inhibited PAF-induced platelet aggregation with IC50 values ranging between 19.7–26.6 µM GAE [50].
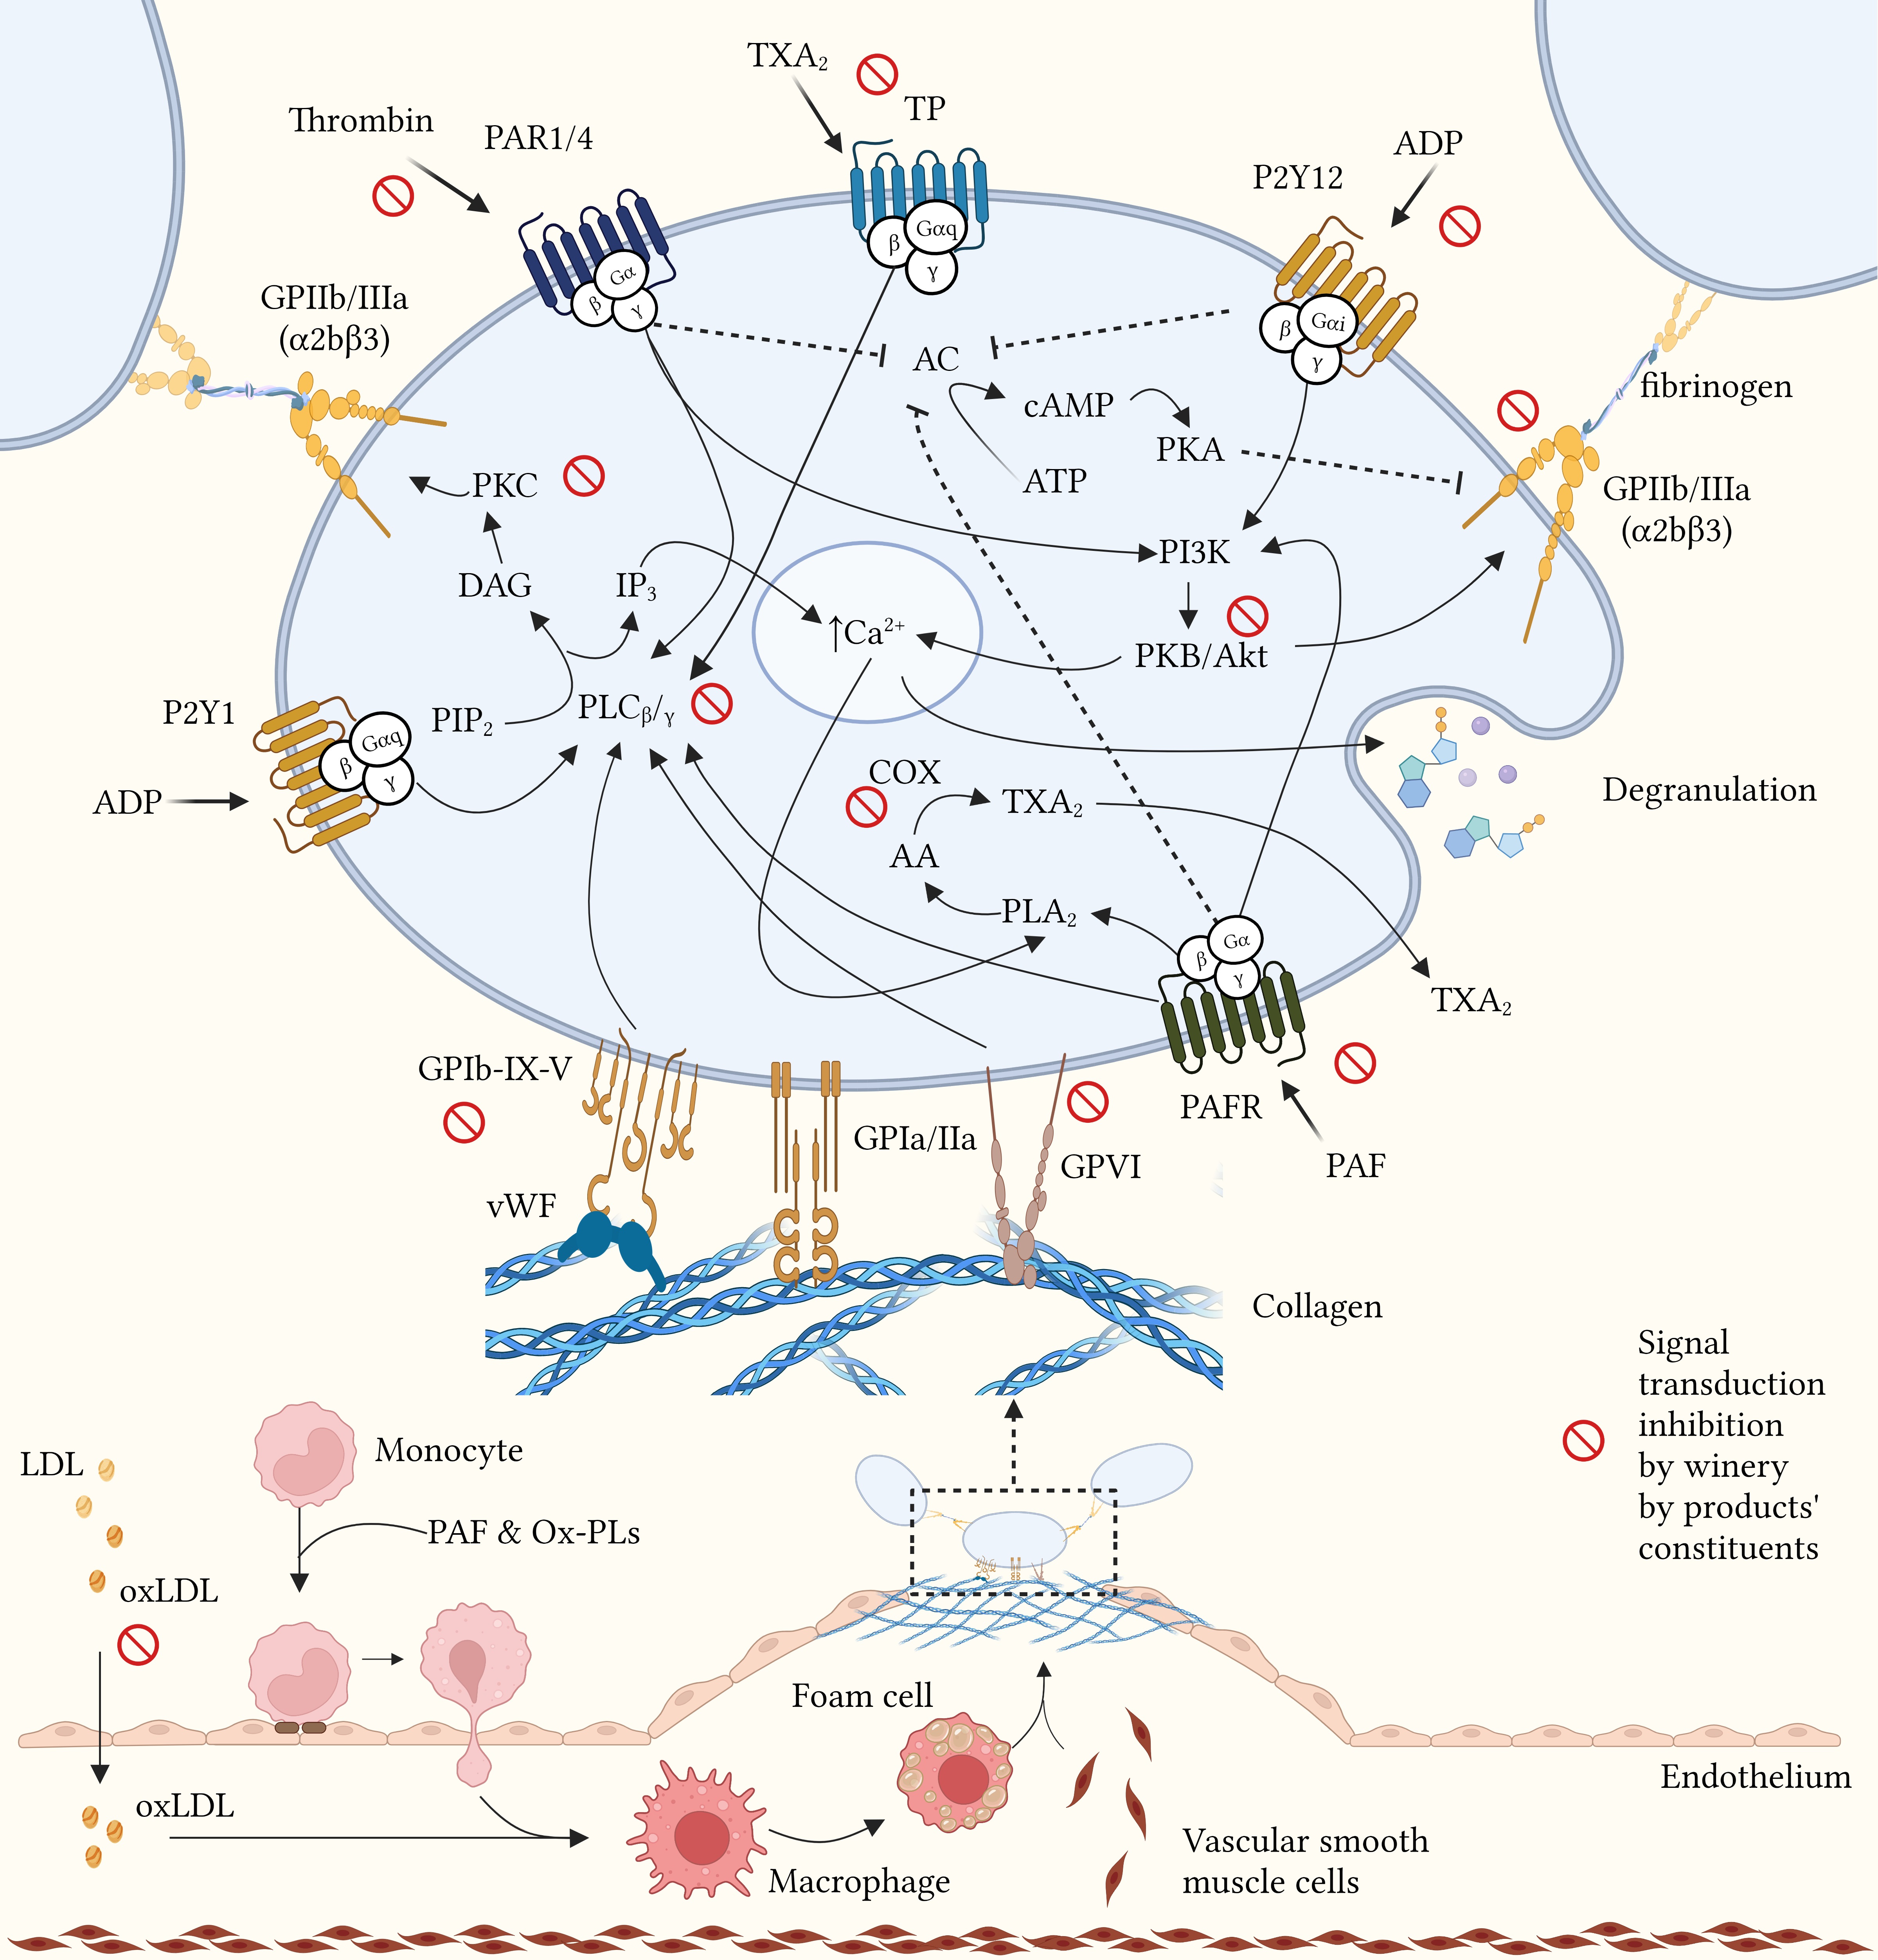
The fact that the winery by-product extracts are able to inhibit different
aggregation factors (PAF, ADP, thrombin/TRAP, collagen), reveals that their
anti-platelet action is achieved through different signaling pathways and is
probably attributed to the synergistic action of all the extracts’ components
[49]. The anti-aggregatory actions could be achieved through various mechanisms
such as inhibition of agonist binding to its receptor, inhibition of signal
transduction enzymes namely phospholipase C (PLC), protein kinase C (PKC) and
cyclooxygenase (COX), inhibition of phospholipid oxidation, or through free
radicals scavenging. Catechin, the most abundant flavanol detected in GP, has
been shown to modulate signal transduction mediated by the PAR (thrombin/TRAP
receptor), GPVI (collagen receptor), and P2Y12 (ADP receptor) receptors, integrin
 Fig. 2.
Potential mechanisms of action of winery by-products in atherothrombosis. Modulation of platelet function mediated by winery by-product constituents through inhibition of aggregation factors binding to their membrane receptors, inhibition of signal transduction enzymes and free radicals scavenging. AA, arachidonic acid; AC, adenylyl cyclase; ADP, adenosine diphosphate; ATP, adenosine triphosphate; Ca, calcium; cAMP, cyclic AMP; COX, cyclooxygenase; DAG, diacylglycerol; GP, glycoprotein; IP3, inositol trisphosphate; LDL, low density lipoprotein; oxLDL, oxidized LDL; Ox-PLs, oxidized phospholipids; PAF, platelet activating factor; PAFR, PAF receptor; PAR, protease-activated receptor; PI3K, phosphoinositide-3 kinase; PIP2, phosphatidylinositol biphosphate; PK, protein kinase; PL, phospholipase; P2Y, platelet receptor for ADP; TP, thromboxane receptor; TXA2, thromboxane A2; vWF, von Willebrand factor. Created with BioRender.com (License: OM23Z01REU).
In studies examining the anti-inflammatory actions of winery by-products in cell
lines, the winery by-products constituents were mostly received by dietary
supplements produced by GS, GSK or GP (Table 2, Ref. [57, 58, 59, 60, 61, 62, 63, 64, 65, 66, 67, 68, 69]). In the majority of
these studies, cells were stimulated by a pro-inflammatory mediator.
Lipopolysaccharide (LPS) was mostly used [57, 58, 59, 60, 61, 62], as well as ox-LDL [59],
hydrogen peroxide (H2O2) [63], tumor necrosis factor-
| Type of extract | Type of cells (cell line) | Experimental procedures | Measurements | Significant results | Ref |
| GS | Human umbilical vein endothe-lial cells (HUVEC) | -Pre-incubation in the absence or presence of extract 5, 15, 25 µg/mL (4 h) | VCAM-1 and ICAM-1 mRNA and protein levels | ↓ VCAM-1 mRNA and protein levels dose-dependently compared to control | [66] |
| -Stimulation with 200 mg/mL AGEs (12 h) | |||||
| GS | -Macro-phages (THP-1) | -Pre-incubation in the absence or presence of extract 50, 100 µg/mL (16 h) | CYP mRNA, PPAR |
↓ IL-6 mRNA (TNF- |
[61] |
| -Adipo-cytes (SGBS) | |||||
| -Stimulation with: | ↓ MCP-1 mRNA (LPS stimulation) compared to control | ||||
| LPS 2 ng/mL for the THP-1 cells (8 h) | |||||
| TNF- |
|||||
| -Pre-incubation in the absence or presence of extract 100 µg/mL (4 h) | p65 translocation, phospho-IκB |
↓ p65 translocation, phospho-IκB |
|||
| -Stimulation with: | |||||
| LPS 2 ng/mL for the THP-1 cells (1 h) | |||||
| TNF- |
|||||
| GS | Human lens epithelial cell line (HLEB-3) | -Pre-incubation in the absence or presence of extract 20 µg/mL (12 h) | nuclear and cytosolic p65 NF-κB (3, 6 h) | ↓ nuclear and cytosolic p65 NF-κΒ at 3 and 6 h incubation with H2O2 | [63] |
| -Stimulation with H2O2 100 µM (1, 2, 3, 6 h) | JNK, phospho-JNK, p38, phospho-p38 (1, 2, 3 h) | ↓ p38 and JNK phosphorylation at 1, 2 and 3 h incubation with H2O2 | |||
| GS | Macro-phages (RAW 264.7) | -Pre-incubation in the absence or presence of extract 5–100 µg/mL (24 h) | mRNA and protein levels: | ↓ COX-2 mRNA, TNF- |
[60] |
| COX-2, TNF- |
|||||
| -Stimulation with LPS (1 µg/mL) (1 h) | ↓ IL-1 |
||||
| ↑ IL-10 mRNA and protein levels (50, 100 µg/mL) compared to control | |||||
| ↓ IL-6, IL-1 |
|||||
| ↓ TNF- |
|||||
| ↓ phospho-ERK, phospho-JNK, phospho-p38, phospho-IKK |
|||||
| ↓ NO at 48 h (50, 100 µg/mL) compared to control | |||||
| GS | -Human hepatoma cells (Huh-7) | Incubation in the absence or presence of extract 2.5–20 µg/mL (3 d) | COX-2 primer’s activity, COX-2 mRNA, PGE2, nuclear translocation of p65 NF-κΒ, IKK |
↓ of COX-2 primer’s activity (10, 20 µg/mL) compared to control | [69] |
| -Human hepatoma cells harboring HCV genotype (Ava5) | ERK1/2, p38, JNK, phospho-ERK1/2, phospho-p38, phospho-JNK, IKK |
↓ PGE2 (5, 10, 20 µg/mL) compared to control | |||
| Inhibition of nuclear transfer of p65 NF-κΒ (20 µg/mL) compared to control | |||||
| Dose-dependent inhibition of IKK |
|||||
| ↓ TNF- |
|||||
| GS | Colon epithelial cells (HT-29) | Stimulation with C. jejuni + incubation in the absence or presence of extract 0.02, 0.06, 0.2, 0.5 mg/mL (24 h) | IL-6, IL-8, MCP-1 | ↓ IL-6, IL-8, MCP-1 (0.02, 0.06, 0.2, 0.5mg/mL) compared to control | [65] |
| -Pre-incubation in the absence or presence of extract 0.02, 0.06, 0.2, 0.5 mg/mL (3 h) | IL-6, IL-8, MCP-1 | ↓ IL-6, IL-8, MCP-1 (0.06, 0.2, 0.5 mg/mL) compared to control | |||
| -Stimulation with C. jejuni (24 h) | |||||
| GSt | Macro-phages (THP-1) | -Stimulation with ox-LDL 75 µg/mL or LPS 0.05 µg/mL | TNF- |
ox-LDL stimulation: | [59] |
| GS | -Simultaneous incubation in the absence or presence of extracts 5–20 µg/mL (24 h) | ||||
| ↓ TNF- |
|||||
| ↓ IL-1 |
|||||
| LPS stimulation: | |||||
| ↓ IL-6 (GSt 20 µg/mL) compared to control | |||||
| GS | Esopha-gus cells (ECA109) | Incubation in the absence or presence of extract 25–80 µg/mL (12, 24, 48 h) | IL-6, COX-2, Bax, Bcl-2 | ↓ IL-6, COX-2 (25, 50, 80 µg/mL) at 48 h compared to 12 h | [68] |
| Incubation for 24 h: caspase-3 mRNA and protein, IKK mRNA and protein, p50 NF-κB mRNA and protein, p65 NF-κB mRNA and protein, phospho-IκΒ, IκB | ↓ IL-6, COX-2 (50, 80 µg/mL) at 24 h compared to12 h and at 48 h compared to 24 h | ||||
| ↑ Bax and ↓ Bcl-2 time- and dose-dependently | |||||
| ↑ caspase-3 mRNA and protein dose-dependently | |||||
| ↓ IKK mRNA, IκB mRNA and protein levels, phospho-IκB, (25, 50, 80 µg/mL) compared to control | |||||
| ↓ p65 NF-κB mRNA and protein levels, IKK protein, p65 NF-κB mRNA and protein levels, phospho-IκB protein levels (50, 80 µg/mL) compared to control | |||||
| ↓ p65 NF-κB protein levels (80 µg/mL) compared to control | |||||
| GP | Endothe-lial cells (EA.hy926) HG: cells with 25 mM glucose | -Incubation of normoglycemic and HG cells (24 h) | p38-MAPK, phospho-p38-MAPK, Akt, phospho-Akt, Nrf2, phospho-Nrf2, p65 NF-κB, phospho-p65 NF-κB, IKK |
↑ phospho-Akt/Akt ratio compared to control HG cells (GI, F) | [67] |
| -Incubation of HG cells in the absence or presence of wine pomace after gastrointestinal digestion (GI) and after colonic fermentation (PF) 2.5 µg GAE/mL (24 h) | ↑ phospho-p38-MAPK/p38-MAPK ratio, SIRT1 mRNA compared to control HG cells (F) | ||||
| ↓ NF-κΒ mRNA compared to control HG cells (F) | |||||
| ↓ phospho-IκB |
|||||
| ↑ phospho-IKK/IKK ratio compared to control normoglycemic cells and F (GI) | |||||
| ↓ phospho-p65 NF-κB/p65 NF-κB ratio compared to control HG cells (F) | |||||
| ↓ COX-2 mRNA compared to normoglycemic cells and GI (F) | |||||
| ↑ NOX-4 mRNA compared to normoglycemic cells and F (GI) | |||||
| GS | Colon epithelial cells (Caco-2) | -Stimulation with LPS 5 µg/mL (4 h) | mRNA and protein levels: | ↓ of mRNA expression: | [58] |
| GSK | -Incubation with Lactobacillus strains + extract 50 µg GAE/mL (24 h) | eotaxin/-2, I-309, IP-10, MIG, MIP-1 |
EOTAXIN/-2, I-309, MIG, MIP-1 |
||
| MCP-1, MCP-2, eotaxin, eotaxin-2, MIG, I-309, IL-1 |
|||||
| GSK | Macro-phages (RAW 264.7) | -Pre-incubation in the absence or presence of extract 250–1000 µg/mL (24 h) | NO production | Inhibition of NO production: IC50 = 587 µg/mL | [57] |
| -Stimulation with LPS 1 µg/mL (24 h) | |||||
| -Pre-incubation in the absence or presence of extract 250–1000 µg/mL (24 h) | NO production | Inhibition of NO production: IC50 = 630 µg/mL | |||
| -Stimulation with LPS 1 µg/mL + incubation with extract 250–1000 µg/mL (24 h) | |||||
| GP | Colon epithelial cells (Caco-2) | -Pre-incubation in the absence or presence of extract (1, 5, 10 µg/mL GAE) (2 h) | IL-6, MCP-1, MMP-9, MMP-2 | ↓ of mRNA expression and protein levels: | [62] |
| -Stimulation with LPS 10 µg/mL and TNF- |
p65 nuclear translocation | IL-6, MCP-1, MMP-9 (5, 10 µg/mL GAE), MMP-2 (10 µg/mL GAE) compared to control | |||
| mRNA: IL-1 |
↑ mRNA TIMP-1, TIMP-2 (10 µg/mL GAE) compared to control | ||||
| ↓ p65 nuclear translocation (5, 10 µg/mL GAE) compared to control | |||||
| ↓ mRNA IL-1 |
|||||
| GP | Colon cancer reporter cells (HT-29-NF-κB-hrGFP) | Simultaneous incubation in the absence or presence of extracts with TNF- |
NF-κB activation, IL-8 | ↓ NF-κB activation (1 Tannat extract), IL-8 (4 Tannat samples) compared to control | [64] |
AGEs, advanced glycation end products; Akt, protein kinase B; APM, adiponectin
gene; Bax, Bcl-2-associated X protein; Bcl, B-cell lymphoma; COX, cyclooxygenase;
CREB, cAMP response element binding; CXCL10, C-X-C motif chemokine ligand 10;
CYP, cytochrome P; ERK, extracellular signal-regulated kinase; GAE, gallic acid
equivalents; GCSF, granulocyte-colony stimulating factor; GM-CSF,
granulocyte-macrophage colony-stimulating factor; GP, grape pomace extract; GS,
grape seed extract; GSK, grape skin extract; GSt, grape stems extract;
H2O2, hydrogen peroxide; HSP27, heat shock protein 27; IC50, half
maximal inhibitory concentration; ICAM, intercellular adhesion molecule;
IFN-
The cells used in these studies were frequently macrophages, endothelial cells
or epithelial cells and several biomarkers of inflammation were measured. In 6
studies, cells incubated with winery by-product extracts were able to modulate
the function of transcription factors, mainly nuclear factor kappa B
(NF-
It is worthy to mention that although wine extracts have been reported to inhibit PAF’s action in platelets and also to reduce the activity of its biosynthetic enzymes [35], no published data exist concerning the influence of winery by-product extracts. However, apigenin and keampferol, quercetin, naringin hesperidin as well as epicatechin-3-O-gallate and epigallocatechin-3-O-gallate were found to be inhibitors of the lyso-PAF AT and the PAF biosynthesis [70].
Several studies examined the health effects of winery by-products, mostly as dietary supplements, in humans (Table 3, Ref. [71, 72, 73, 74, 75, 76, 77, 78, 79, 80, 81, 82, 83, 84, 85, 86, 87, 88, 89, 90, 91, 92, 93, 94, 95, 96, 97, 98, 99, 100, 101, 102, 103, 104, 105, 106, 107, 108, 109, 110]). Concerning the effects of winery by-products on lipid biomarkers, in most studies total cholesterol was reduced in the group receiving treatment compared to control group [71, 72, 73, 74, 75, 76, 77] as well as LDL cholesterol [72, 73, 74, 77]. Winery by-products consumption had mild effect on triglycerides (TG) levels as they were reduced in two studies from which, in one, hyperlipidemic subjects participated in an 8-week intervention [72] and in the second study TG reduced after the consumption of a high-fat lunch meal compared to the placebo treatment [78].
| Supplement Dose/day | Study population | Study design and duration | Measurements | Significant results | Ref |
| -Cr | 38 hyper-cholestero-lemic | Randomized, double-blind, placebo controlled | SBP, DBP, TC, TG, HDL, LDL, ox-LDL, homocysteine | GSE + Cr: ↓ TC, LDL compared to baseline and control | [77] |
| -GSE 100 mg | |||||
| -100 mg GSE + 200 µg Cr | 2 m | ||||
| GSE | 9 normochole-sterolemic subjects | Single dose with blood collections at 0, 1, 2 and 4 h after ingestion, controlled | FRAP, TEAC, plasma catechins | ↑ plasma TEAC at | [97] |
| 200 mg and 300 mg (1 week apart) | 1 h: 200 and 300 mg compared to control | ||||
| 2 h and 4 h: 200 and 300 mg compared to control, 300 mg compared to 200 mg | |||||
| ↑ plasma FRAP at | |||||
| 2 h and 4 h: 300 mg compared to 200 mg and control | |||||
| ↑ plasma catechins at | |||||
| 1 h, 2 h and 4 h: 300 mg compared to 200 mg | |||||
| GSE | 17 9 normochole-sterolemic, 8 hyperchole-sterolemic | Parallel | TC, TG, HDL, LDL, TEAC, LDL and VLDL oxidation | Hypercholesterolemic group: | |
| 400 mg | 3 w | ↓ TC, LDL, HDL compared to baseline | |||
| ↑ TEAC compared to baseline | |||||
| Normocholesterolemic group: | |||||
| ↑ LDL compared to baseline | |||||
| GSE | 8 ♂ healthy | Cross-over, postprandial, controlled (placebo not included) | Cu-induced LDL oxidation, TC, TG, uric acid, ascorbic acid, |
↑ TRAP (3 h), uric acid (1, 3 h), ascorbic acid (1 h) compared to baseline | [91] |
| 300 mg | ↑ ascorbic acid (3 h) compared to control | ||||
| ↓ plasma lipid peroxides (1 h) compared to baseline and control | |||||
| GSE | 24 ♂ smokers | Randomized, double-blind, placebo controlled, cross-over | TC, TG, HDL, LDL, lipid peroxidation, FRAP, Cu-induced LDL oxidation, plasma and LDL contents of |
↓ TBARS compared to baseline and control | [90] |
| 75 mg | 4 w | ↑ lag phase in serum oxidation, FRAP compared to baseline and control | |||
| -yogurt with GSE | 36 hyper-cholestero-lemic, hypertensive, or smokers | Randomized, double-blind, placebo controlled, cross-over | FMD, GTN-mediated dilation, TC, TG, HDL, LDL, ox-LDL, nitrate/nitrite, urinary F2-isoprostanes, creatinine, vWF, tPA levels and activity, PAI-1 levels and activity, VCAM-1, ICAM-1, SBP, DBP | ↑ FMD in the GSE alone intervention compared to control | [85] |
| -yogurt with GSE + 0.5 g quercetin | |||||
| 1 g | 12 w | ||||
| -vit C 500 mg | 69 hypertensive | Randomized, double-blind, placebo controlled (3-arm) | SBP, DBP, FMD, GTN-mediated dilation, urinary F2-isoprostanes, urinary 20-HETE, ox-LDL, hs-CRP, plasma |
↑ SBP, DBP in the vit C+ GSE group compared to placebo, vit C group and GSE group | [102] |
| -GSE 1 g | 6 w | ↓ heart rate in the GSE group compared to vit C group and vit C+ GSE group | |||
| -500 mg vit C + 1 g GSE | |||||
| GSE | 39 ♀ with radiation-induced breast induration | Randomized, double-blind, placebo controlled | Urinary 8-OH | NS | [93] |
| 300 mg | 6 m | -deoxyguanosine, urinary creatinine, lipid peroxides, TC | |||
| GSE | 17 ♀ healthy post-menopausal | Randomized, double-blind, placebo controlled, Intervention included the consumption of 2 meals at the day of the measurements | PFA-100 using ADP and epinephrine | ↓ in platelet reactivity against ADP 1, 2, 6 h after ingestion | [101] |
| 400 mg | 8 w | ||||
| -GSE 200 mg | 53 healthy | Randomized, single-blind | SBP, DBP, TC, TG, HDL, LDL, Apo-A1, Apo-B, Apo-E, albumin, total bilirubin, AST, ALT, |
↓ MDA, MDA/Apo-B in the 400 mg group compared to baseline | [76] |
| -GSE 400 mg | 12 w | ↓ MDA in the 400 mg group (6 w) compared to baseline and control | |||
| (as pro-antho-cyanidins) | ↓ MDA, Apo-B, Apo-B/Apo-A1 in the 200 mg group (12 w) compared to baseline | ||||
| ↑ HDL (12 w) compared to baseline | |||||
| ↓ Apo-B (6 w) in the 400 mg group compared to baseline | |||||
| GSE | 23 ♂ smokers | Randomized, double-blind, placebo controlled, postprandial | PFA-100 using ADP and epinephrine, TRAP, TBARS, TC, TG, HDL, LDL, non-HDL, uric acid | ↓ in platelet reactivity to ADP 1, 2, 6 h after ingestion | [100] |
| 400 mg | ↓ in platelet reactivity to epinephrine 2 h after ingestion | ||||
| GSE | 32 Type II obese diabetics | Randomized, double-blind, placebo controlled, cross-over | endothelial function, hs-CRP, GSH/GSSG, fructosamine, total antioxidant status, urine albumin/creatinine, TC, TG, HDL, glucose, insulin | ↓ fructosamine, hs-CRP compared to baseline | [95] |
| 600 mg | 4 w | ↑ GSH compared to baseline | |||
| -GSE 150 mg | 27 subjects with MS | Double-blind, placebo controlled | SBP, DBP, glucose, insulin, ox-LDL, TC, HDL, LDL | ↓ SBP, DPB in both groups compared to control | [87] |
| -GSE 300 mg | 4 w | plasma catechins (only 5 subjects in the 300 mg group) | ↓ ox-LDL in the 300 mg group compared to baseline | ||
| ↑ plasma catechins compared to control | |||||
| GSE 3 g | 35 ♂ healthy | Randomized, double-blind, placebo controlled, cross-over (3-arm), Intervention included the consumption of a low-fat breakfast and a high-fat lunch meal at the day of the measurements | FMD, SBP, DBP, ADP-, collagen- and epinephrine induced platelet aggregation, TC, TG, HDL, LDL | ↓ TG in the GP group after the high-fat lunch meal compared to control | [78] |
| -GP 3 g | 2 w | ||||
| GSE | 50 CHD patients or subjects with |
Randomized, double-blind, placebo controlled, cross-over | SBP, DBP, FMD, brachial artery diameter, CRP, IL-6, MDA, 8-isoprostanes, TAC, TC, TG, HDL, LDL, glucose | ↑ in brachial artery diameter compared to baseline and control | [99] |
| 1300 mg | 4 w | ↓ CRP, MDA compared to baseline | |||
| GSE | 48 Type II diabetics | Randomized, double-blind, placebo controlled | FRAP, SOD, GPx, TBARS, SBP, DBP, TC, TG, LDL, fasting glucose, HbA1c | ↓ TAC compared to baseline | [84] |
| 200 mg | 8 w | ↑ SOD compared to baseline and control | |||
| GSE | 28 ♂ smokers | Randomized, double-blind, placebo controlled | Collagen-induced platelet aggregation, TEAC, 8-isoprostanes, nitrate/nitrite, GSH/GSSG, endothelin-1, FMD, microvascular function, SBP, DBP, arginase activity, TC, TG, HDL, LDL, fibrinogen, TNF-a, IL-10, CRP | ↓ TC after 4 w compared to baseline | [96] |
| 200 mg | 8 w | ↓ HDL after 4 and 8 w compared to baseline | |||
| ↓ %TNF- |
|||||
| ↑ GSH/GSSG ratio after 8 w compared to baseline | |||||
| ↑ vascular health index after 8 w compared to baseline and control | |||||
| -GSE 100 mg | 8 healthy | Randomized, double-blind, crossover, controlled (placebo not included), postprandial | glucose | ↓ plasma glucose at 15 and 30 min compared to control | [82] |
| -GSE 300 mg | |||||
| GSE | 32 obese | Randomized, single-blind, placebo controlled (subjects received both the placebo and the examined supplement) | TAC, GPx, GSH/GSSG, SOD, lipid peroxides, ox-LDL, anti-ox-LDL, 8-OHdG, gene expression | ↑ Antioxidant capacity compared to resveratrol group | [94] |
| 400 mg | ↑ GPx compared to resveratrol group and control | ||||
| ↑ Anti-oxLDL compared to control | |||||
| Gene expression: | |||||
| 8 w | Upregulation of GPX1, GSS, PRDX2, ICAM3, CCL5, HSF4, BCL2, compared to control | ||||
| Downregulation of ICAM1, MMP1, TNIP2, LTA compared to control | |||||
| Upregulation of HSF4, RAC1 compared to resveratrol group | |||||
| Downregulation of ICAM1, TNIP2, CD2, compared to resveratrol group | |||||
| GS oil | 39 ♀ overweight/obese | Randomized, double-blind, placebo controlled, Intervention includes weight loss program | fasting glucose, insulin, hs-CRP, TNF- |
↓ TNF- |
[98] |
| 15% of total energy | 8 w | ↓ hs-CRP compared to baseline and control | |||
| GSE | 52 (initially recruited) | Randomized, double-blind, placebo controlled, cross-over | SBP, DBP, TC, TG, HDL, LDL, VLDL, ox-LDL | ↓ TC, ox-LDL compared to baseline and control | [75] |
| 200 mg | 75 cases at the end of the study (crossover design) mild hyper-lipidemics | 8 w | ↓ LDL compared to baseline | ||
| GSE | 70 pre- and stage I hypertensive | Randomized, double-blind, placebo controlled | SBP, DBP, heart rate, HEPES-, ADP-, collagen-, TRAP-induced platelet aggregation, nitrate/nitrite, endothelin-1, ADMA, polyphenol metabolites | ↓ SBP, DBP compared to baseline | [103] |
| 300 mg | 8 w | ↑ 4-O-methyl gallic acid, pyrogallol compared to control | |||
| GP | 60 | Randomized, double-blind, placebo controlled | TC, HDL, LDL, ORAC, ox-LDL, vit E, ascorbic acid, TNF- |
↓ TC, LDL compared to baseline and control | [74] |
| 700 mg | healthy | 8 w | ↑ antioxidant capacity (ORAC), vit E compared to baseline and control | ||
| -GSE 100 mg | 91 ♀ | Randomized, double-blind, placebo controlled | SBP, DBP, heart rate, cardioankle vascular index, physical symptoms, hot flashes, insomnia, depression, anxiety | 200 mg group: | [88] |
| -GSE 200 mg | with at least 1 menopausal symptom | ↓ physical symptoms (8 w), hot flashes (8 w), insomnia (8 w), anxiety (4 w, 8 w), SBP (4 w, 8 w), DBP (4 w, 8 w) compared to baseline | |||
| 8 w | ↓ anxiety (8 w), DBP (8 w) compared to control | ||||
| 100 mg group: | |||||
| ↓ anxiety (4 w, 8 w), SBP (4 w, 8 w), DBP (4 w, 8 w) compared to baseline | |||||
| ↓ DBP (8 w) compared to control | |||||
| GP flour (in the form of bread and cookies) | 38 ♂ with |
Randomized, controlled | SBP, DBP, glucose, insulin, OGTT, TC, TG, HDL, LDL, L-ascorbic acid, tocopherols, PC, DPPH, TRAP | ↓ SBP, DBP, fasting glucose, average number of MS criteria, postprandial insulin, PC, antioxidant capacity compared to baseline | [80] |
| 20 g | 16 w | ↓ postprandial insulin compared to control | |||
| ↑ δ-tocopherol, vit C compared to baseline | |||||
| ↑ |
|||||
| GSE | 30 ESRD patients | Randomized double-blind, placebo controlled | TC, TG, HDL, LDL, VLDL, hs-CRP, TNF- |
NS | [104] |
| 200 mg | 4 w | ||||
| GS oil | 34 healthy | Randomized, double-blind, controlled (4 subjects in the control group) | ADP-induced platelet aggregation (2.34, 1.17, 0.58 µM) | ↓ in platelet aggregation compared to baseline at 2.34 and 1.17 µM ADP | [105] |
| 1 g | 7 d | ||||
| GSE | 29 hypertensive | Randomized, double-blind, placebo controlled | SBP, DBP, glucose, insulin, ox-LDL, ICAM-1, HOMA-IR, FMD, plasma phenolic metabolites | ↓ SBP compared to baseline and control | [83] |
| 300 mg | 6 w (+4 w follow-up) | ↓ DBP compared to baseline | |||
| ↑ total plasma phenolic metabolites compared to control | |||||
| GSE, vitamins, minerals | 30 Type II diabetics | Randomized double-blind, placebo controlled | fasting glucose, postprandial glucose, HbA1c, ALT, AST, TC, TG, HDL, LDL, urea, creatinine | NS | [106] |
| 1–2 capsules | 45 d | ||||
| GS powder | 33 CKD patients | Randomized, double-blind, placebo controlled | CAT activity, SOD activity, GPx activity, H2O2, free iron, CRP, LDH, GFR, plasma urea, plasma creatinine, plasma UA, urine protein, MDA, PC, SBP, DBP, glucose, TG, TC, lipase | ↑ CAT, SOD compared to control | [89] |
| 2 g | 6 m | ↑ CAT, free iron, lipase compared to baseline | |||
| ↓ PC compared to baseline | |||||
| ↓ creatinine, urine protein, MDA, PC compared to control | |||||
| GSE | 40 ♀ volleyball athletes | Randomized, double-blind, placebo controlled | CPK, TAC, FRAP, GSH, TBARS, nitrite/nitrate ratio, fasting glucose, TC, TG, HDL, LDL, VLDL, HOMA-IR, QUICKI, SBP, DBP | ↑ GSH, insulin sensitivity compared to baseline and control | [79] |
| 600 mg | 8 w | ↓ MDA, fasting insulin, HOMA-IR compared to baseline and control | |||
| ↓ TG, VLDL, TC/HDL ratio compared to baseline | |||||
| GO: GP + omija fruit (O) extracts | 76 overweight/obese | Randomized, double-blind, placebo controlled | TC, TG, HDL, LDL, Apo-A1, Apo-B, Lp(a), atherogenic index, TBARS, H2O2, IL-1 |
High GO: | [73] |
| -Low GO: GP 342.5 mg + O 57.5 mg | 10 w | ↓ TC, non-HDL, LDL, atherogenic index, TBARS, H2O2 compared to control | |||
| -High GO: GP 685 mg + O 115 mg | ↑ apo-A1, GPx activity, GR activity compared to control | ||||
| ↓ Lp(a), TBARS, H2O2, IL-1 |
|||||
| ↑ SOD activity compared to baseline | |||||
| Low GO: | |||||
| ↓ IL-1 |
|||||
| ↑ SOD activity compared to baseline | |||||
| GSE | 70 mild to moderate hyper-lipidemics | Randomized, double-blind, placebo controlled | TC, TG, HDL, LDL, Apo-A1, PON | ↓ TG, TC, LDL | [72] |
| 200 mg | 8 w | ↑ PON activity, Apo-A1 | |||
| compared to baseline and control | |||||
| GSE | 9 ♂ hypertensive | Randomized, double-blind, placebo controlled, cross-over, Intervention includes exercise at 40% and 60% VO2max | SBP, DBP, mean arterial pressure, FMD, | ↓ SBP, DBP, mean arterial pressure compared to presupplementation at resting conditions and during exercise | [86] |
| 300 mg | cardiac output, stroke volume, total vascular conductance, rate × pressure product | ↑ heart rate at 40% VO2max compared to resting condition | |||
| ↑ cardiac output, stroke volume, total vascular conductance, FMD compared to presupplementation during exercise | |||||
| Single dose | ↓ rate × pressure product compared to presupplementation at resting conditions and during exercise at 60% VO2max | ||||
| GSE | 27 COPD patients | Randomized, double-blind, placebo controlled | TC, TG, HDL, LDL, SOD, GPx, CAT, TBARS, lung function | ↓ MDA, SOD, TC/HDL ratio compared to baseline and control | [71] |
| 150 mg | 8 w | ||||
| dried GP | 50 subjects with |
Randomized, cross-over | OGTT, HOMA-IR, QUICKI, TC, HDL, LDL, SBP, DBP, plasma and urine UA, fibrinogen, hs-CRP, AST, ALT, iron status, leptin | ↑ in insulin sensitivity compared to baseline | [107] |
| 8 g | 6 w | ||||
| -GSE 200 mg | 30 pre-hypertensive | Randomized, double-blind, placebo controlled | TC, LDL, HDL, ox-LDL, TG, vascular function (including among others FMD, SBP, DBP) | 400 mg group: | [108] |
| -GSE 400 mg | 12 w | ↓ SBP compared to baseline at 12 w | |||
| Improved stiffness, distensibility, PWV compared to baseline at 8 and 12 w | |||||
| ↓ Einc compared to baseline at 12 w | |||||
| GSE | 16 ♂ healthy | Randomized, double-blind, placebo controlled, Intervention includes exercise | Maximal strength, muscle soreness, CK | ↓ CK 96 h after exercise compared to control | [109] |
| 300 mg | 3 d | ||||
| GP | 12 ♂ healthy | Randomized, double-blind, placebo controlled, crossover, postprandial | glucose, insulin, TG | ↓ insulin iAUC0–5 h | [81] |
| 3.7 mmol polyphenols | ↑ insulin sensitivity compared to control | ||||
| GP | 213 subjects (41 healthy, 39 hypertensive, 28 diabetics) | Randomized, double-blind, placebo controlled | TMAO, ox-LDL, reactive oxygen metabolites | ↓ TMAO, ox-LDL, reactive oxygen metabolites at 4 and 8 w compared to control | [110] |
| 800 mg | 8 w | ||||
| GP | 18 ♀ healthy | Randomized, double-blind, placebo controlled, crossover, postprandial | glucose, insulin, UA, TC, TG, HDL, LDL, SOD activity, GPx activity, PC, TBARS | ↓ UA, TBARS, SOD activity in normal-weight women compared to control | [92] |
| 3.5 g | ↑ UA, ↓ PC in overweight/obese women compared to control |
ADMA, asymmetric dimethylarginine; ADP, adenosine diphosphate; ALP, alkaline
phosphatase; ALT, alanine aminotransferase; Apo, apolipoprotein; AST, aspartate
transaminase; CAT, catalase; CHD, coronary heart disease; CK, creatine kinase; CKD, chronic kidney
disease; COPD, chronic obstructive pulmonary disease; C(P)K, creatine
phosphokinase; Cr, chromium; Cu, copper; DBP, diastolic blood pressure; dGuo,
deoxyguanosine; DPPH, 2,2-diphenyl-1-picrylhydrazyl; ESRD, eternal stage renal
disease; FMD, flow mediated dilation; FRAP, ferric reducing antioxidant power;
GFR, glomerular filtration rate; GP, grape pomace; GPx, glutathione peroxidase;
GR, glutathione reductase; GS, grape seed; GSE, grape seed extract; GSH,
glutathione reduced; GSSG, glutathione oxidized;
Research has also focused on the effect on glycemic biomarkers, such as insulin levels or sensitivity and glucose levels, although few significant changes regarding the treatment group compared to control were reported. The intake of 600 mg GS extract for 8 weeks managed to improve insulin sensitivity and reduce fasting insulin levels in 40 volleyball athletes [79]. The daily consumption of 20 g bread or cookies made from flour enriched with GP for 16 weeks reduced postprandial insulin levels during an oral glucose tolerance test (OGTT) in subjects with at least one metabolic syndrome (MS) criteria [80]. The acute consumption of a GP extract under postprandial conditions also reduced the insulin and improved insulin sensitivity in 12 healthy men [81]. The intake of GS extract significantly reduced the postprandial glucose 15 and 30 minutes after the meal consumption as well as the glucose response AUC in healthy volunteers [82]. No effect was reported when hemoglobin A1c (HbA1c) levels were measured, possibly due to the long time needed for alterations to be detected in this particular biomarker [76, 83, 84].
Many studies assessed the extracts’ effects on cardiovascular indexes. Flow mediated dilation (FMD) was increased after the 12-week consumption of a yogurt enriched with GS extract, but not after a yogurt enriched with both GS and quercetin, in subjects with cardiovascular risk factors [85]. FMD was also increased after a single dose of GS extract, when hypertensive subjects performed exercise or during resting conditions compared to pre-supplementation [86]. The same study reported reduction in their mean systolic (SBP) and diastolic blood pressure (DBP). Blood pressure was also reduced in subjects with MS receiving either 150 or 300 mg of GS extract compared to the control group [87]. SBP alone was significantly reduced in hypertensive subjects receiving 300 mg of GS extract [83], whereas DBP alone, in women with menopausal symptoms after consumption of 100 or 200 mg of extract for 8 weeks [88].
Regarding the extracts’ antioxidant properties, studies examined the oxidative damage on lipids, proteins and DNA as well as their effect on antioxidant enzymes or molecules. The majority of the studies that measured lipid peroxidation products after the consumption of the extract capsules observed reduction in malondialdehyde (MDA) levels [71, 73, 76, 79, 89, 90], in lipid peroxides [91] as well as in thiobarbituric acid reactive substances (TBARS) levels [92]. Two studies assessed the extracts’ effects on protein carbonyls (PC), in which their levels where reduced, compared to the control group [89] and only compared to baseline values [80]. In our study, the acute consumption of a GP extract reduced postprandial PC levels compared to the control group only in overweight/obese women [92]. Few data exist concerning the effects on DNA oxidation, as the two research groups that measured 8-hydroxy-2-deoxyguanosine (8-OHdG) levels did not observe any changes [93, 94]. The antioxidant molecule glutathione in its reduced form (GSH) was increased in volleyball players that received 600 mg of GS extract for 8 weeks [79] compared to baseline values and to the control group, whereas in other studies GSH [95] and GSH/glutathione oxidized (GSSG) ratio [96] were increased compared to baseline values but not to the control group. The effect on antioxidant enzymes can be assessed by the change in their levels or their activity. Superoxide dismutase (SOD) and catalase (CAT) levels were significantly elevated in chronic kidney disease (CKD) patients [89] that received 2 g of GS extract for 6 months. For SOD, the same effect was found in type II diabetic patients receiving 200 mg daily for 8 weeks, whereas, SOD levels were reduced in chronic obstructive pulmonary disease (COPD) patients receiving 150 mg daily for the same period [71]. In our study, postprandial SOD activity was reduced only in normal-weight women compared to the control group after the consumption of a GP extract along with a high-fat meal [92]. SOD activity was increased in one study in overweight or obese subjects [73] but only compared to baseline values. In the same study, glutathione peroxidase (GPx) activity was enhanced only compared to the control group. GPx levels were elevated after the daily administration of 400 mg GS extract for 2 months in obese subjects compared to the group receiving resveratrol and compared to the control group [94]. Paraoxonase (PON) was examined in one study where hyperlipidemic subjects received 200 mg of GS extract for 8 weeks, leading to its activity enhancement compared to baseline values and to the control group [72]. Assays developed for the measurement of the antioxidant capacity in serum and plasma such as total antioxidant capacity (TAC), trolox equivalent antioxidant capacity (TEAC), total radical trapping antioxidant parameter (TRAP), oxygen radical absorbance capacity (ORAC) and ferric reducing antioxidant power (FRAP), were performed in several studies examining GS extracts and favorable results were reported [74, 84, 90, 91, 94, 97].
Concerning the extracts’ actions on inflammatory markers, research focused on
cytokines, acute phase proteins (C-reactive protein, CRP in particular), adhesion
molecules and inflammatory genes expression. Significantly reduced levels of high
sensitive CRP (hs-CRP) were reported after 8 weeks of GS oil consumption for 39
overweight/obese subjects, compared to baseline levels and to the control group
[98]. Other studies reported reduced CRP levels [95, 99] compared to baseline
values. The majority of cytokines examined were TNF-
The anti-platelet effects of extracts were examined only by three of the studies listed in Table 3. Two of them reported favorable results in the postprandial state by reducing platelet sensitivity to ADP [100, 101] and epinephrine [100]. No data exist, yet, concerning PAF as agonist for platelet aggregation.
In this review, we provide a brief overview of the atherothrombotic process in order to further investigate the effects of winery by-product extracts. Data from in vitro studies report that winery by-product compounds are able to modulate platelet function, as well as to downregulate inflammatory markers. Among their actions, extracts or phenolic compounds present in winery by-products inhibit PAF’s actions, a potent inflammatory and thrombotic mediator. In addition, they modulate its levels either through direct inhibition of its metabolic enzymes or through indirect reduction of oxidative stress leading to lower LDL oxidation and PAF or PAF-like molecules production. Similar conclusions have been drawn from the human supplementation studies stating that winery by-product extracts may exert favorable biological actions towards the cardiovascular system. Evidence from long-term studies show that consumption may lower total and LDL cholesterol, improve insulin sensitivity, decrease lipid and protein oxidative damage, enhance antioxidant capacity and a have mild anti-inflammatory action towards reducing cytokine expression and levels. Although data from postprandial studies are limited, the acute consumption of winery by-product extracts seems to improve glycemic response as well as reducing platelet reactivity to aggregatory stimuli. Nutritional supplements or foods fortified with winery by-products could provide a safe and cost-effective complementary treatment towards atherothrombotic complications. Nevertheless, further randomized controlled long-term or postprandial trials need to be conducted in order to draw definitive conclusions for providing a useful cardioprotective approach that includes the sustainable use of winery by-products.
MC, EF searched, analyzed, interpreted data, drafted the manuscript and SA analyzed data and revised the manuscript critically for important intellectual content. All authors read and approved the final manuscript. All authors have participated sufficiently in the work and agreed to be accountable for all aspects of the work.
Not applicable.
Not applicable.
This research received no external funding.
Smaragdi Antonopoulou states that given her role as Guest Editor, she had no involvement in the peer-review of this article and has no access to information regarding its peer review. Full responsibility for the editorial process for this article was delegated to Raffaele Serra. The other authors declare no conflict of interest.
References
Publisher’s Note: IMR Press stays neutral with regard to jurisdictional claims in published maps and institutional affiliations.