


1 State Key Laboratory of Oral & Maxillofacial Reconstruction and Regeneration, National Clinical Research Center for Oral Diseases, Shaanxi Engineering Research Center for Dental Materials and Advanced Manufacture, Department of Anesthesiology, School of Stomatology, The Fourth Military Medical University, 710032 Xi’an, Shaanxi, China
2 Shaanxi Key Laboratory of Ischemic Cardiovascular Diseases & Institute of Basic and Translational Medicine, Xi'an Medical University, 710021 Xi’an, Shaanxi, China
3 Department of Anatomy, Xi’an Medical University, 710021 Xi’an, Shaanxi, China
4 Department of Anesthesiology, Tangdu Hospital, Fourth Military Medical University, 710032 Xi’an, Shaanxi, China
Abstract
C1q/tumor necrosis factor-related protein-9 (CTRP9) is critically involved in the pathophysiology of metabolic and cardiovascular disorders. This investigation aimed to clarify the mechanism underlying the role of CTRP9 in atherosclerosis in apolipoprotein E (ApoE) knockout (KO) mice.
ApoE KO mice were fed a Western diet and injected with a virus which resulted in CTRP9 overexpression or knockdown for 12 weeks. The plasma lipid levels and atherosclerotic plaque areas were measured after the mice were euthanized. Aortas were isolated, and RNA sequencing was performed to identify the differentially expressed genes and related signaling pathways. Finally, plasma oxidative stress factors were measured to demonstrate the reliability of the RNA sequencing results.
The plasma lipid levels in the CTRP9 overexpression group did not significantly differ from those in the green fluorescence protein (GFP) group. Markablely, CTRP9 overexpression inhibited atherosclerotic plaque formation in ApoE KO mice, whereas CTRP9 knockdown promoted plaque formation. RNA sequencing analysis identified 3485 differentially expressed genes that were prominently enriched across 55 signaling pathways. Additionally, plasma oxidative stress factors were significantly reduced after CTRP9 overexpression, whereas these factors were increased after CTRP9 knockdown, which was consistent with the results of the RNA sequencing analysis.
These findings demonstrated that CTRP9 alleviated inflammation and cholesterol metabolism, which reduced oxidative stress in an atherosclerotic animal model. These beneficial effects may mediate the suppression of lesion development in the aorta.
Keywords
- CTRP9
- atherosclerosis
- oxidative stress
- cholesterol metabolism
- RNA sequencing
The majority of cardiovascular diseases (CVDs), including stroke, coronary heart disease (CHD), and myocardial infarction, are mainly due to the formation of atherosclerotic plaques [1]. Plaque formation involves chronic inflammation and complex signaling pathways [2, 3, 4]. Although the use of statins and other medications has beneficial effects in patients with CVD, the clinical prognosis remains unsatisfactory [5]. Therefore, the identification and discovery of key molecules involved in atherosclerosis are crucial for the development of future therapeutic strategies for CVD.
Adiponectin is an adipocytokine that is specifically synthesized and secreted by adipose tissue. Over the past two decades, numerous studies have confirmed that adiponectin contributes to diabetes, obesity, inflammation, CVD, and atherosclerosis [6, 7]. The C1q/tumor necrosis factor-related proteins (CTRPs) family is highly similar to adiponectin, and the CTRP9 globular C1q domain has the most extensive amino acid sequence homology with adiponectin [8, 9]. A previous study confirmed that CTRP9 effectively resists the inflammatory response after myocardial ischemia‒reperfusion in an animal model [10, 11, 12]. CTRP9 has other beneficial effects on type II diabetes mellitus [13], insulin resistance and obesity [14, 15], pulmonary artery disease [16, 17], heart failure [18], myocardial infarction [19], and atherosclerosis [20, 21].
This study aimed to elucidate the molecular underpinnings of CTRP9 regulation in atherosclerosis. To validate our hypothesis, we employed apolipoprotein E (ApoE) knockout (KO) mice, an established animal model that mimics human atherosclerosis. These mice were fed a Western diet and injected with virus via the tail vein for 12 weeks. Upon completion of the study, lipid profiling, assessment of aortic atherosclerosis, and RNA sequencing (RNA-seq) analysis were conducted in aortic tissues to identify differentially expressed genes (DEGs). The experimental results indicated that CTRP9 overexpression inhibited aortic atherosclerosis via the inhibition of oxidative stress but not by the inhibition of autophagy [20].
Male ApoE KO mice (Laboratory Animal Center of Xi’an Jiaotong University), aged
eight weeks, were utilized in this study. These mice were intravenously injected
via the tail vein with 1
After an overnight fasting period, blood samples were collected, treated with EDTA, and subsequently centrifuged at 1500 rpm for 10 min at 4 °C for plasma isolation. The levels of high-density lipoprotein cholesterol (HDL-C), triglycerides (TGs), low-density lipoprotein cholesterol (LDL-C), and total cholesterol (TC) in plasma were quantified via commercially available assay kits supplied by Biosino Bio-Technology & Science, Inc. (Beijing, China) [22].
For analysis of oxidative stress markers in the plasma, various parameters, including malondialdehyde (MDA) levels, superoxidase dismutase (SOD) activity, total nitric oxide synthase (TNOS), glutathione peroxidase (GSH-Px), inducible nitric oxide synthase (iNOS), glutathione S-transferase (GST), and total antioxidant capacity (T-AOC), were measured. These measurements were conducted via colorimetric assay kits. Additionally, nitric oxide (NO) levels were determined with a nitrate reductase assay kit. All these assay kits were acquired from Nanjing Jiancheng Bioengineering Institute (Nanjing, China).
For measurement of atherosclerosis, the mice were euthanized via an intraperitoneal injection of pentobarbital sodium at a dosage of 150 mg/kg. The aortic trees were subsequently dissected and subjected to oil red O staining. Adjacent sections on separate slides were immunostained with monoclonal antibodies against macrophages (MOMA-2; 1:100; Cat. No. ab-33451; Abcam, Cambridge, MA, USA). Visualization of the sections was achieved with a DAB substrate kit (Cat. No. GK800511, Gene Tech, Shanghai, China). The en face lesion size was measured via an image analysis system provided by WinRoof Mitani Co. (Tokyo, Japan) [22].
Frozen cross-sections of the aortic root were examined for microscopic analysis of atherosclerotic lesions. Specifically, ten cross-sections from each mouse were evaluated. The sections were subjected to oil red O and hematoxylin‒eosin (H&E) staining to visualize the lesions. The stained sections were subsequently quantified via the image analysis system provided by WinRoof Mitani Co. (Tokyo, Japan) to determine the oil red O-stained area [23].
Total RNA was isolated from aortas via RNAzol (TaKaRa, Tokyo, Japan). The purity and concentration of the extracted RNA were determined via a Nanodrop instrument from Thermo Fisher Scientific (Rockford, IL, USA). Additionally, the integrity of the RNA was verified via an Agilent 2100 Bioanalyzer (Agilent Technologies, Santa Clara, CA, USA). The purification of mRNA from the total RNA samples was performed via the NEBNext® Poly(A) mRNA magnetic isolation module. For assembly of the library, which was characterized by an insert size of 400 bp, the NEBNext UltraTM RNA Library Prep Kit was utilized following the guidelines provided by the manufacturer (Illumina San Diego, CA, USA) [24]. The quality of the library was evaluated via the Agilent Bioanalyzer 2100 system. The index-coded samples were subsequently clustered on a cBot Cluster Generation System via a TruSeq PE Cluster Kit v4-cBot-HS (Illumina) [25]. Library sequencing was performed with the Illumina HiSeq 2500 platform, which utilized 100 bp paired-end reads. This equipment was sourced from Illumina (San Diego, CA, USA).
A Perl script was used to remove reads that included contaminated adapters,
those with more than 0.25% low-quality bases (indicated by a Phred quality score
below 20), or those containing more than 10% Ns. The purified reads were
subsequently aligned to the mouse reference genome (GRCm38) via TopHat software.
The quantification and normalization of gene expression were performed via
Cufflinks software, which uses the reads per kilobase per million (RPKM) method
for this process [26]. The analysis of DEGs between the Ad-GFP and Ad-CTRP9
groups was conducted via DESeq software (V1.44.0)
[27]. The significance threshold for
p values in various tests was established through the false discovery
rate (FDR). Genes exhibiting an absolute FDR value less than 0.05 and a fold
change
Freshly obtained liver samples were homogenized in lysis buffer and maintained
at 4 °C. The resulting supernatants derived from this process were
collected and used for Western blot experiments. Lysates (20 µg) were
resolved via 10% sodium dodecyl sulfate‒polyacrylamide gel electrophoresis,
after which they were transferred onto polyvinylidene fluoride membranes
(Sequi-Blot, Bio-Rad, Hercules, CA, USA). The membranes were subsequently
incubated with primary antibodies overnight at 4 °C. Specifically,
anti-CTRP9 (No. NBP2-46834, Novus, Centennial, CO, USA) was used at a dilution of
1:2000, and
The proximal aortas were initially fixed in 4% paraformaldehyde (BL539A, Biosharp, Hefei, China) for 20 min and
then treated with a permeabilization solution (0.1% Triton
The assessment of cholesterol efflux was conducted in accordance with the
methods of Yin et al. [28] and Maarit Hölttä-Vuori et
al. [29]. Briefly, we injected Ad-CTRP9 or Ad-GFP into ApoE KO mice via
the tail vein for 4 weeks. After the mice were humanely euthanized
through cervical dislocation, precooled PBS was used to extract macrophages from
the abdominal cavities of the mice. The macrophages isolated from the
experimental groups were subjected to labeling with medium containing 2.5
µM BODIPY-cholesterol (HY-125746, MCE, Monmouth Junction, NJ, USA). This labeling process was
conducted at 37 °C with 5% CO2 for 60 min. The
cells were removed from their environment, subsequently resuspended and subjected
to two rounds of purification. Flow cytometry (Calibur; BD Biosciences, Franklin
Lakes, NJ, USA) was used to measure the mean fluorescence intensity (MFI) as the
baseline. After a 4-h interval, the MFI of BODIPY-cholesterol in the macrophages
was once again determined via flow cytometry. For determination of cholesterol
efflux, the following formula was used: (baseline MFI – final MFI)/baseline MFI
The data are presented as the mean values
To investigate the impact of CTRP9 on atherosclerotic lesion formation, we
injected ApoE KO mice with adenoviral vectors harboring mouse CTRP9 (referred to
as Ad-CTRP9) or control Ad-GFP. The CTRP9 protein level in the liver was
substantially greater in the Ad-CTRP9 group than in the Ad-GFP group (p
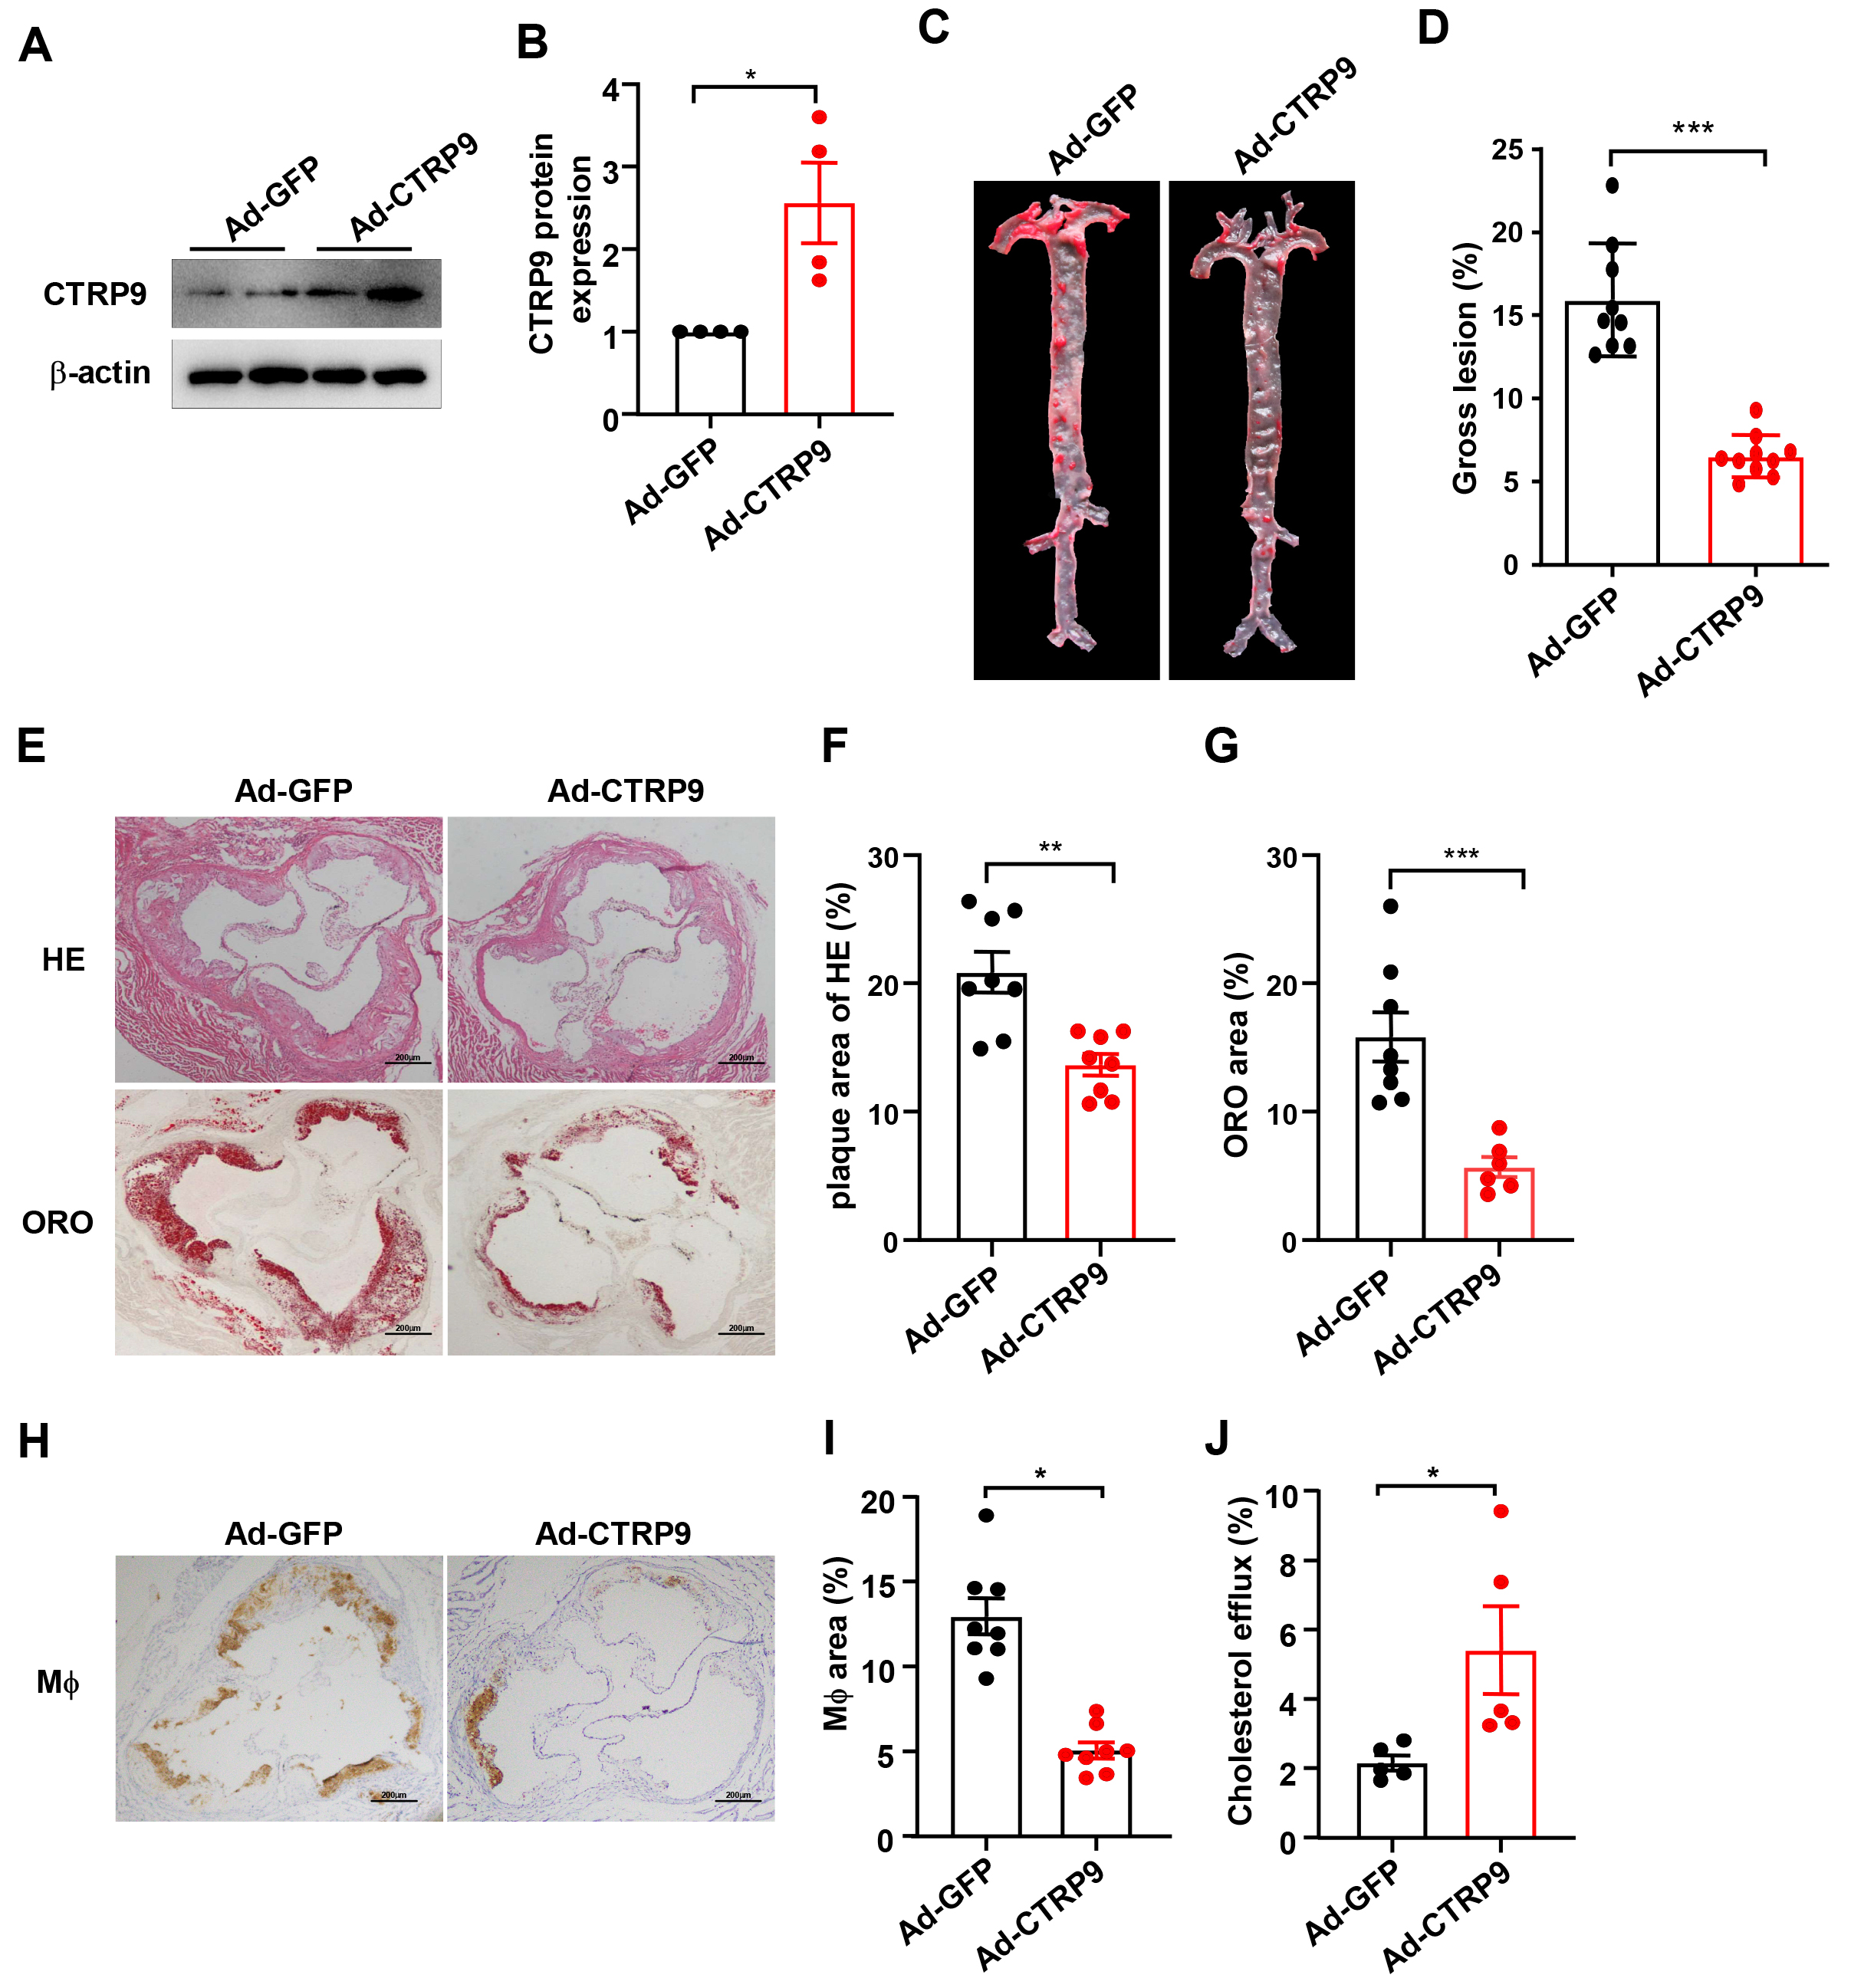 Fig. 1.
CTRP9 was overexpressed in ApoE knockout (KO)
mice. (A) Expression of the CTRP9 protein was determined by Western blotting
(
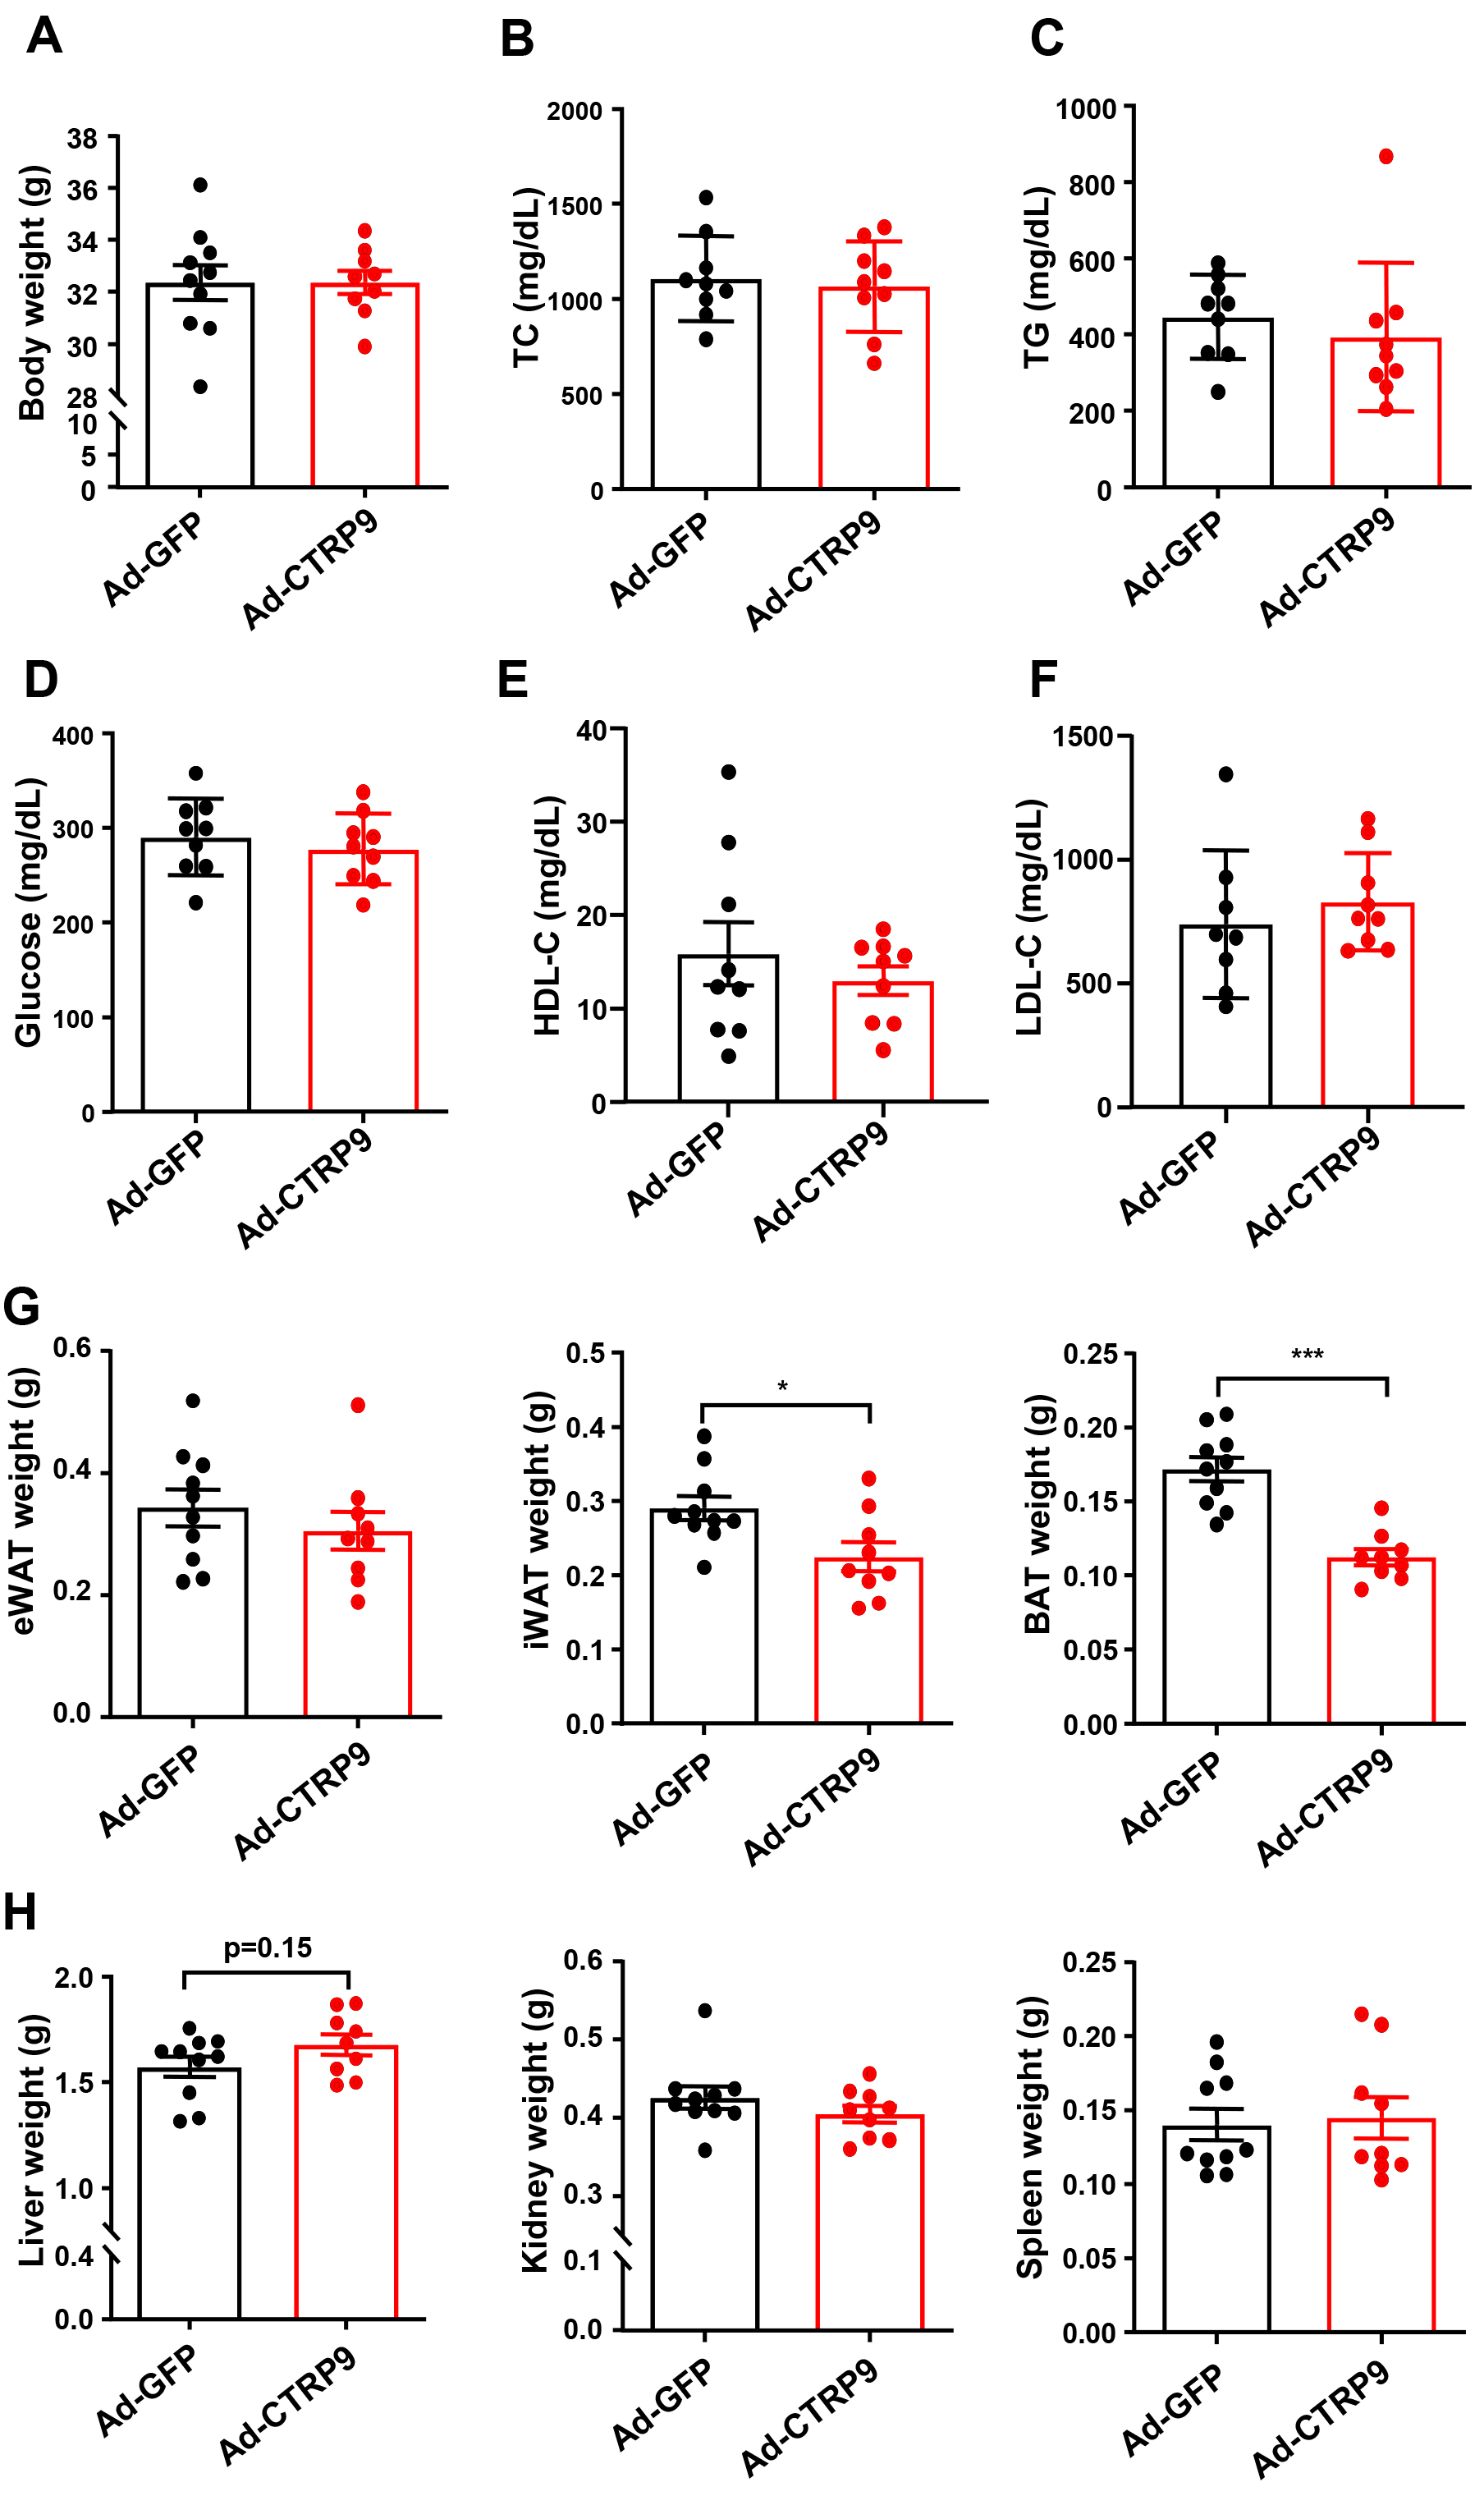 Fig. 2.
Measurement of plasma lipids and tissue weights after
overexpression CTRP9 in ApoE KO mice. (A) Body weights of ApoE KO mice. The
plasma levels of (B) total cholesterol (TC), (C) triglycerides (TGs), (D)
glucose, (E) high-density lipoprotein cholesterol (HDL-C) and (F) low-density
lipoprotein cholesterol (LDL-C) are shown. (G) The weight of epididymal white
adipose tissue (eWAT), inguinal white adipose tissue (iWAT) and brown adipose
tissue (BAT) are evaluated. (H) The weight of liver, kidney and spleen are
calculated. n = 10 in each cohort. Mean
The size of the atherosclerotic lesions in the aorta was substantially lower
(72%) in the Ad-CTRP9 group than in the control group (p
No notable differences in metabolic parameters, including TG, TC, glucose,
LDL-C, and HDL-C levels, were found between the ApoE KO mice that received Ad-GFP
injections and those that received Ad-CTRP9 (p
To evaluate the impact of CTRP9 knockdown on the formation of
atherosclerotic lesions, we administered shRNA adeno-associated virus (AAV),
which targeted mouse CTRP9 (AAV-shCTRP9), or AAV-GFP to ApoE KO mice. The liver
CTRP9 protein levels were notably lower in the AAV-shCTRP9 group than in the
control group at six days post-treatment (p
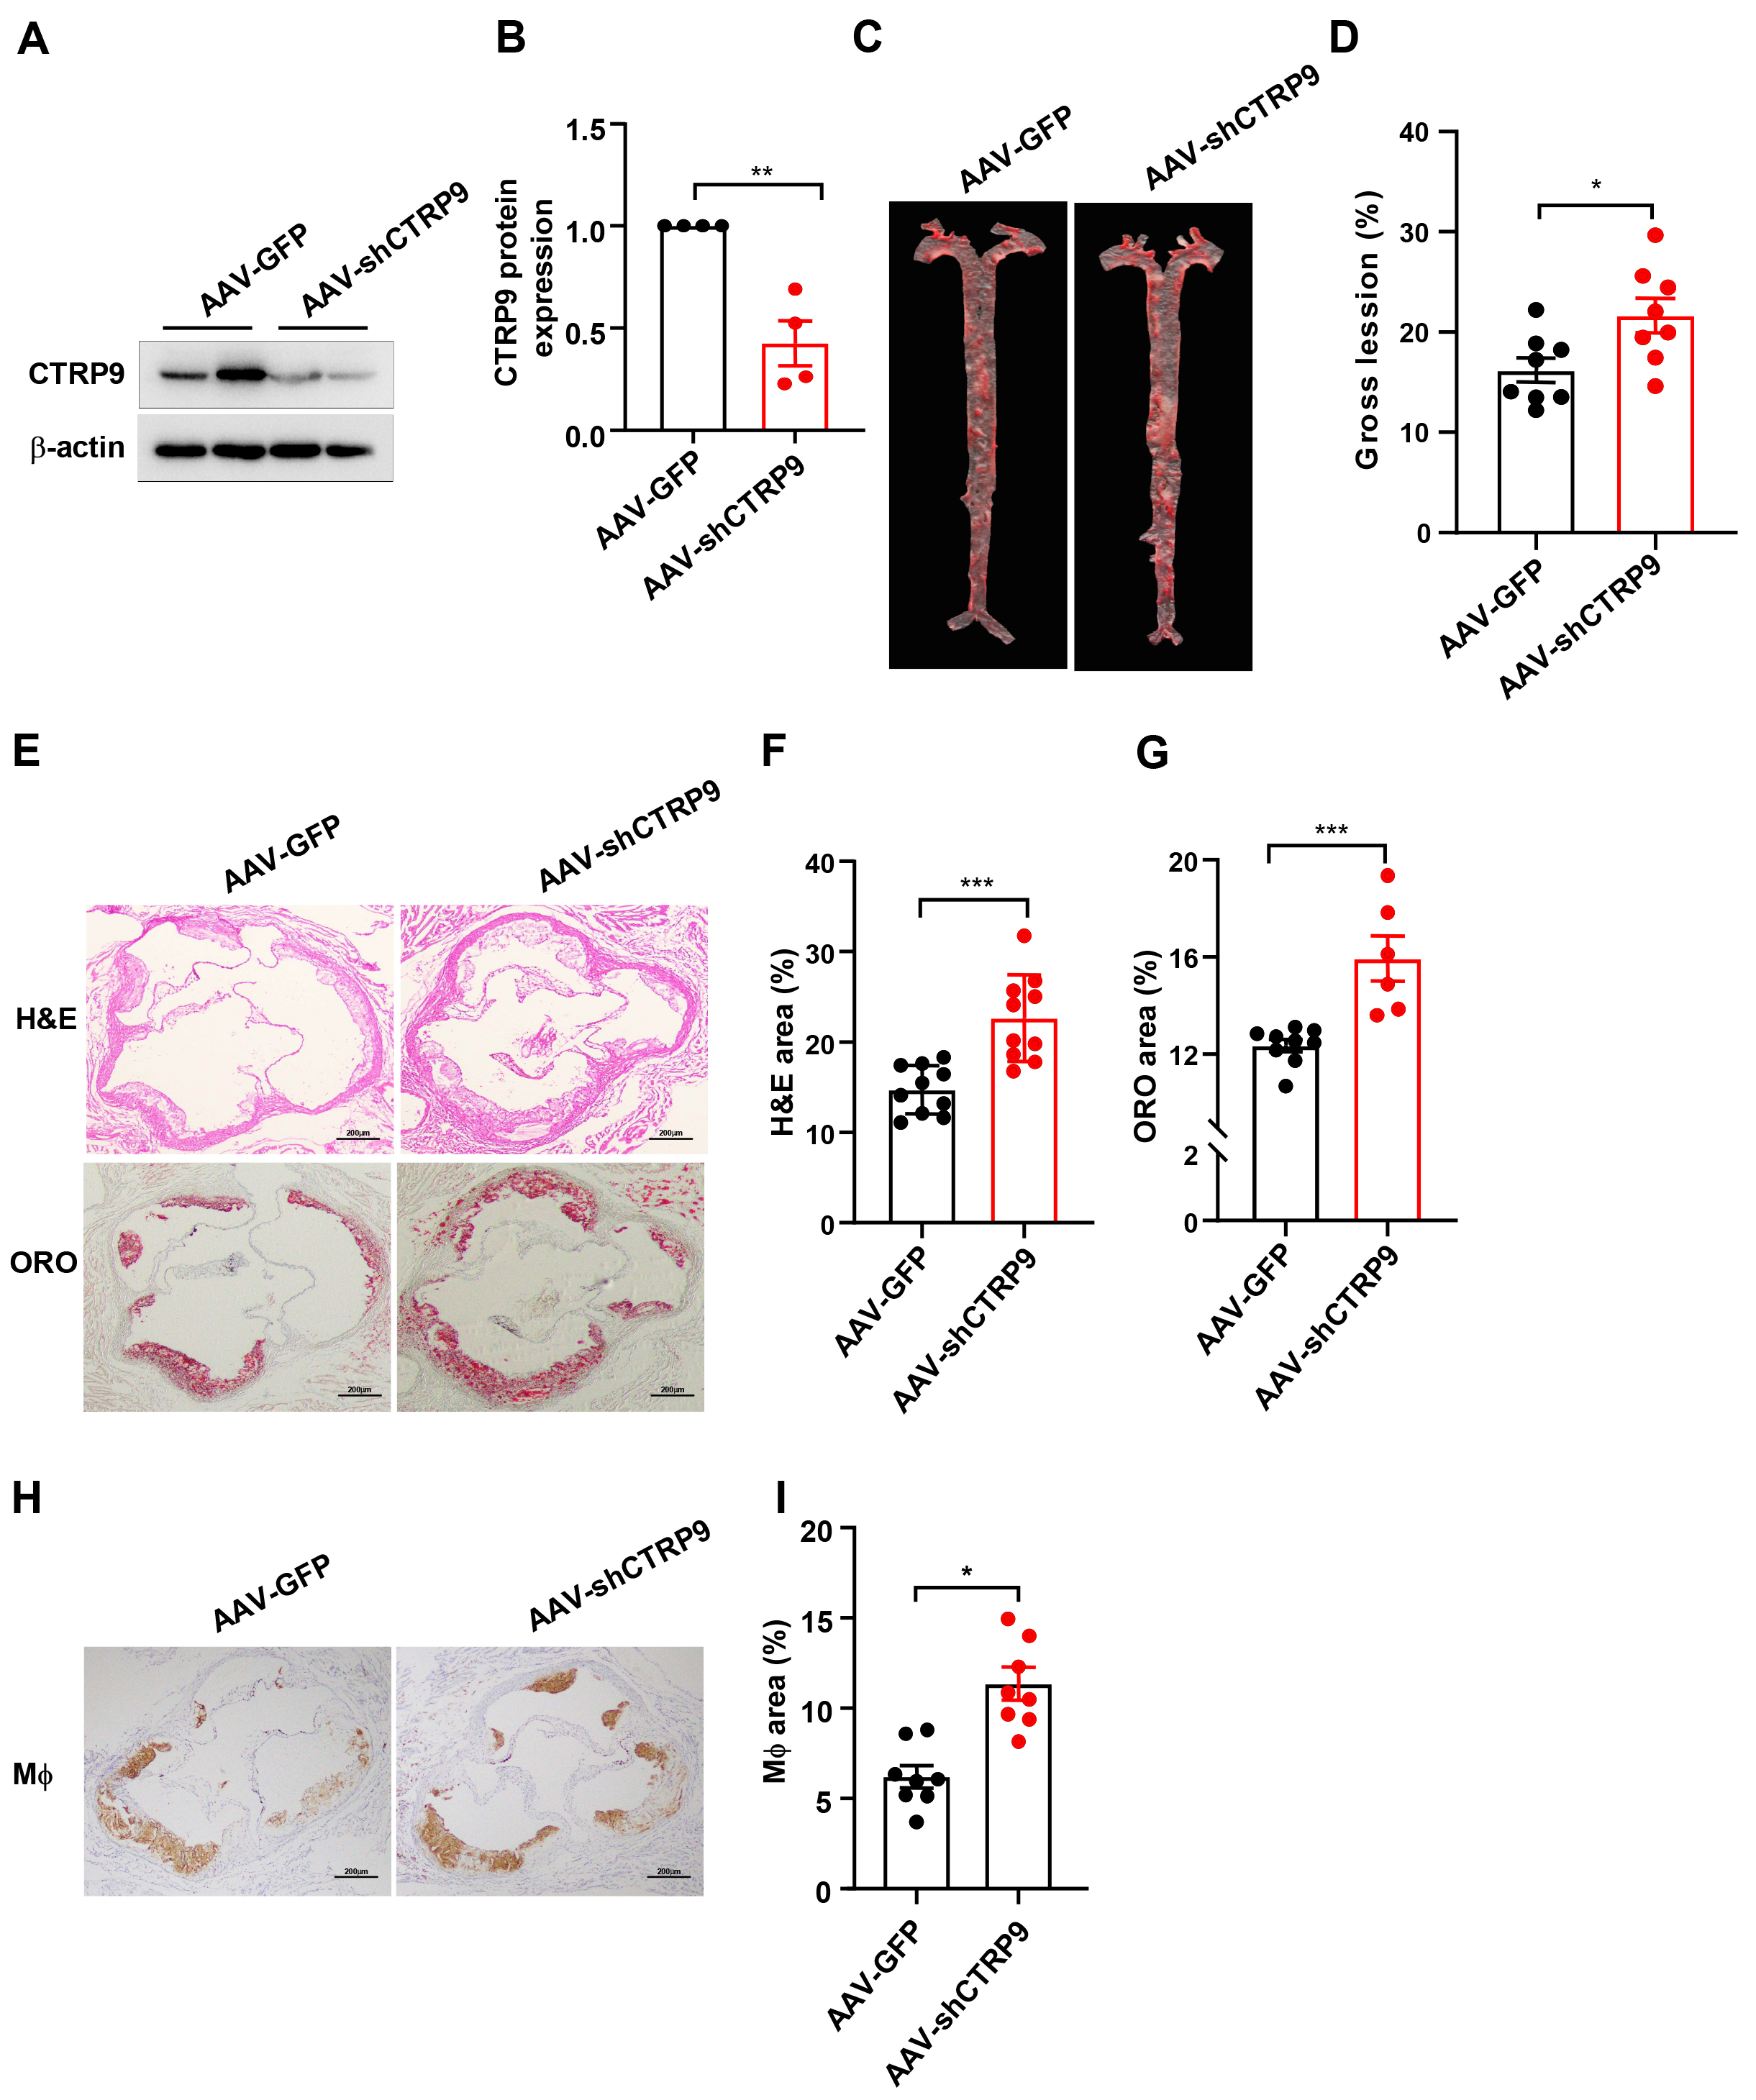 Fig. 3.
CTRP9 knockdown in ApoE KO mice. (A) Protein
expression of CTRP9 was determined by Western blotting (
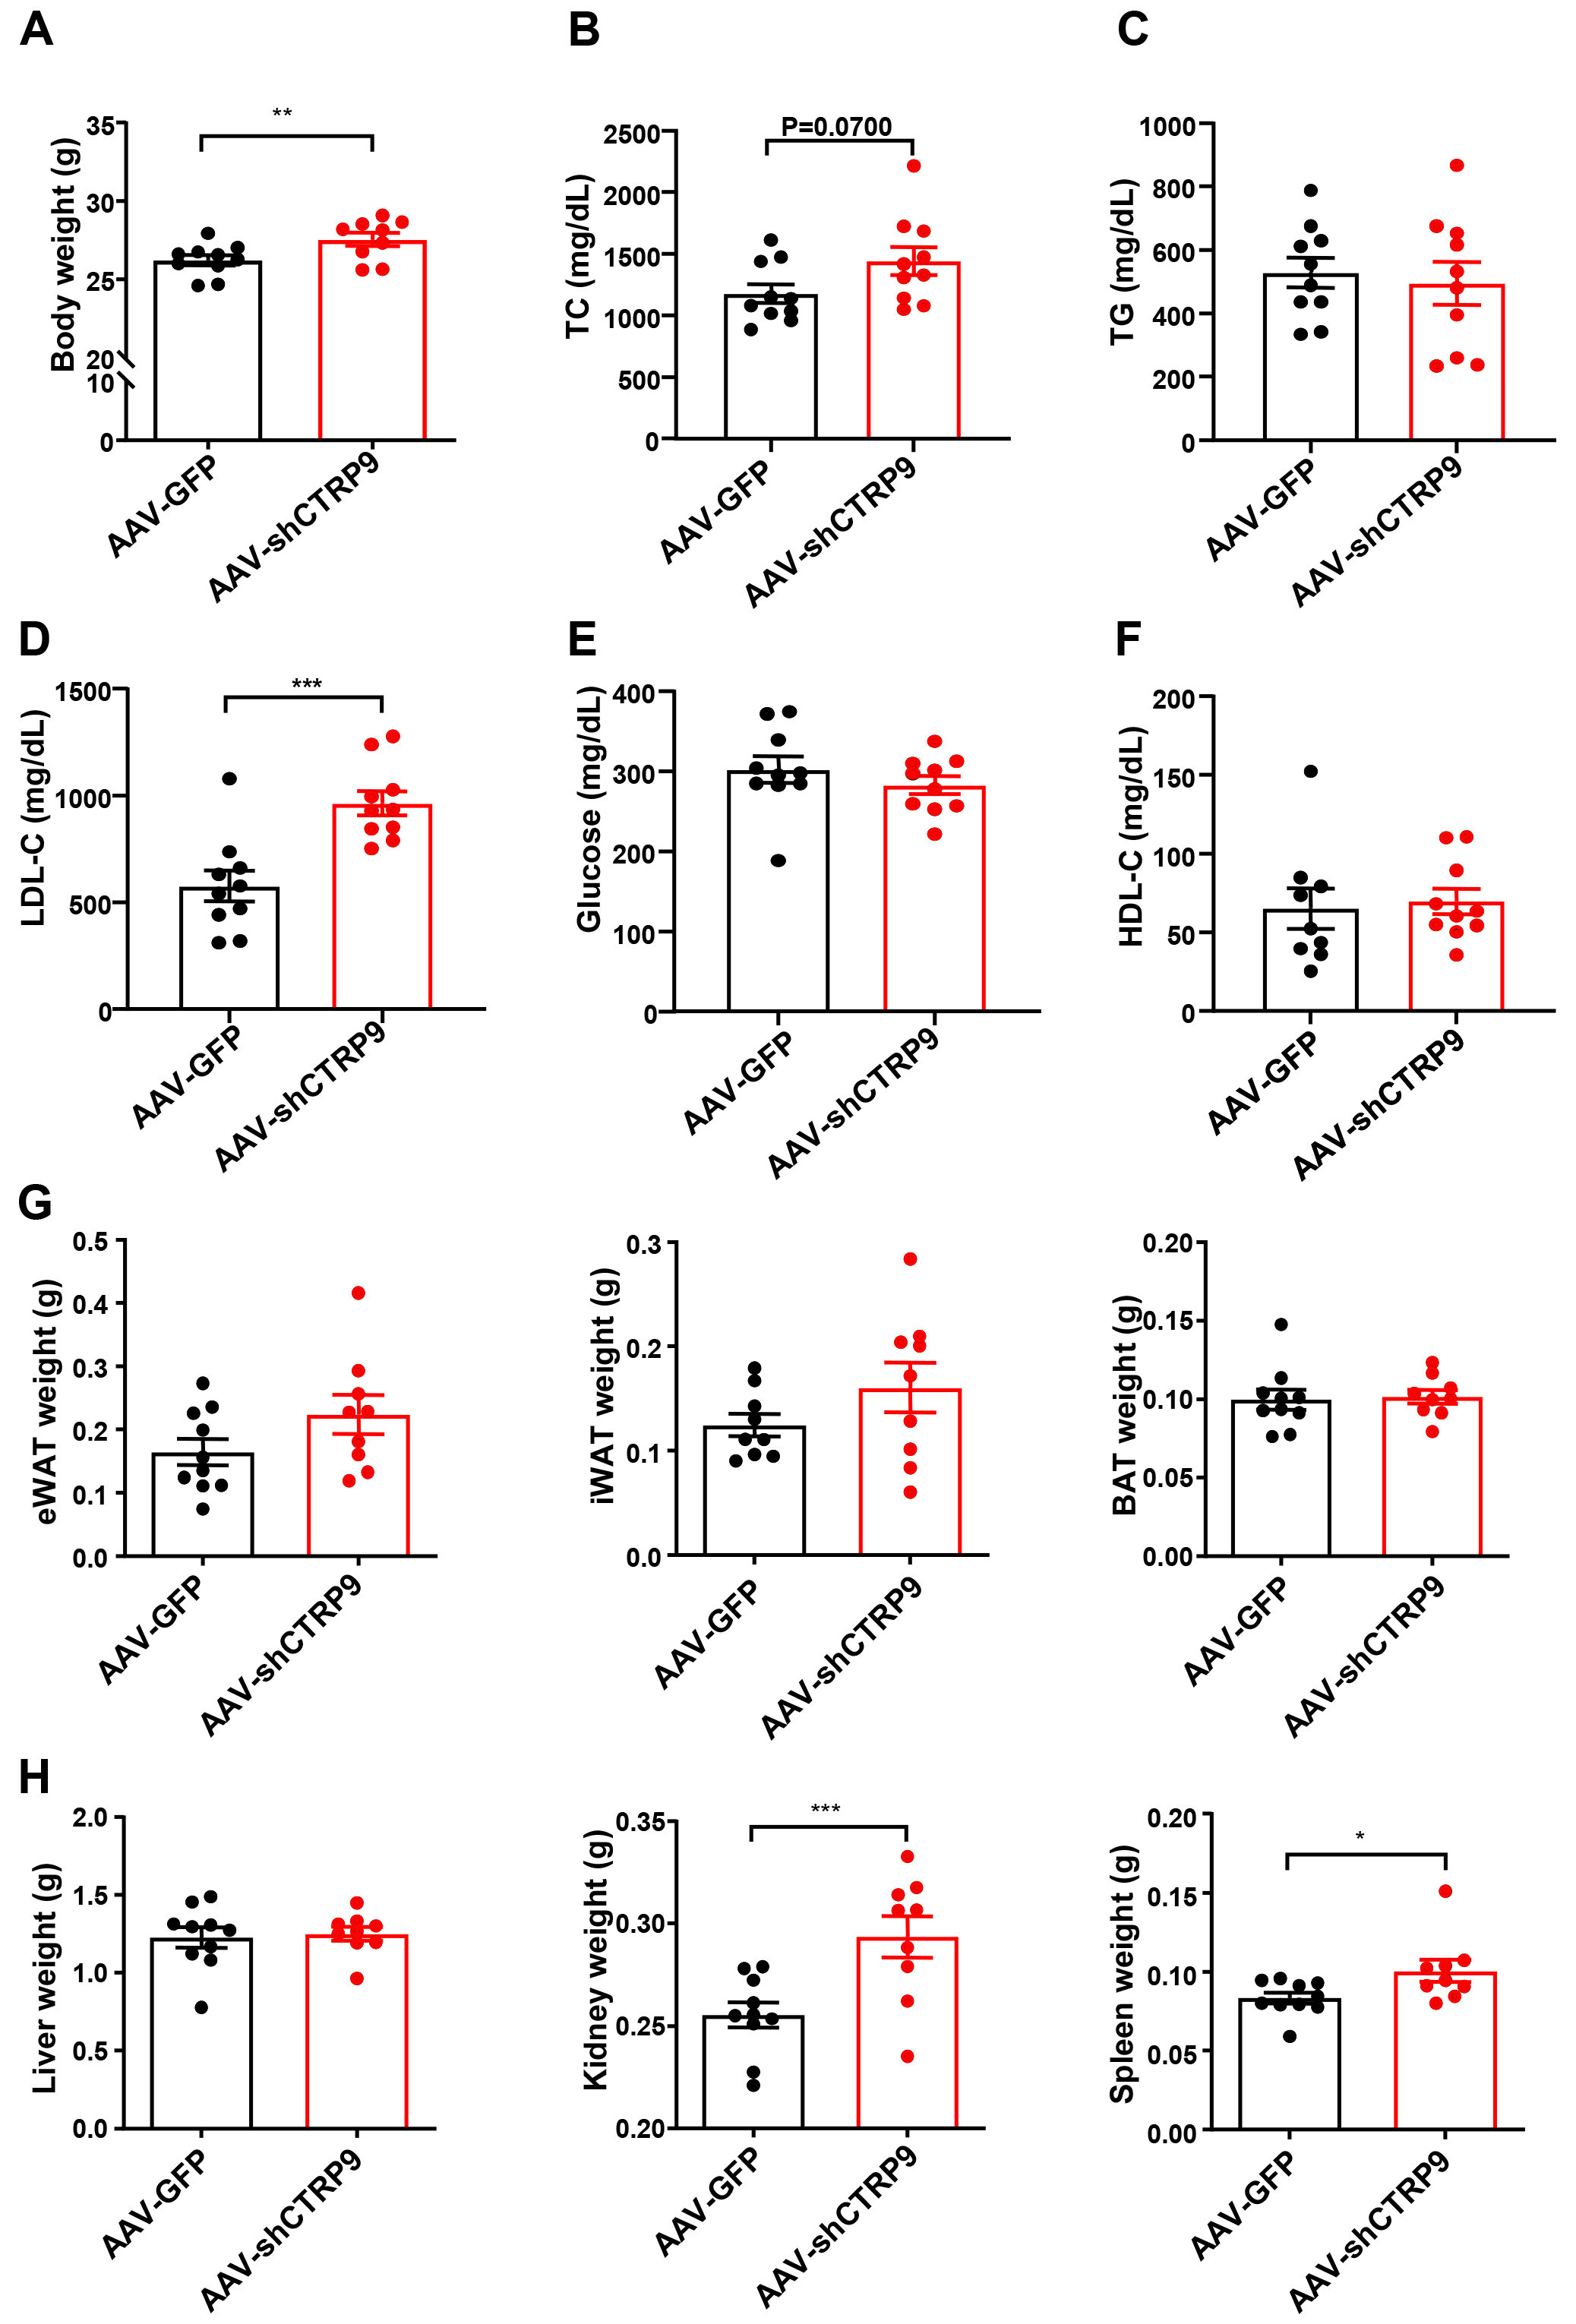 Fig. 4.
Measurement of plasma lipids and tissue weight after
knockdown CTRP9 in ApoE KO mice. (A) Body weights of ApoE KO mice. Plasma
levels of (B) TC, (C) TGs, (D) LDL-C, (E) glucose and (F) HDL-C. (G) The weight of BAT, iWAT and eWAT.
(H) The weight of liver, kidney and spleen. n = 10 in each cohort. Mean
The en face lesion size of the aorta was notably greater (30%) in the
AAV-shCTRP9 group than in the control group (p
To elucidate the molecular changes associated with the shrinkage of atherosclerotic lesions in the mice injected with Ad-CTRP9, we conducted RNA sequencing analysis on aortic samples from ApoE KO mice. Our transcriptomic analysis revealed a total of 3485 DEGs in the Ad-CTRP9 group compared with the control group. Among these DEGs, 1728 genes were upregulated, whereas 1757 genes were downregulated (Fig. 5A, Supplementary Table 1).
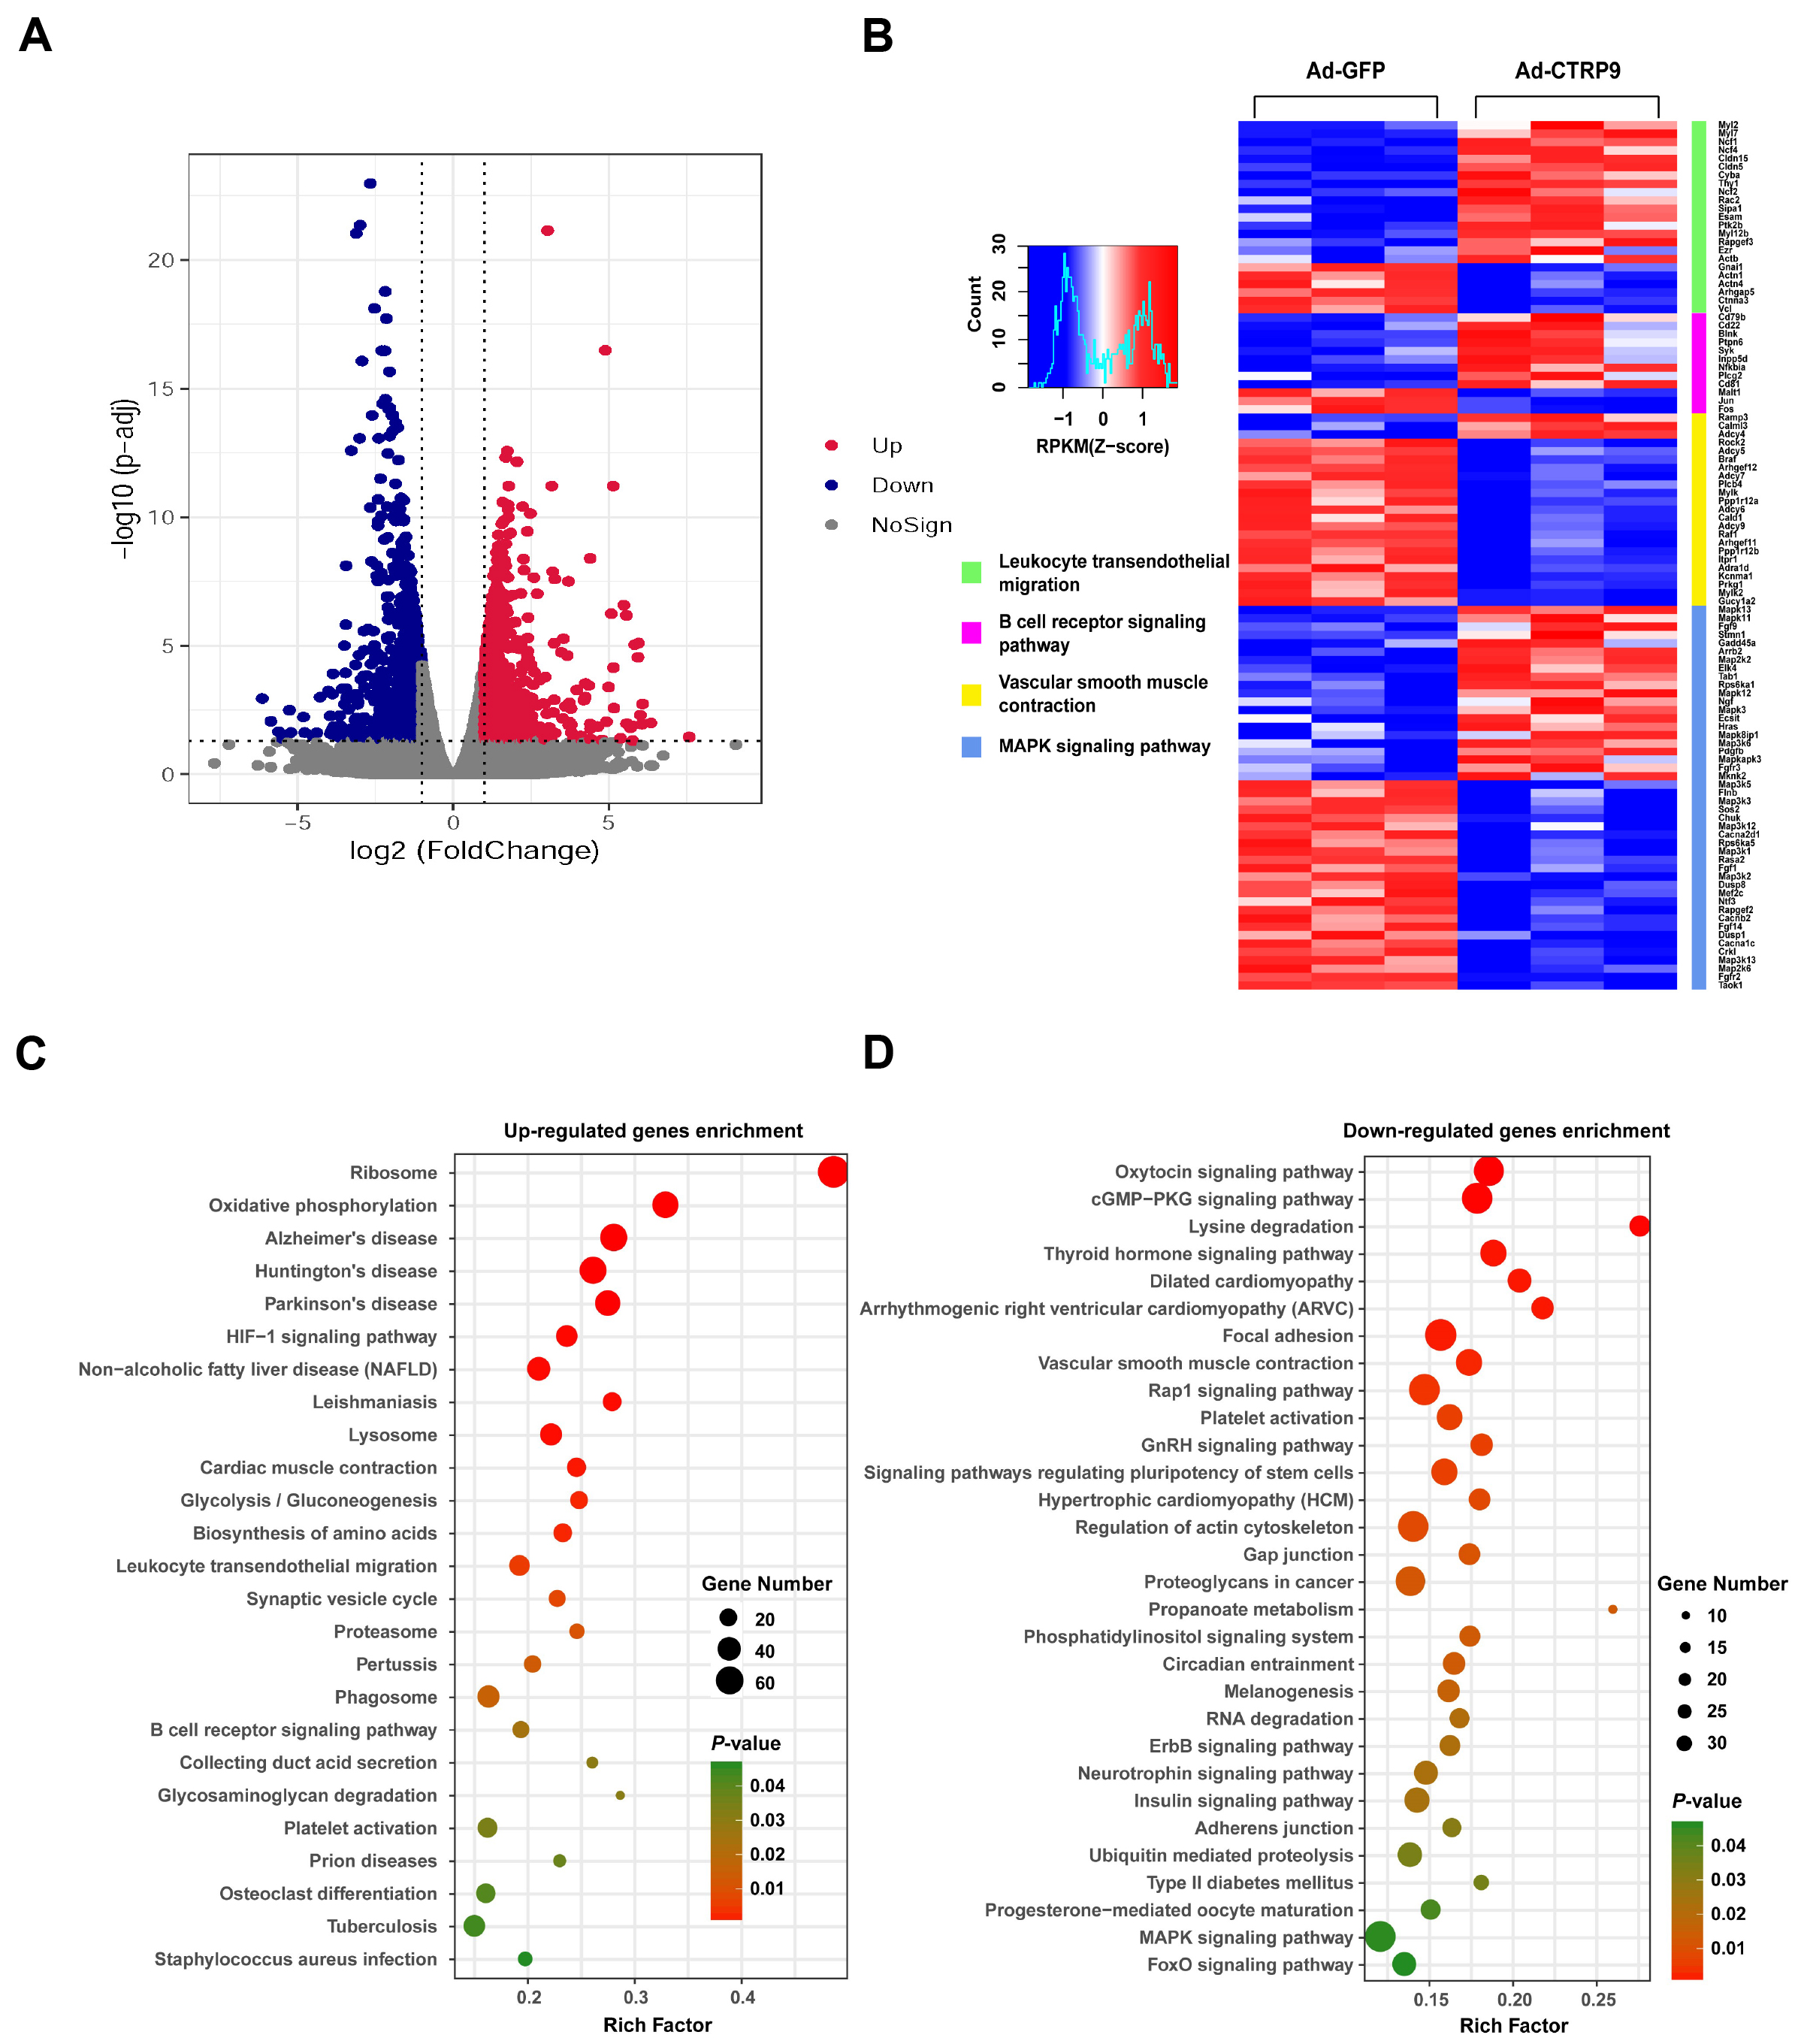 Fig. 5.
Typical characteristics of DEGs in the aortas of
ApoE KO mice. (A) Volcano plots showing the expression of differentially
expressed genes (DEGs) based on RNA sequencing analysis. (B) Analysis of the DEGs
was performed via DESeq software by contrasting the Ad-GFP and Ad-CTRP9 cohorts.
The expression levels are denoted by colors, with red (high expression) and blue
(low expression), and are proportional to their brightness (see color bar). (C,D)
Kyoto Encyclopedia of Genes and Genomes (KEGG) pathway enrichment of DEGs in the
aorta. The DEGs were charted into the KEGG datasets, and significantly enriched
KEGG terms were determined at p
CTRP9 overexpression induced the differential expression of many genes,
including those that mediate oxidative stress, cell adhesion, and cholesterol
effusion and efflux. These genes include proteases (MMP3, MMP23,
TIMP1, TIMP3,and TIMP4), chemokines (CCL4, CCL5, CCL7,
CCL9, CXCL14, CXCL16, and MIF), adhesion molecules (CAV2,
ITGA9, ITGB3, ITGB7, ITGB11,and ICAM2), and those that function in
cholesterol metabolism (LXR
Atherosclerosis is believed to be a chronic and multifaceted condition
characterized by the accumulation of lipids [30]. Lei et al. [31]
reported that CTRP9 can promote the expression of pivotal proteins involved in
cholesterol efflux. Liver X receptor alpha (LXR
The overexpression of CTRP9 significantly regulated the signaling pathway involved in leukocyte transendothelial migration (Fig. 5B and Supplementary Fig. 1). Therefore, we analyzed the genes that were upregulated and downregulated in this signaling pathway according to the RNA-seq results and generated a cascade regulation diagram of the signaling pathway on the basis of the signal transduction pathway (Supplementary Fig. 1). In leukocytes, tail retraction genes (My12b, My12 and My17) and a cell motility-related gene (Rac2) were upregulated (Supplementary Fig. 1), which suggests that the movement of leukocytes in the blood was increased. In contrast, the gene expression levels of endothelial cell adhesion molecules (VCAM1 and ICAM1) were significantly decreased after CTRP9 overexpression (Supplementary Fig. 1). Consistent with these findings, the expression level of the leukocyte surface adhesion molecule ligand protein ITGAL was significantly reduced (Supplementary Fig. 1). Therefore, the ability of monocytes to adhere to endothelial cells was weakened. Moreover, the expression levels of the tight junction genes Cldn5 and ESAM were significantly increased in endothelial cells after Ad-CTRP9 administration compared with those after Ad-GFP administration (Supplementary Fig. 1), indicating that the number of tight junctions between endothelial cells was increased and that the resistance of monocytes to crossing the cell‒cell gap was increased.
A KEGG pathway analysis was subsequently conducted to further elucidate the pathways associated with these DEGs in the context of atherogenesis (Fig. 5C,D). The proportion and quantity of DEGs in these signaling pathways are depicted in Fig. 6. The results indicated that the oxidative phosphorylation signaling pathway had the greatest functional representation with 44 DEGs, which corresponded to approximately 1% of the total number of DEGs. The available evidence indicates that these enriched pathways play critical roles in oxidative stress and the inflammatory reactions associated with atherosclerosis [34]. Our results clearly demonstrated that Ad-CTRP9 primarily modulated genes involved in aortic inflammation and cellular migration (Fig. 5B–D).
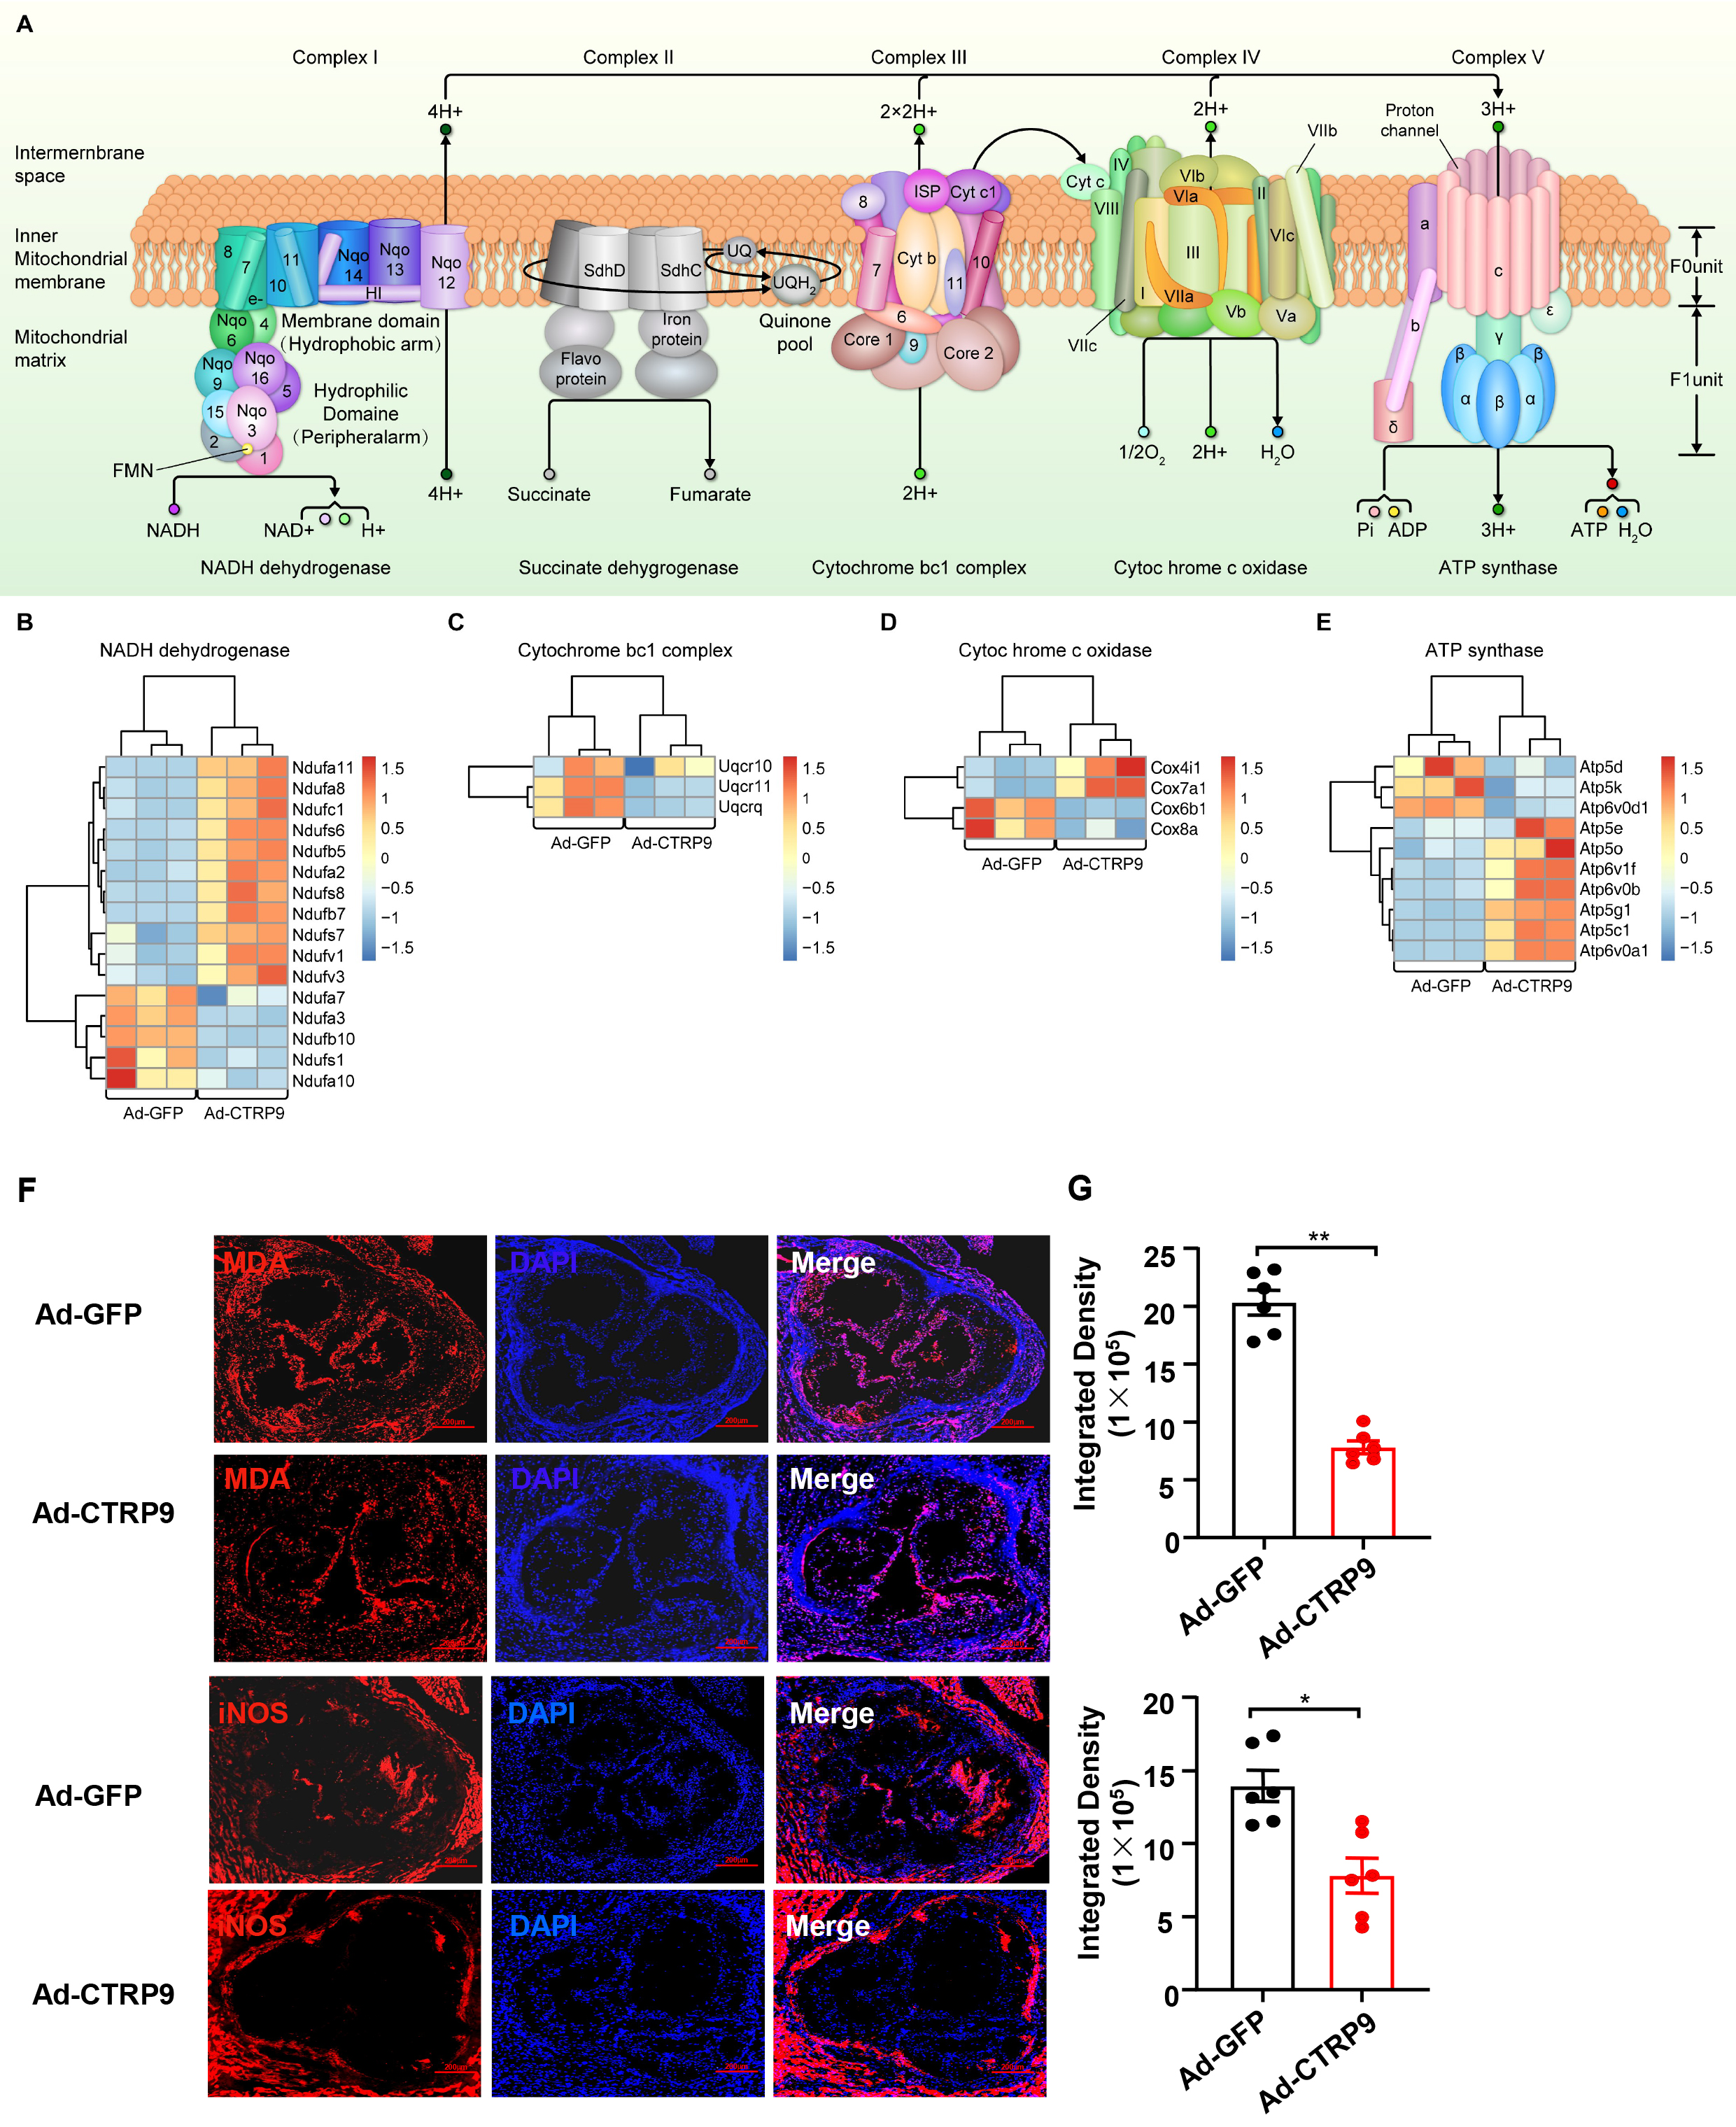 Fig. 6.
CTRP9 overexpression activates mitochondrial oxidative
phosphorylation in the aorta. (A) Diagram of the oxidative phosphorylation
signaling pathway. The results of the bioinformatics analysis revealed that,
except for Complex II, significant changes were observed in the DEGs related to
the other four complexes. Heatmap analysis of DEGs associated with the (B)
Nicotinamide adenine dinucleotide (NADH) dehydrogenase complex, (C) cytochrome
bc1 complex, (D) cytochrome c oxidase complex and (E) ATP synthase complex. The
DEGs were charted into the KEGG datasets, and significantly enriched KEGG terms
were determined at p
We then investigated the antioxidative effects of CTRP9 by quantifying the
plasma levels of proteins related to oxidative stress. As shown in Fig. 7A, the
levels of TNOS and iNOS were significantly lower and the level of T-AOC was
significantly greater in the CTRP9-overexpressing group than in the control group
(p
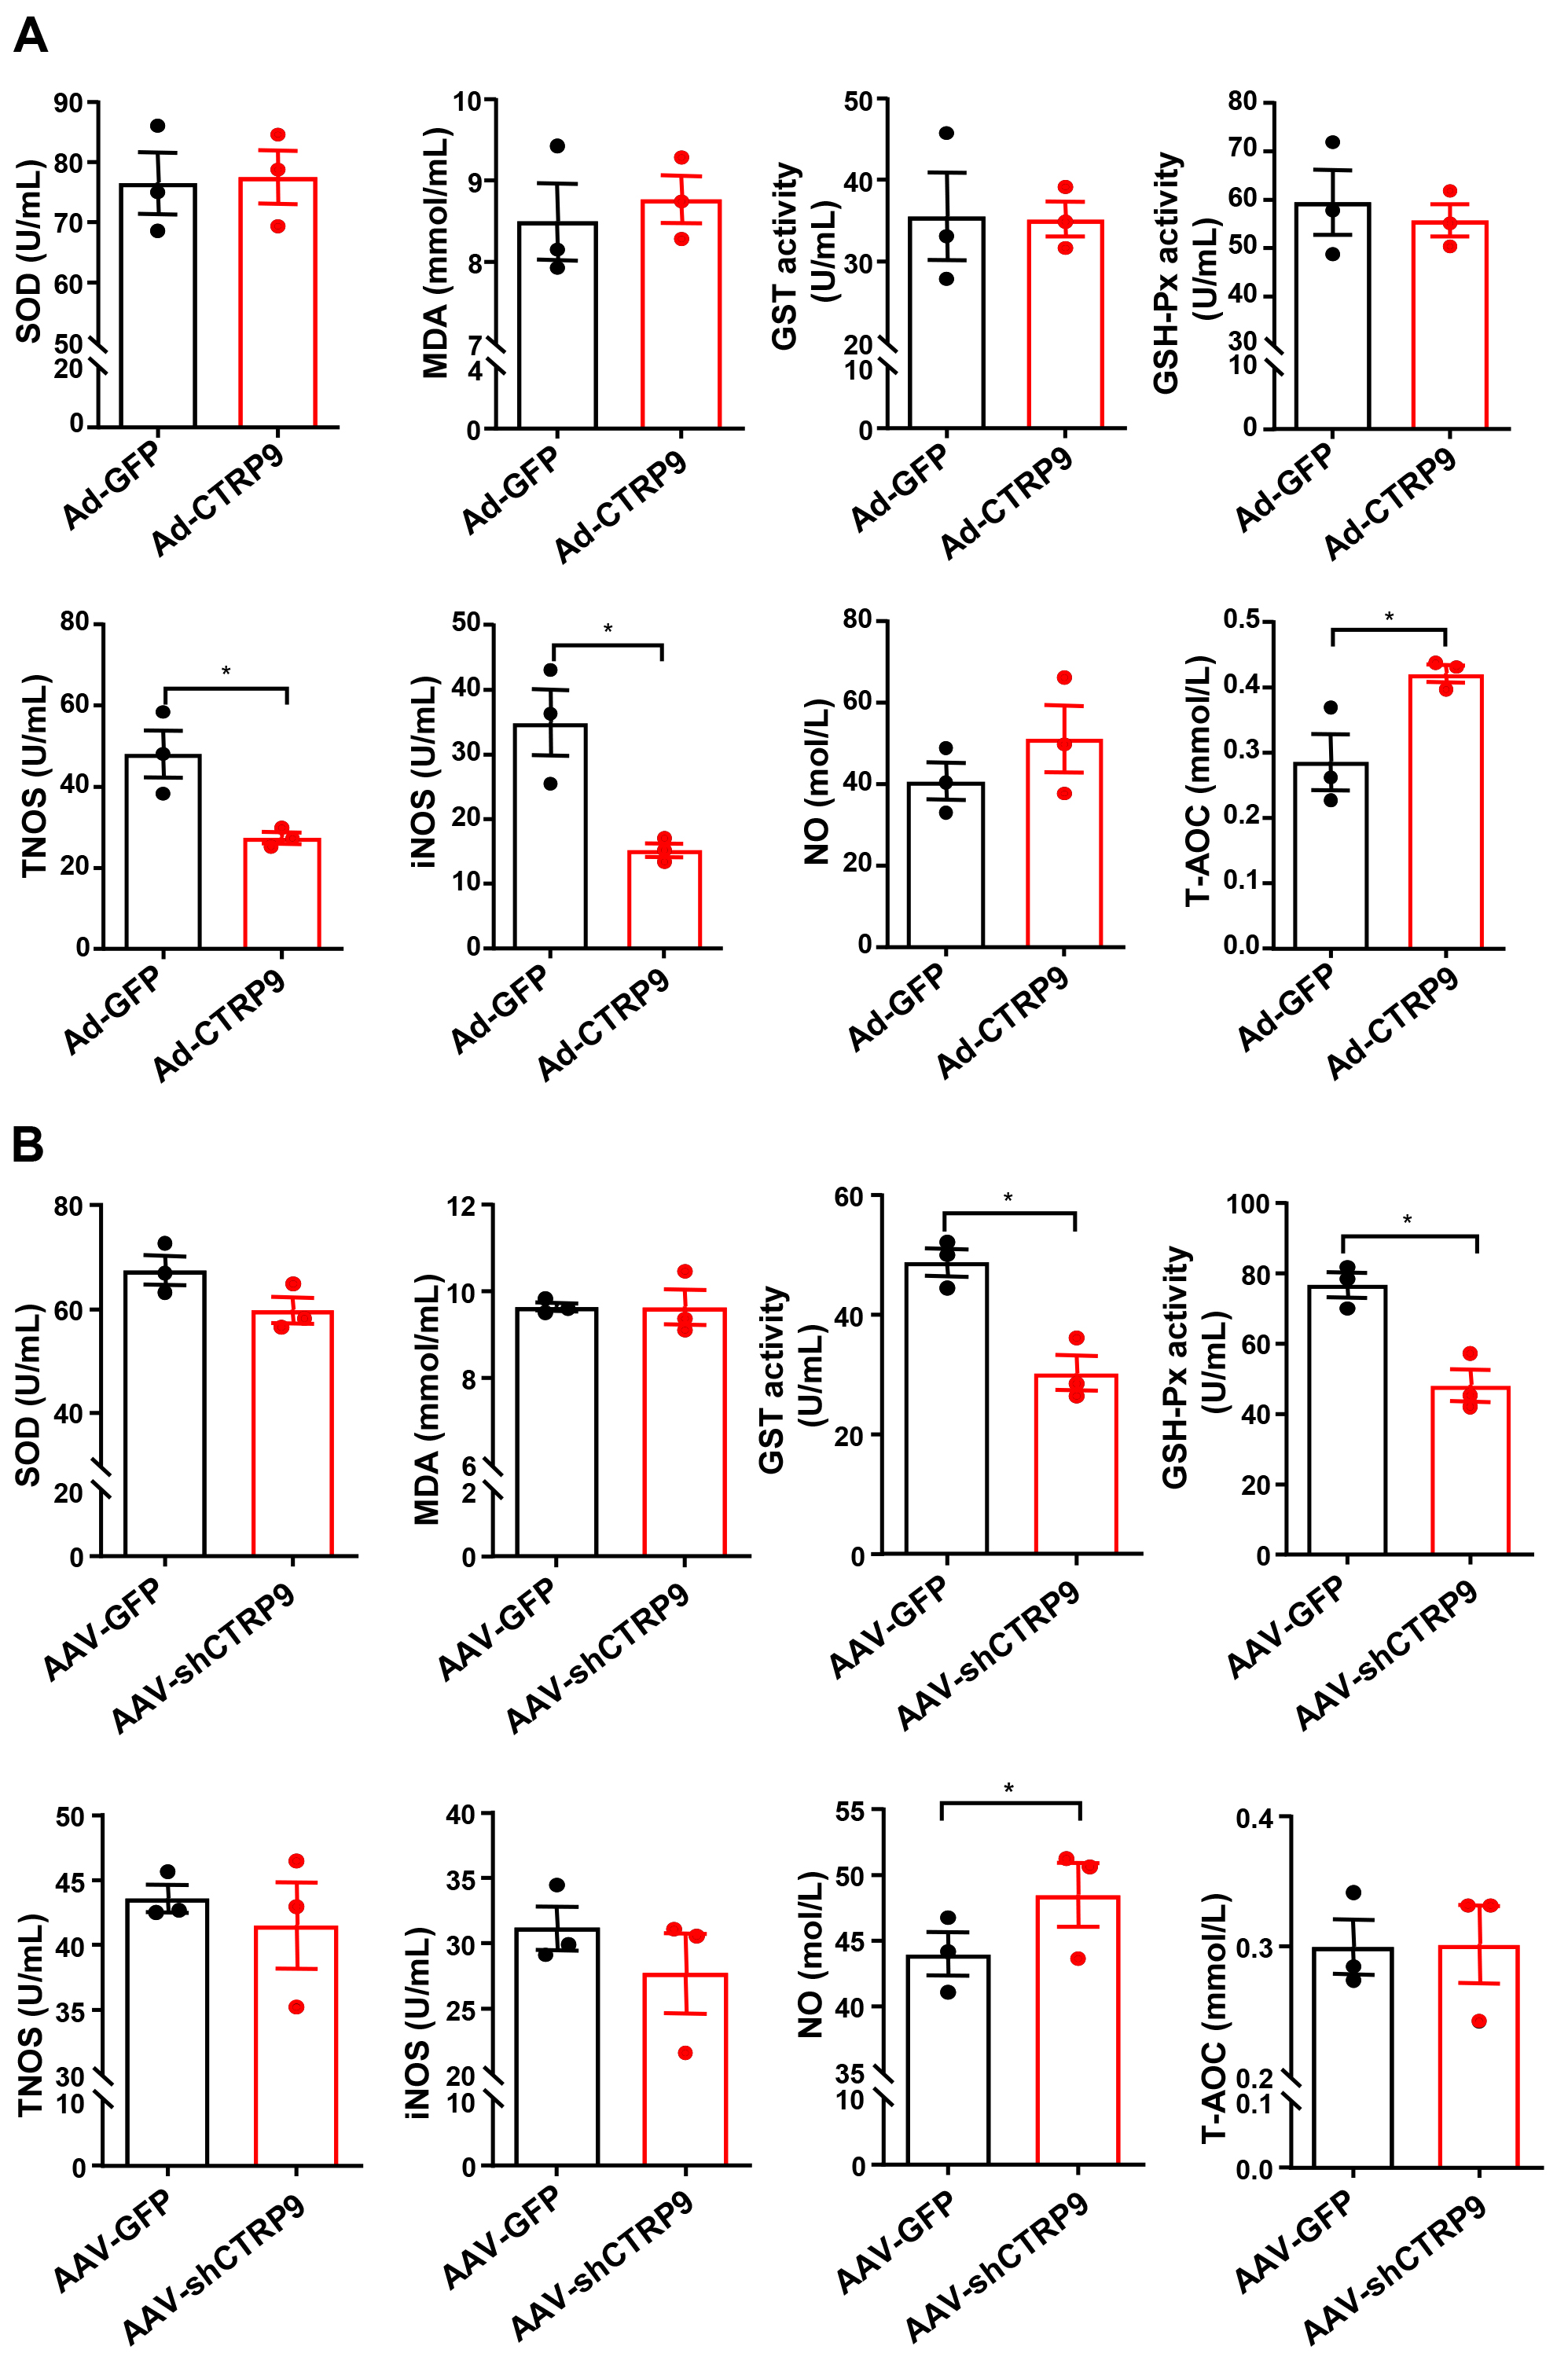 Fig. 7.
Oxidative stress-related protein levels were measured in the
plasma via biochemical methods. Superoxidase dismutase activity (SOD), MDA,
total nitric oxide synthase (TNOS), iNOS, glutathione peroxidase (GSH-Px),
glutathione s-transferase (GST), total antioxidant capacity (T-AOC) and nitric
oxide (NO) were measured after (A) overexpression of CTRP9 or (B) knockdown
CTRP9. n = 3 in each cohort (5 mouse plasma samples were pooled into one sample).
Mean
In the present study, we investigated the effect of CTRP9 on atherosclerotic plaque formation by injecting a virus into the circulation that causes either overexpression or knockdown of CTRP9. To systematically increase the level of CTRP9 in the circulation via adenovirus transfection, we constructed a CTRP9 adenovirus and injected it into the tail vein of ApoE KO mice. Although adenovirus carriers are abundant in liver tissue, the liver is as an expandable organ that stores a large quantity of blood in vessels and receives dual blood supplies from the hepatic portal vein and hepatic arteries. Our results confirmed that CTRP9 is highly expressed in the circulatory system. In the future, we plan to generate transgenic mice with adipose tissue-specific overexpression of CTRP9 via the adiponectin promoter to confirm its function in atherosclerosis.
The results revealed that CTRP9 overexpression significantly inhibited plaque formation, whereas CTRP9 knockdown promoted the formation of aortic plaques, which is consistent with the findings of previous studies [20, 21]. Although CTRP9-mediated attenuation of plaque formation was evident, notably, no significant difference was observed in the plasma levels of TC, TGs, LDL-C, and HDL-C after overexpression of CTRP9. This finding suggests that the practical impacts of CTRP9 are not solely reliant on lowering plasma cholesterol levels. Instead, these effects may be due to a decline in the accumulation of lipids or immune cells [35]. However, surprisingly, CTRP9 knockdown did not alter the plasma lipid profiles but significantly increased the LDL-C levels, which indicates that a reduction in circulating CTRP9 affects LDL metabolism in the liver [36].
The expression of CTRP9 is closely related to the formation of atherosclerotic
plaques, but its underlying molecular mechanism is different from that of
better-known contributors to plaque formation. These findings support the results
of the RNA sequencing analysis, which revealed that numerous genes associated
with atherogenesis, including genes related to apoptosis, oxidative stress, lipid
metabolism, autophagy, and inflammation, were significantly downregulated in the
CTRP9-overexpressing group. In this context, our results demonstrated the
upregulation of LXR
The RNA sequencing analysis of aortas from ApoE KO mice in our study revealed multiple DEGs in enriched signaling pathways. The observed decrease in atherosclerotic lesions in the CTRP9-overexpressing group may be attributed to various potential mechanisms. Accordingly, investigations of key factors, such as the migration and proliferation of smooth muscle cells (SMCs), the formation of foamy macrophages, and the migration and adhesion of monocytes to endothelial cells, are crucial. These biological processes are essential for revealing the possible molecular mechanisms that contribute to the alleviation of atherosclerosis. CTRP9 is a distinctive pleiotropic adipokine and has protective effects on the progression of atherosclerosis through various mechanisms [40]. First, the findings of this investigation indicate that CTRP9 facilitates macrophage polarization toward the M1 phenotype. Additionally, CTRP9 suppresses inflammatory cytokine production in vascular endothelial cells, modulates the apoptosis and proliferation of vascular SMCs, and eliminates the stimulation of macrophages by oxidized low-density lipoprotein (ox-LDL) [39, 41, 42]. Moreover, CTRP9 reduces the level of cholesterol esters, promotes cholesterol outflow and increases the expression level of ABCG1 in ox-LDL-induced THP-1 macrophages. These findings suggest that CTRP9 promotes the formation of foam cells by increasing cholesterol outflow, which is also supported by the results of this study [39, 42]. After cholesterol loading, the transformation of vascular smooth muscle cells (VSMCs) into macrophage-like cells is critical for atherosclerotic progression. CTRP9 significantly reverses the increased secretion of proinflammatory factors induced by cholesterol, the increased adhesion of monocytes, and the transformation of VSMCs into macrophage-like cells [43, 44]. Third, in human aortic endothelial cells, the overexpression of CTRP9 impedes the generation of reactive oxygen species and promotes mitochondrial biosynthesis to protect endothelial cells from oxidative damage induced by high glucose [34]. This study revealed that the oxidative phosphorylation signaling pathway is activated, which confirms previously published results [43, 45]. In addition, the overexpression of CTRP9 reduces VSMC contraction in the aortas of ApoE KO mice compared with that in the control cohort [44].
In clinical research, the levels of plasma CTRP9 are linked to atherosclerosis in diabetic patients without chronic kidney disease, which indicates the probable function of CTRP9 in the progression of atherosclerosis in individuals with type 2 diabetes mellitus [46]. Wang et al. [47] reported that the levels of circulating CTRP9 in the serum and the levels in epicardial adipose tissue are significantly lower in patients with CHD than in healthy subjects. The identification of type II diabetes mellitus and insulin signaling pathways in the KEGG enrichment data analysis further confirms that atherosclerosis is related to obesity, diabetes, and insulin secretion.
In this study, we examined the impact of CTRP9 overexpression in aortic tissue under physiological conditions. However, our study represents an initial exploration, and we acknowledge the need for more comprehensive investigations into the various cell types present in aortic tissue to better understand atherosclerotic plaque formation. Future studies are warranted to explore the specific roles of differential gene expression in various cell types, such as endothelial cells, SMCs, and macrophages, in aortic tissue during the formation of atherosclerotic plaques via single-cell sequencing analysis. These analyses may provide insights into the molecular mechanism underlying the inhibitory effects of CTRP9 overexpression on atherosclerosis in ApoE KO mice. Additional experiments should be conducted to clarify the pivotal role of cell communication, differential gene expression, and signaling pathways in atherosclerotic plaque formation.
Although sex differences affect the incidence rates and complications of atherosclerosis, clinical and preclinical studies are relatively limited and cannot be used to explain the potential mechanism of sex as a biological variable in atherosclerosis [48]. The risk of atherosclerosis and CVD in premenopausal women is lower than that in men. However, after menopause, this sex-related protective effect is lost, and the risk of atherosclerosis in postmenopausal women gradually approaches that in men [49]. Estrogen is believed to protect premenopausal women from CVD. However, in clinical studies, hormone replacement therapy failed to reduce CVD events, which indicates that the relationship between vascular biology and estrogen is complex [49]. Historically, the use of mouse models has improved our understanding of atherosclerosis [50]. These models and the effects caused by sex hormones have been studied to understand the development of atherosclerosis in a more comprehensive manner [50]. Therefore, in this study, to avoid the potential impact of estrogen on the treatment of atherosclerosis with the CTRP9 protein, male mice were selected. In the future, we plan to determine whether CTRP9 also has a protective effect on the development of atherosclerosis in female mice.
In the present study, we used viral overexpression and interference techniques to explore the preventive effect of CTRP9 on atherosclerotic plaque formation, but we did not explore whether CTRP9 has a potential therapeutic effect. Therefore, we will use mouse models of atherosclerosis to explore the important role of CTRP9 in the treatment of atherosclerosis. If certain outcomes are achieved effectively, a new strategy for the clinical treatment of atherosclerotic CVDs could be developed in the future.
CTRP9 impedes the development of aortic atherosclerosis in ApoE KO mice through various signaling pathways. Although the molecular pathways involved have not been fully elucidated, our findings indicate that a reduction in oxidative stress might play a major role in the CTRP9-mediated inhibition of atherosclerosis.
The datasets used and/or analyzed during the current study are available from the corresponding author upon reasonable request.
ABCG1, ATP binding cassette subfamily G member 1; CTRP, C1q/TNF-related protein; CVD, cardiovascular diseases; DEGs, differentially expressed genes; FDR, false discovery rate; GSH-Px, glutathione peroxidase; GST, glutathione S-transferase; H&E, hematoxylin-eosin; HDL-C, high-density lipoprotein cholesterol; iNOS, inducible nitric oxide synthase; LDL-C, low-density lipoprotein cholesterol; LXR
HG, QY and LXX designed the study. HG, HX and BY performed the experiments. HG, AQX and XCC analyzed the data. All authors contributed to editorial changes in the manuscript. All authors read and approved the final manuscript. All authors have participated sufficiently in the work and agreed to be accountable for all aspects of the work.
All animal studies were performed according to the guidelines of the Chinese Council on Animal Care and ethical approval was obtained for the use of animals prior to the start of the study from the ethics committee of the Fourth Military Medical University (Approval No. k9-014).
We thank Bullet Edits Limited for the linguistic editing and proofreading of the manuscript.
This work was supported by grants from National Natural Science Foundation of China (81900399).
The authors declare no conflict of interest.
Supplementary material associated with this article can be found, in the online version, at https://doi.org/10.31083/j.fbl2909339.
References
Publisher’s Note: IMR Press stays neutral with regard to jurisdictional claims in published maps and institutional affiliations.