


1 Key Laboratory of Molecular Oncology and Epigenetics, The First Affiliated Hospital of Chongqing Medical University, 400016 Chongqing, China
2 Department of Oncology and Hematology, Chongqing University Central Hospital, 400014 Chongqing, China
Abstract
Lung adenocarcinoma (LUAD) is the predominant histological subtype among non-small cell lung cancer cases, representing approximately 40% of all cases. Shugoshin 2 (SGO2) is implicated in tumorigenesis and tumor progression. This study aimed to uncover a potential role of SGO2 in the LUAD.
Data related to gene mRNA expression and clinical information were obtained from The Cancer Genome Atlas (TCGA), The Genotype-Tissue Expression (GTEx), and the Cancer Cell Line Encyclopedia (CCLE) databases. Cell Counting Kit-8 (CCK-8), Transwell, scratch assay, and flow cytometry were applied to investigate the biological functions of SGO2 in the LUAD. Western blot was conducted to detect the protein expression.
Through pan-cancer analysis, SGO2 was found to be consistently overexpressed in 25 of 33 cancer types, including LUAD. In vitro assays revealed that SGO2 knockdown significantly impeded cell proliferation, cell migration, invasion and epithelial-mesenchymal transition (EMT), whereas its overexpression promoted these abilities. Flow cytometry confirmed that SGO2 contributed to cell cycle progression and reduced cell apoptosis. Furthermore, SGO2 facilitated cell proliferation and regulated cell cycle through upregulating recombinant E2F transcription factor 1 (E2F1).
Our study demonstrated that SGO2 was up-regulated in pan-cancers including LUAD and its high expression was strongly associated with poor overall survival (OS) and progression-free survival (PFS) of patients with LUAD. SGO2 promoted cell proliferation, cell migration, invasion and EMT of A549 cells. Additionally, E2F1 was involved in regulation of cell cycle and cell proliferation mediated by SGO2. This research elucidated the oncogenic significance of SGO2 in LUAD, proposing its potential as a prognostic biomarker and a promising target for therapeutic interventions.
Keywords
- SGO2
- lung adenocarcinoma
- proliferation
- apoptosis
- migration and invasion
- cell cycle
- epithelial-mesenchymal transition
Lung adenocarcinoma (LUAD) is a common subtypes of lung cancer and is characterized by its growing occurrence and mortality rate [1]. LUAD typically arises from DNA mutations or genomic abnormalities in lung cells, leading to uncontrolled cell growth and division and ultimately resulting in malignant tumors [2]. Changes in the expression of pivotal genes may affect multiple biological functions of tumor cells. Despite the existence of several treatment options, the cure rate for LUAD remains unsatisfactory [3]. In recent decades, there have been substantial advancements in comprehending and managing LUAD, with molecular-targeted therapy emerging as a crucial approach. This therapy involves the use of drugs designed to specifically target certain molecules associated with cancer, offering potential precision in treatment [4]. It also has merits in sparing healthy cells from damage caused by traditional chemotherapy drugs, while simultaneously enhancing treatment efficacy. Continuous progress in molecular biology and biotechnology has revealed an increasing number of molecular targets associated with LUAD, instilling new hope for more effective treatment [5]. Given the high morbidity and mortality linked to LUAD, it is crucial to explore the molecular mechanisms governing the development of LUAD and to identify robust biomarkers capable of accurately predicting patient outcomes.
Shugoshin (SGO) family genes are important in mitosis and chromosome segregation processes of cells, and aberrations in SGO function may contribute to tumorigenesis as one of underlying mechanisms [6, 7]. As one of the SGO family members, SGO2 cooperates with phosphatase 2A to protect centromeric cohesion in oocytes from separate-mediated division, which is particularly evident during meiosis I [8, 9]. In addition, SGO2 serves as an important protective agent for meiotic cohesion and may promote tumorigenesis by regulating abnormal cell division in the cell cycle [10]. For example, SGO2 may act as a biomarker that predicts the disease progression in patients with gliomas [11]. Although SGO2 is highly expressed in various tumor types, including gastric cancer [12] and liver cancer [13], its biological function in LUAD remains unknown.
In this study, we demonstrated that SGO2 was significantly upregulated in the LUAD tissues and its high expression was associated with poor prognosis of patients with LUAD. In addition, we further explored the biological function of SGO2 in the progression of LUAD. Therefore, our study aimed to uncover the prognostic and functional roles of SGO2 in LUAD, which might bring novel insight for clinical diagnosis and treatment of LUAD.
Gene mRNA expression data from 33 various cancer types were obtained from The Cancer Genome Atlas (TCGA, https://portal.gdc.cancer.gov/) and The Genotype-Tissue Expression (GTEx, https://commonfund.nih.gov/GTEx) databases to perform comprehensive pan-cancer analysis. In addition, data from the Cancer Cell Line Encyclopedia (CCLE, https://portals.broadinstitute.org/ccle/) database were collected to access the expression of SGO2 in pan-cancer cells.
Data including overall survival (OS) and progression-free survival (PFS) were acquired from TCGA database. Kaplan-Meier (KM) was applied to perform survival analysis via “survival” (V 3.7-0) and “survminer” (V 0.4.9) packages. Cox analysis was employed to investigate the connection between SGO2 expression and survival utilizing “survival” (V 3.7-0) and “forestplot” (V 3.1.3) packages. Nomogram model relies on multiple regression analysis and integrates gene expression and clinical symptoms to predict the disease outcomes. This method employs scaled lines plotted on a common plane to illustrate the interrelationships among variables in the prediction model. Through establishing a multiple regression model, each level of influencing factor was assessed based on its contribution of the influencing factors to the target parameter (the magnitude of the regression coefficient). These scores for each factor were then summed to yield a total score, thereby estimating the value of interest.
To further investigate the potential function of SGO2, Kyoto Encyclopedia of
Genes and Genomes (KEGG) analysis was performed by the package
“clusterProfiler” (v 4.7.1.001) in R software (University of Auckland, Oakland,
CA, USA). p
To explore the correlation between SGO2 and recombinant E2F transcription factor 1 (E2F1), Spearman’s correlation analysis was employed to describe the relationship between non-normally distributed quantitative variables. A p-value of less than 0.05 was considered statistically significant. The correlation plot between the two genes was visualized using the R software package “ggstatsplot” (V 0.12.4).
Human A549 cells were purchased from American type culture collection (ATCC) and were maintained in RPMI 1640 medium (11875093, Gibco, Grand Island, USA) supplemented with 10% fetal bovine serum (FBS) (A5670701, Invitrogen, Waltham, MA, USA) and 1% penicillin-streptomycin in a standard incubator at 37 °C, 5% CO2. The identification of A549 cells was carried out by Short Tandem Repeat (STR) analysis. A549 cells were mycoplasma-negative and the culture medium was replaced every 2–3 days.
Small interfering RNAs targeting SGO2 (si-SGO2) or negative control (si-NC) were synthesized by Kainai BioTech (Chengdu, China). Cells were transfected into si-SGO2 or si-NC using Lipofectamine 3000 (L3000001, Invitrogen, Waltham, MA, USA) according to the manufacturer’s instructions. The sequences of si-SGO2 are as follows:
si-SGO2a: 5′-UAAUUCCUGAGGUAAAAAGUGUU-3′ (sense), 5′-CUUUUUACCUCAGGAAUUAAGUU-3′ (antisense);
si-SGO2b: 5′-AGUCUUUGAAAUUCUUUUGUCUU-3′ (sense), 5′-CAAAAGAAUUUCAAAGACUACUU-3′ (antisense);
si-SGO2c: 5′-AAAUAGAAGAAUUAUUUAGUAUU-3′ (sense), 5′-CUAAAUAAUUCUUCUAUUUUCUU-3′ (antisense);
si-NC: 5′-ACGUGACACGUUCGGAGAAUU-3′ (sense), 5′-UUCUCCGAACGUGUCACGUUU-3′ (antisense).
Plasmids encoding overexpression SGO2 (OE-SGO2) or negative control (OE-NC) were from Kainai BioTech and transduced into A549 cells to perform the corresponding assays.
Total RNA was isolated from A549 cells using TRIzol (15596018CN, Invitrogen,
Waltham, MA, USA) and reverse-transcribed into cDNA using the
Goldenstar™ RT6 cDNA Synthesis Kit Ver.2 (TSK302M, Tsingke,
Beijing, China) according to the manufacturer’s instructions. Subsequently, qPCR
analysis was conducted in accordance with the 2
Radio-immunoprecipitation assay lysis buffer containing protease inhibitors was
applied to extract total protein of cells. The protein concentration was
determined using a bicinchoninic acid (BCA) kit (Beyotime, Shanghai, China). Each group of protein was
separated by sodium dodecyl sulfate -polyacrylamide gel electrophoresis
(SDS-PAGE), transferred to polyvinylidene fluoride (PVDF) membranes, and sealed
with 5% skim milk for 1 h. The membranes were incubated overnight at 4
°C with primary antibodies against SGO2 (1:1000, bs-24137R, Bioss,
Beijing, China), E-cadherin (1:500, AF0138, Beyotime, Shanghai, China), Vimentin
(1:1000, MAB040Hu22, Cloud-clone, Wuhan, Hubei, China), Twist (1:500, AF8274,
Beyotime), E2F1 (12171-1-AP, Proteintech, Wuhan, China), B-cell lymphoma-2 (BCL2)
(26593-1-AP, Proteintech), Cyclin E1 (11554-1-AP, Proteintech), GAPDH
(60004-1-Ig, Proteintech) or
Cell viability was assessed using Cell Counting Kit-8 (CCK-8, Biosharp, Hefei, China) according to the instructions of manufacturer. Briefly, A549 cells were planted in 96-well plates and added to 10 µL of CCK-8 reagent to each well, followed by incubation at 37 °C. The absorbance at 450 nm was detected using enzyme calibration.
A549 cells (6
A549 cells were seeded in 6-well plates and grown until the formation of a confluent monolayer. Scratches were made in the center of the slide with a 10 µL sterile pipette tip. Detached cells were removed by washing with phosphate buffered saline (PBS), and fresh medium was added to each well. The initial gap width (0 hour) and the closure process at 24 hours were documented by taking photographs under a microscope. ImageJ software (V 1.8.0, LOCI, University of Wisconsin, Madison, WI, USA) was used to measure the distance of cell migration across the scratch, and the results were presented as a percentage of closure relative to the initial scratch width.
Cells was treated by fluorescein isothiocyanate (FITC)-5-Bromo-2′-deoxyuridine (BrdU) Cell Proliferation Detection Kit (KGA9201-20, KeyGEN BioTECH, Nanjing, China). Flow cytometry for cell proliferation was generally divided into several steps: Firstly, when cells reached about 80% confluence, they were added into BrdU (KGA326, Sigma, MO, USA) and incubated at 37 °C for 60 min. Subsequently, cells were harvested, fixed, permeabilized by 0.5% Triton, underwent DNA denaturation for 30 min at 37 °C, and centrifuged at 1000 g for 10 minutes. Finally, FITC-BrdU antibody was added to stain for 30 min at 4 °C. The stained cells were analyzed for FITC channel fluorescence signal using flow cytometry.
Apoptosis by flow cytometry was performed according to the instructions of the manufacturer (KGA108-2, KeyGEN, Nanjing, China). Generally, cells were collected, centrifuged at 2000 rpm for 5 min and resuspended by Binding Buffer. After that, the cells were added to 5 µL Annexin V-FITC and incubated in the dark for 15 min at room temperature. Finally, propidium iodide (PI) was added into cells and flow cytometry was performed.
For cell cycle, the method is as follows. Briefly, after cells were transfected using corresponding small interfering RNA (siRNA) or plasmids, cells were harvested and fixed in cooled 70% ethanol to preserve their DNA content. The fixed cells were then stained with PI and were analyzed using a flow cytometer (BD Biosciences, San Jose, CA, USA).
Data were processed by GraphPad Prism 8.01 (GraphPad Software, University of
California, San Diego, CA, USA) and shown as the mean
We analyzed SGO2 expression in 33 human cancers by leveraging data from both the TCGA and GTEx datasets. Elevated SGO2 expression was observed in 25 tumor types, including LUAD (Fig. 1A). In comparison, normal tissues generally exhibited relatively low SGO2 expression compared to cancer tissues. Fig. 1B illustrates the expression of SGO2 in various tumor cell lines, as derived from the CCLE expression profiles. SGO2 correlated with cancer stage in several malignancies, including LUAD (Fig. 1C). The results indicated that SGO2 was overexpressed in LUAD and might be involved in the development of LUAD.
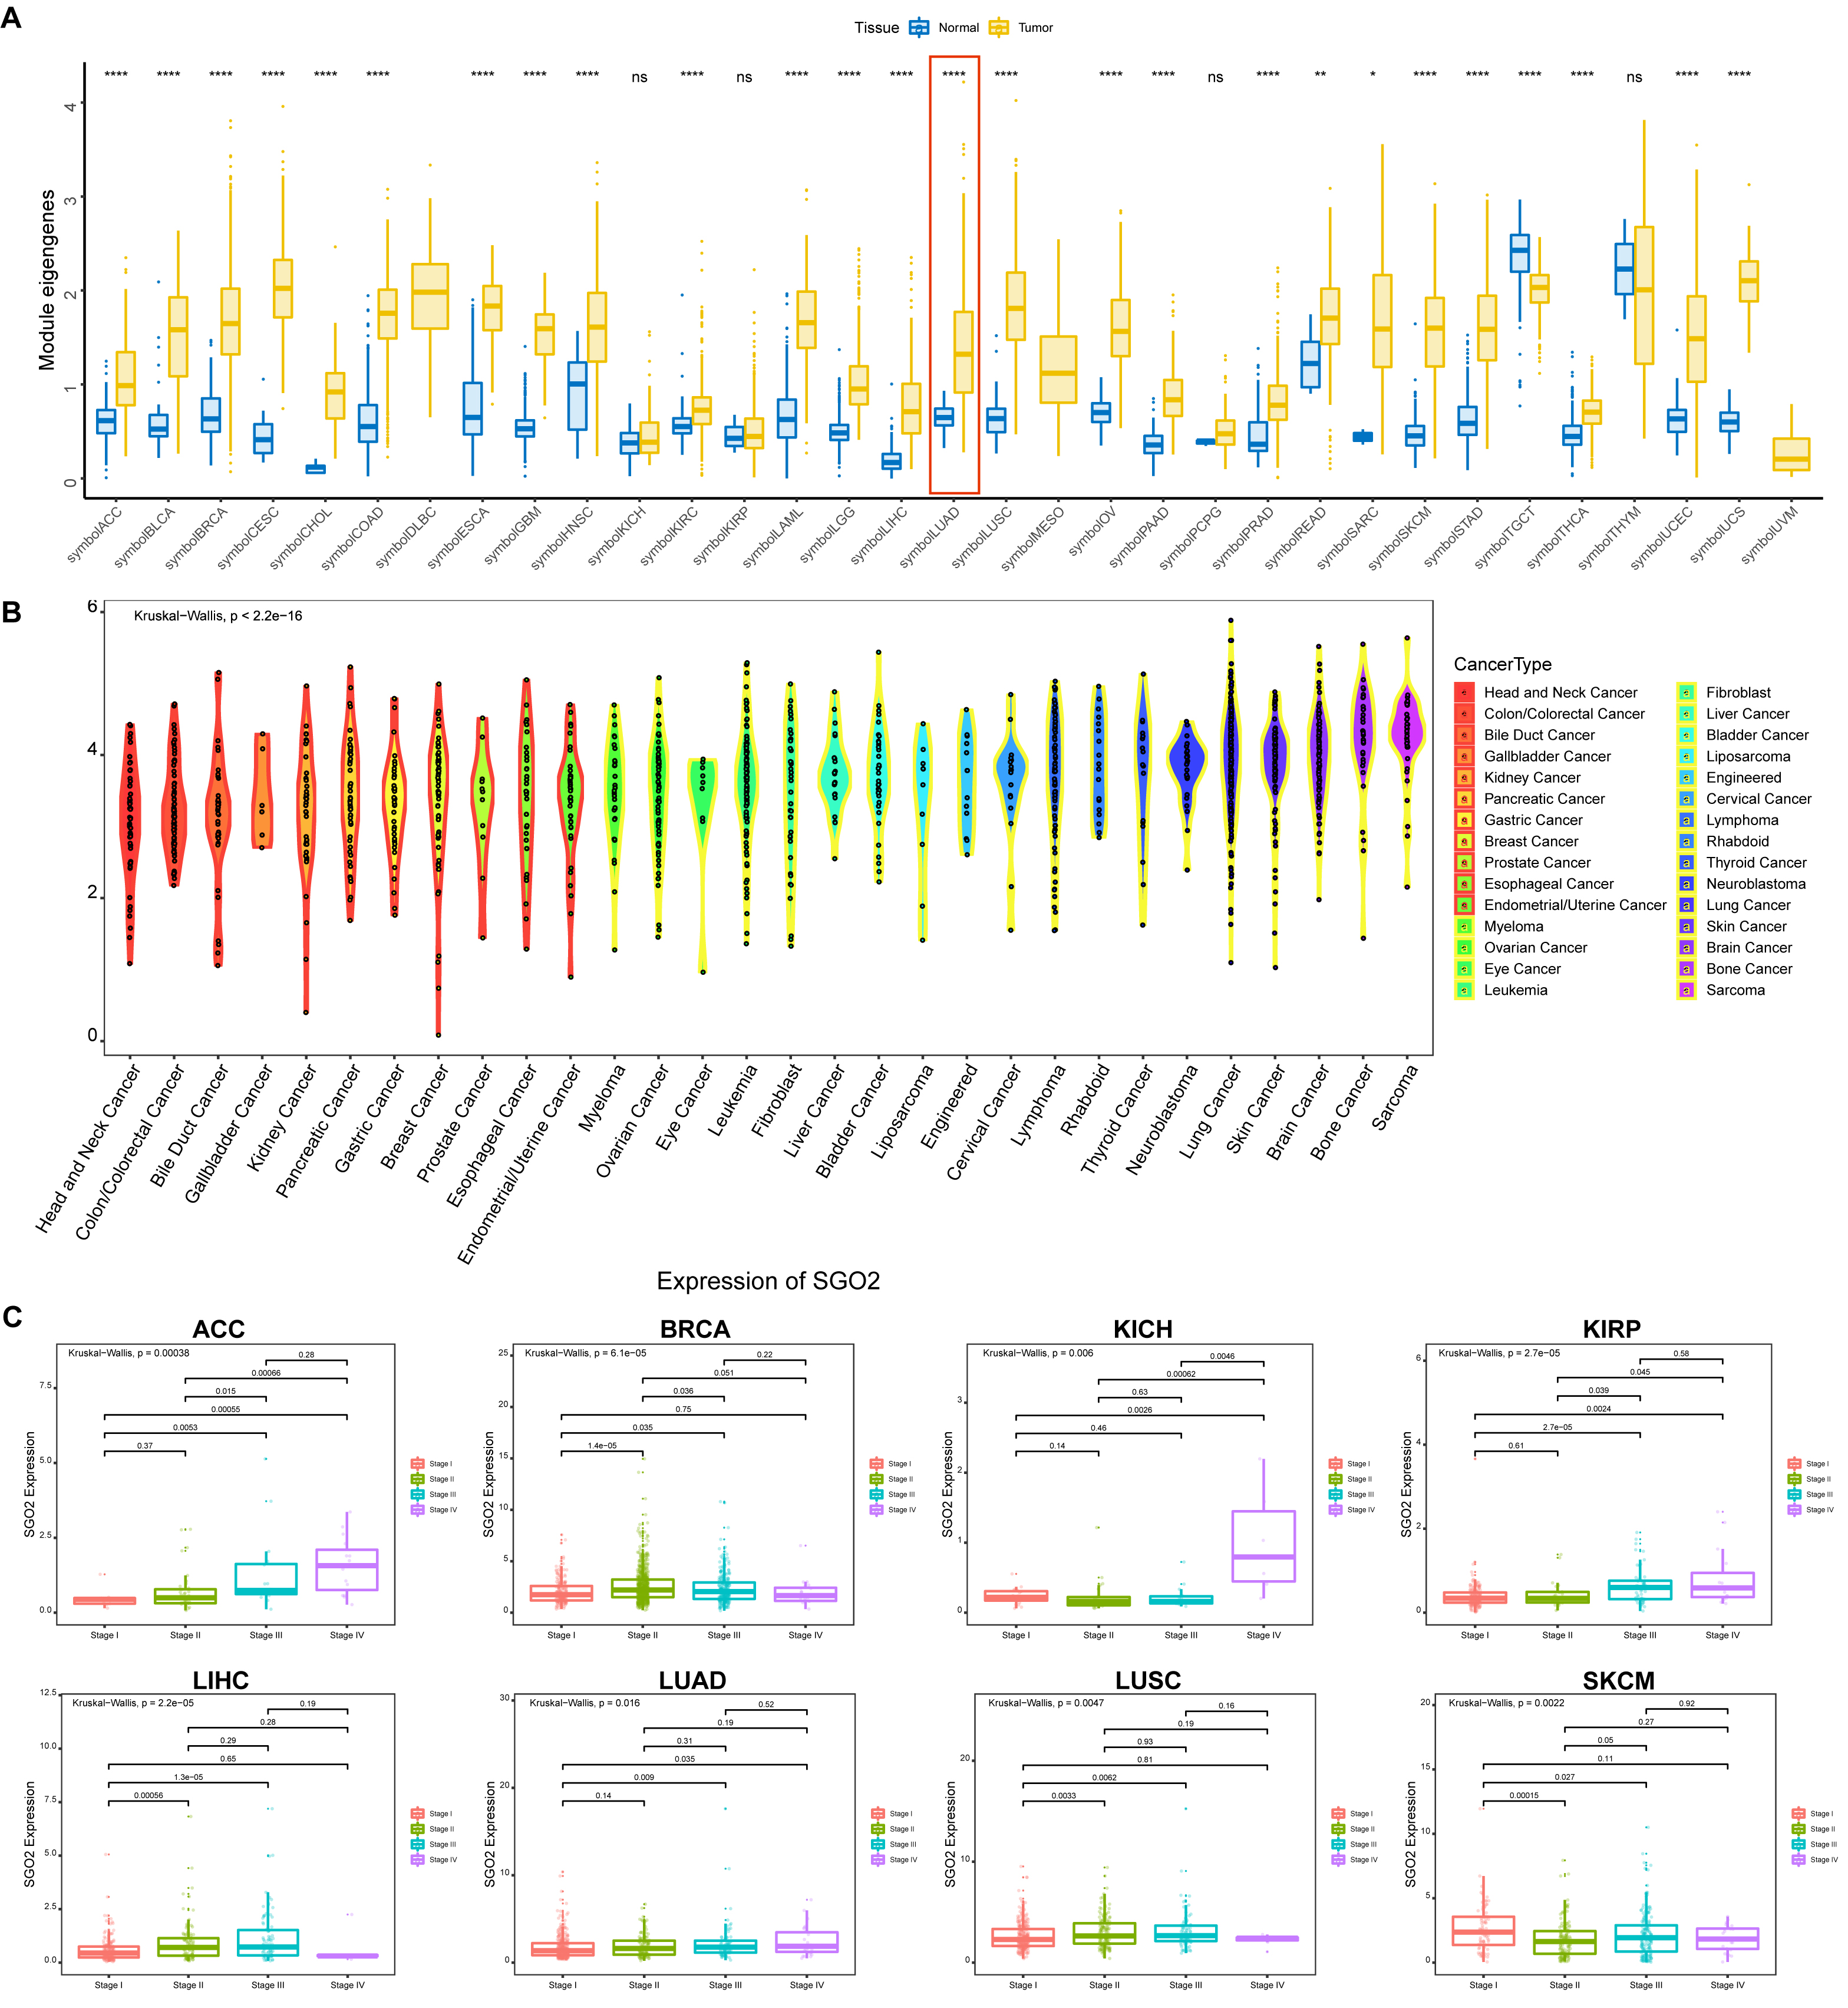 Fig. 1.
Differential gene expression analysis. (A) Module eigengenes
analysis. (B) The expression of Shugoshin 2 (SGO2) in various tumor cell lines.
(C) Correlation between SGO2 and cancer stage. *p
We investigated the connection between SGO2 expression and prognosis of patients with LUAD from TCGA and GTEx datasets. Fig. 2A depicted a significant correlation between SGO2 expression and OS in LUAD. KM survival analysis suggested that elevated SGO2 expression was associated with unfavorable OS in LUAD (p = 0.0046, Fig. 2C). Similarly, SGO2 expression was significantly associated with PFS in patients with LUAD (Fig. 2B). Furthermore, the KM-plot survival analysis indicated that high expression of SGO2 was linked to unfavorable PFS in LUAD (p = 0.0081, Fig. 2D). Based on the expression of SGO2 and clinical symptoms, a nomogram prediction model was constructed. The logistic regression analysis demonstrated the effect of SGO2 expression level on the predictive efficacy of the model in LUAD samples (Fig. 2E). In addition, calibration curves were shown to predict validity of the three-year and five-year survival periods, as shown in Fig. 2F.
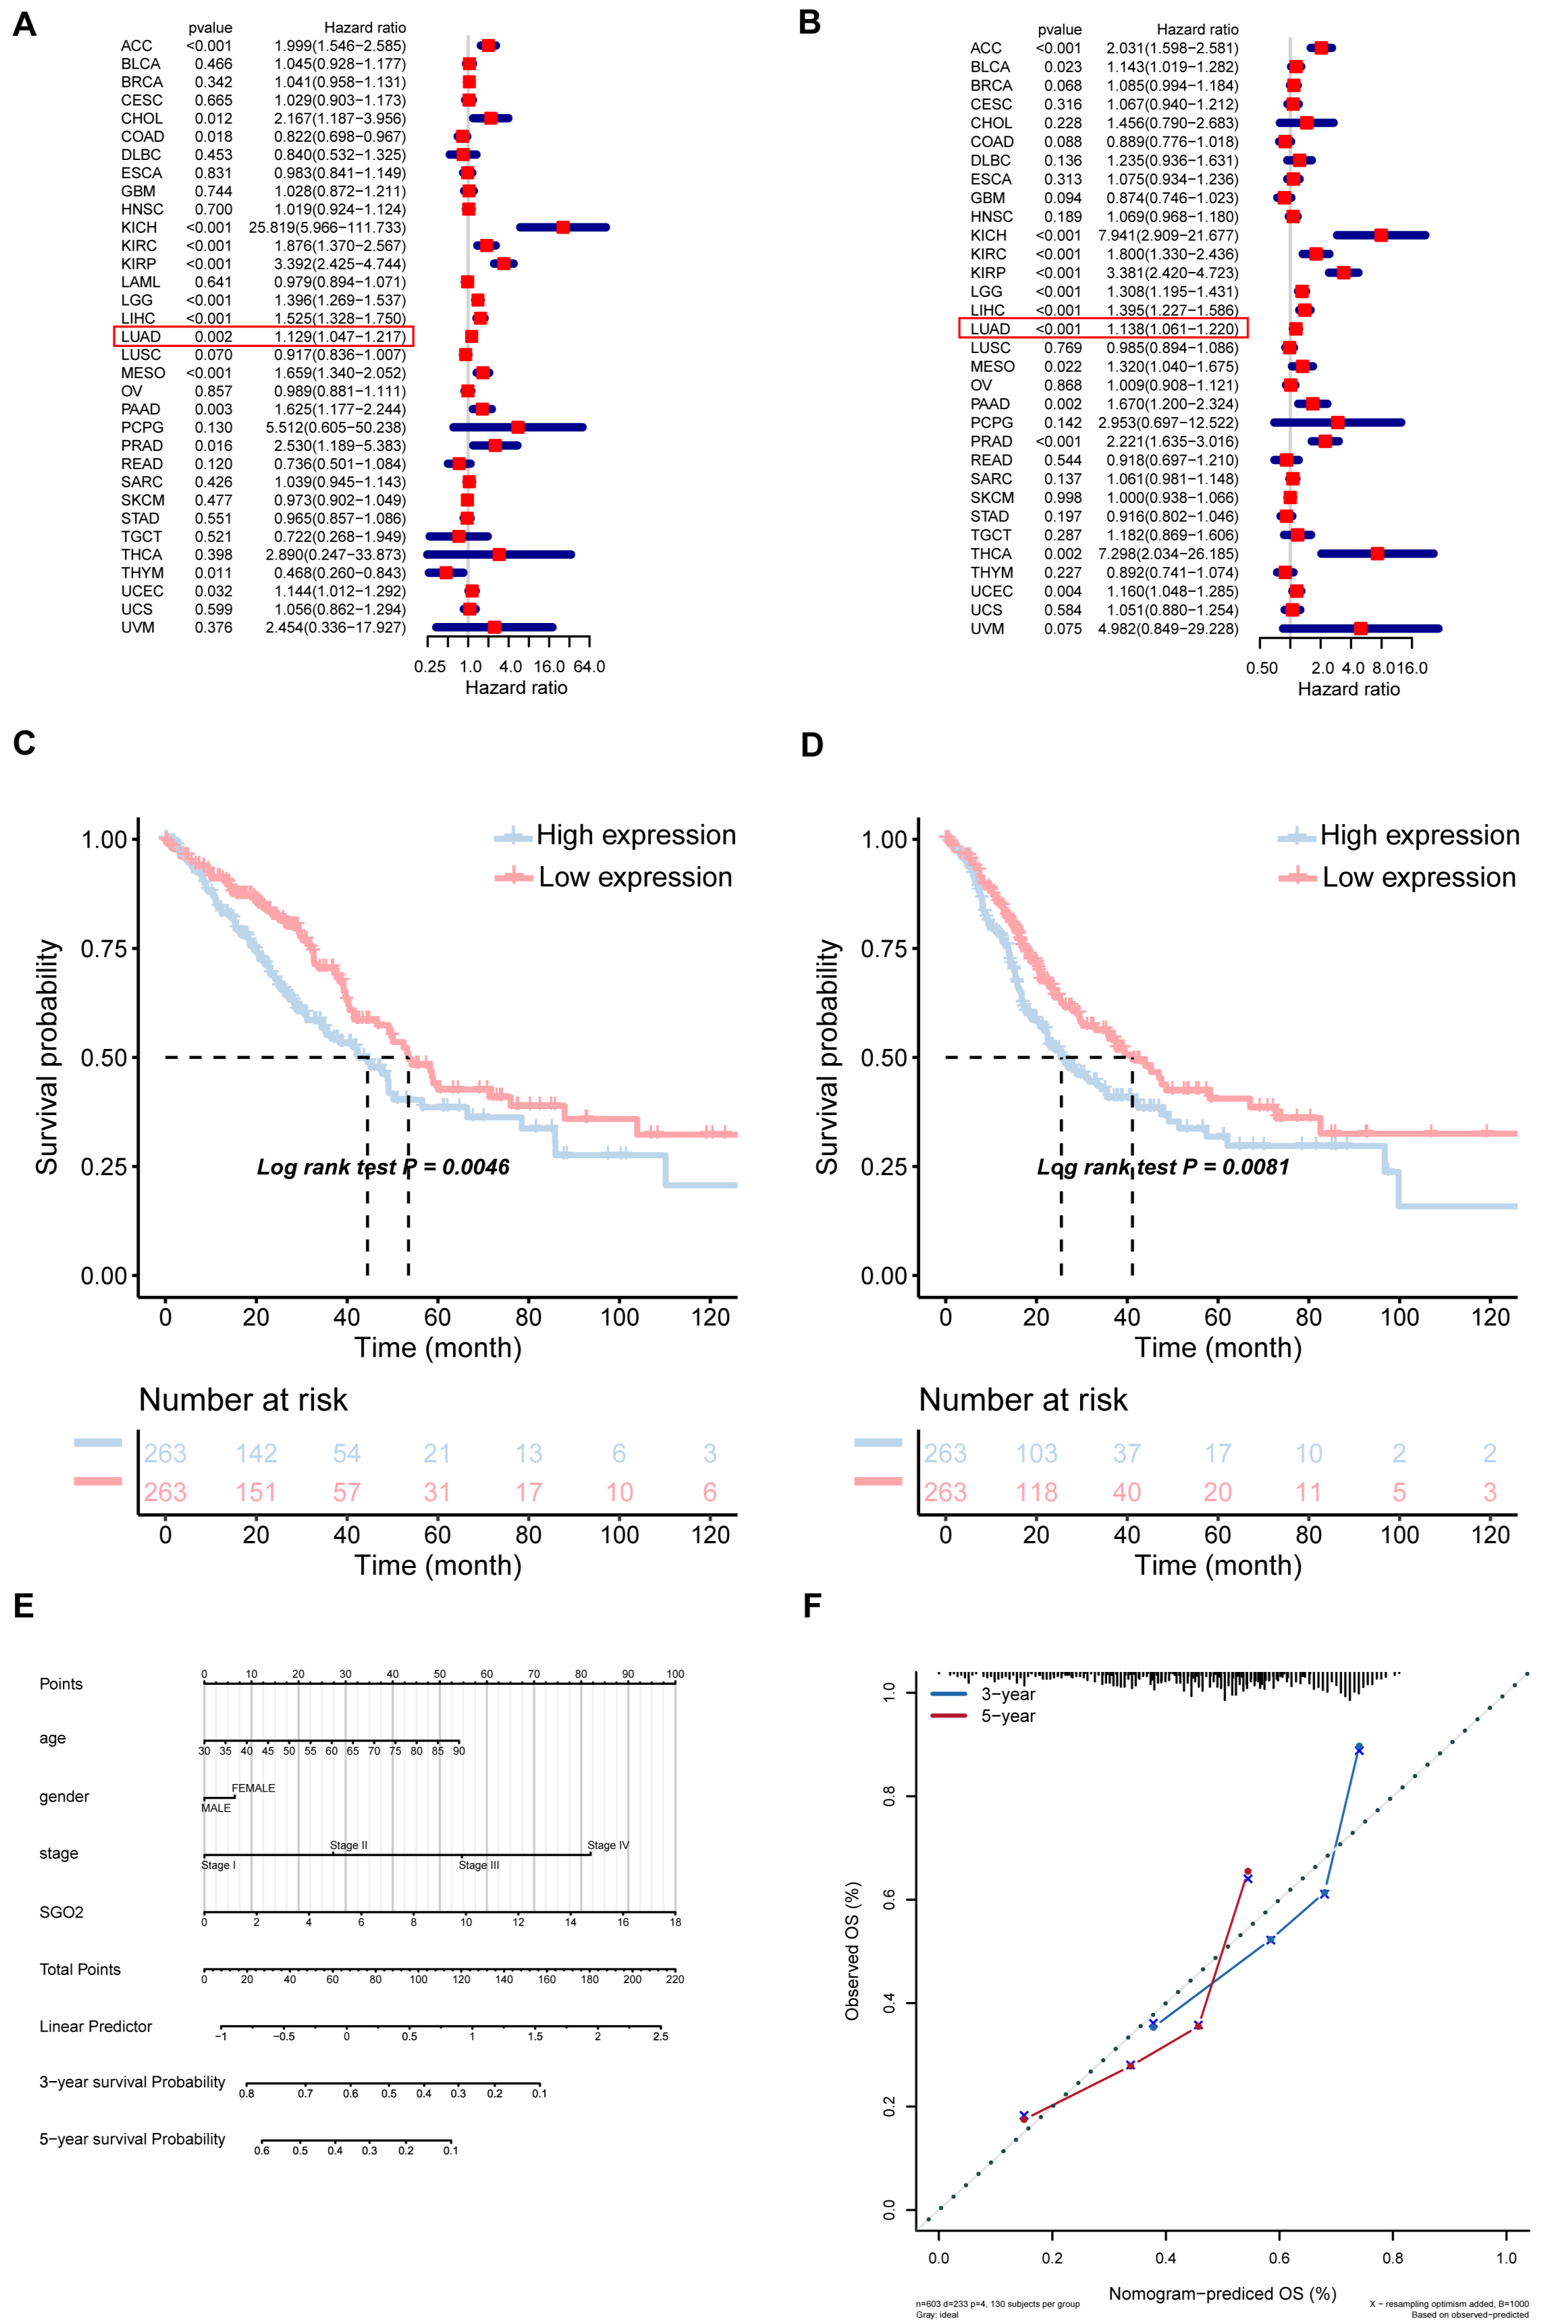 Fig. 2.
Prognostic analysis of SGO2 gene in lung adenocarcinoma
(LUAD). (A,B) Cox analysis and Kaplan-Meier analysis were performed the
connection between SGO2 expression and overall survival (OS). (C,D) Cox analysis
and Kaplan-Meier (KM) analysis were performed the connection between SGO2
expression and progress free survival (PFS). (E) Nomogram prediction model and
logistic regression analysis. (F) Calibration curves were shown. p
To explore the impact of SGO2 on proliferation of LUAD A549 cells, cell
transfection was performed using small interfering RNA si-SGO2 or plasmids
overexpressing SGO2. Transfection efficiency was detected by qPCR and western
blot (p
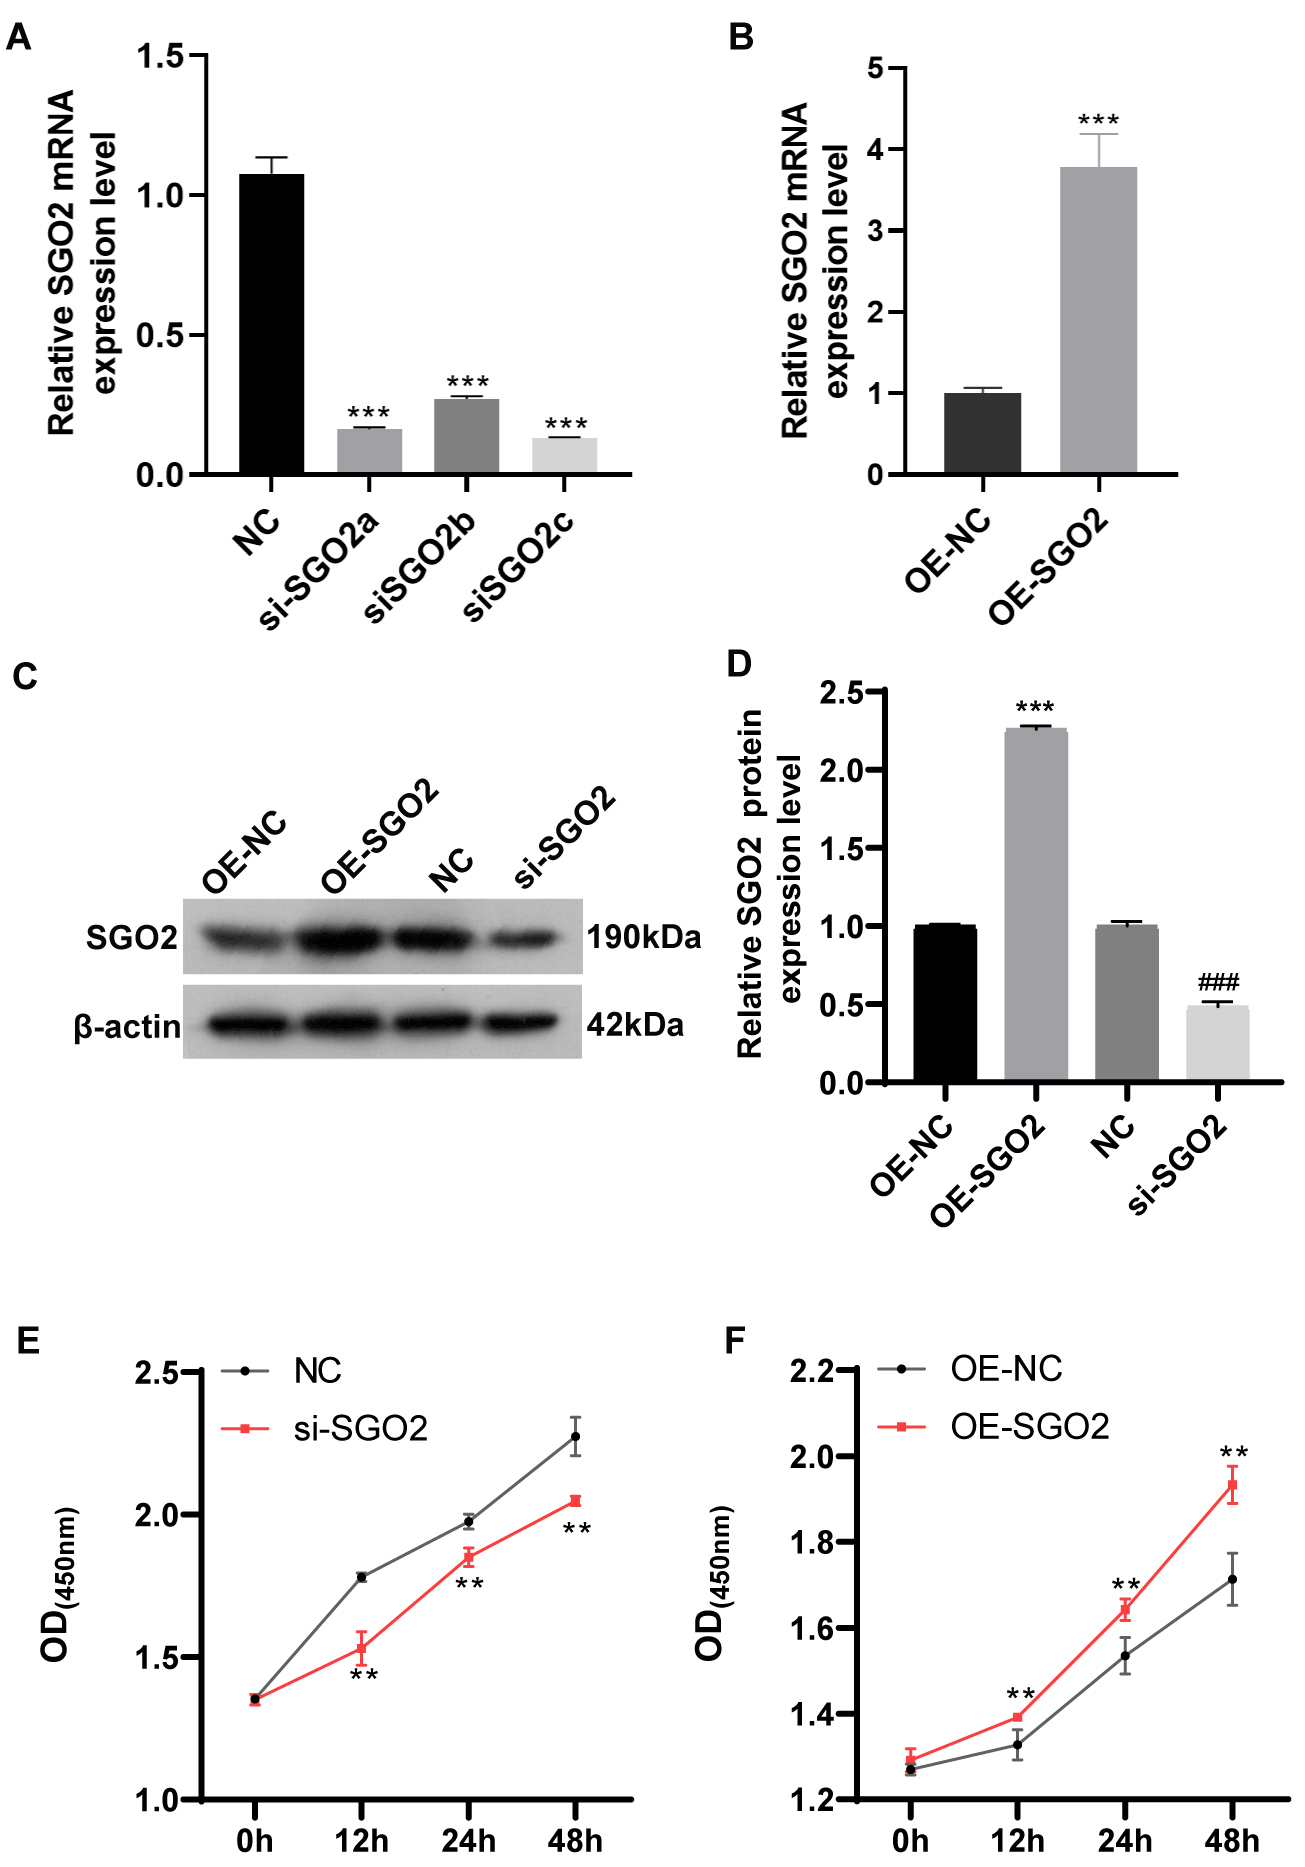 Fig. 3.
SGO2 enhances the cell viability of A549 cells. (A,B)
qPCR detection of SGO2 mRNA expression following overexpression and
knockdown of SGO2. ***p
Next, we assessed the effects of SGO2 on the proliferation and
apoptosis of A549 cells by flow cytometry. Significant inhibitory effect on cell
proliferation was observed in A549 cells with decreased SGO2 compared
with the control group, while shown opposite result in SGO2
overexpression cells (p
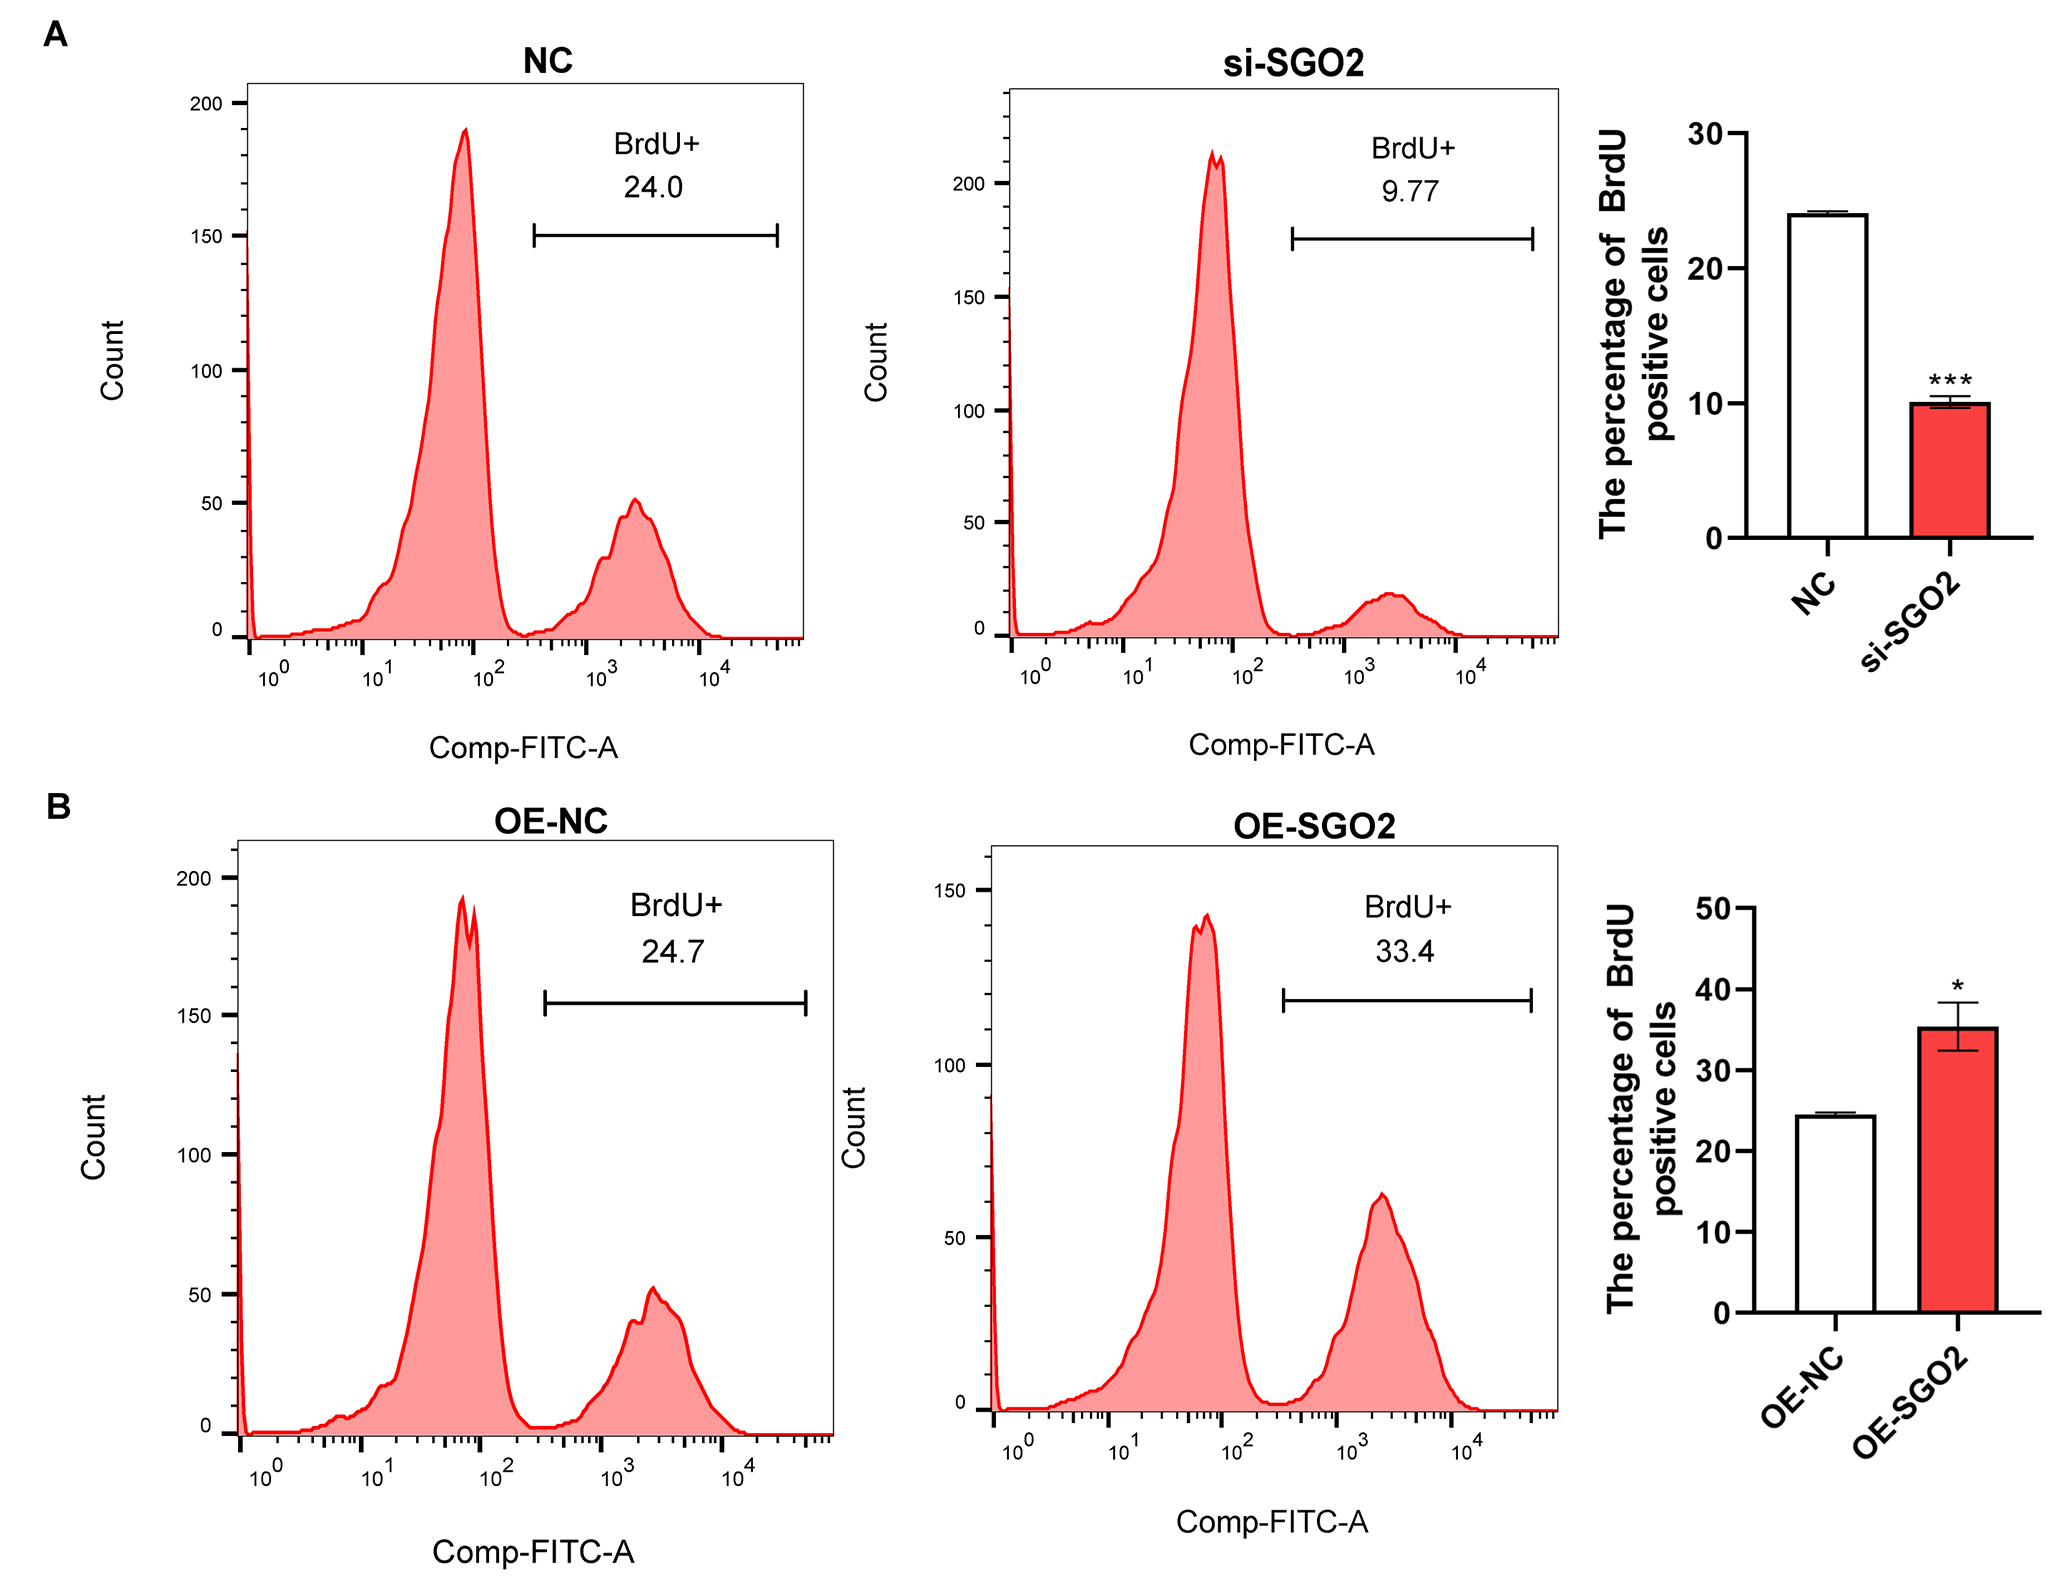 Fig. 4.
SGO2 promotes A549 proliferation. Flow cytometry
depicting the proliferation of A549 cells after (A) silencing and (B)
overexpression of SGO2. *p
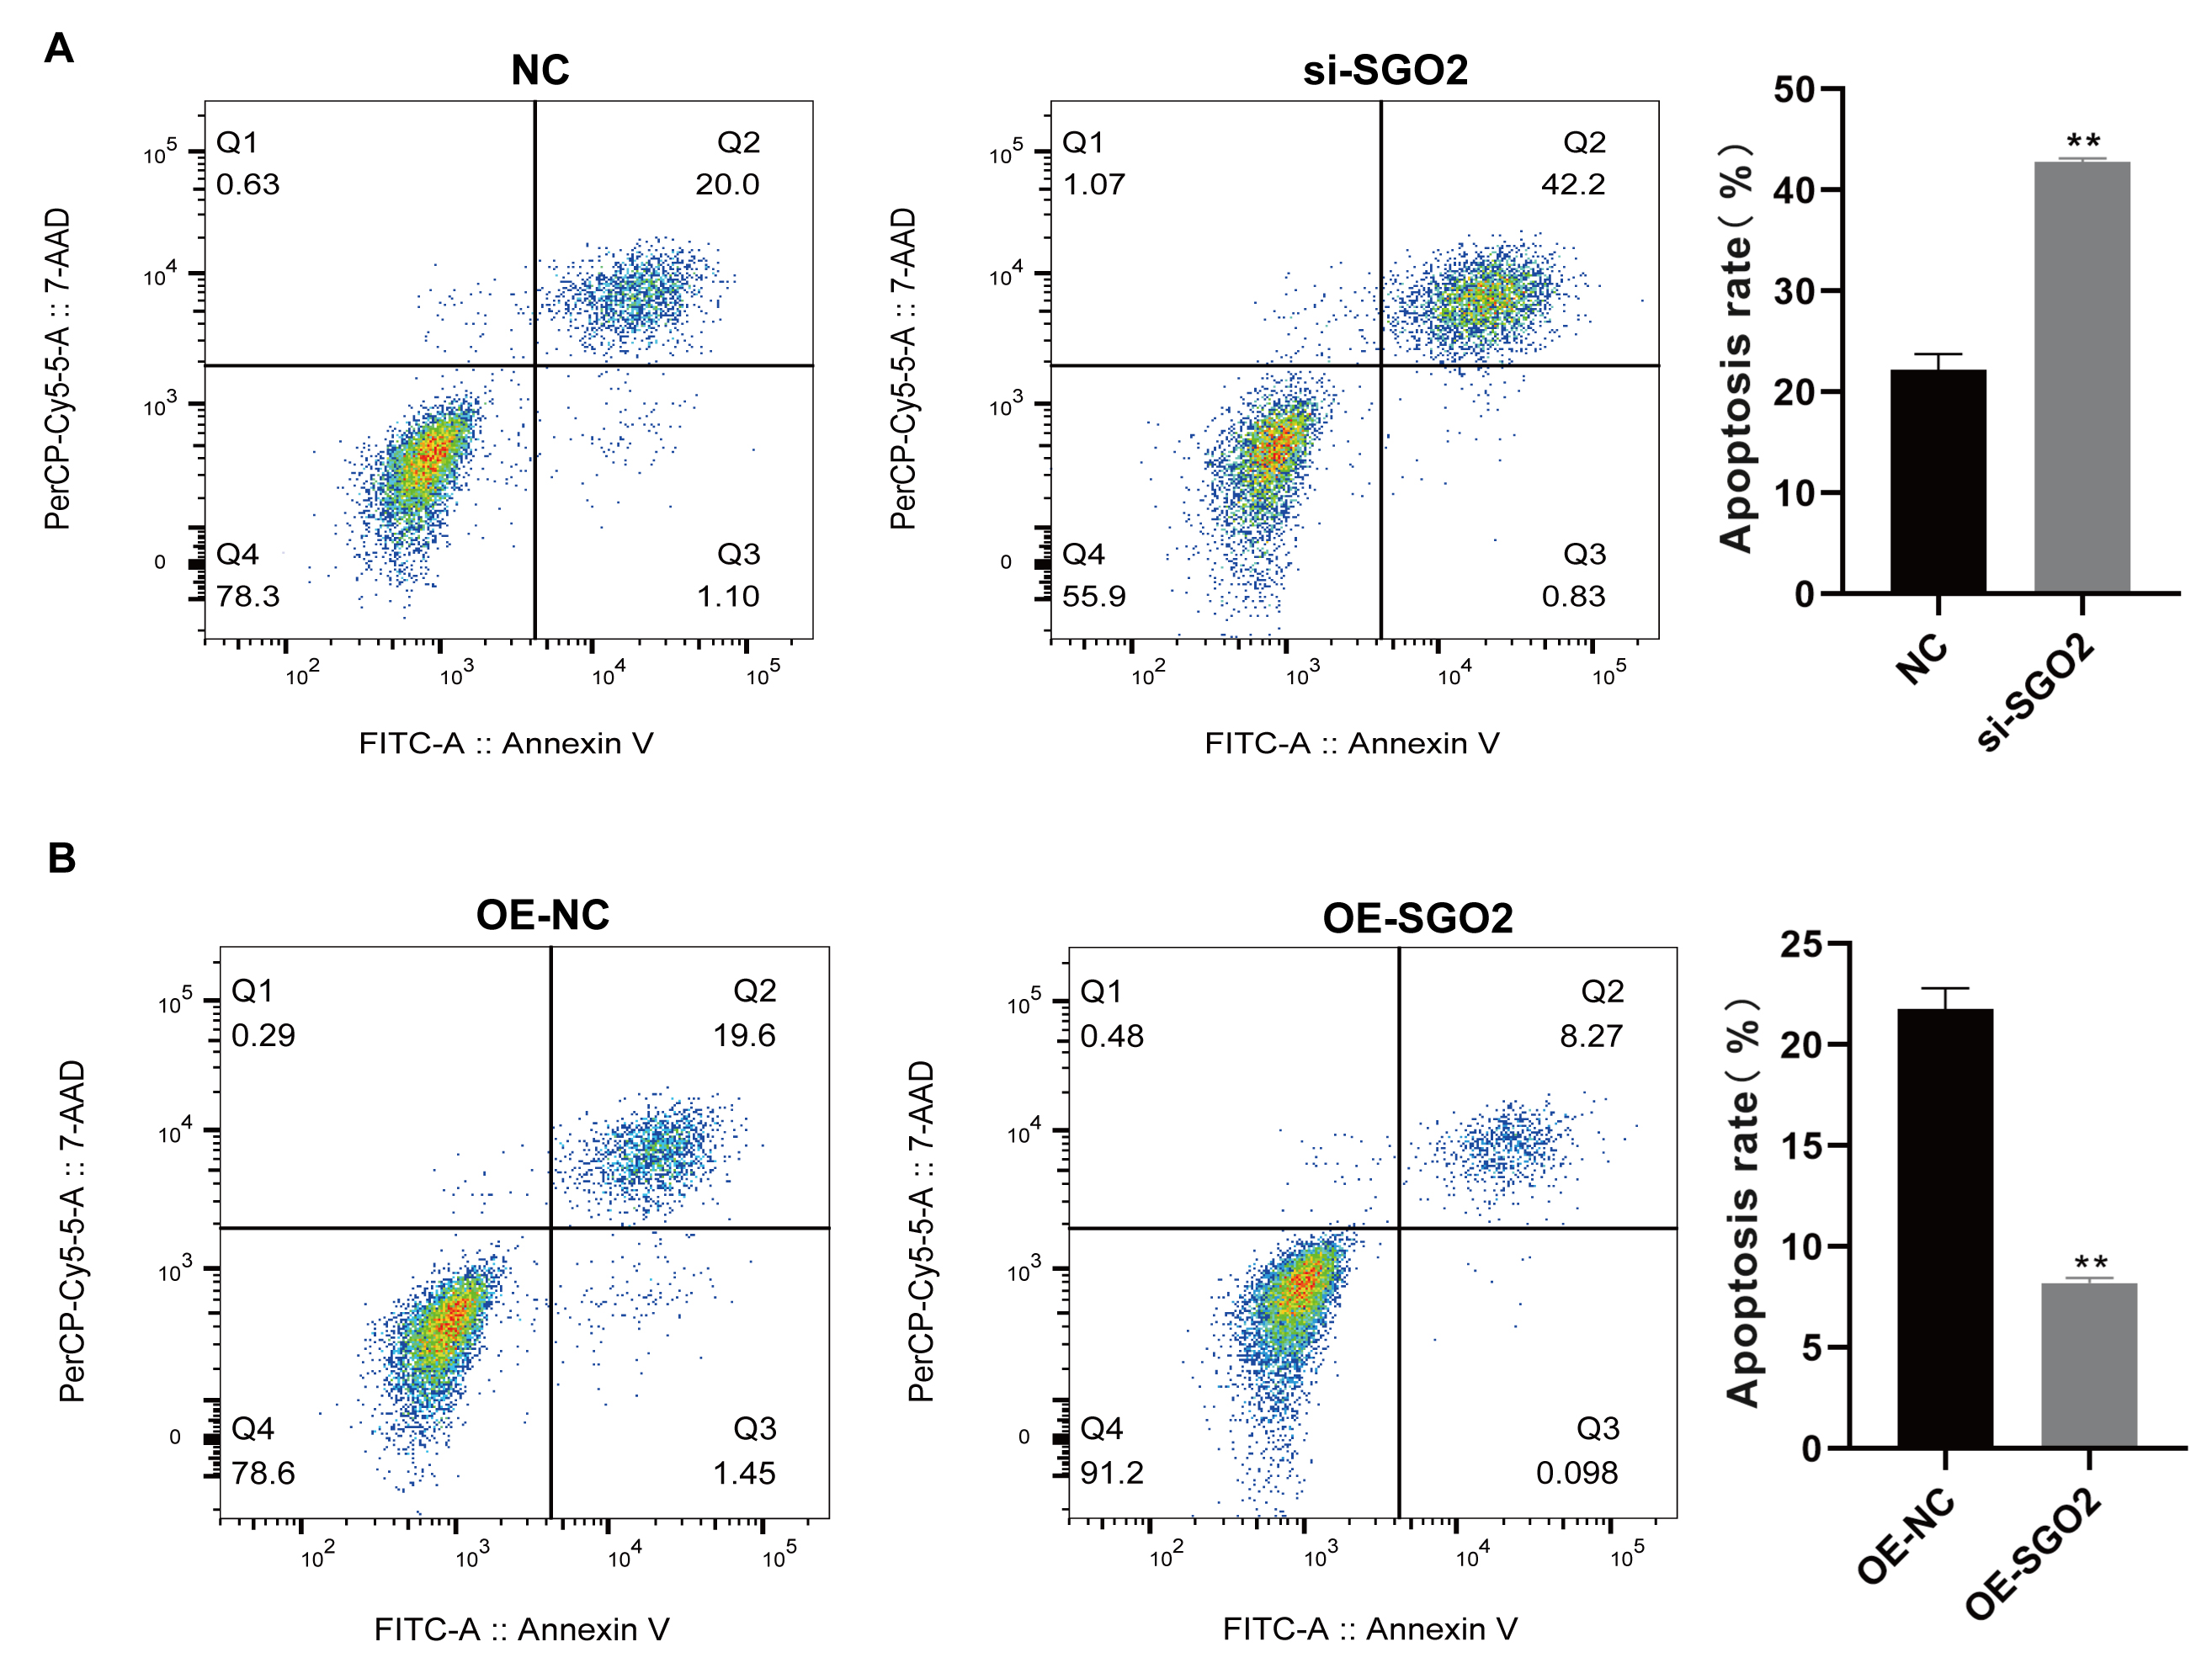 Fig. 5.
SGO2 inhibits A549 apoptosis. Flow cytometry assessing
apoptosis of A549 cells after (A) silencing and (B) overexpression of
SGO2. **p
To investigated the effect of SGO2 on A549 cell migration and invasion,
wound healing and Transwell assays were carried out. The results showed that the
downregulation of SGO2 significantly limited cell migration and invasion
of A549 (p
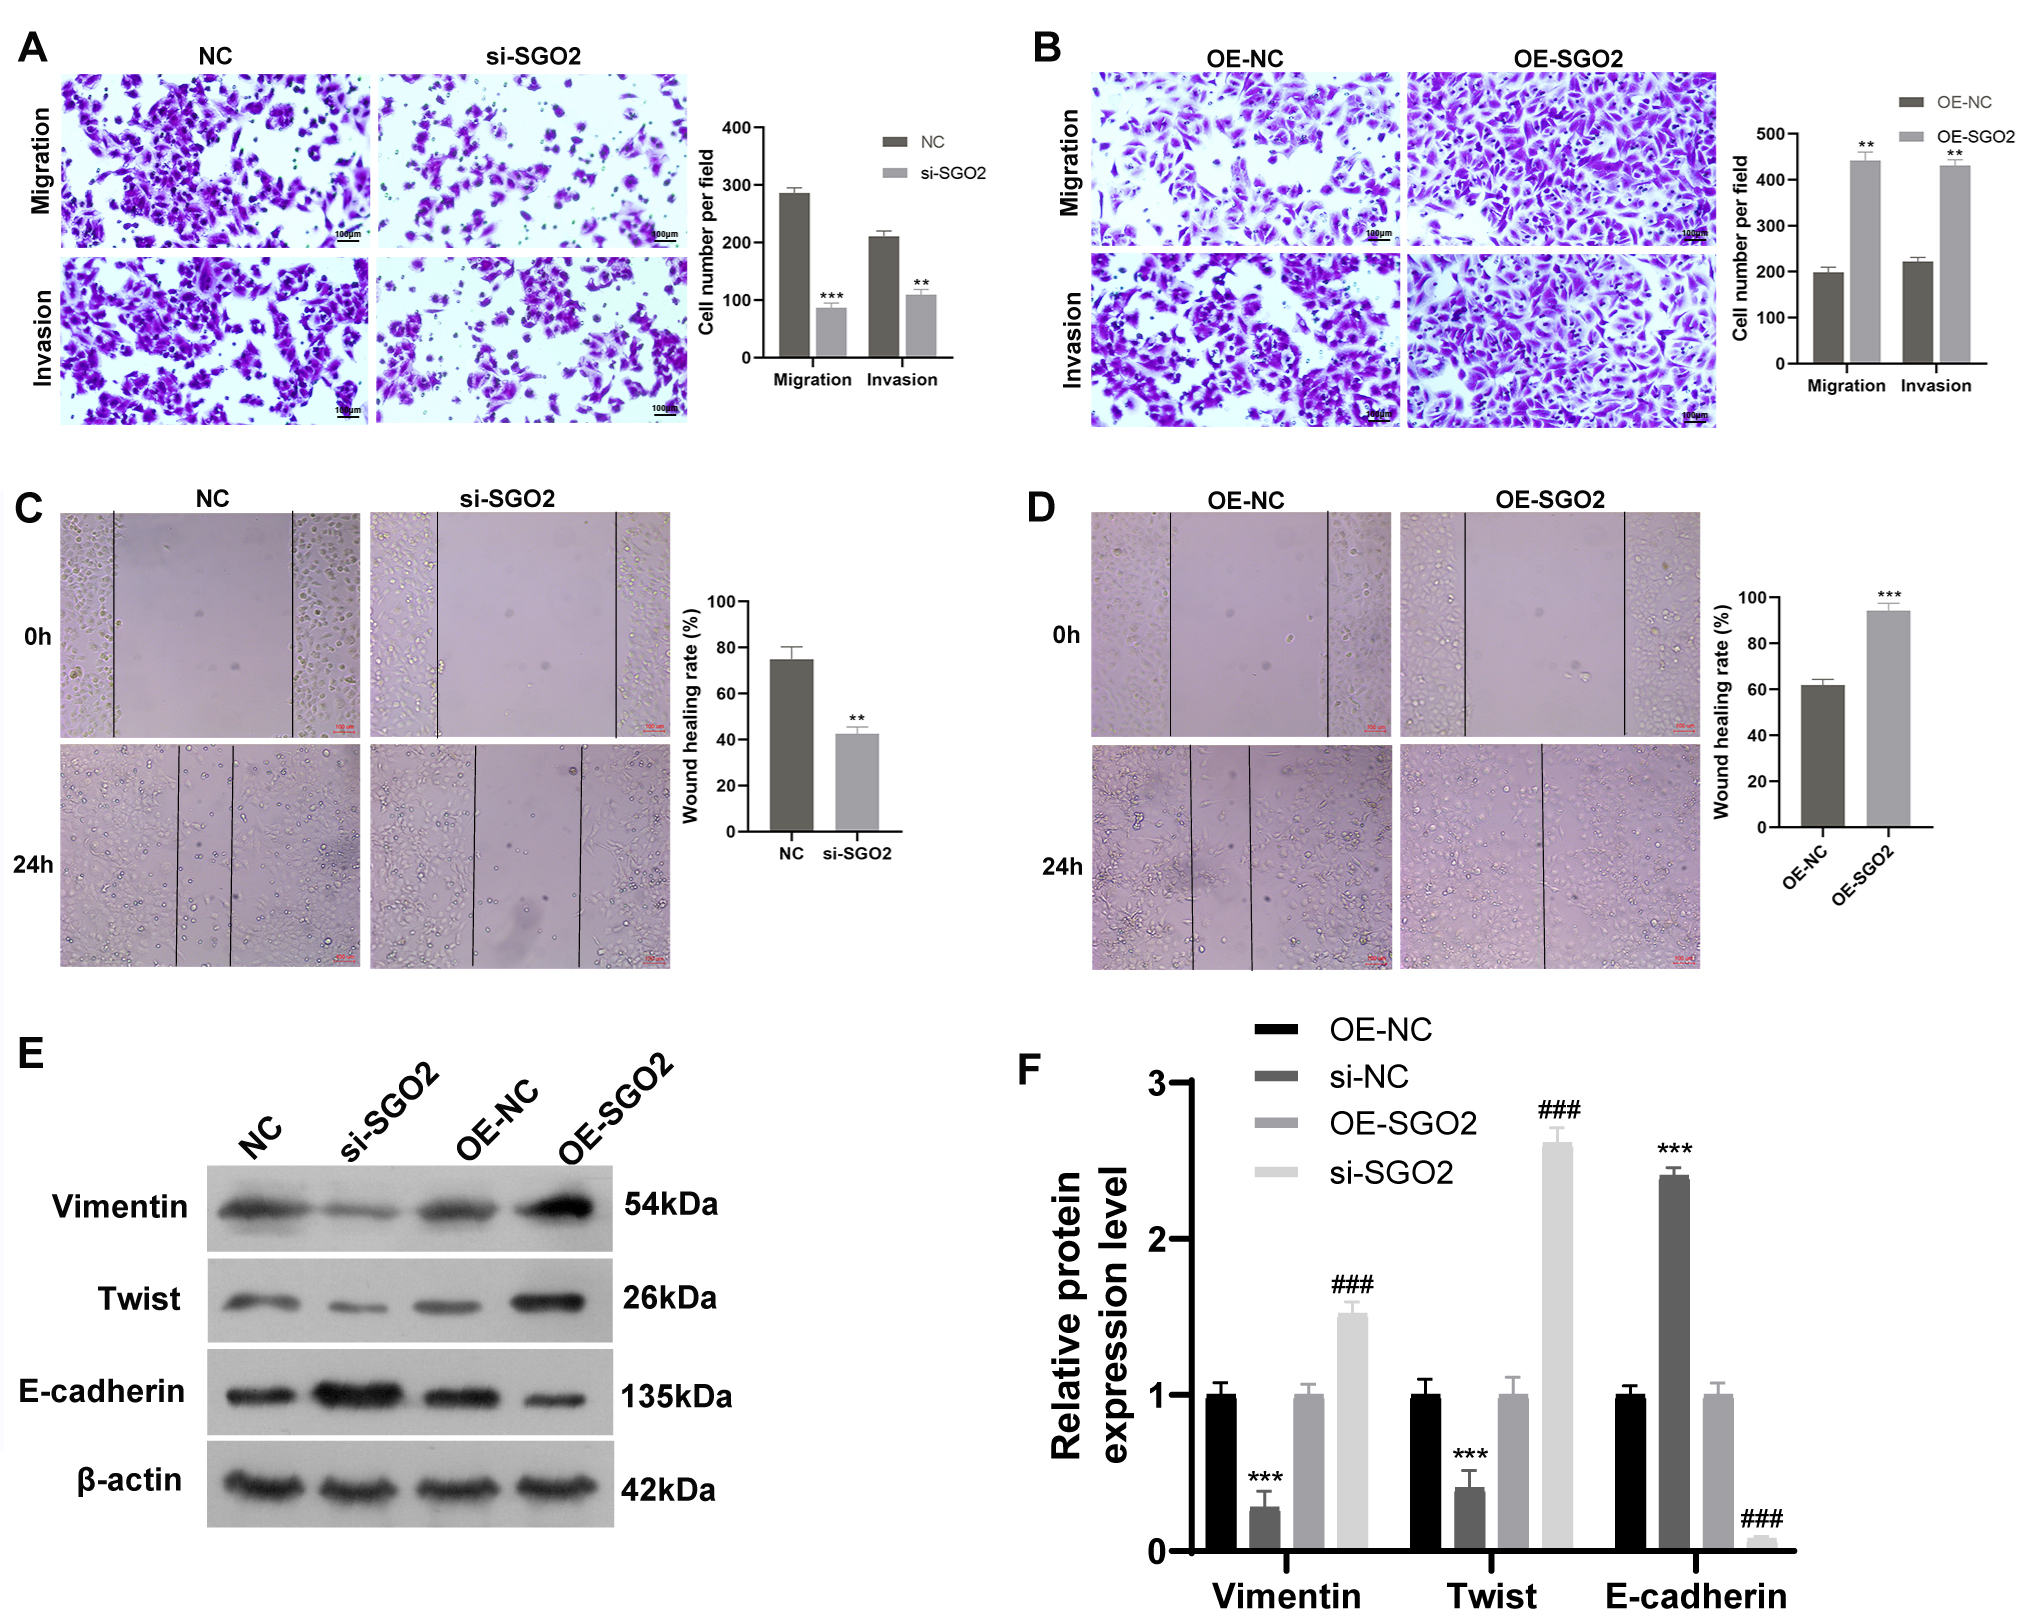 Fig. 6.
SGO2 promotes A549 migration and invasion in
vitro. (A,B) The effect of SGO2 knockdown or overexpression on cell
migration and invasion was investigated by transwell assay. Scale bars:
100 µm. **p
To explore the biological function of SGO2, KEGG enrichment analysis was carried
out. The mainly enriched KEGG pathway terms are shown in Fig. 7A. High expression
SGO2 was significantly enriched in cell cycle and DNA replication, which
suggested that SGO2 might exert its function through these pathways. To further
study the molecular mechanism of SGO2 in LUAD, GSVA was utilized to evaluate the
potential signaling pathways. The results revealed that the high expression of
SGO2 was mainly enriched in E2F targets, G2M checkpoint, mTORC1 signaling, MYC
targets, and other signaling pathways in LUAD (Fig. 7B). It is well-known that
E2F1 is an important member of transcription factor E2F family, which regulates
G1/S phase transition of cell cycle in the mammalian [14]. The results of
correlation analysis exhibited that the expression of SGO2 was positively
correlated with that of E2F1 in the patient with LUAD from TCGA dataset
(p
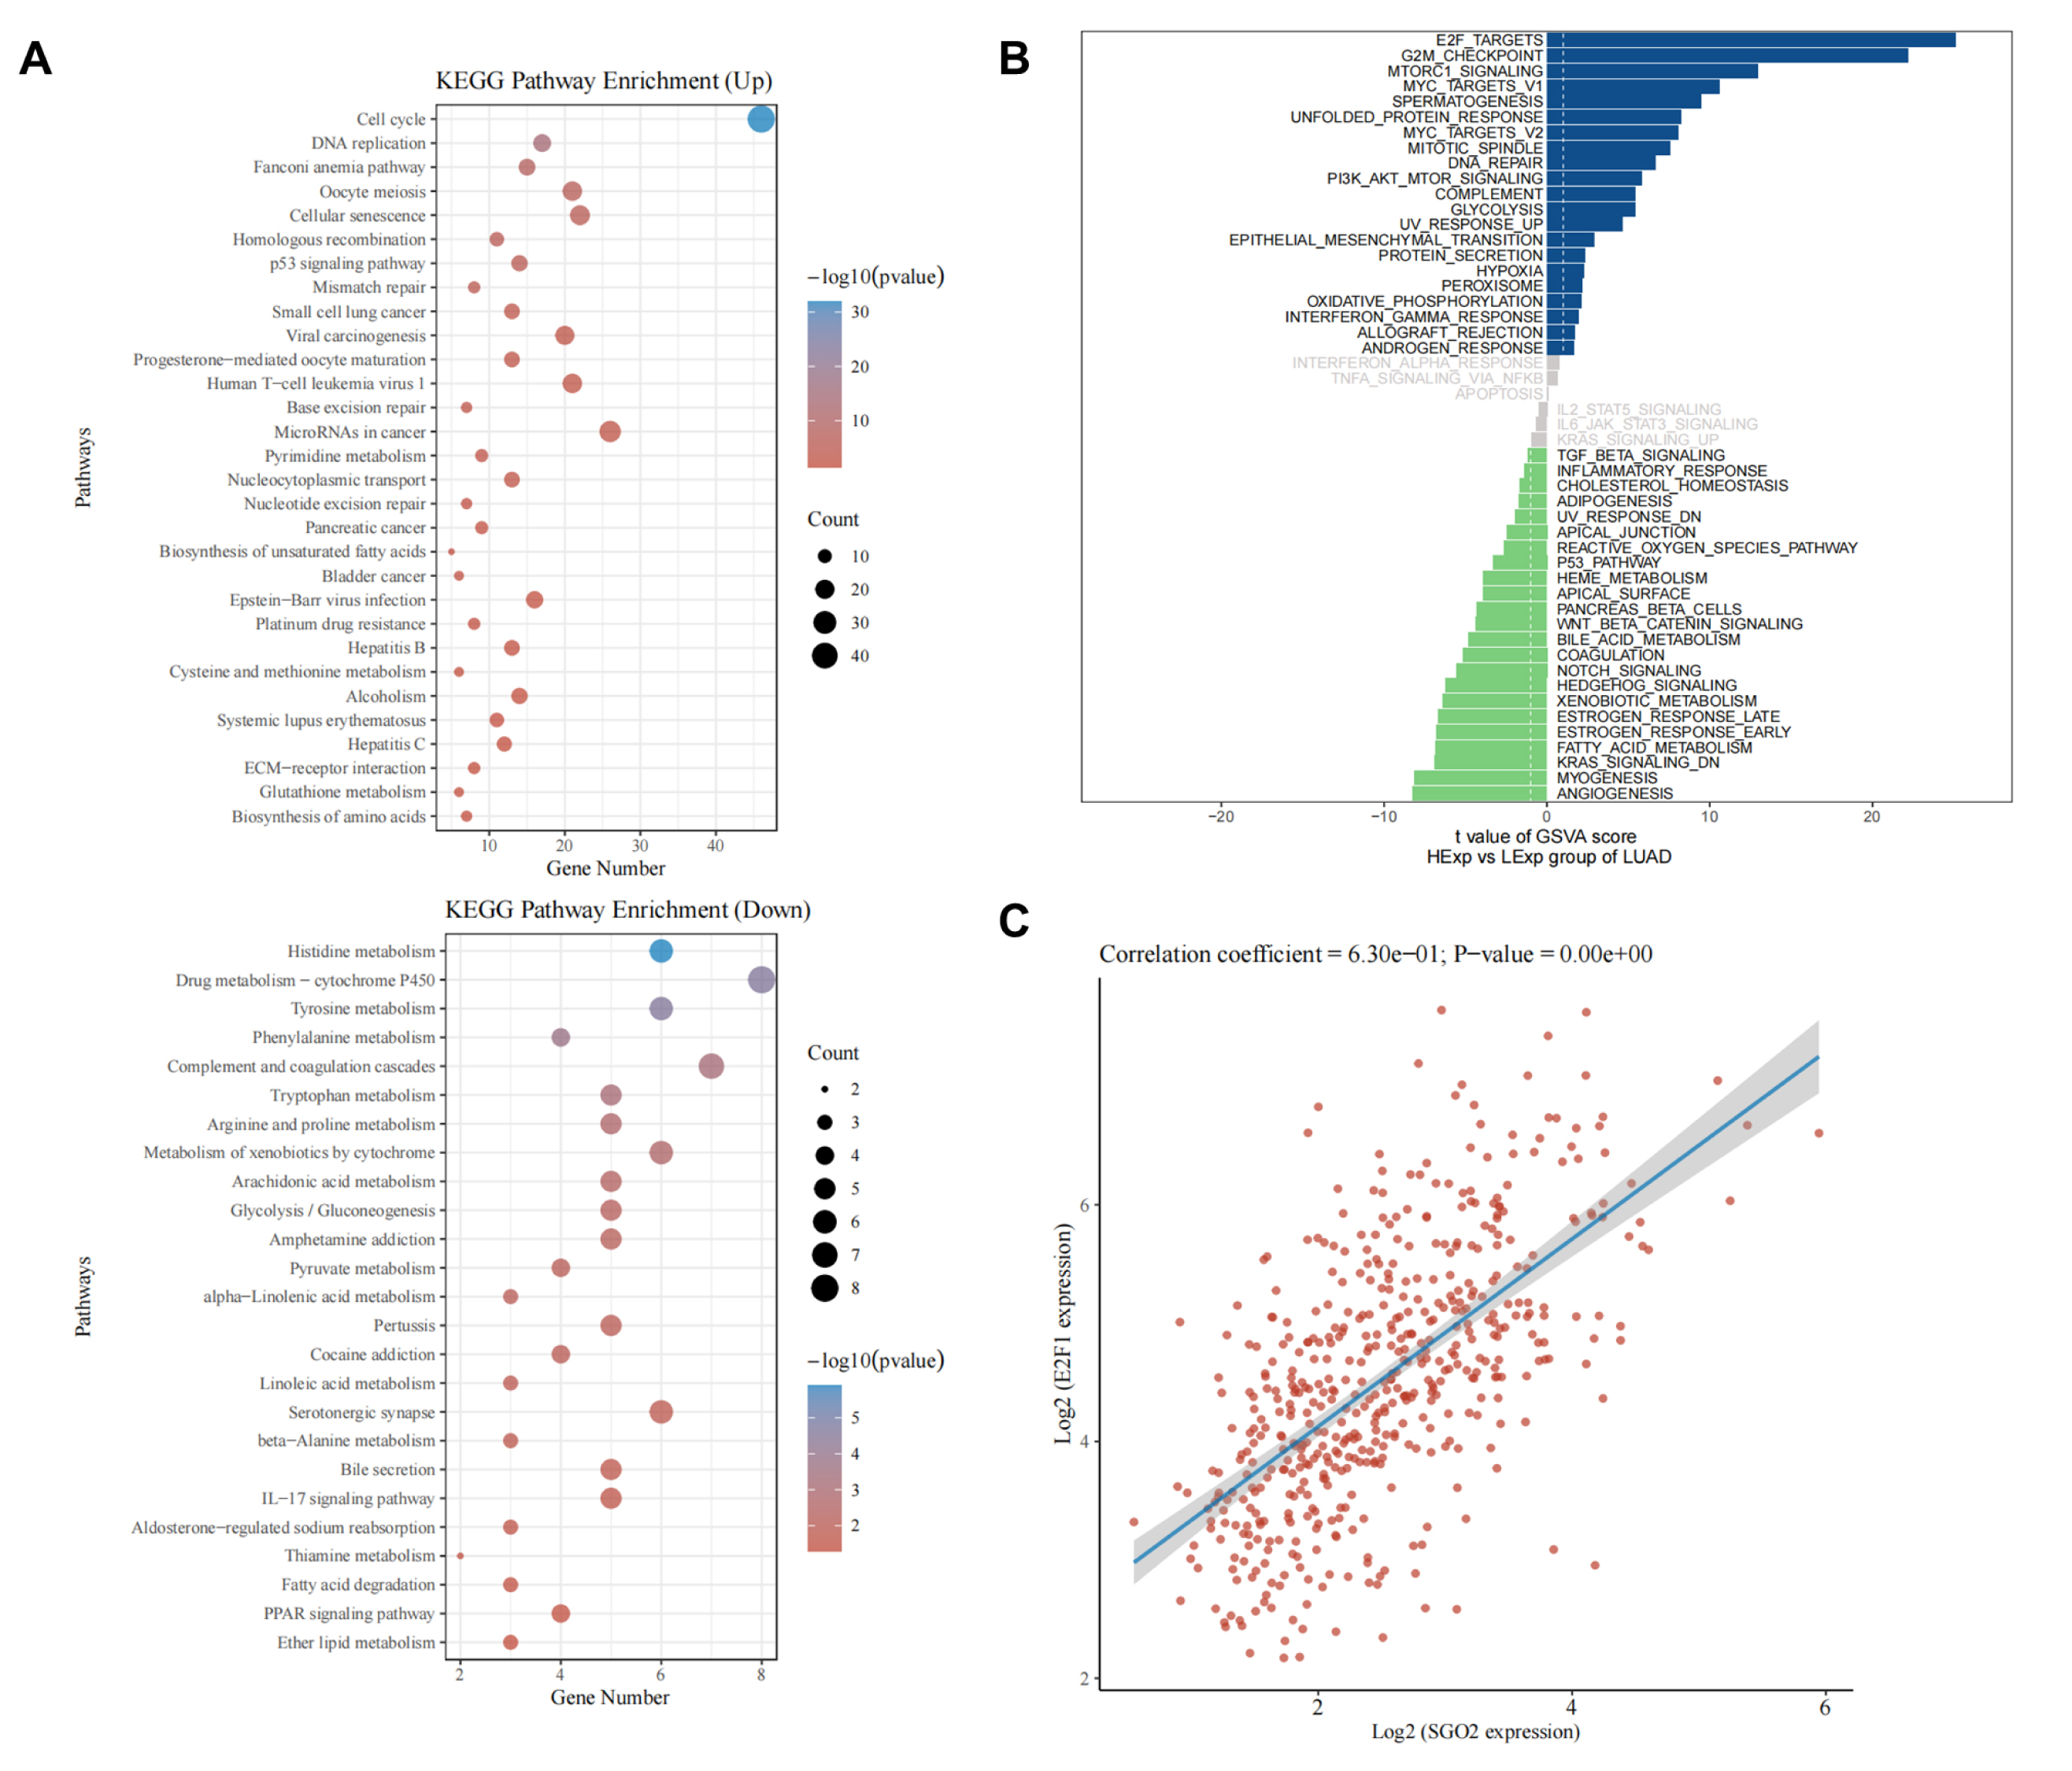 Fig. 7.
Signaling pathway prediction of SGO2. (A) Kyoto Encyclopedia of Genes and Genomes (KEGG) analysis results between high expression SGO2 and low expression SGO2. (B) Gene Set Variation Analysis (GSVA) results between high expression SGO2 and low expression SGO2. (C) Correlation analysis between SGO2 and E2F1.
The high expression level of E2F1 is closely related to tumor metastasis and the
poor prognosis of tumor patients [15]. Studies have confirmed that E2F1 regulates
cell cycle and cell apoptosis in various diseases [16, 17]. To clarify whether
SGO2 regulates the expression of E2F1, western blot was performed.
Consistent with the results of correlation analysis, western blot showed that
SGO2 promoted the expression of E2F1 (p
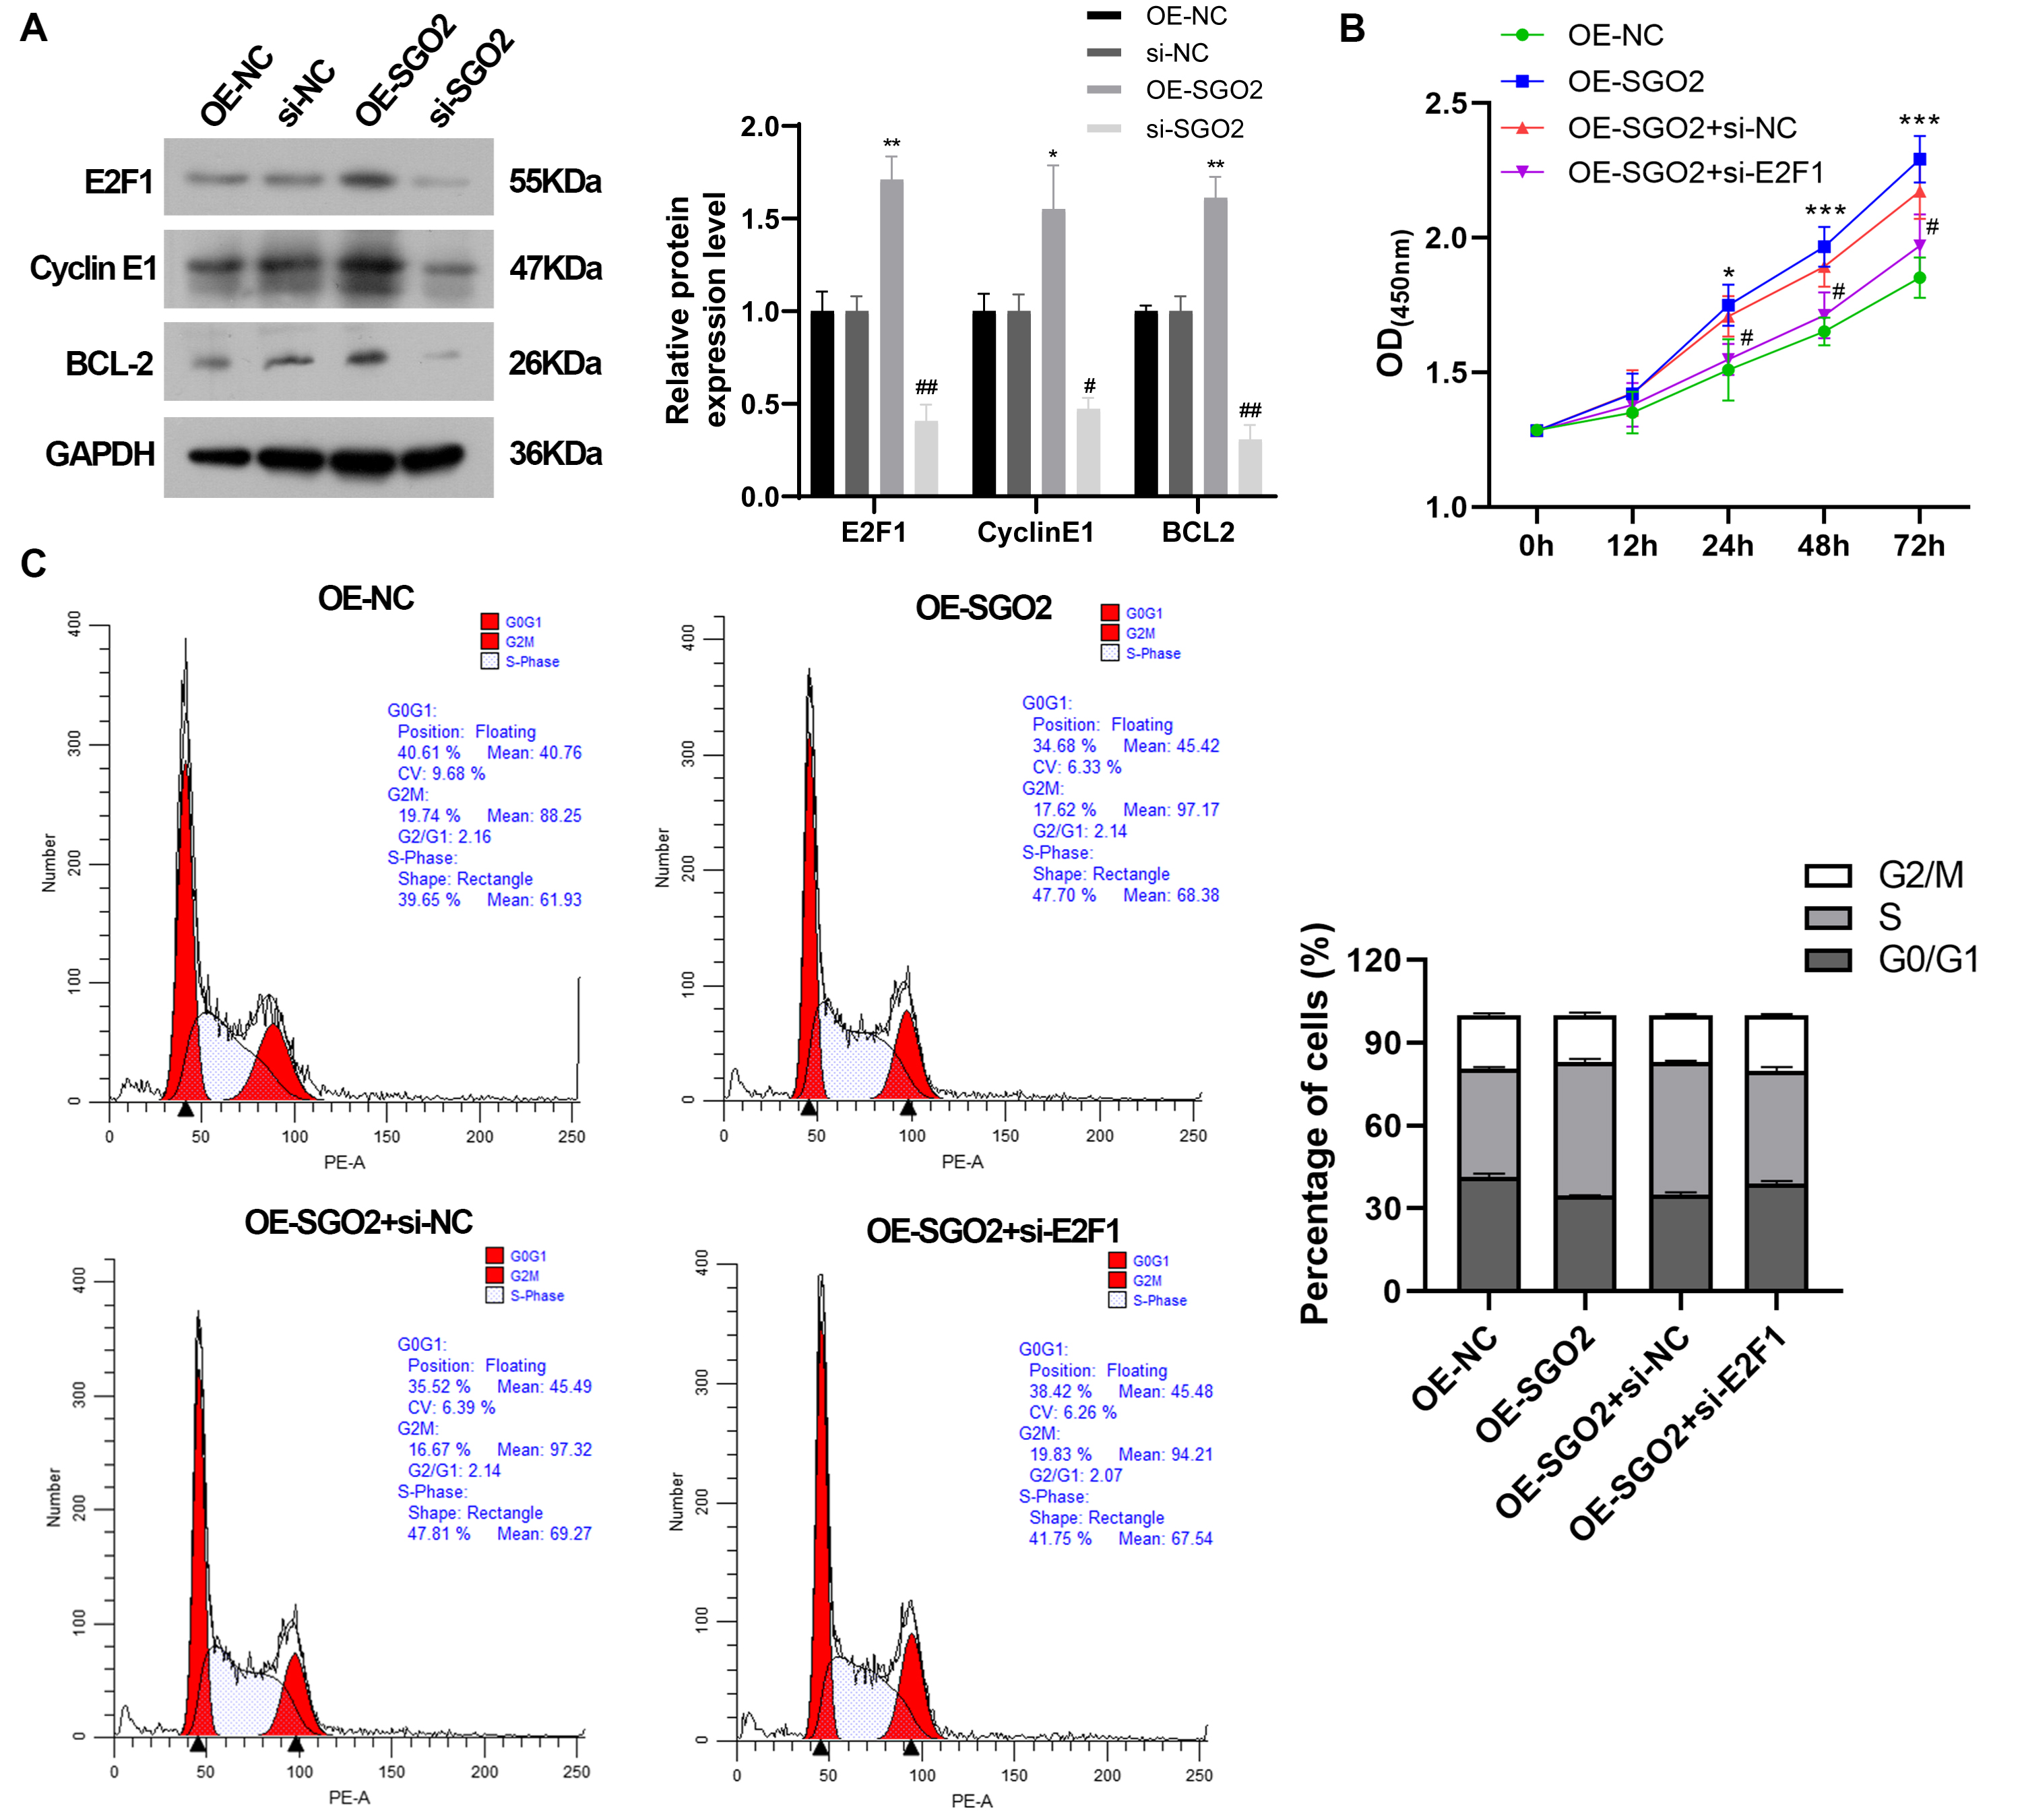 Fig. 8.
SGO2 promotes cell proliferation and regulates cell
cycle via E2F1. (A) The protein expression of E2F1, CyclinE1 and BCL2
by western blot. *p
SGO2 is a member of SGO protein family that exerts essential roles in cell division including meiosis in eukaryotes [7, 18, 19]. Recent evidence has highlighted that SGO2 is involved in the regulation of the development of glioma [11] and hepatocellular carcinoma [13]. Research has revealed that SGO2 acts as a potential biomarker in patients with gliomas and SGO2 promotes the malignant phenotypes of glioma cells [11]. Nonetheless, the specific role and underlying molecular mechanism of SGO2 in the LUAD remains unclear. In our study, TCGA and GTEx databases were ulitized to analyze pan-cancer expression of SGO2 and the findings revealed that SGO2 was highly expressed in 25 out of 33 cancers, including LUAD. Additionally, KM analysis indicated that LUAD patients with high expression level of SGO2 showed poorer OS and PFS than those with low SGO2expression. These results suggested the potential significance of SGO2 in occurrence and progression of LUAD.
To understand the biological influence of SGO2 on the LUAD in vitro, knockdown and overexpression of SGO2 in A549 cells were applied to conduct corresponding assays. The results showed that SGO2 silencing inhibited cell proliferation, migration and invasion, as well as promoting cell apoptosis. Conversely, SGO2 up-regulation enhanced cell proliferation, migration and invasion, as well as suppressing cell apoptosis. These findings indicated that SGO2 played an oncogenic role in LUAD, which further verified the results of above bioinformation analysis. EMT enables cancer cells to gain enhanced motility and invasive capacity, thereby fostering metastasis [20]. Our study revealed that SGO2 knockdown significantly enhanced E-cadherin and inhibited the expression level of Vimentin and Twist, while overexpression of SGO2 showed an opposite effect. The results demonstrated that SGO2 was involved in EMT process.
Given that the potential molecular mechanism of SGO2 in LUAD has been unexplored, KEGG and GSVA were carried out. The results exhibited that high expression of SGO2 were significantly enriched in the cell cycle and DNA replication. GSVA results indicated that E2F targets were mainly involved in the signaling pathway mediated by SGO2. E2F1, as an important nuclear transcription factor, plays a key role in biological processes such as cell cycle regulation, cell proliferation and apoptosis [21]. Evidence has suggested that E2F1 enhances clear cell renal cell carcinoma proliferation and metastasis via activation of SREBP1-induced aberrant lipid metabolism [22]. In addition, E2F1 facilitates cell cycle of colorectal cancer cells by promoting spindle assembly [23]. In our study, SGO2 was demonstrated to promote cell proliferation and other oncogenic traits. Western blot results showed that SGO2 increased the expression level of E2F1, CyclinE1 and Bcl-2. To clarify whether SGO2 promoted cell proliferation and cell cycle via E2F1, E2F1 knockdown was conducted in OE-SGO2-A549 cells. The results showed that the elevated proportion of cells in the S phase and the suppression of cell apoptosis by SGO2 overexpression might partly be reversed by knockdown of E2F1.
The current study mainly focused on the role of SGO2 in regulating cell proliferation and cell cycle via E2F1 in LUAD. However, our study has limitations. The in vitro cellular experiments necessitate further validation in vivo to confirm the role of SGO2 in progression of LUAD. Various other possible mechanisms that affect LUAD progression remain to be verified. These are meaningful to explore in depth in the future.
In conclusion, our study highlighted the high expression of SGO2 in LUAD and its high expression was associated with poor OS and PFS. SGO2 exerted a promoting-tumor role in LUAD via enhancing LUAD cell malignant phenotypes. Furthermore, SGO2 promoted cell proliferation and regulated cell cycle via E2F1. These findings uncovered the potential of SGO2 as a biomarker for prognosis and as a strategic target for therapeutic intervention.
The datasets used and/or analyzed during this study are available from the corresponding author on reasonable request.
TX designed the study and revised the manuscript. YC performed the study, analyzed the data and drafted the manuscript. Both authors have contributed to and approved the final manuscript. Both authors participated sufficiently in the work and agreed to be accountable for all aspects of the work.
Not applicable.
Not applicable.
We are grateful for the support provided by the National Natural Science Foundation of China (Approval No. 82172619) and the Chongqing Natural Science Foundation of China (Approval No. CSTC2021jscx-gksb-N0023).
The authors declare no conflict of interest.
References
Publisher’s Note: IMR Press stays neutral with regard to jurisdictional claims in published maps and institutional affiliations.