


 , Xuewei Zheng 1,2,3,*
1 Department of Pathology, The First Affiliated Hospital of Henan University of Science and Technology, 471003 Luoyang, Henan, China
2 Precision Medicine Laboratory, School of Medical Technology and Engineering, Henan University of Science and Technology, 471003 Luoyang, Henan, China
3 Henan Engineering Research Center of Digital Pathology and Artificial Intelligence Diagnosis, The First Affiliated Hospital of Henan University of Science and Technology, 471003 Luoyang, Henan, China
4 Department of Pathology, The First Affiliated Hospital, Jiangxi Medical College, Nanchang University, 330008 Nanchang, Jiangxi, China
Abstract
Background: Aerobic glycolysis and the cell cycle are well-established tumor hallmarks. Understanding their relationship could help to unravel the pathogenic mechanisms of breast cancer (BC) and suggest potential new strategies for treatment. Methods: Glycolysis-related genes (GRGs) were downloaded from the Reactome database and screened using univariate Cox analysis. The consensus clustering method was employed to identify a glycolytic activity signature (GAS) using the Gene Expression Omnibus (GEO) dataset. A nomogram risk prediction model was constructed using coefficients from univariate Cox analysis. Immune cell infiltration was evaluated using single-sample gene set enrichment analysis (ssGSEA) and the ESTIMATE algorithm. Gene co-expression modules were created using weighted correlation network analysis (WGCNA) to identify hub genes. Gene expression in three BC cell lines was quantified using Quantitative Reverse Transcriptase Polymera (qRT-PCR). Single-cell RNA sequencing (scRNA-seq) data was used to examine the relationship between GAS and hub genes. The sensitivity of different groups to cell cycle-related clinical drugs was also examined. Results: BC with high GAS (HGAS) showed high tumor grade and recurrence rate. HGAS was a prognostic indicator of worse overall survival (OS) in BC patients. HGAS BC showed more abundant immune cells and significantly higher expression of immunomodulators compared to BC with low GAS (LGAS). HGAS BC also showed enhanced cell cycle pathway, with high mRNA and protein expression levels of Cyclin B2 (CCNB2), a key component of the cell cycle pathway. Importantly, scRNA-seq analysis revealed that elevated CCNB2 expression was positively correlated with HGAS in triple-negative BC (TNBC). This was validated in clinical samples from TNBC patients. High expression of CCNB2 was found in three BC cell lines, and was also an indicator of poor prognosis. HGAS BC showed high sensitivity to several cell cycle-related clinical drugs, with 9 of these also showing activity in BC with high CCNB2 expression. Conclusions: HGAS was associated with enhanced cell cycle pathway and immune activity in BC. These results suggest that CCNB2 is a potential key therapeutic target in BC patients.
Keywords
- glycolytic activity signature
- cell cycle
- CCNB2
- immune cell infiltration
- prognosis
Energy metabolic reprogramming is a well-established tumor hallmark, including in breast cancer (BC) [1]. One of the major alterations is that tumor cells use aerobic glycolysis as a common glucose metabolism pathway [1, 2]. During this process, glucose serves as a substrate and is catalyzed by a series of enzymes to generate lactate. Despite its low efficiency for ATP generation, aerobic glycolysis can enhance tumor cell survival under difficult conditions by increasing biosynthesis, inhibiting apoptosis, and producing signaling metabolites [3, 4]. For example, one of the glycolytic metabolites, methylglyoxal, has been shown to facilitate BC metastasis by activating the MEK/ERK/SMAD1 cascade [5]. Moreover, two potent scavengers of methylglyoxal can reverse the effects on metastasis. The glycolytic pathway is therefore an attractive target for therapeutic intervention in tumor cells, and inhibition of key components of this pathway can significantly impede cell proliferation and metastasis. Phosphoglycerate kinase 1 (PGK1) is one such representative target, and its inhibition results in the suppression of tumor growth and metastasis [6]. Aerobic glycolysis can therefore be used as a potential targeted therapeutic strategy to hinder the growth of various tumors through drug treatment [7].
Enhanced cell cycle is another hallmark of cancer, with Cyclin D-CDK4/6 (CDK4/6) being critical regulators of the cell cycle [8]. Their deregulation contributes to uncontrolled cell proliferation through multiple mechanisms, including the activation of signaling pathways (FGFR or PI3K/AKT/mTOR), epithelial-mesenchymal transition, and the immune response. Currently, the U.S. Food and Drug Administration (FDA) has approved several CDK4/6-targeting clinical drugs for the treatment of hormone receptor-positive (HR+) and HER2-negative metastatic BC [8, 9], including palbociclib, ribociclib and abemaciclib. These can be used to design new treatment strategies for the improvement of patient outcomes. Importantly, the available evidence indicates a close relationship between the cell cycle and aerobic glycolysis in tumor cells. Inhibition of aerobic glycolysis can effectively cause cell cycle arrest and apoptosis in BC cells [10, 11]. For example, the inhibition of PFKFB3 increases cell death during mitosis, suggesting that the survival of mitotic-arrested cells is limited by their metabolic requirements [12]. Furthermore, knockdown of muscle pyruvate kinase (PK) significantly inhibits cell proliferation and migration, reduces S phase, and induces G2 phase cell cycle arrest in triple-negative BC cell lines [13]. However, the exact relationship between glycolytic activity and regulation of the cell cycle in BC remains elusive.
In the present study, we developed a glycolytic activity signature (GAS) by using a consensus clustering method and screening for glycolysis-related genes (GRGs). We found that BCs with high GAS (HGAS) were associated with high tumor grade and immune infiltration. Cell cycle pathways were markedly enhanced in BCs with HGAS, indicating that glycolytic activity is closely related to the cell cycle. In addition, Cyclin B2 (CCNB2) was identified as a potential therapeutic target for BC patients. Overall, this study provides novel insights into the development and treatment of BC.
Three bulk RNA sequencing datasets (GSE1456, GSE7390, GSE86166) and a single-cell sequencing dataset (GSE161529) were extracted from the Gene Expression Omnibus (GEO) website (http://www.ncbi.nlm.nih.gov/geo/). Corresponding clinical information was obtained from the easyGEO website (https://tau.cmmt.ubc.ca/eVITTA/easyGEO/). GSE1456 (GPL96, 159 samples) [14] and GSE7390 (GPL96, 198 samples) [15] were combined and used as the training set, while GSE86166 (GPL15048, 366 samples) [16] was used to validate the risk model. Among which, 126 of 159 patients have received tamoxifen and its combination in GSE1456 cohort. Patients in GSE7390 and GSE86166 cohorts have not received neoadjuvant therapy. Data preprocessing was conducted as described previously [17, 18, 19], and R package “limma” (version 3.56.2) was used to remove batch effects. GRGs were obtained from the Reactome database (https://reactome.org/).
Dataset GSE161529 was downloaded from GEO and analyzed using the R package
“Seurat” (version 5.0.3). Each gene was expressed in at least three cells. The number of
expressed genes in cells was between 300 and 6000. Filters were applied with
mitochondrial genes
The R package “ConsensusClusterPlus” (version 1.66.0) was used to determine members in the dataset and the number of possible clusters. At each iteration, 80% of the samples are subsampled and each subsample is divided into k groups (maximum k = 6) by the k-means algorithm based on Euclidean distance. This process was repeated 1000 times. Subsequently, the cumulative distribution function (CDF) curve was used to identify the optimal number of clusters.
Univariate Cox analysis was used to identify the GAS and to calculate regression
coefficients. Genes with p
Single-sample Gene Set Enrichment Analysis (ssGSEA) was used to evaluate the abundance of immune cell infiltrate in each group. Differences in the expression of immune-inhibitory and immune-stimulatory proteins between HGAS and low GAS (LGAS) was calculated and visualized using the R package “ggplot2” (version 3.5.0).
WGCNA was performed as described in a previous study [19]. The optimal soft
power threshold (
Gene Ontology (GO) enrichment and Kyoto Encyclopedia of Genes and Genomes (KEGG) analysis of hub genes were performed using the R package “clusterProfiler” (version 4.10.1). Analysis of protein-protein interaction (PPI) was performed using the GENEMANIA (https://genemania.org/) database. The “c2.cp.kegg.v2023.1.Hs.symbols.gmt” gene set was obtained from the Molecular Signature Database (https://www.gsea-msigdb.org/gsea/msigdb) and inter-group differences were analyzed. Gene set enrichment analysis was performed using the R package “GSVA” (version 1.50.1) [22].
The normal breast epithelial cell line MCF-10A and three human BC cell lines (MDA-MB-231, MCF-7, BT474) were obtained from Procell (Wuhan, Hubei, China). All cell lines were validated by STR profiling and tested negative for mycoplasma. The MCF-10A, MDA-MB-231 and MCF-7 cell lines were cultured as described previously by our group [18]. BT474 cells were cultured in Dulbecco’s modified Eagle’s medium (DMEM; Procell, Wuhan, China) supplemented with 10% fetal bovine serum (FBS; Procell, China), and 1% penicillin and streptomycin (Solarbio, Shanghai, China). All cells were kept at 37 °C in a humidified atmosphere containing 5% CO2.
Total RNA was extracted from cell lines using TransZol reagent (TransGen, Beijing, China) according to the manufacturer’s instructions. The primer sequences were: CCNB2, CAACCCACCAAAACAACA (forward), AGAGCAAGGCATCAGAAA (reverse); GAPDH, GCACCGTCAAGGCTGAGAAC (forward), TGGTGAAGACGCCAGTGGA (reverse). Among which, the relative expression levels of mRNA were calculated by the 2-ΔΔCt method, and GAPDH was used as an internal control.
Tissue samples from two triple-negative BC (TNBC) patients who did not undergo neoadjuvant therapy were collected from the First Affiliated Hospital of Nanchang University. Immunohistochemistry was performed using the mouse monoclonal anti-CCNB2 (1:500 dilution, Abcam, Cambridge, UK) antibody as described previously [23]. All experiments were performed in compliance with the relevant regulations. Ethics approval was obtained from the Medical Research Ethics Committee of the First Affiliated Hospital of Nanchang University [Grant no. (2023) CDYFYYLK (04-036)]. Patients provided written informed consent.
Drug response data was obtained from the Genomics of Drug Sensitivity in Cancer database (https://www.cancerrxgene.org/). The R package “oncoPredict” (version 0.2) [24] was used to analyze drug sensitivity in HGAS and LGAS groups, which were compared using the Wilcoxon rank sum test.
All statistical analyses were performed using R language (version 4.3.1).
Statistical differences between two groups were evaluated using the Wilcoxon
test. p
After removing batch effects, a total of 85 glycolytic genes were initially identified from a combined dataset (Supplementary Fig. 1A,B, Fig. 1A), of which 21 were then selected using univariate Cox analysis (Supplementary Fig. 1C, Supplementary Table 1). Consensus clustering analysis revealed that BC patients could be divided into two clusters based on the best parameter (k = 2) (Fig. 1B,C, Supplementary Fig. 1D). Heatmap analysis showed that 15 of the 21 glycolytic genes were upregulated in cluster 1, which was thus defined as HGAS. In addition, 4 of the 21 glycolytic genes were downregulated in cluster 2, which was defined as LGAS (Fig. 1D). BC patients in the HGAS group had significantly worse RFS and OS compared to the LGAS group (Fig. 1E). In addition, BC patients in the HGAS group showed higher tumor grade and a higher death and recurrence rate (Table 1).
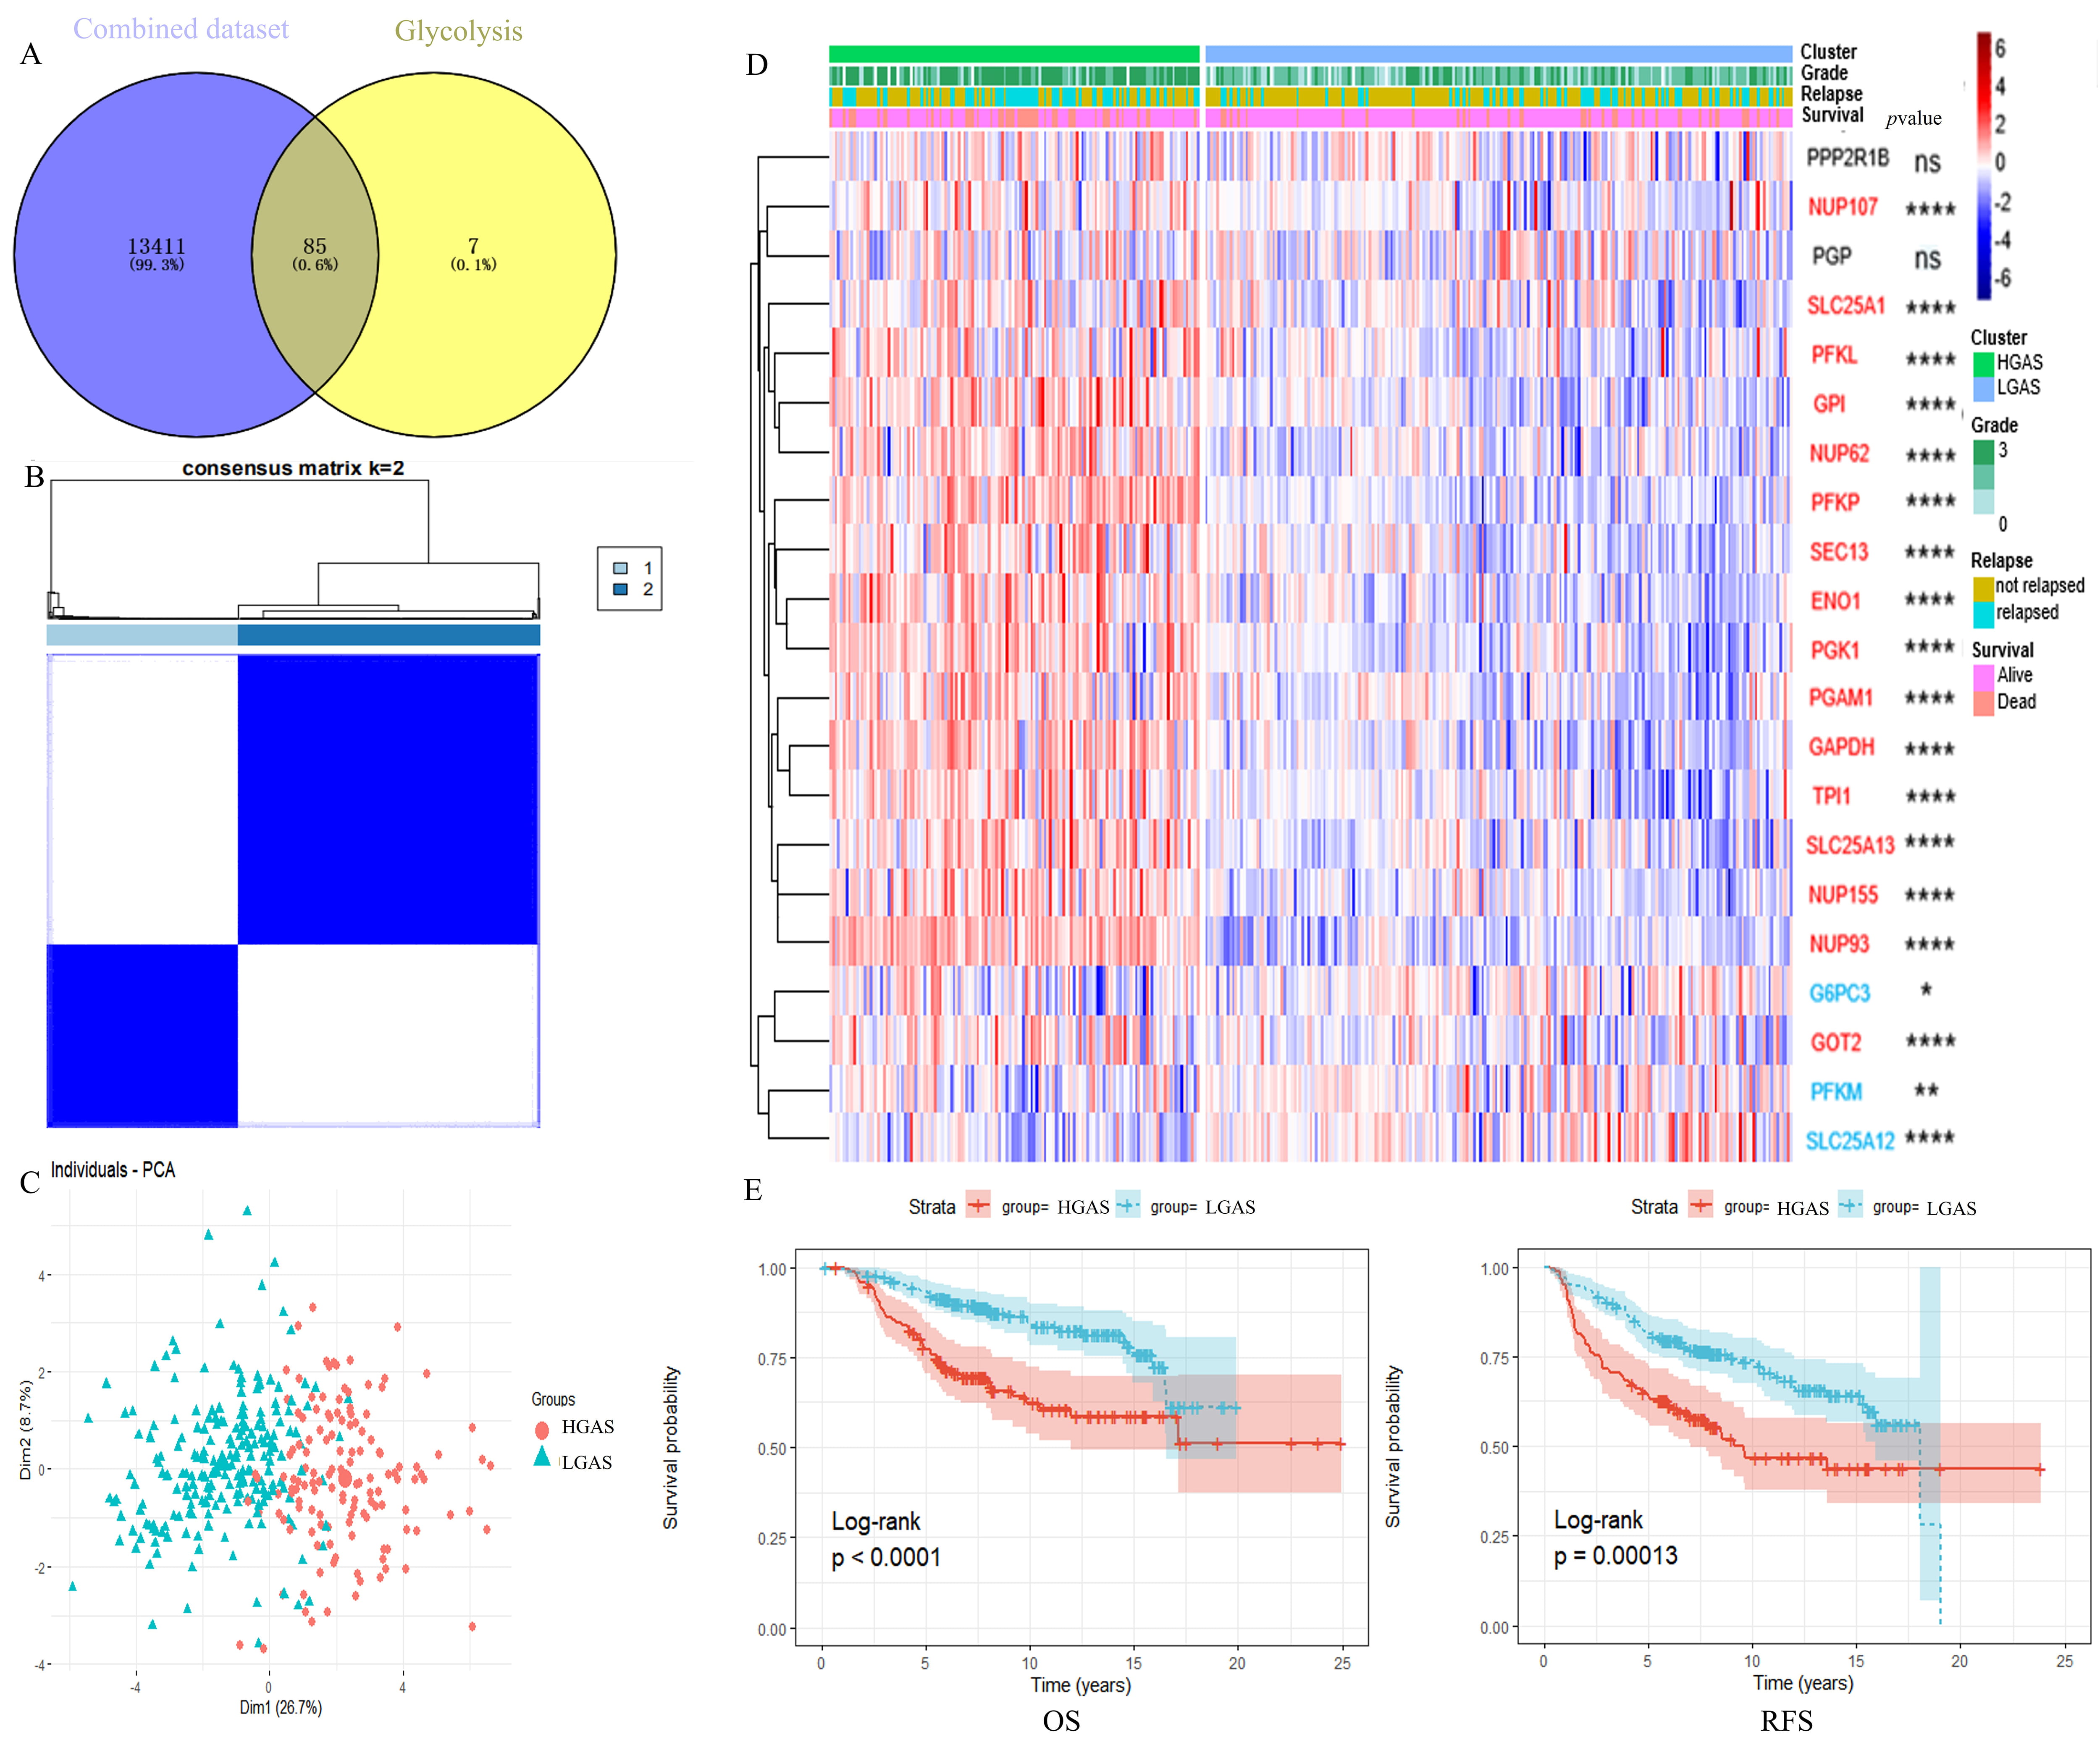 Fig. 1.
Identification of HGAS in BC. (A) Venn diagram. (B) Consensus
score matrix of all samples when k = 2. (C) The principal component analysis
(PCA) map. (D) Heatmap of mRNA expression levels of glycolysis genes shows
distinct clustering of samples into HGAS and LGAS, the red font represents
upregulation and blue font represents downregulation. (E) Kaplan–Meier analysis
showing OS and RFS of the two clusters of BC patients.
*p
| Characteristic | Level | HGSA | LGSA | p |
| n | 131 | 212 | ||
| Grade (%) | ||||
| G1 | 11 (8.40) | 47 (22.17) | ||
| G2 | 30 (22.90) | 111 (52.36) | ||
| G3 | 90 (68.70) | 54 (25.47) | ||
| Survival status (%) | 0.0002 | |||
| Alive | 81 (61.83) | 171 (80.66) | ||
| Dead | 50 (38.17) | 41 (19.34) | ||
| Survival time (%) | 0.0003 | |||
| 19 (14.50) | 10 (4.72) | |||
| 18 (13.74) | 13 (6.13) | |||
| 57 (43.51) | 101 (47.64) | |||
| 37 (28.24) | 88 (41.51) | |||
| Recurrence status (%) | 0.0028 | |||
| No recurrence | 69 (52.67) | 147 (69.34) | ||
| Recurrence | 62 (47.33) | 65 (30.66) | ||
| Recurrence time (%) | 0.0001 | |||
| 38 (29.01) | 22 (10.38) | |||
| 12 (9.16) | 24 (11.32) | |||
| 55 (41.98) | 95 (44.81) | |||
| 26 (19.85) | 71 (33.49) |
We next constructed a prognostic risk model using the coefficient (Supplementary Table 1) by univariate Cox analysis. This was used to assess GAS as a predictor of OS. The model showed that BC patients in the high-risk group had significantly worse OS than those in the low-risk group (Fig. 2A,B). The predictive performance of the risk score for OS was evaluated by time-dependent ROC curves. The area under the curve (AUC) was 0.78 at 1-year, 0.69 at 3-years, and 0.66 at 5-years (Fig. 2C). The nomogram revealed that the risk score contributed more to the prognosis than clinical features (Fig. 2D,E). Similar results were obtained using the validation dataset (Fig. 2F–J). Collectively, these results indicate that the prognostic risk model developed here was an excellent factor in predicting OS.
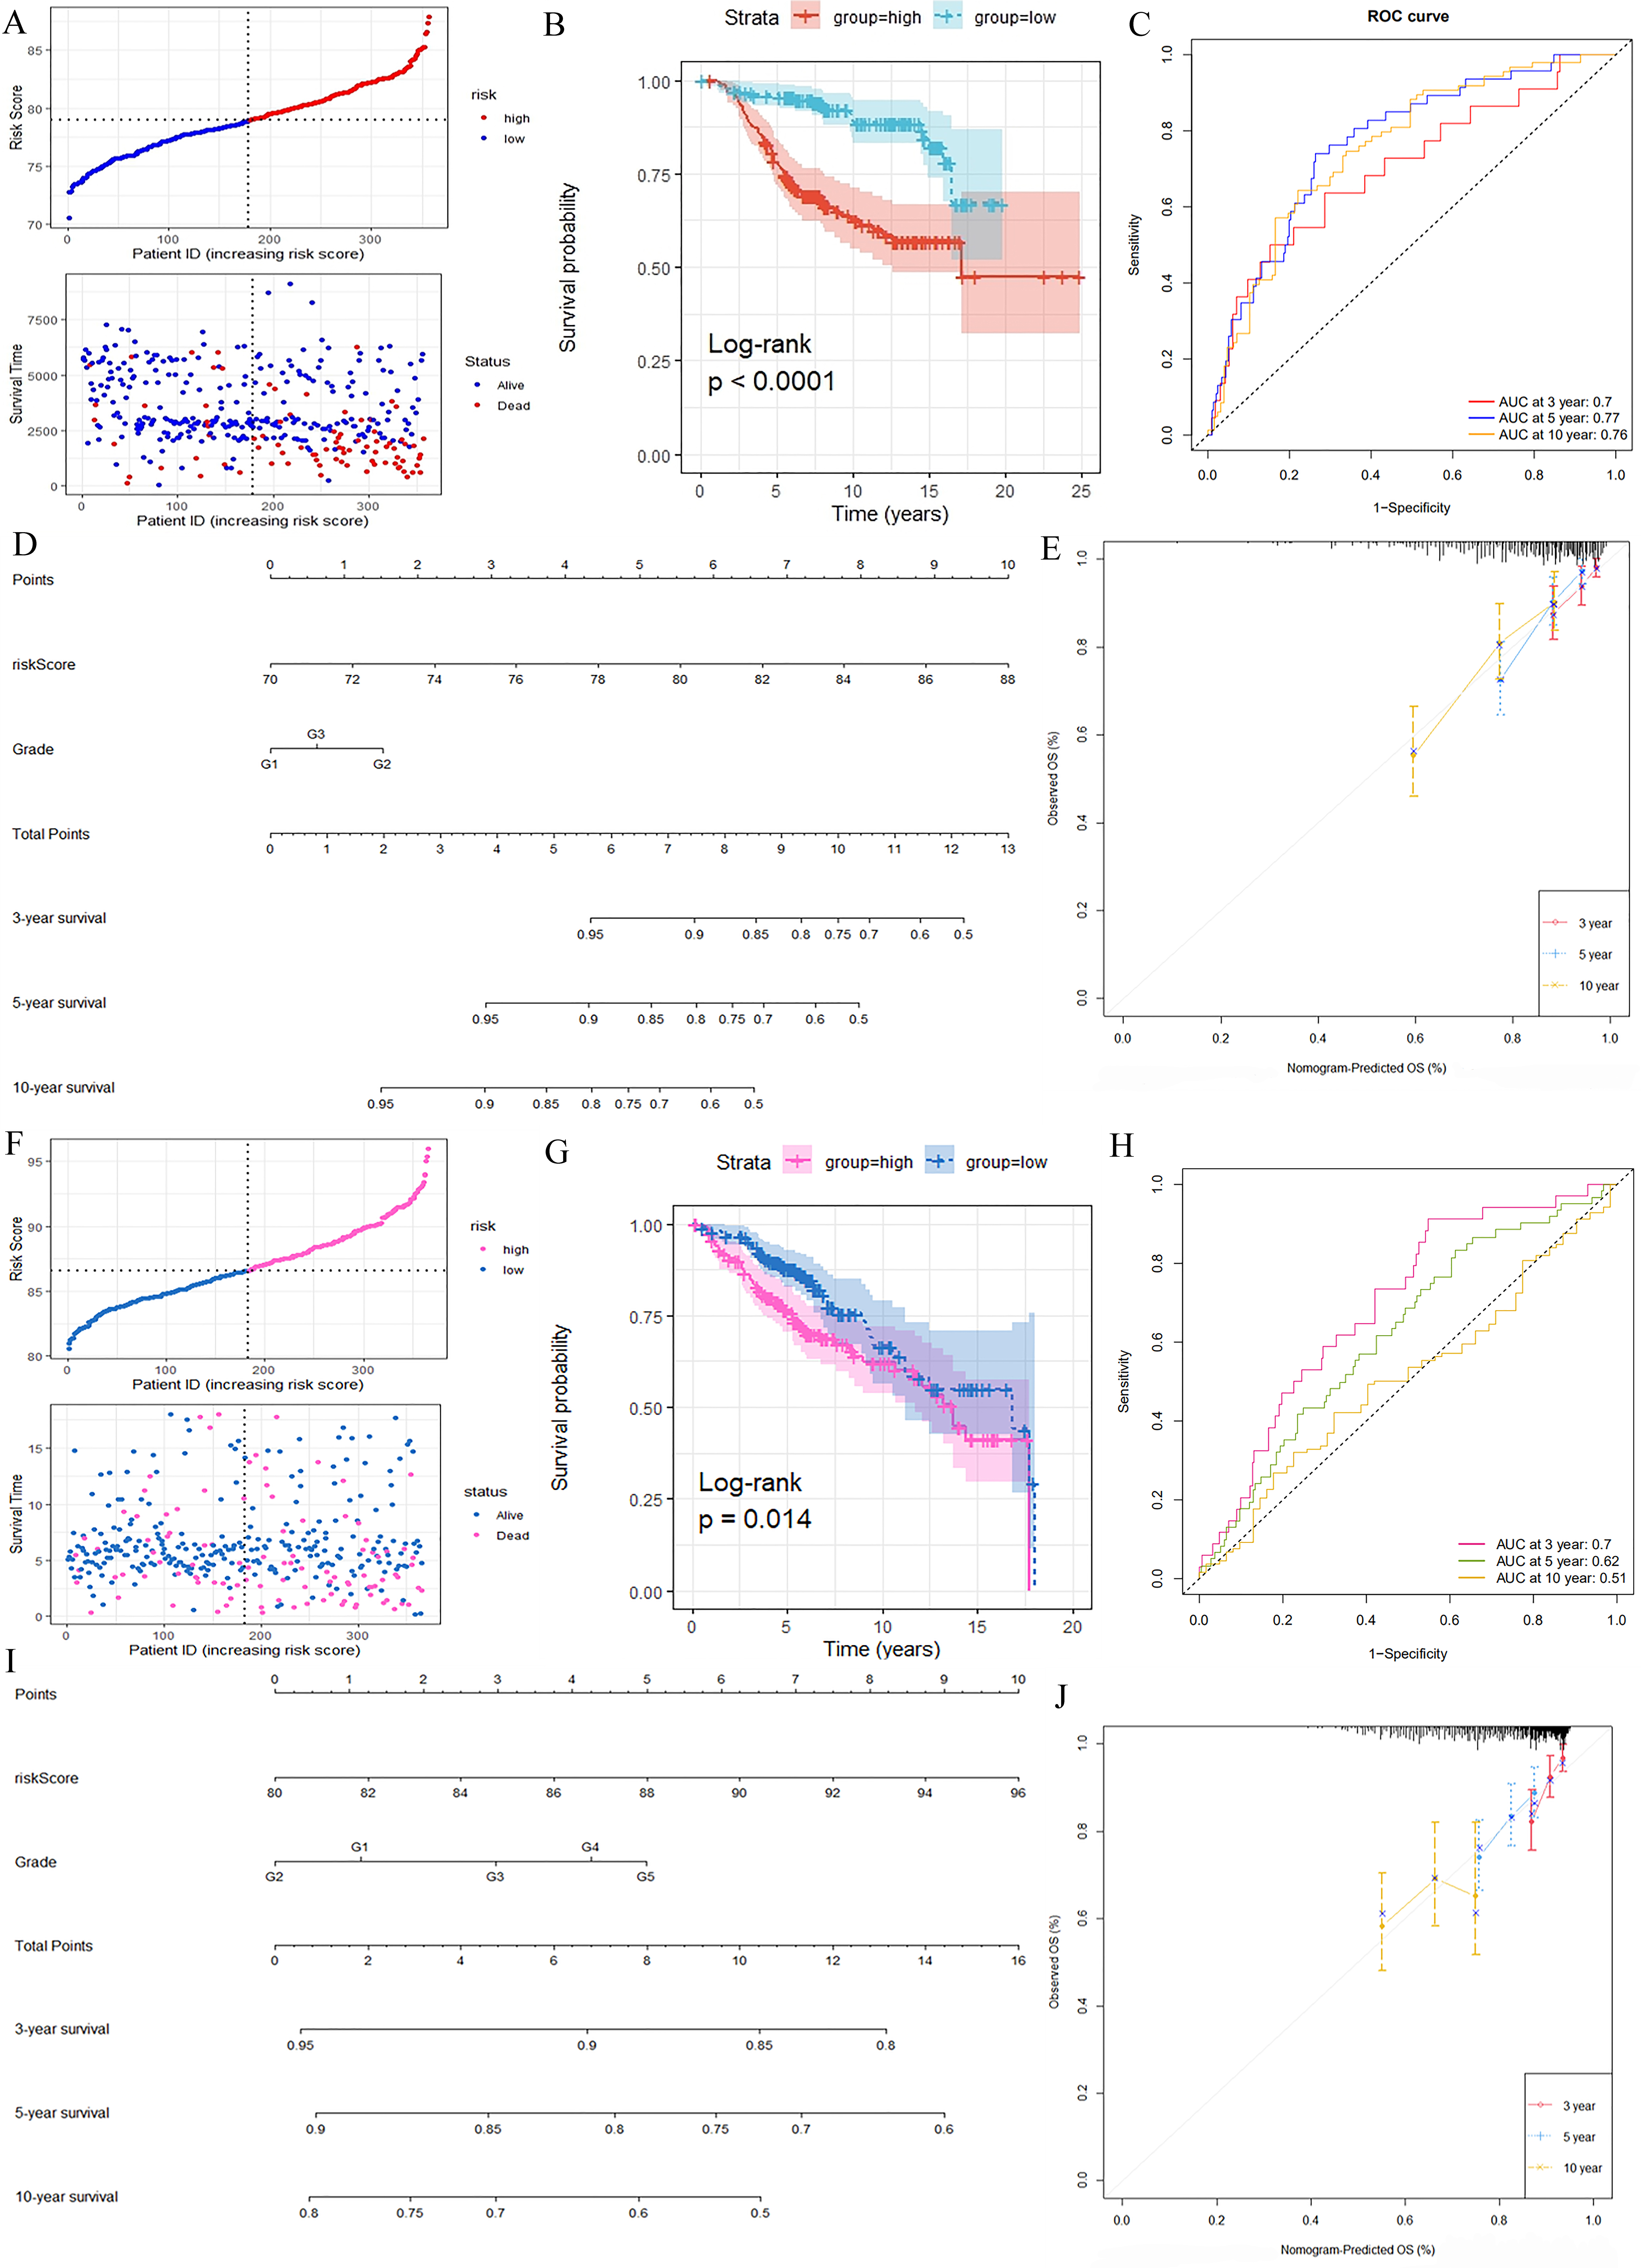 Fig. 2.
Construction and validation of a Glycolytic Activity Signature (GAS) risk model. Distributions of OS status, OS and risk score in the training set (A) and test set (F). Kaplan-Meier analysis of OS in the training set (B) and test set (G). Receiver operating characteristic (ROC) curve for 3-year, 5-year and 10-year survival in the training set (C) and test set (H). Nomogram developed by integrating the signature risk-score with the clinicopathologic features in the training set (D) and test set (I). Calibration curves of nomogram for predicting overall survival at 3-year, 5-year and 10-years in the training set (E) and test set (J). ID, identity document; OS, overall survival; AUC, area under the curve.
The immune microenvironment is known to significantly affect therapeutic effects and prognosis of BC. We therefore compared the immune response between HGAS and LGAS groups using several different immune analyses. The ESTIMATE analysis showed that BC in the HGAS group had a lower stromal score and a higher immune score compared to BC from the LGAS group (Supplementary Fig. 2). Single-sample gene set enrichment analysis (ssGSEA) results also showed the HGAS group had a relatively high immune status compared to the LGAS group (Fig. 3A), consistent with the ESTIMATE results. Eighteen of 22 immune cell types showed relatively higher infiltration in the HGAS group compared to LGAS group, including regulatory T cells, myeloid derived suppressor cells (MDSCs) and so on. Four of 22 immune cell types showed relatively lower infiltration in the HGAS group, including plasmacytoid dendritic cells, macrophages, eosinophils and mast cells.
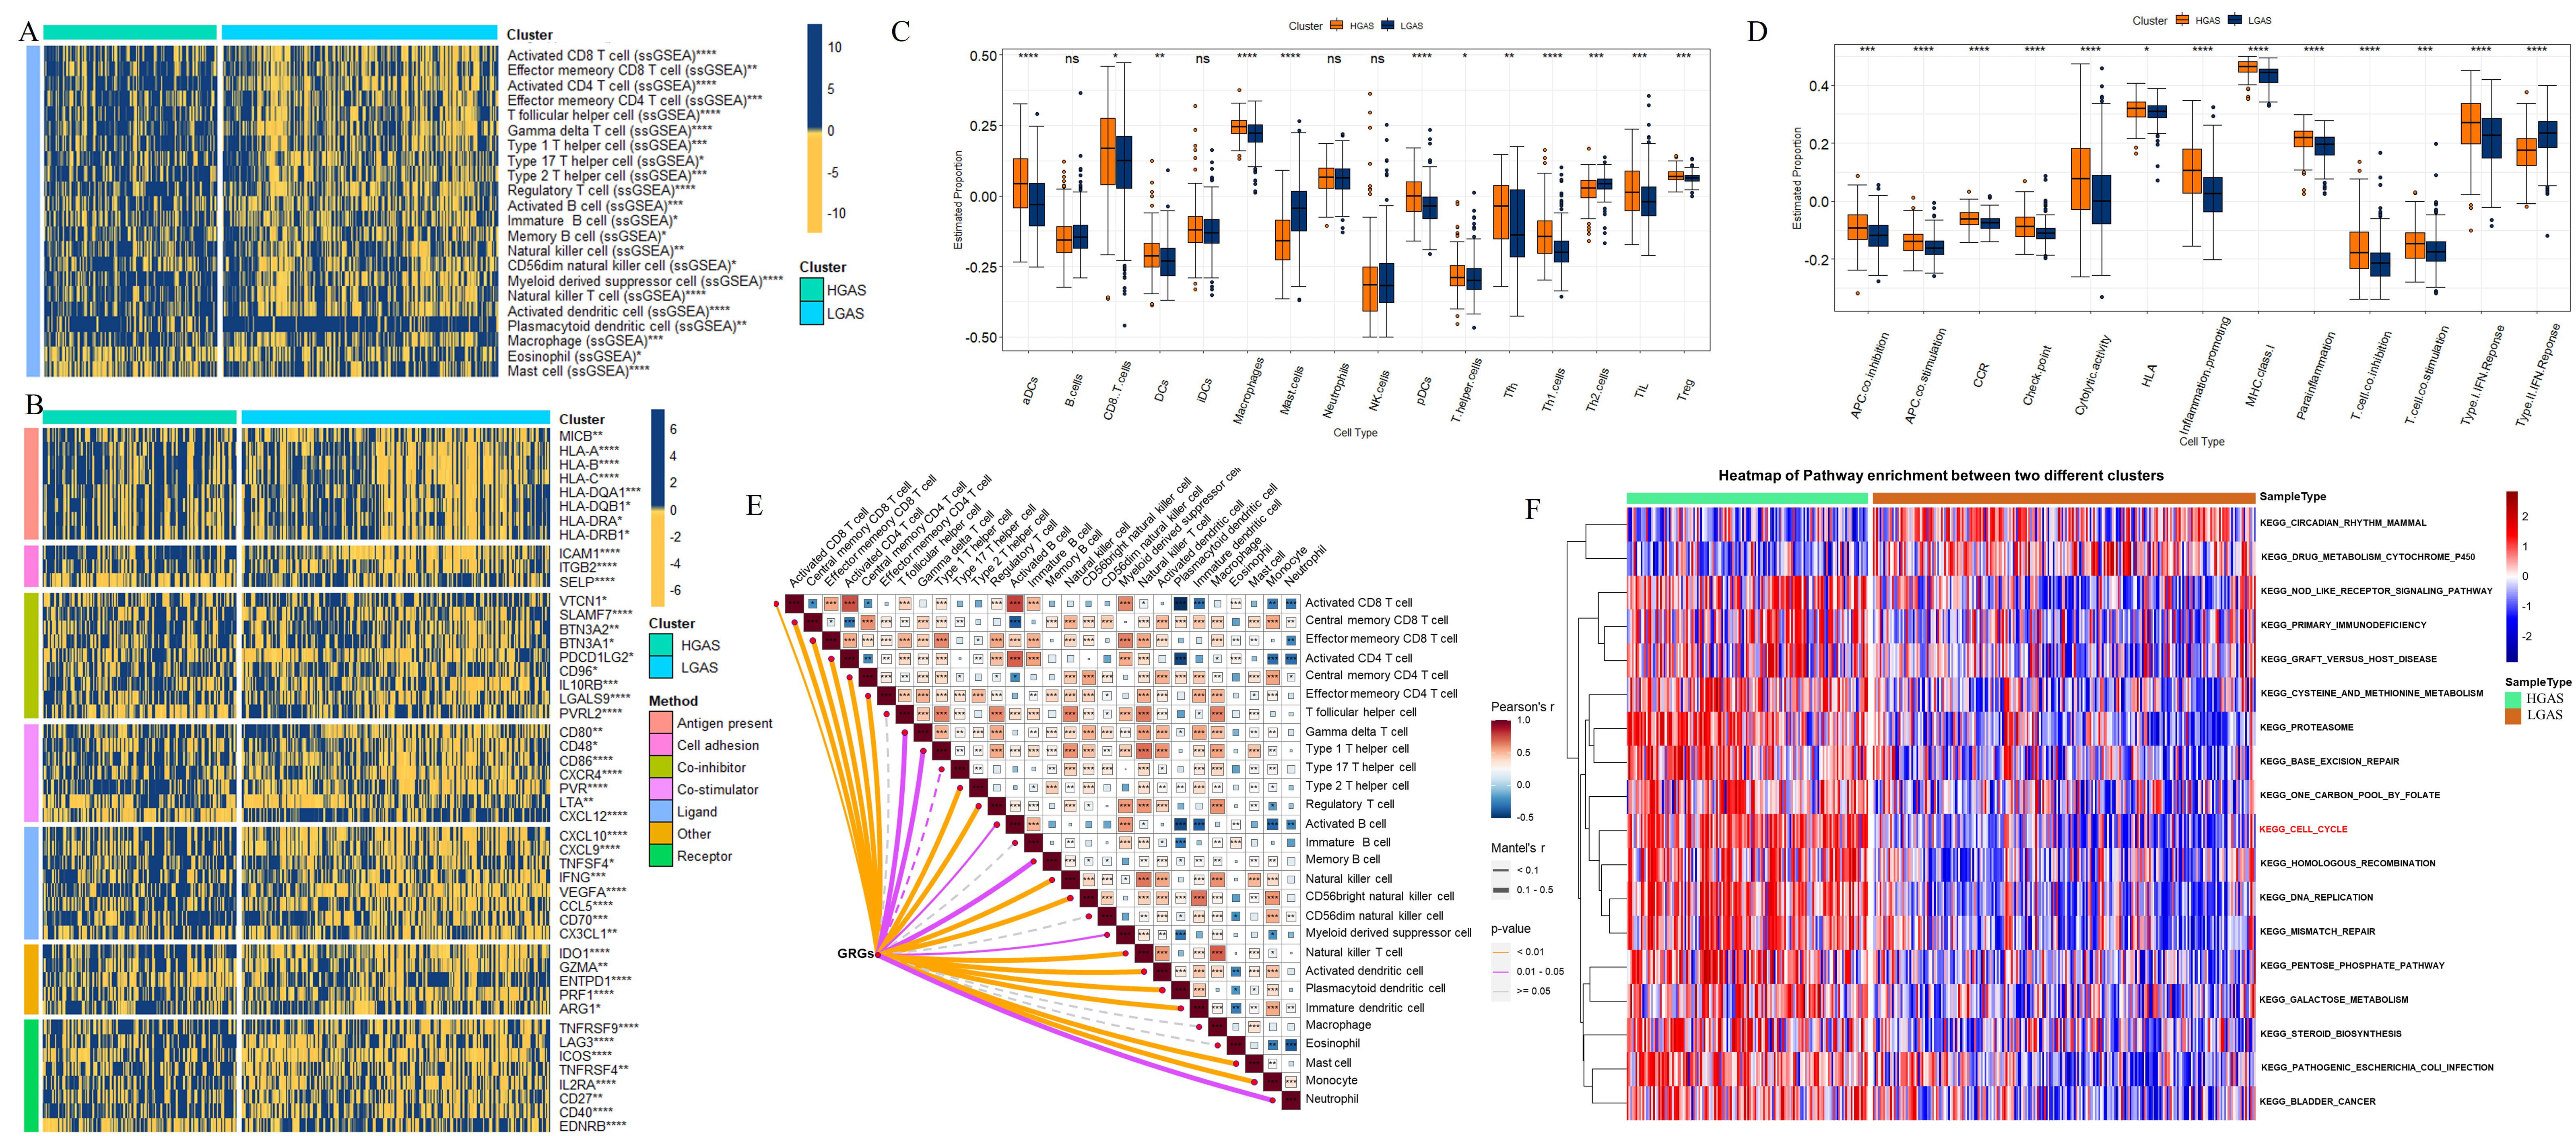 Fig. 3.
Immune response comparison between the HGAS
and LGAS BC groups. (A) Immune cell infiltration. (B) Immune modulator
molecules. (C) Differences in scores for infiltrating immune cells. (D)
Differences in scores for immune-related functions. (E) Correlation between glycolysis-related genes (GRGs)
and immune cells in HGAS group. (F) Pathway enrichment analysis in the two
groups. *p
The HGAS and LGAS BC groups were also compared in terms of their immunomodulator expression level (antigen presentation, cell adhesion, co-inhibitors, co-stimulators, ligands, receptors, etc.). Most immunomodulators were expressed at higher levels in the HGAS group, with the exception of selectin P (SELP), nectin cell adhesion molecule 2 (PVRL2), C-X-C motif chemokine ligand 12 (CXCL12) and endothelin receptor type B (EDNRB) (Fig. 3B). In addition, ssGSEA enrichment scores were significantly greater in the HGAS group, with the exception of mast cells and Th2 cells (Fig. 3C). Similarly, the HGAS group showed enrichment for inflammatory conditions, checkpoints, cytolytic exertion, T cell co-inhibition, T cell co-stimulation, para-inflammation, and type 1-related IFN reactions. HGAS BC also showed higher immune function scores for major histocompatibility complex (MHC) class I, Antigen-presenting cells (APC) co-inhibition, APC co-stimulation, chemokine receptor (CCR), and human leukocyte antigen (HLA) (Fig. 3D). Thus, the correlations between GRGs and infiltrated immune cell types in HGAS group were analyzed (Fig. 3E). GRGs showed higher positively correlation with most immune cells, myeloid-derived suppressor cell (MDSC) in particularly (Fig. 3E).
Pathway enrichment analysis was used to reveal functional differences between the two groups (Fig. 3F). Almost all pathways were upregulated in HGAS BC compared to LGAS BC, including metabolism pathways such as the pentose phosphate pathway and methionine metabolism. Of note, the cell cycle pathway was significantly increased in the HGAS group (Fig. 3F), suggesting that it could be induced by high glycolytic activity in tumor cells.
To further explore the relationship between high glycolytic activity and the
cell cycle, we first analyzed GAS-related genes by constructing co-expression
modules using WGCNA. All candidate genes were clustered and divided into 16
modules according to the best soft threshold (
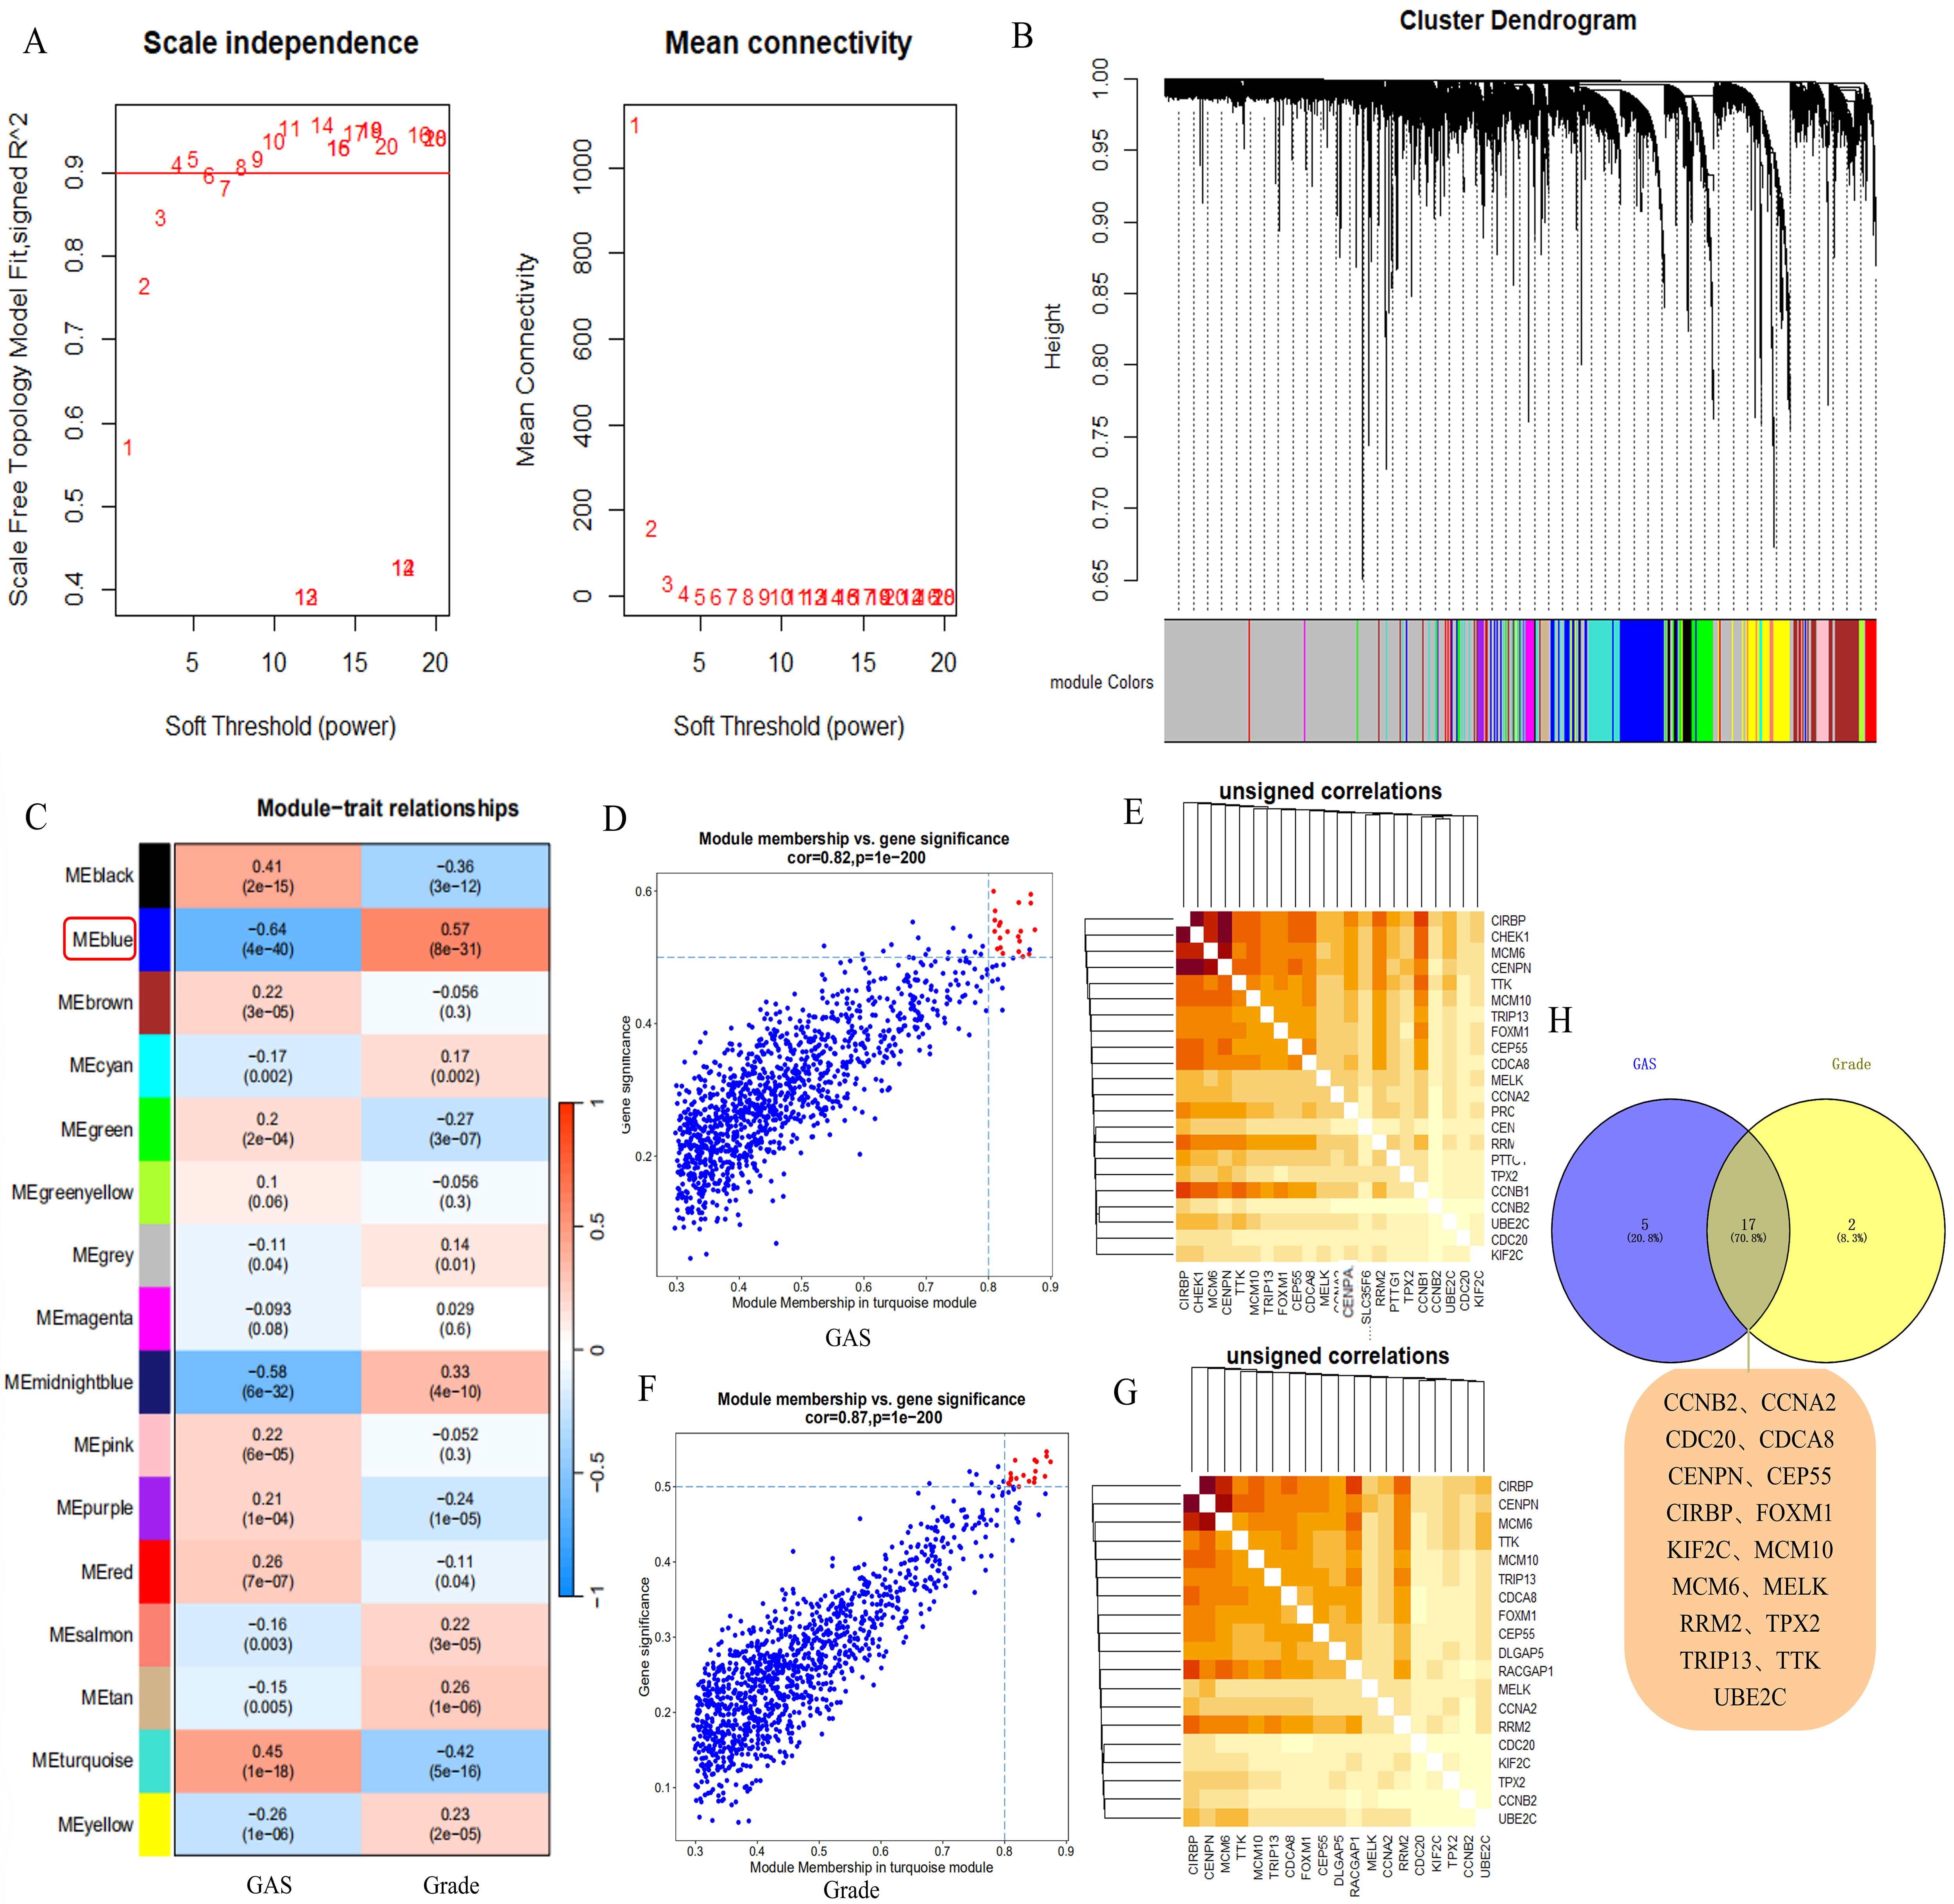 Fig. 4.
Construction of co-expression modules using WGCNA in GEO data. (A) Heatmap depicting the topological overlap matrix among genes based on co-expression modules. (B) Clustering dendrograms of genes with dissimilarity based on topological overlap, together with assigned module colors. (C) Relationships of modules with GAS and grade traits. (D,F) Correlations between blue modules and GAS and grade traits. (E,G) Candidate genes in the blue module related to both traits. (H) Hub genes. WGCNA, weighted correlation network analysis; GEO, Gene Expression Omnibus.
GO enrichment and pathway enrichment analysis were performed to explore the potential function of GAS-related genes. GO analysis indicated that various biological processes were enriched, especially cell cycle-related processes such as regulation of the metaphase/anaphase transition and the mitotic phase transition (Fig. 5A). For cellular component ontology, many genes were mapped into the chromosomal region spindle. For molecular function, the genes were primarily mapped into cyclin-dependent protein serine/threonine kinase regulator activity and ATP hydrolysis activity (Fig. 5A). Importantly, pathway enrichment analysis revealed significant enrichment for the cell cycle and cellular senescence (Fig. 5B). Functional analysis of GAS-related genes therefore highlighted the importance of the cell cycle, suggesting potential roles for glycolytic activity and the cell cycle in the regulation of BC progression. GAS-regulated genes were then mapped to the cell cycle (Fig. 5C). Four GAS-related genes were found to be associated with the cell cycle, with CCNB2 participating in the most pathways (Fig. 5B,C). Moreover, PPI results indicated that CCNB2 interacts with many of the key regulatory proteins in the cell cycle (Fig. 5D). Collectively, these findings suggest that CCNB2 is a core factor linking the cell cycle with glycolytic activity in BC.
 Fig. 5.
Functional analysis and key gene of the cell cycle. (A) Gene Ontology (GO) analysis of hub genes. (B) Pathway enrichment analysis of hub genes. (C) Pathways of cell cycle-related hub genes. (D) Protein-protein interactions. BP, Biological process; CC, cellular component; MF, Molecular function; KEGG, Kyoto Encyclopedia of Genes and Genomes.
We next explored the functions of CCNB2 in BC. Elevated CCNB2 expression was observed in BC tissue compared to normal breast tissue in the The Cancer Genome Atlas (TCGA)-BRCA and GSE16228 cohorts (Fig. 6A,B). This high expression level was then validated in three BC cell lines (Fig. 6C). CCNB2 protein was also highly expressed in BC patients (Fig. 6D). In addition, the results showed that CCNB2 was a potential prognostic factor, with high expression being associated with significantly worse OS and RFS in BC patients (Fig. 6E,F).
 Fig. 6.
Cyclin B2 (CCNB2) expression analysis and prognostic
significance. CCNB2 expression in the TCGA cohort (A), in GSE16228 (B), and in
BC lines (C); Immunohistochemistry analysis of CCNB2 expression in breast normal and tumor tissue based on the Human Protein Atlas (HPA). Images available from v23.0.proteinatlas.org (D); Kaplan–Meier analysis of OS (E) and RFS (F) in BC patients
according to CCNB2 expression.
*p
The relationship between high glycolytic activity and CCNB2 expression was further investigated using scRNA-seq data. First, ineligible cells were filtered out to yield 46046 core cells (normal, 9376; Her2, 10934; luminalA/B, 10232; TNBC, 15504) for subsequent analysis of different tumor cell subtypes and normal samples (Supplementary Fig. 4). Fifteen cell clusters were finally identified (Fig. 7A, Supplementary Fig. 5B–D). High CCNB2 expression was observed in proliferating cells in the TNBC subtype (Fig. 7B). Importantly, proliferating cells were the primary cell type in TNBC samples (Fig. 7C). Increased expression of CCNB2 was also observed in TNBC patients (Fig. 7D). A high AUC value was also observed for the 21 HGAS-related genes in proliferating cells in the TNBC subtype (Fig. 7E). These results highlight the close link between elevated glycolytic activity and CCNB2 expression.
 Fig. 7.
Single-cell clustering analysis. (A) Results of cell annotation. (B) Uniform Manifold Approximation and Projection (UMAP) plots showing the expression of CCNB2 in different cell clusters. (C) Cell types in different samples. (D) Immunohistochemistry for CCNB2 expression in normal and tumor tissue from triple-negative BC (TNBC) patients. Scale bar: 80 µm. (E) AUC value for glycolytic activity in different cell types. CAFs, cancer-associated fibroblasts; HER2, Human epidermalgrowth factor receptor-2; ER, estrogen receptor.
Since CCNB2 can potentially interact with a variety of cell cycle-related proteins, we further investigated the sensitivity of cell cycle-related clinical drugs in relation to GAS and CCNB2. In all, BC patients in HGAS group were more sensitive to 13 cell cycle-related clinical drugs due to the lower half-maximal inhibitory concentration (IC50) score, including dinaciclib, ribociclib, camptothecin, vinblastine, cytarabine, docetaxel, fluorouracil, paclitaxel, irinotecan, gemcitabine, topotecan, teniposide and vinorelbine (Fig. 8A). Among them, BC patients in the high CCNB2 expression group were more sensitive to 9 cell cycle-related clinical drugs due to the lower IC50 score, including dinacicilib, ribocicilib, vinblastine, docetaxel, fluorouracil, paclitaxel, gemcitabine, teniposide and vinorelbine (Fig. 8B). The drug score (IC50) of each of the 9 cell cycle-related clinical drugs showed a significant negative correlation with CCNB2 expression (Fig. 8C). Collectively, these findings suggest that these 9 medications may be more effective in patients with higher HGAS levels and CCNB2 expression.
 Fig. 8.
The IC50 score of cell cycle drugs. Drug score (IC50)
in HGAS and LGAS BC groups (A), and in CCNB2 low- and high-level groups (B); (C)
Correlation between CCNB2 expression and drug score (IC50) to cell cycle
drugs. The lower the drug score (IC50, the number in Y-axis) is, the higher
sensitivity of the patients to the drug under the condition of high-level GAS or
CCNB2. *p
An adequate supply of energy and biosynthetic intermediates are required for tumor initiation, development and metastasis. Aerobic glycolysis is a well-established feature of energy metabolism in tumor cells. The current study found that 21 key enzymes in the glycolytic pathway could divide BC patients into two clusters. Many of these enzymes were upregulated in the HGAS group, thus implicating enhanced glycolytic activity in BC. Some key glycolytic enzymes have already been associated with the progression of BC, including PGK1 [6, 25], PGAM1 [26], ENO1 [27], and GAPDH [28]. These genes also show significant prognostic value in BC patients [25, 27, 29]. The GAS is also composed of these genes and showed similar prognostic value in BC patients, with HGAS being associated with worse OS. In addition, the nomogram model showed the GAS has high prognostic accuracy for OS, suggesting it may be a potential prognostic factor in BC patients.
Importantly, functional analysis revealed that HGAS was associated with highly expressed cell cycle pathways in BC, indicating a regulatory relationship between glycolytic activity and the cell cycle. A previous study reported that alteration of metabolic pathways in tumor cells occurs in synchrony with cell cycle progression and division [30]. The glycolysis pathway is connected with cell cycle progression by reciprocal activation of metabolic enzymes and cell regulators. For example, in many cancer types the nuclear concentration of GAPDH increases from the S phase to G2/M, indicating a periodical translocation to the nucleus to oversee cell cycle regulators [30]. Studies have also suggested that upregulated GAPDH facilitates cell cycle progression by advancing the cyclin B-CDK1 peak [31] and delaying the degradation of telomerase [32]. Collectively, the results of the present study highlight the importance of enhanced glycolysis to the cell cycle in cancer cells. A possible explanation is that glycolysis temporarily provides sufficient energy for the cell cycle process. Of note was our observation that immune cell abundance and the immune score were significantly higher in HGAS BC than in LGAS BC, particularly the MDSCs, which was a key factor in promoting BC progress via variously inhibitory ways [33]. Importantly, elevated expression of immune checkpoints was also found in the HGAS group. Previous studies reported that glycolytic activity in diverse cancer types was often correlated with active immune signatures and high PD-L1 expression [34, 35]. Increasing evidence also suggests that tumor glycolysis plays a key role in instigating immunosuppressive networks that are critical for immune evasion by cancer cells [36]. The nuanced relationship observed in the present study between glycolysis and immune cell abundance or immune checkpoint gene expression concurs with the findings of other researchers who reported that glycolysis enables immune evasion by tumor cells [35, 37]. However, the specific regulatory mechanisms involved remain unclear and require further experimental studies.
The present study also identified a key cell cycle marker, CCNB2, through the exploration of GAS in BC. CCNB2 is a known prognostic marker in BC, with high expression being associated with poor OS [38, 39, 40] and shorter RFS [23]. Our study confirmed the presence of increased CCNB2 mRNA and protein expression levels in BC. Moreover, CCNB2 upregulation was reported to facilitate lymphovascular invasion in BC patients [41]. Inhibition of CCNB2 in BC cell lines was also shown to contribute to G2/M arrest and to the inhibition of palbociclib-resistant BC cell growth [42]. In addition, BC patients in HGAS group were more sensitive to 13 cell cycle drugs, while those with high CCNB2 expression were more sensitive to 9 of the drugs. This evidence may also contribute to guiding chemotherapy and targeted therapies for BC, TNBC in particularly. Unfortunately, the relationship between these drugs and CCNB2 remains unclear. Nevertheless, CCNB2 may be a potential therapeutic target in BC patients.
In summary, HGAS was associated with enhanced cell cycle pathway and immune activity in BC, suggesting that glycolysis contributes to BC progression through cell cycle or immune-related targets. Meanwhile, CCNB2 may serve as a key therapeutic target.
In conclusion, HGAS is associated with worse OS in BC patients and can thus be used as a prognostic indicator in this cancer type. HGAS is also associated with high immune activity and a strongly enhanced cell cycle pathway in BC. Elevated CCNB2 expression is positively correlated with HGAS in TNBC and is associated with poor patient prognosis. CCNB2 may therefore be a key therapeutic target in future work.
The datasets used and/or analyzed during the current study are available from the corresponding author on reasonable request.
XWZ, QNY and JL designed the research study. HDM, SSZ, YRD and JYZ performed the research and analyzed the data. WBH provided help and advice on histology analysis. XWZ, JL and HDM wrote the manuscript. QNY and XWZ revised the manuscript. LZ helped to perform the experiments. XX provided help in the specimen’s collection, ethical approval and helped to perform the immunohistochemistry experiment. All authors contributed to editorial changes in the manuscript. All authors read and approved the final manuscript. All authors have significantly contributed to this work and agreed to be accountable for all its aspects.
The study protocol was approved by the Medical Research Ethics Committee of the First Affiliated Hospital of Nanchang University [(2023) CDYFYYLK (04-036)]. Patients provided written informed consent.
We thank the help that provided by the First Affiliated Hospital of Nanchang University in the collection of the human BC patient tissues.
This study was financially supported by Fundamental Research Funds for Henan University of Science and Technology (QNY, grant No. 13510001) and A-type Doctoral Talent Project of Henan University of Science and Technology (XWZ, grant No. 13480038).
The authors declare no conflict of interest.
References
Publisher’s Note: IMR Press stays neutral with regard to jurisdictional claims in published maps and institutional affiliations.