


 , Ling Yin 2,†, Yilong Ge 3,†, Xiansen Zhu 4, Yuansheng Xiao 2, Cuifu Fang 1, Qingquan Liu 2, Honghui Zhang 5, Heping Li 6,*
 , Binhui Xie 7,8,*
1 Department of General Surgery III, The First Affiliated Hospital of Gannan Medical University, 341000 Ganzhou, Jiangxi, China
2 Department of Hepatobiliary Surgery, The First Affiliated Hospital of Gannan Medical University, 341000 Ganzhou, Jiangxi, China
3 Department of Ultrasound Medicine, The First Affiliated Hospital of Gannan Medical University, 341000 Ganzhou, Jiangxi, China
4 Department of Pathology, The First Affiliated Hospital of Gannan Medical University, 341000 Ganzhou, Jiangxi, China
5 Department of General Surgery V, The First Affiliated Hospital of Gannan Medical University, 341000 Ganzhou, Jiangxi, China
6 Department of Medical Oncology, First Affiliated Hospital of Sun Yat-sen University, 510080 Guangzhou, Guangdong, China
7 Department of Hepatobiliary Surgery, Hui Ya Hospital of The First Affiliated Hospital, Sun Yat-sen University, 516001 Huizhou, Guangdong, China
8 Ganzhou Key Laboratory of Gastrointestinal Carcinomas, The First Affiliated Hospital of Gannan Medical University, 341000 Ganzhou, Jiangxi, China
†These authors contributed equally.
Abstract
Background: Chemotherapy resistance is an obstacle to promoting the survival of patients with hepatocellular carcinoma (HCC). Thus, finding promising therapeutic targets to enhance HCC chemotherapy is necessary. Methods: Signal sequence receptor subunit (SSR2) expression analysis was performed using quantitative real time polymerase chain reaction (qPCR) and Western blotting assays. Colony formation, apoptosis, anchorage-independent growth assay, and in vivo animal models were used to investigate the effect of SSR2 expression on the resistance of HCC cells to Cisplatin (DDP). Western blotting and luciferase reporter gene techniques were used to explore the molecular mechanism of SSR2 on the resistance of HCC cells to DDP. Results: We found that the SSR2 is upregulated in HCC and associated with poor survival. Further analysis showed that the downregulation of SSR2 increased the sensitivity of HCC to DDP. Mechanically, SSR2 inhibited the Yes-associated protein (YAP) phosphorylation and promoted the transcription of Hippo signaling downstream genes. Finally, the Hippo pathway inhibitor can suppress colony formation and tumorigenesis arising from SSR2 upregulation. Conclusions: Our study shows that SSR2 is important in HCC progression via the Hippo pathway. Thus, targeting the SSR2/Hippo axis might be a potential strategy for overcoming HCC resistance to DDP.
Graphical Abstract
Keywords
- SSR2
- Hippo pathway
- chemotherapy resistance
- HCC
- DDP
Liver cancer is the sixth most common cancer and, in 2020, was the third leading
cause of death from cancer worldwide [1]. Moreover, 75%–85% of liver cancers
are hepatocellular carcinoma (HCC) [1]. Despite substantial advances in HCC
treatment, the survival rate of HCC patients remains poor due to high metastasis
recurrence and drug resistance [2, 3]. Cisplatin (DDP) is the most commonly used
and effective chemotherapy drug for treating multiple cancers, such as breast
cancer and HCC [4], but drug resistance limits its effectiveness. It has been
reported that various factors are involved in DDP resistance in HCC. For example,
cancer-associated fibroblast exosomes promoted chemo-resistance to DDP in HCC via
circular RNA ZFR (circZFR) targeting the STAT3/NF-
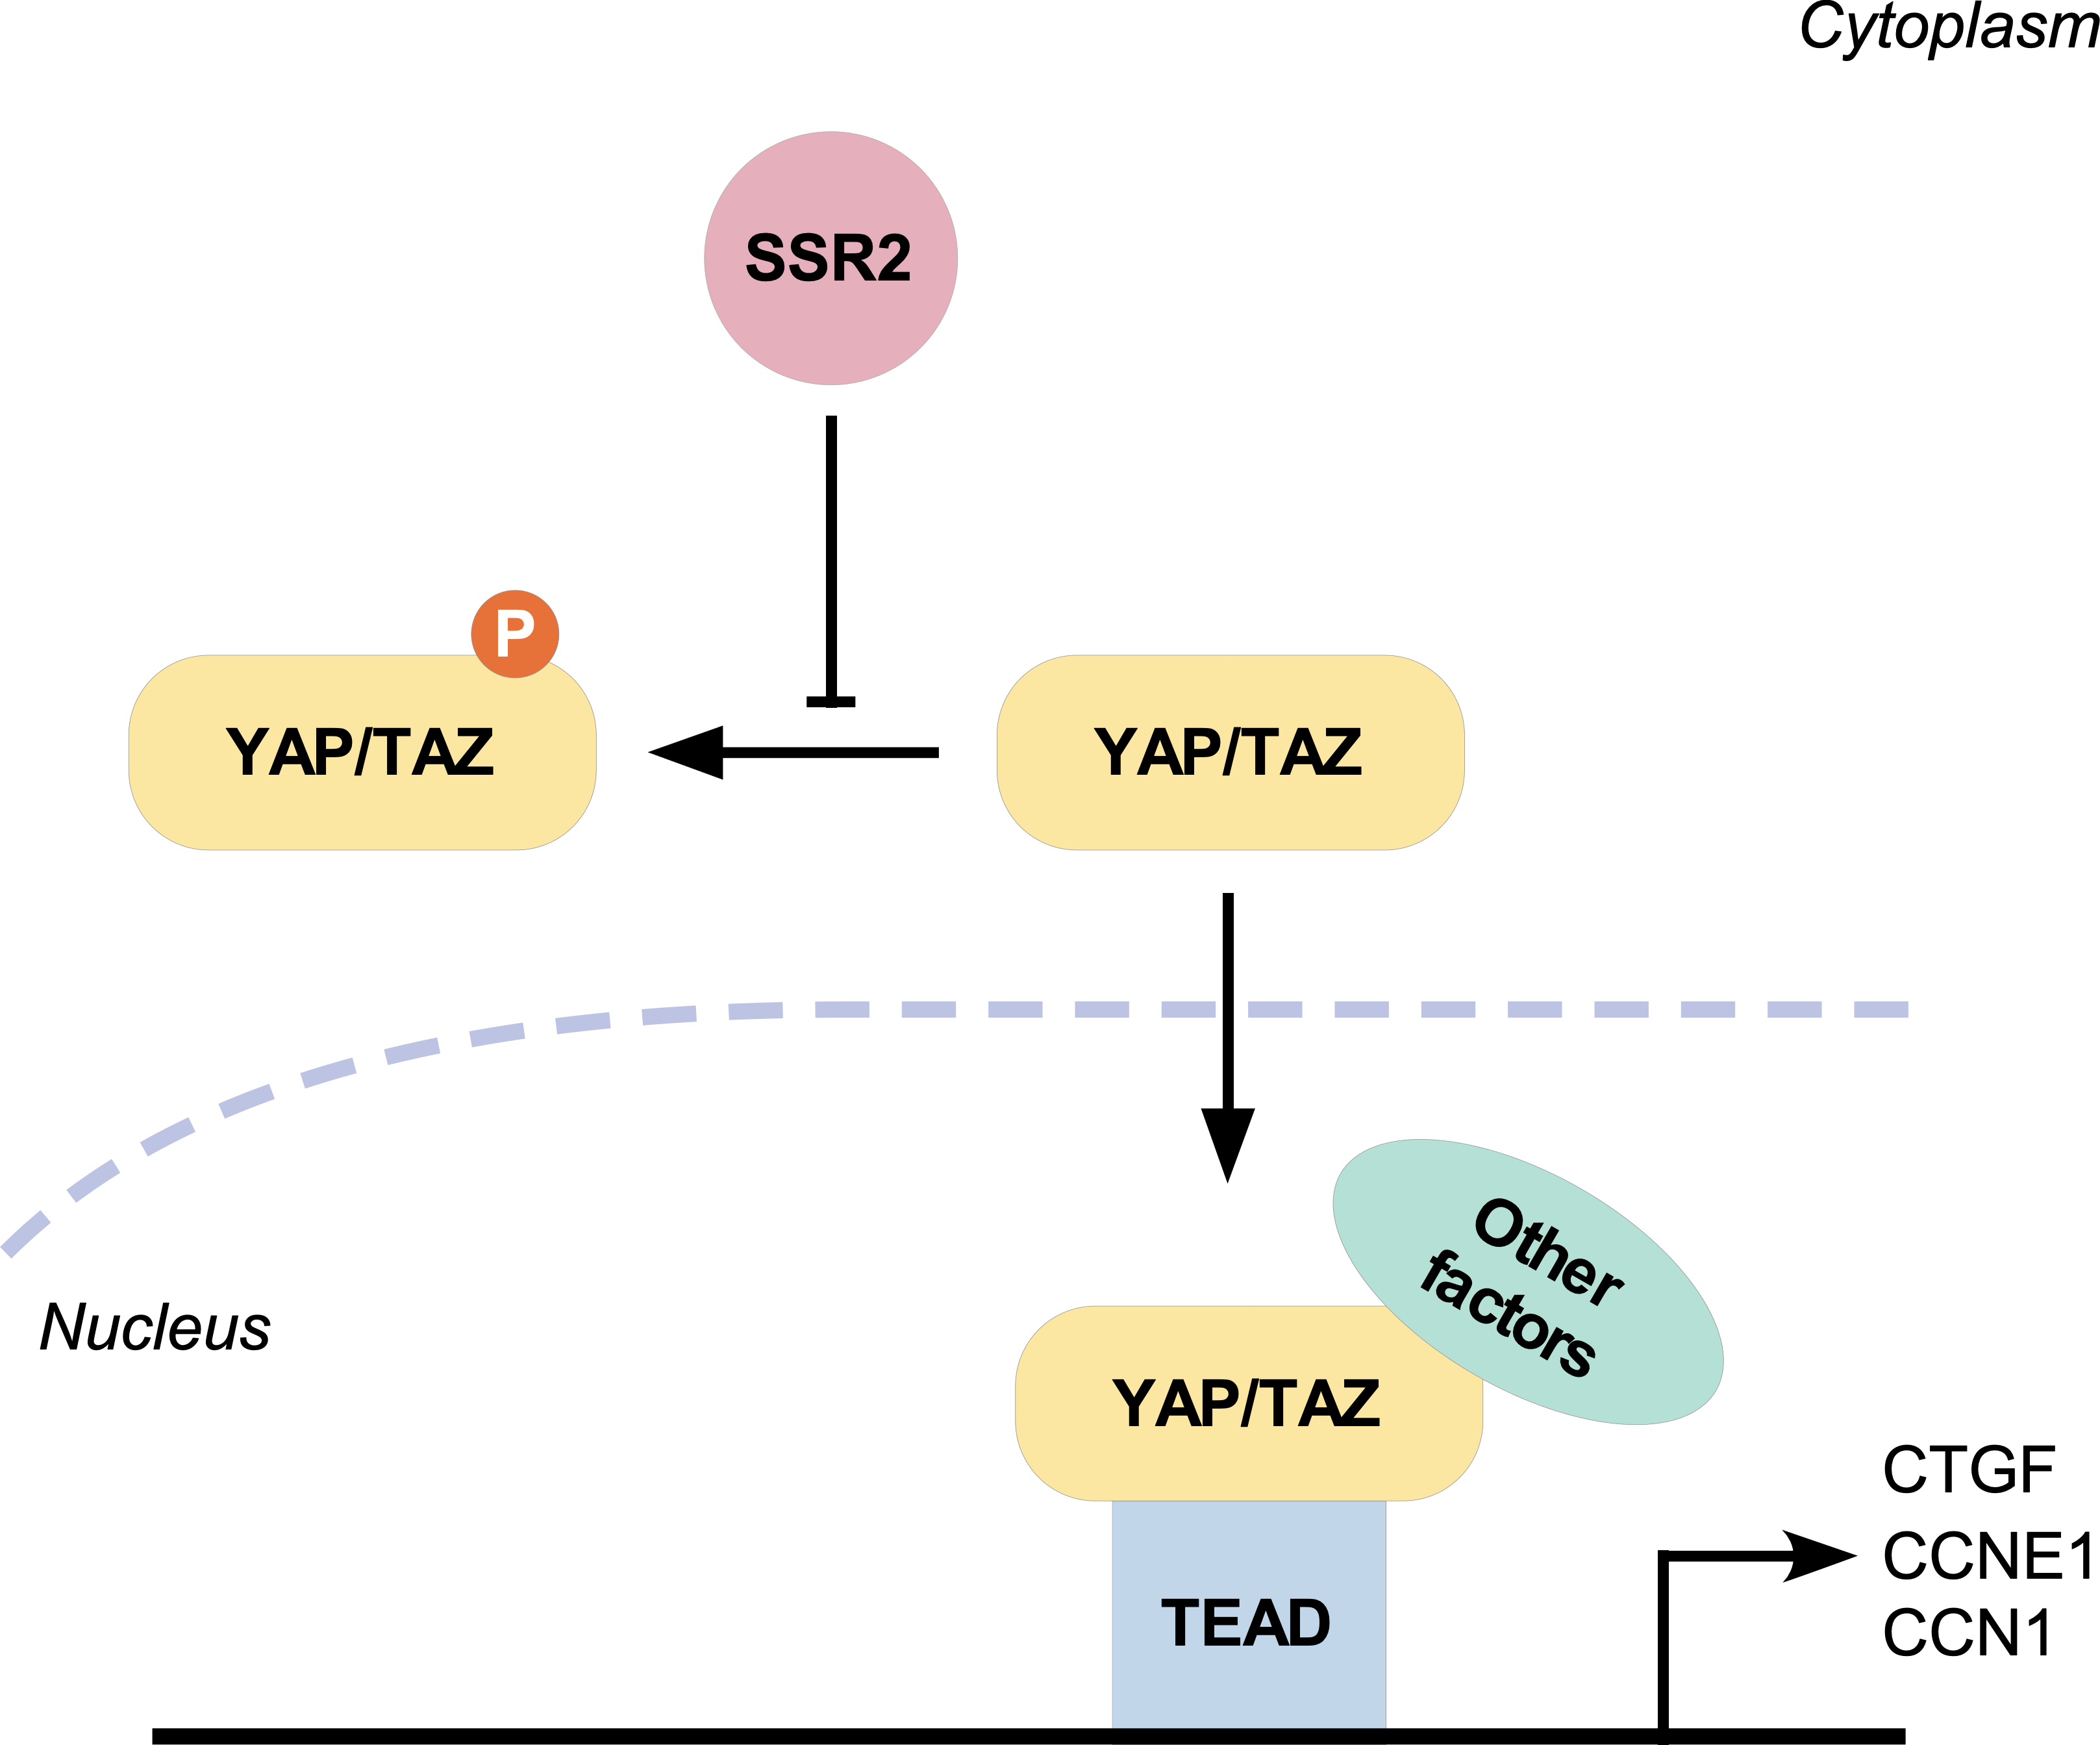
The Hippo pathway regulates organ size in several species [6]. In mammals, mammalian Ste20-like kinases 1/2 (MST1/2) phosphorylates the C-terminal hydrophobic motif of the large tumor suppressor homolog 1/2 (LATS1/2) to cause autophosphorylation of LATS1/2. Then, the activity of Yes-associated protein (YAP) and its paralog, transcriptional co‑activator with PDZ-binding motif (TAZ) is mediated by LATS1/LATS2 kinases through phosphorylating YAP/TAZ on the conserved residues [7, 8, 9]. Subsequently, the 14-3-3 proteins bind with the activated YAP/TAZ, which localizes YAP/TAZ to the cytoplasm, resulting in their degradation through the proteasome system, leading to low nuclear levels of YAP/TAZ and YAP/TAZ transcriptional activity inhibition [10]. Once YAP/TAZ enters the nucleus, it can activate the transcription of several transcription factors. The TEA domain transcription factor (TEAD) family can tightly bind with YAP/TAZ and is the primary transcription factor-mediated by YAP/TAZ. YAP/TAZ direct gene expression programs that promote cell proliferation and survival signals and control cell destiny [11]. Dysregulation of the Hippo signaling pathway induces pro-tumorigenic phenotypes [12, 13]. Substantial upstream factors regulate YAP/TAZ activity, such as those activated by the extracellular matrix (ECM), cell adhesion, mitogens, tyrosine kinase receptors, and alterations in cellular metabolism [14]. However, the mechanisms through which the Hippo signaling pathway is activated remain to be elucidated.
The signal sequence receptor (SSR) is a glycosylated endoplasmic reticulum (ER) membrane receptor that regulates newly translated ribosomal proteins into the ER. SSR is composed of two subunits: SSR1 and SSR2 [15]. It has been reported that SSR2 promotes human melanoma cell survival by responding to endoplasmic reticulum stress [16]. However, the roles and underlying mechanisms of SSR2 in HCC still need to be revised. Here, we studied the role of SSR2 in DDP sensitivity in HCC cells and found that SSR2 reduced DDP sensitivity by activating the Hippo pathway.
The immortalized normal liver cell line THLE-3 (cat: GNHu40) and HCC cell lines Hep3B (Cat: TChu106), HepG2 (Cat: SCSP-510), Huh7 (Cat: SCSP-526), SK-Hep1 (Cat: TCHu109) and SNU-182 (Cat: SCSP-5047) were obtained from the Shanghai Cell Bank of the Chinese Academy of Sciences (Shanghai, China). Huh1 (Cat: CL-0811) was obtained from Procell (Wuhan, Hubei, China). SNU-475 (Cat: ZQ0706) was obtained from Zhong Qiao Xin Zhou Biotechnology (Shanghai, China). All the cell lines were maintained in DMEM supplemented with 10% fetal bovine (Cat: SH30084.03. FBS; Hyclone, Logan, UT, USA), 100 U/mL penicillin, and 100 µg/mL streptomycin (Cat: P4333, Sigma-Aldrich, Saint Louis, MO, USA). These cells were authenticated by short tandem repeat (STR) analysis (Qingke Bio, Guangzhou, China). Mycoplasma testing was performed weekly using Mycolor One-Step Mycoplasma Detector (Cat. D201, Vazyme, Nanjing, China).
All the HCC tissues and adjacent normal tissues obtained from the HCC patients
who were histopathologically and clinically diagnosed in the First Affiliated
Hospital of Gannan Medical University were frozen and stored in liquid nitrogen
until further use. Prior patient consent and approval were obtained from the Research Ethics Committee of the First Affiliated Hospital of Gannan Medical University (ethical approval number:
LLSC-2022051901). The experiments were conducted in accordance with the
Declaration of Helsinki. The patients were selected based on the following
criteria: pathological diagnosis of HCC and primary resection without
pre-operative anticancer treatment. Eight patients were included in the present
research: five were female, and three were male. The mean age of the first
diagnosis was 59 years (52–69 years). All patients were completely resected, and
we collected the resected tissues. Non-cancerous tissues were defined as
The SSR2 overexpression, SSR2 knockdown, and corresponding control plasmids were
designed and synthesized by Guangzhou RiboBio Co., Ltd. (Guangzhou, Guangdong Province, China). For
SSR2 overexpression, the Coding sequence (CDS) of SSR2 was subcloned into the
pLVX-CMV-Puro. The shRNA sequences were cloned into PLKO.1-puro vector. The
target sequences of SSR2 shNRAs were as follows: shSSR2#1:
5
Total protein was extracted using radioimmunoprecipitation assay (RIPA) lysis
buffer (Cat. P0013B, Beyotime, Shanghai, China). Nuclear proteins were isolated
using a Nuclear and Cytoplasmic Protein Extraction kit (Cat. P0028, Beyotime).
Western blotting was carried out according to previously described methods [18].
Briefly, 25 µg protein was separated by 10.5% sodium
dodecyl sulfate polyacrylamide gel electrophoresis (SDS-PAGE) gels and
subsequently transferred onto polyvinylidene Fluorid (PVDF) membranes. Then, the
membranes were incubated with primary antibodies and subsequently horseradish
peroxidase (HRP)-conjugated secondary antibodies (Cat: ab288151 or ab6728; 1:500;
Abcam, Cambridge, UK). The luminescence of Western blotting bands was measured
using an Ultra-sensitive ECL Chemiluminescence kit (Cat: P0018FS, Beyotime);
GAPDH was used as the loading control. The used primary antibodies are as
follows: anti-SSR2: (Cat: AT31G6; 1:400; GeneTex, Irvine, CA, USA); anti-p-YAP
(Ser127); (Cat: 13008; 1:1000; Cell signaling Technology, Danvers, MA,USA);
anti-YAP (Cat: ab205270; 1:1000; Abcam; Cambridge, UK); anti-GAPDH (Cat: ab8245;
1:2000; Abcam; Cambridge, UK); EF-1
The total RNA was isolated by TRIzol (Cat. 15596026, Invitrogen, Carlsbad, CA,
USA). Total complementary DNA (cDNA) was synthesized using Transcriptor First Strand cDNA Synthesis
kit (Cat. 0379012001, Roche, Basel, Germany) according to the manufacturer’s directions.
Quantitative real time polymerase chain reaction (qPCR) was performed on a 7500 Fast Real-time PCR system (Applied Biosystems,
Foster City, CA, USA) using the SYBR Green PCR kit (Cat. 4309155, Invitrogen). The primers used were as follows: SSR2, forward, 5
Colony formation assays were carried out according to previous protocols [19].
Briefly, 0.5
Apoptosis analysis was performed using BD FITC Annexin V Apoptosis Detection Kit
I (Cat. 556547, BD, San Jose, CA, USA) and detected by flow cytometer assay
according to the previously described method [20]. Briefly, 0.5
Mouse xenograft tissues were minced and digested with collagenase (Sigma, Saint Louis, MO, USA) and DNase
(Cat. 18047019, Thermo, Waltham, MA, USA) at 37 °C for 30 min and then
filtered with 40-micron cell strainers (BD, San Jose, CA, USA). Then, the 0.5
Anchorage-independent growth assay was performed according to the previous
protocol [21]. The complete medium containing 1% agar was added to the cell
plate. Subsequently, the mixture containing 0.5
In this study, 4-week-old male BALB/c nude mice were purchased from Vital River
Laboratory Animal Technology Co., Ltd. (Beijing, China) and fed in aseptic
conditions. The mice were randomly divided into five groups (n=5/group). Huh1 cells knockdown with shSSR2#1 group (Huh1/shSSR#1), Huh1 cells knockdown with shSSR2#2 group (Huh1/shSSR#2), negative control group (Huh1/Scramble) and the SSR2 overexpression cells (SNU-182/SSR2), the SSR2 overexpression treated with Peptide17 (Selleck Chemicals, Houston, TX, USA) group (SNU-182/SSR2/Peptide17) or with Vehicle. Four days later, 1
Statistical analyses were carried out using SPSS version 19.0 (IBM Corp.,
Chicago, IL, USA). The data are presented as the mean
We first determined SSR2 expression in HCC tissues. Using data from The Cancer Genome Atlas (TCGA) and Gene expression Omnibus (GEO: GSE14520, https://www.ncbi.nlm.nih.gov/gds), we found that SSR2 was significantly increased in HCC tissues compared with normal liver tissues (Fig. 1A). Subsequently, we validated the SSR2 level in an immortalized normal liver cell line THLE-3 and HCC cell lines Hep3B, HepG2, Huh1, Huh7, SK-Hep1, SNU-182, and SNU-475. The results showed SSR2 was dramatically upregulated in HCC cells compared with immortalized normal liver cells in both mRNA and protein levels (Fig. 1B). As expected, SSR2 expression was markedly enhanced in HCC tissues (T) compared with corresponding adjacent normal tissues (ANT; Fig. 1C). Collectively, these results inferred a substantial increase in SSR2 levels in HCC.
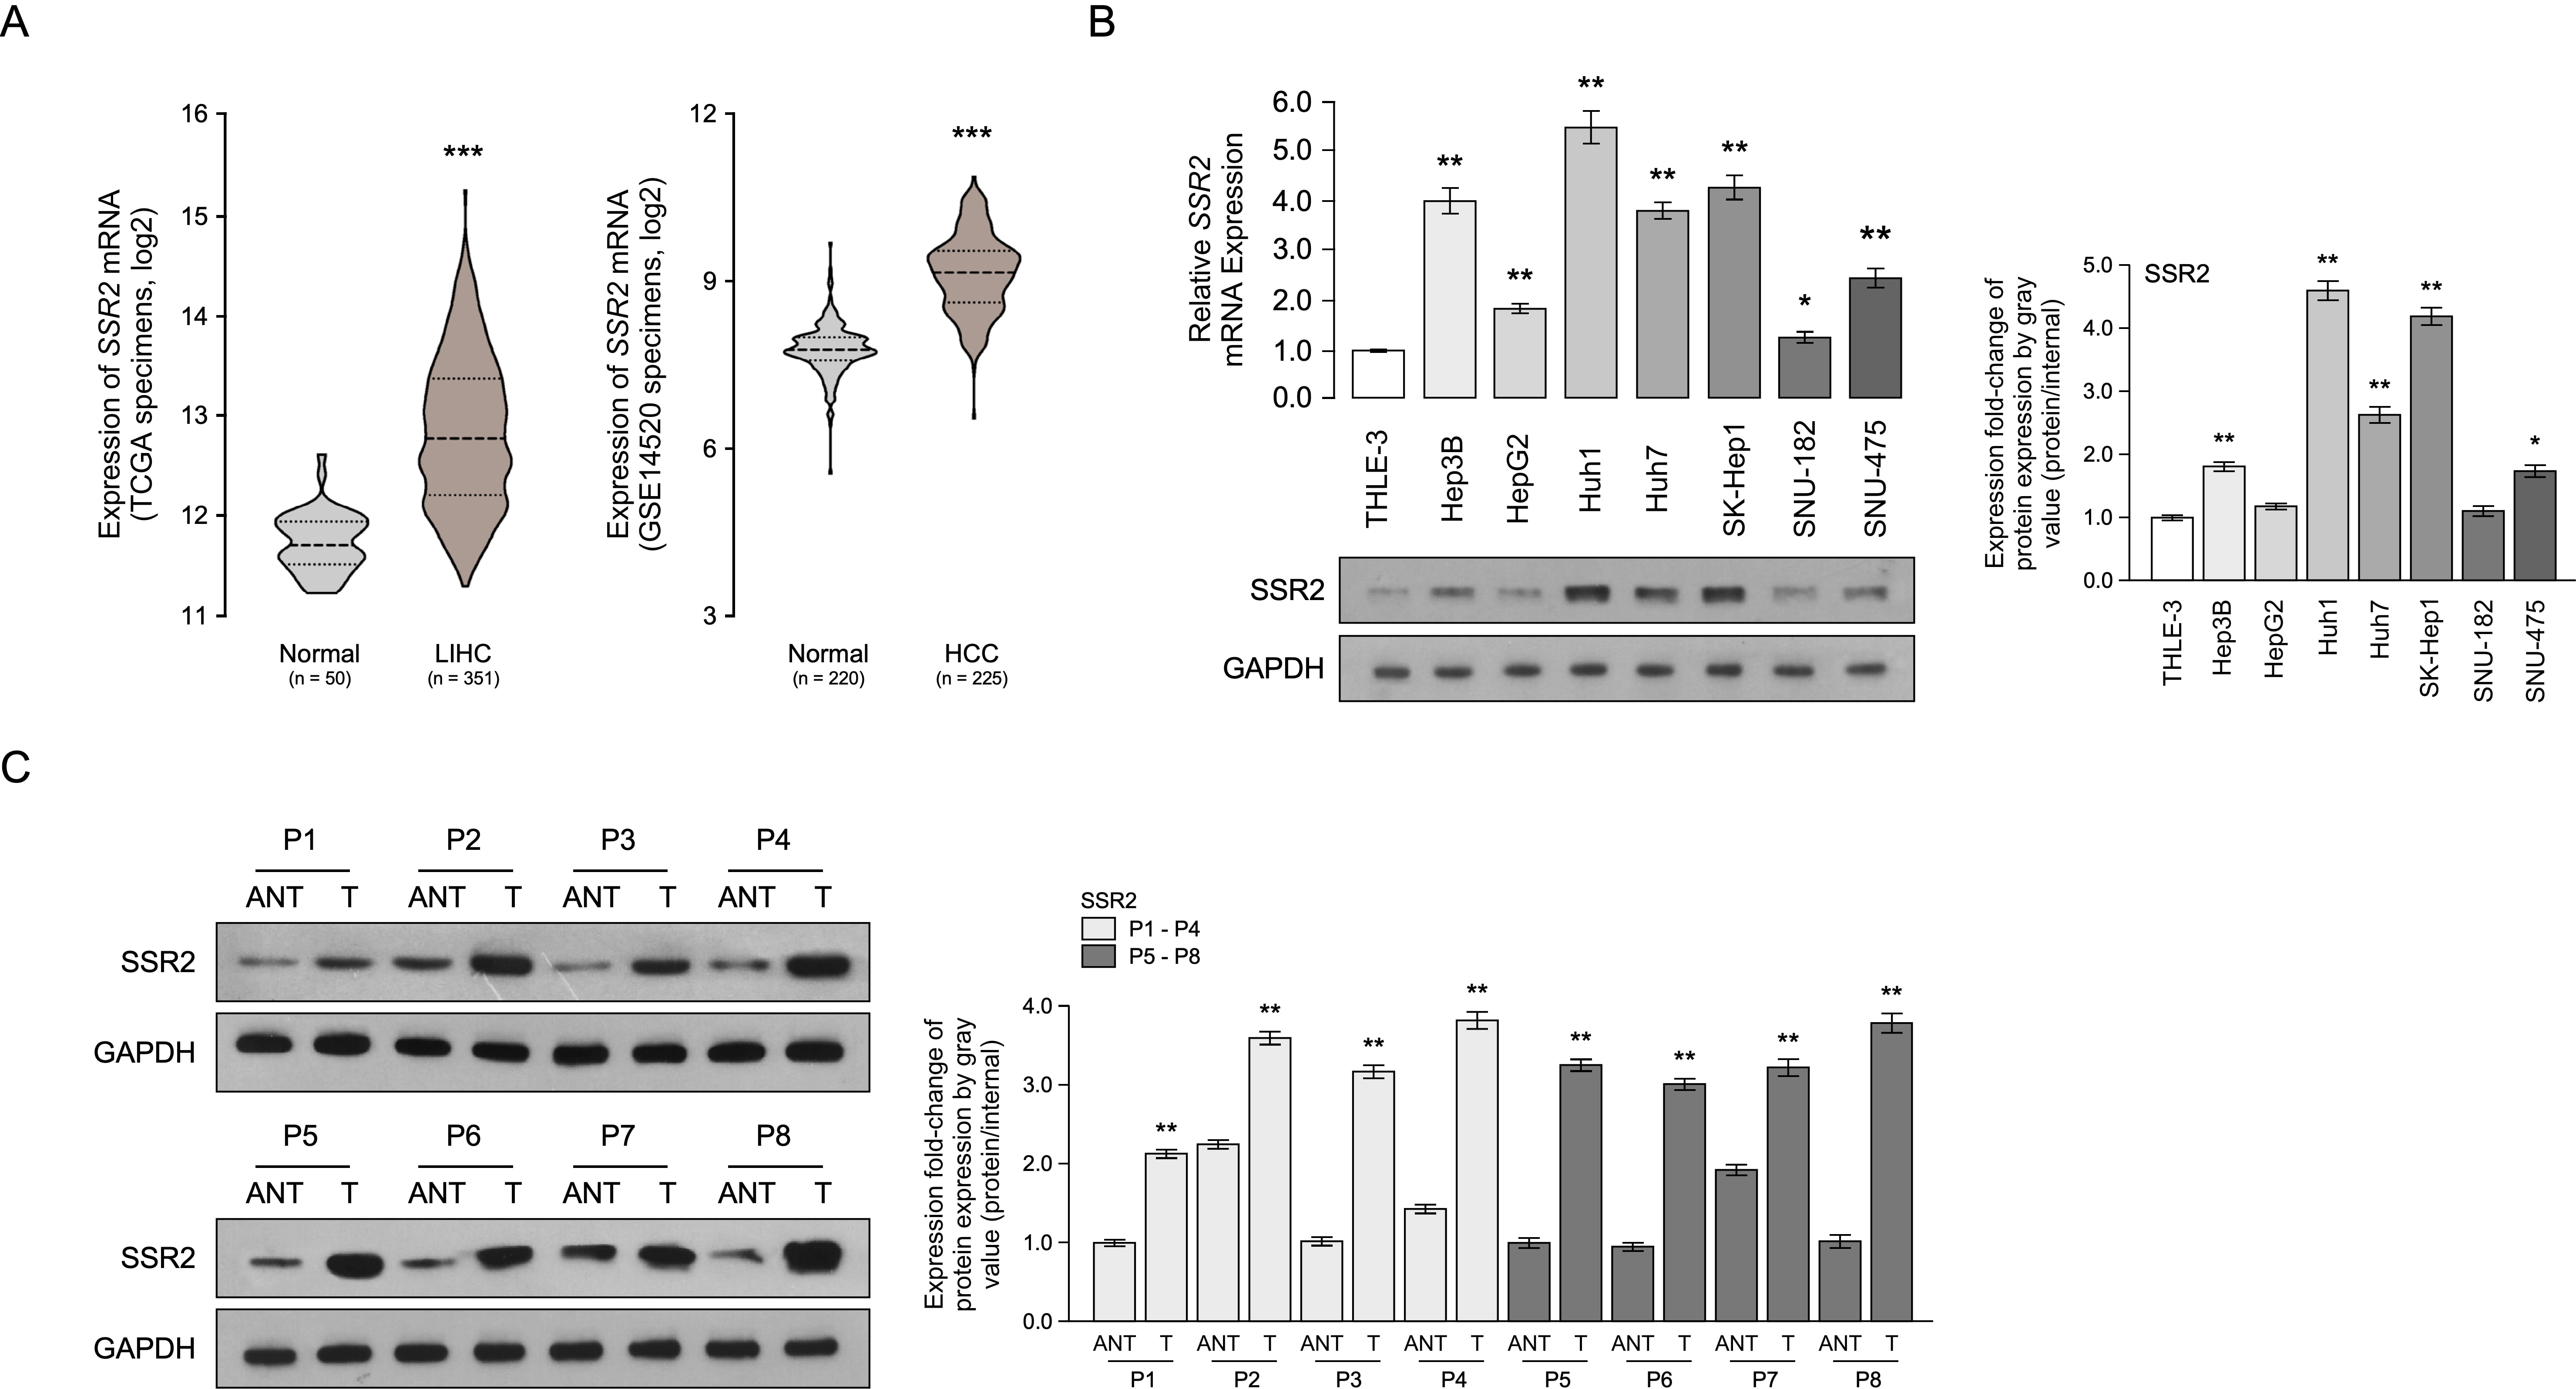 Fig. 1.
Signal sequence receptor subunit (SSR2) is upregulated in HCC
tissues and cells. (A) SSR2 messanger RNA (mRNA) significantly increases in Liver Hepatocellular Carcinoma (LIHC) compared with normal liver tissues using The Cancer Genome Atlas (TCGA)
(left panel) data and Gene expression (GEO) (right panel), *** p
Then, we investigated the correlation between SSR2 level and HCC outcome using the Kaplan–Meier plotter (https://www.kmplot.com). As illustrated in Fig. 2A, patients with higher SSR2 levels had shorter 5-year overall survival, disease-specific survival, relapse-free survival, and progression-free survival. Interestingly, the gene set enrichment analysis (GSEA) assay suggested that high SSR2 was associated with poor survival of HCC patients, while low SSR2 was associated with good survival of HCC patients based on TCGA data (Fig. 2B). Collectively, the analysis indicated that elevated SSR2 was associated with poor survival of HCC patients.
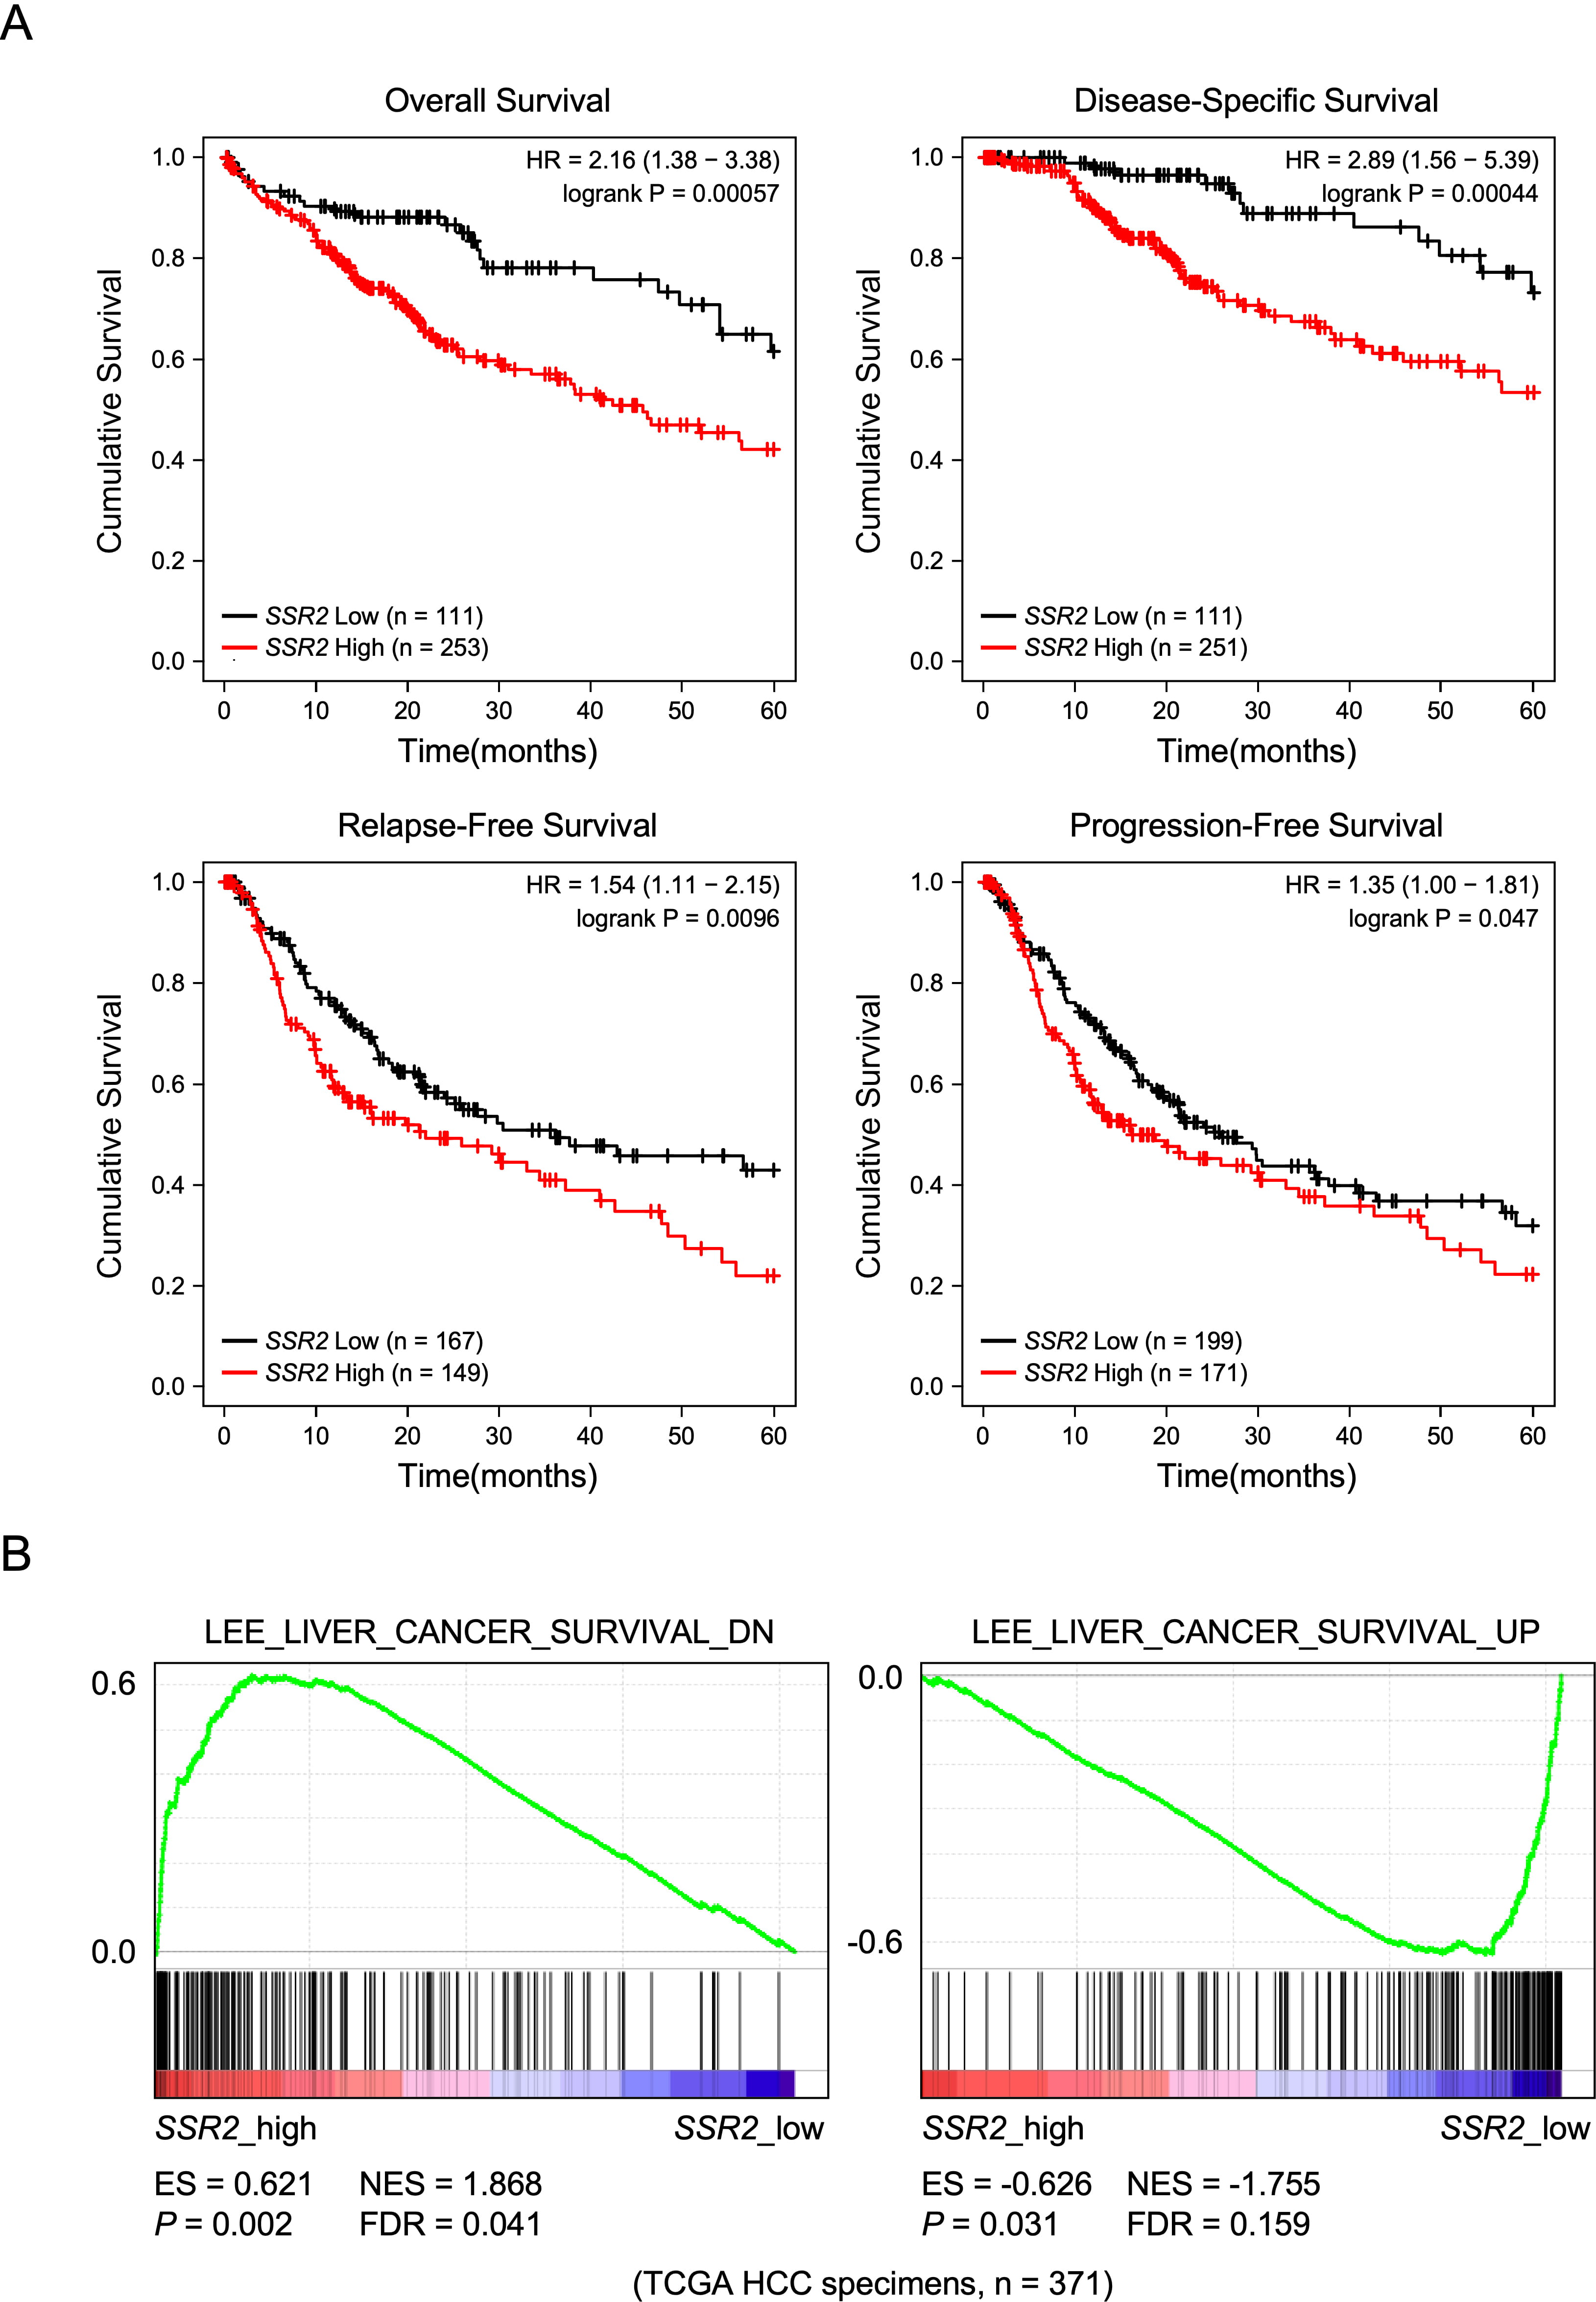 Fig. 2.
SSR2 is negatively correlated with good prognosis of HCC patients. (A) HCC patients with high SSR2 levels have shorter 5-year overall survival, disease-specific survival, relapse-free survival, and progression-free survival using data from the Kaplan–Meier plotter (https://www.kmplot.com). (B) gene set enrichment analysis (GSEA) shows that SSR2 is associated with HCC patients’ survival using the TCGA data. DN, downregulation. UP, upregulation.
To evaluate the SSR2 function in HCC DDP sensitivity, we first established the stable SNU-182 cell lines that overexpressed SSR2 (SNU-182 have a lower SSR2 basal expression level than other cell lines (Fig. 1B)) and inhibited SSR2 using Huh1 cells (which have a higher SSR2 expression than other cell lines (Fig. 1B)). Western blotting assay showed that SSR2 was overexpressed in SSR2-upregulated cells while inhibited in SSR2-downregulated cells (Fig. 3A).
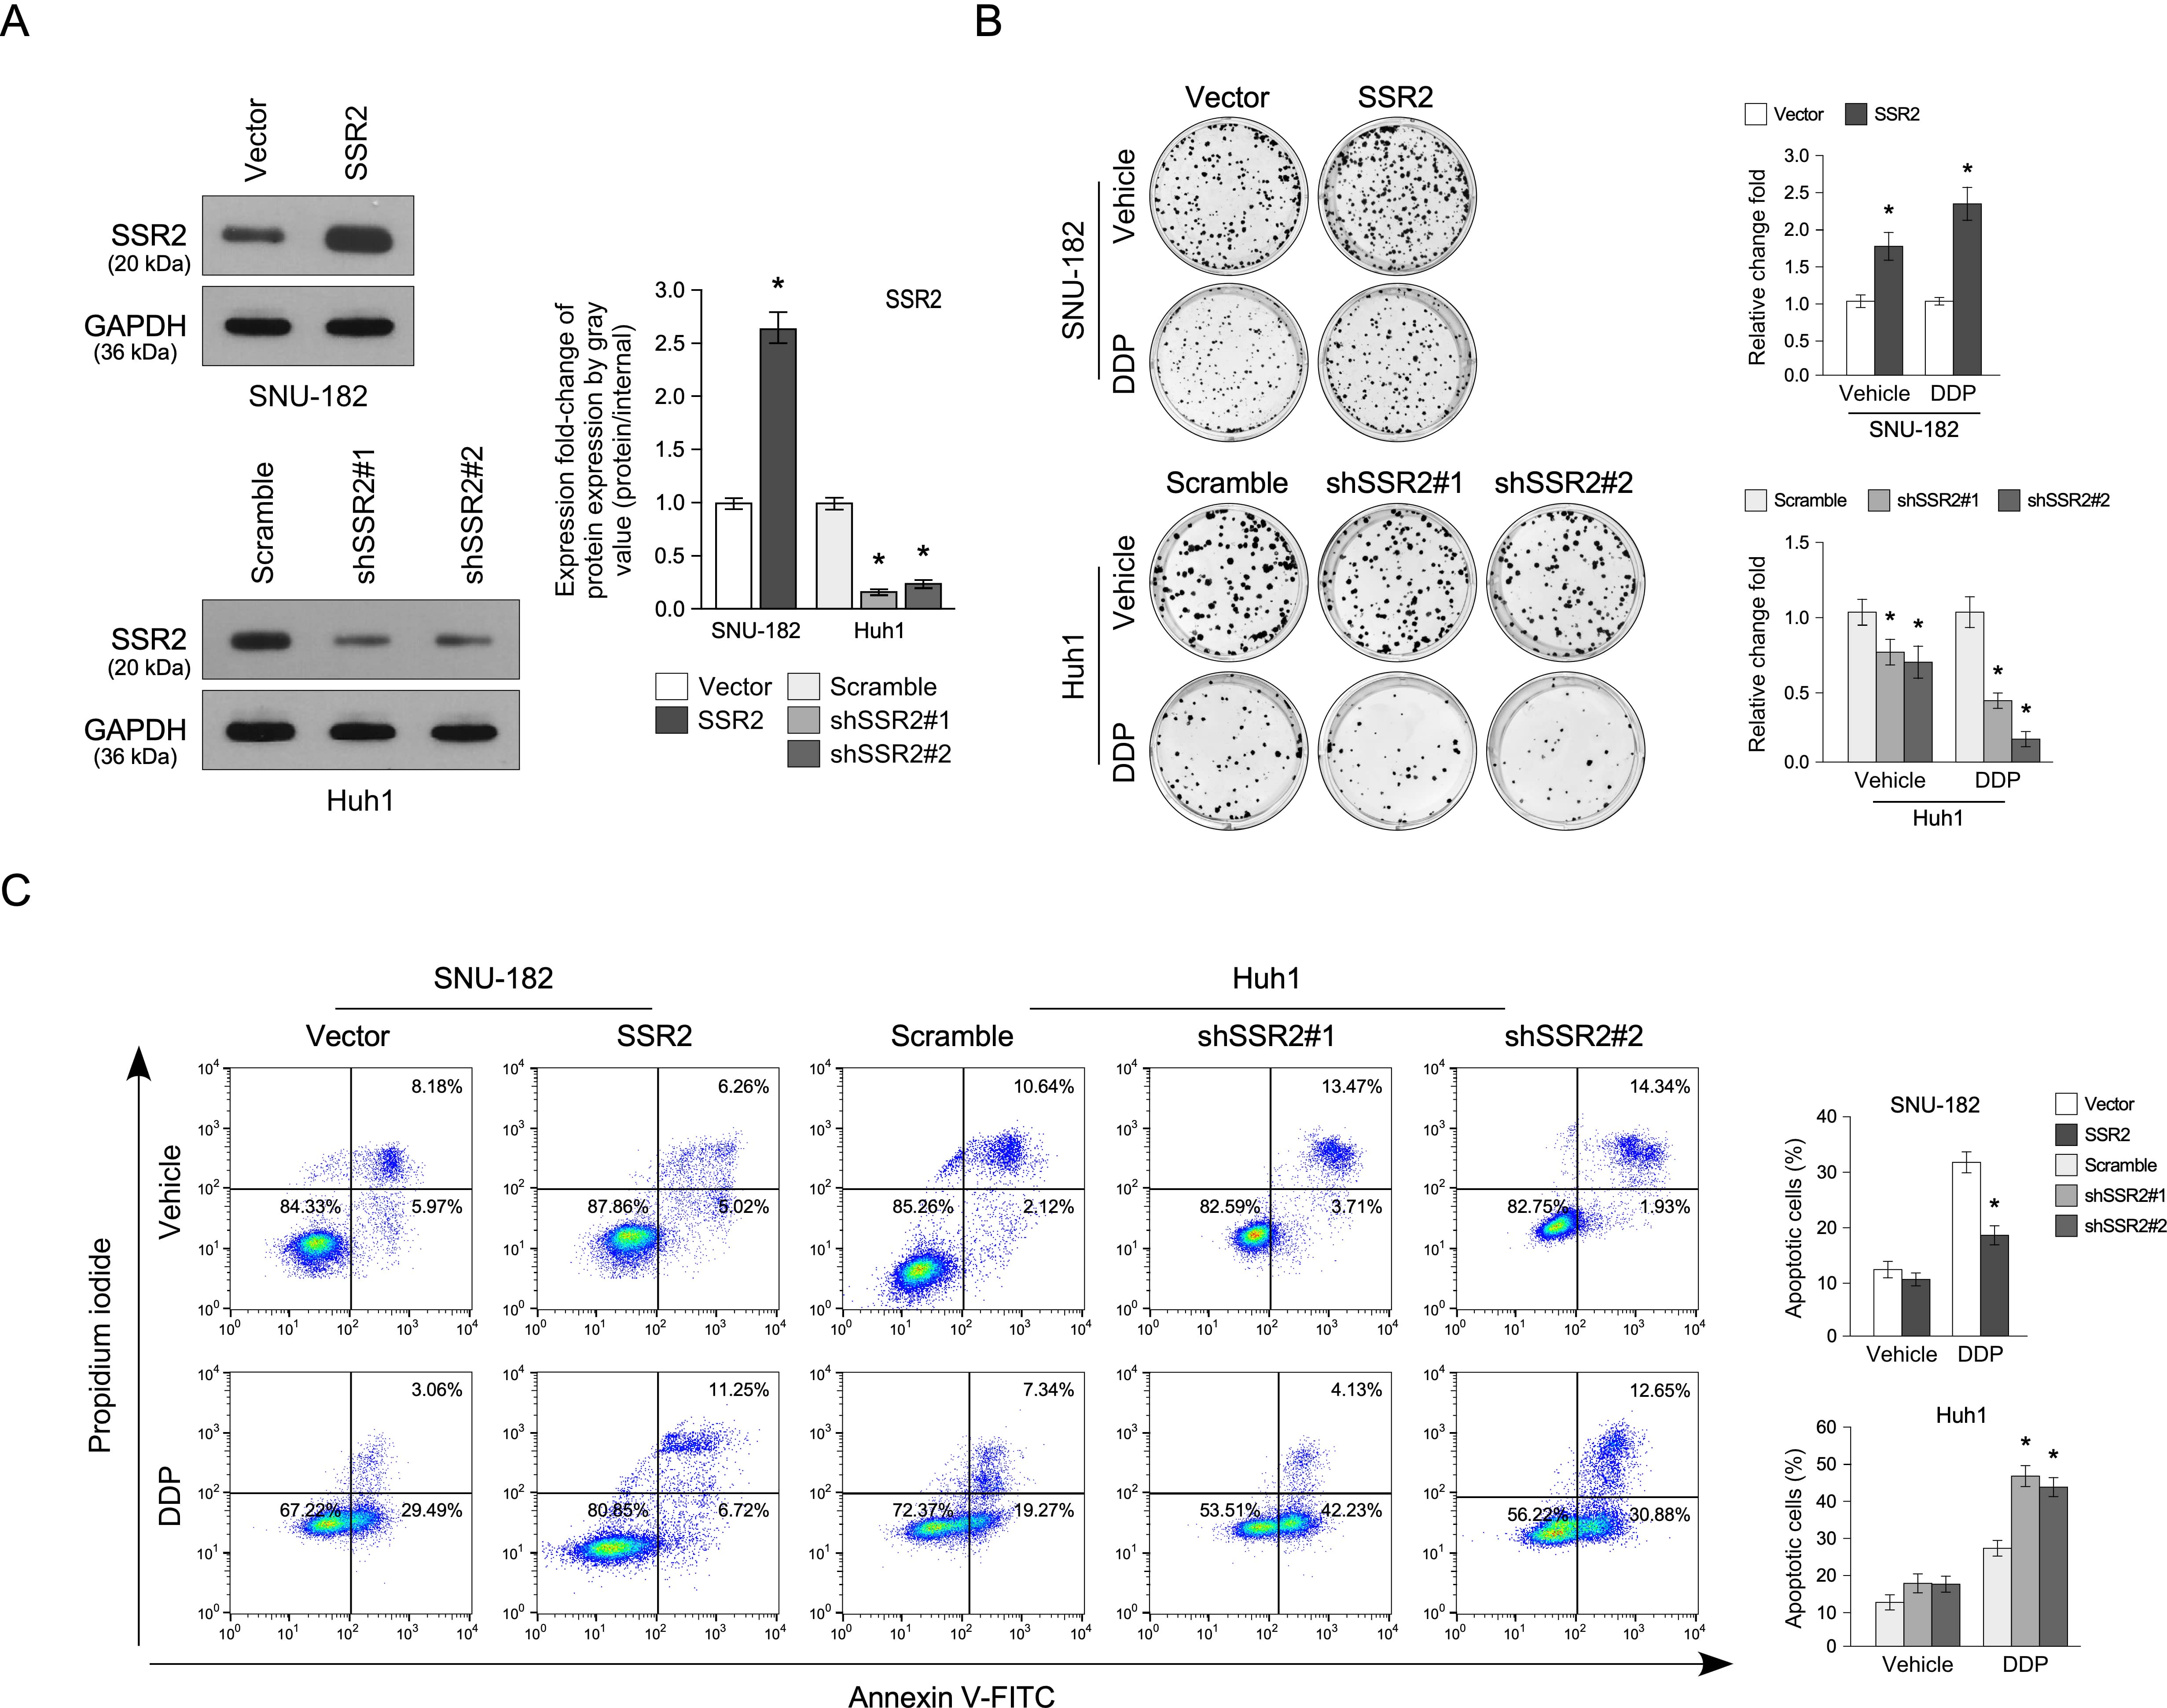 Fig. 3.
Downregulation of SSR2 inhibited HCC cell viability in
vitro. (A) Western blotting assay confirms the expression of SRR2 in
SRR2-overexpressing and -knockdown HCC cells. (B) Colony formation is induced by
SRR2 overexpression or knockdown (n=3). (C) Apoptosis in HCC cells induced by SRR2
noverexpression or knockdown (n=3). Scramble is used as a negative control for SRR2 shRNA. * p
Since SSR2 is correlated with liver cancer survival (Fig. 2B), we first checked the effect of SSR2 on HCC cell viability using a colony formation assay. As shown in Fig. 3B, the colony number and volume formed by SSR2-upregulated cells were significantly elevated compared with the control. Moreover, DDP treatment could further increase this difference. Conversely, the downregulation of SSR2 resulted in the opposite result (Fig. 3B). In addition, the flow cytometry assay showed that SSR2 overexpression inhibited HCC apoptosis compared with control, and SSR2 knockdown showed the opposite results, but only administering drugs made a significant difference and in the untreated cells, there are no effect on the apoptosis rate (Fig. 3C).
Anchorage-independent colony formation assay displayed that in the absence of DDP, the colonies formed by SSR2-knockdown cells are fewer and smaller than those formed by the control. The use of DDP magnifies the difference, reaching levels of significance (Fig. 4A). In addition, to explore the role of SSR2 in the progression of HCC in vivo, the orthotopic animal transplant model was established using Huh1 cells. Our results showed that SSR2 knockdown inhibited HCC tumorigenesis, promoted the percentage of TUNEL+ cells (Fig. 4B), and prolonged the survival time of mice (Fig. 4C) under DDP treatment.
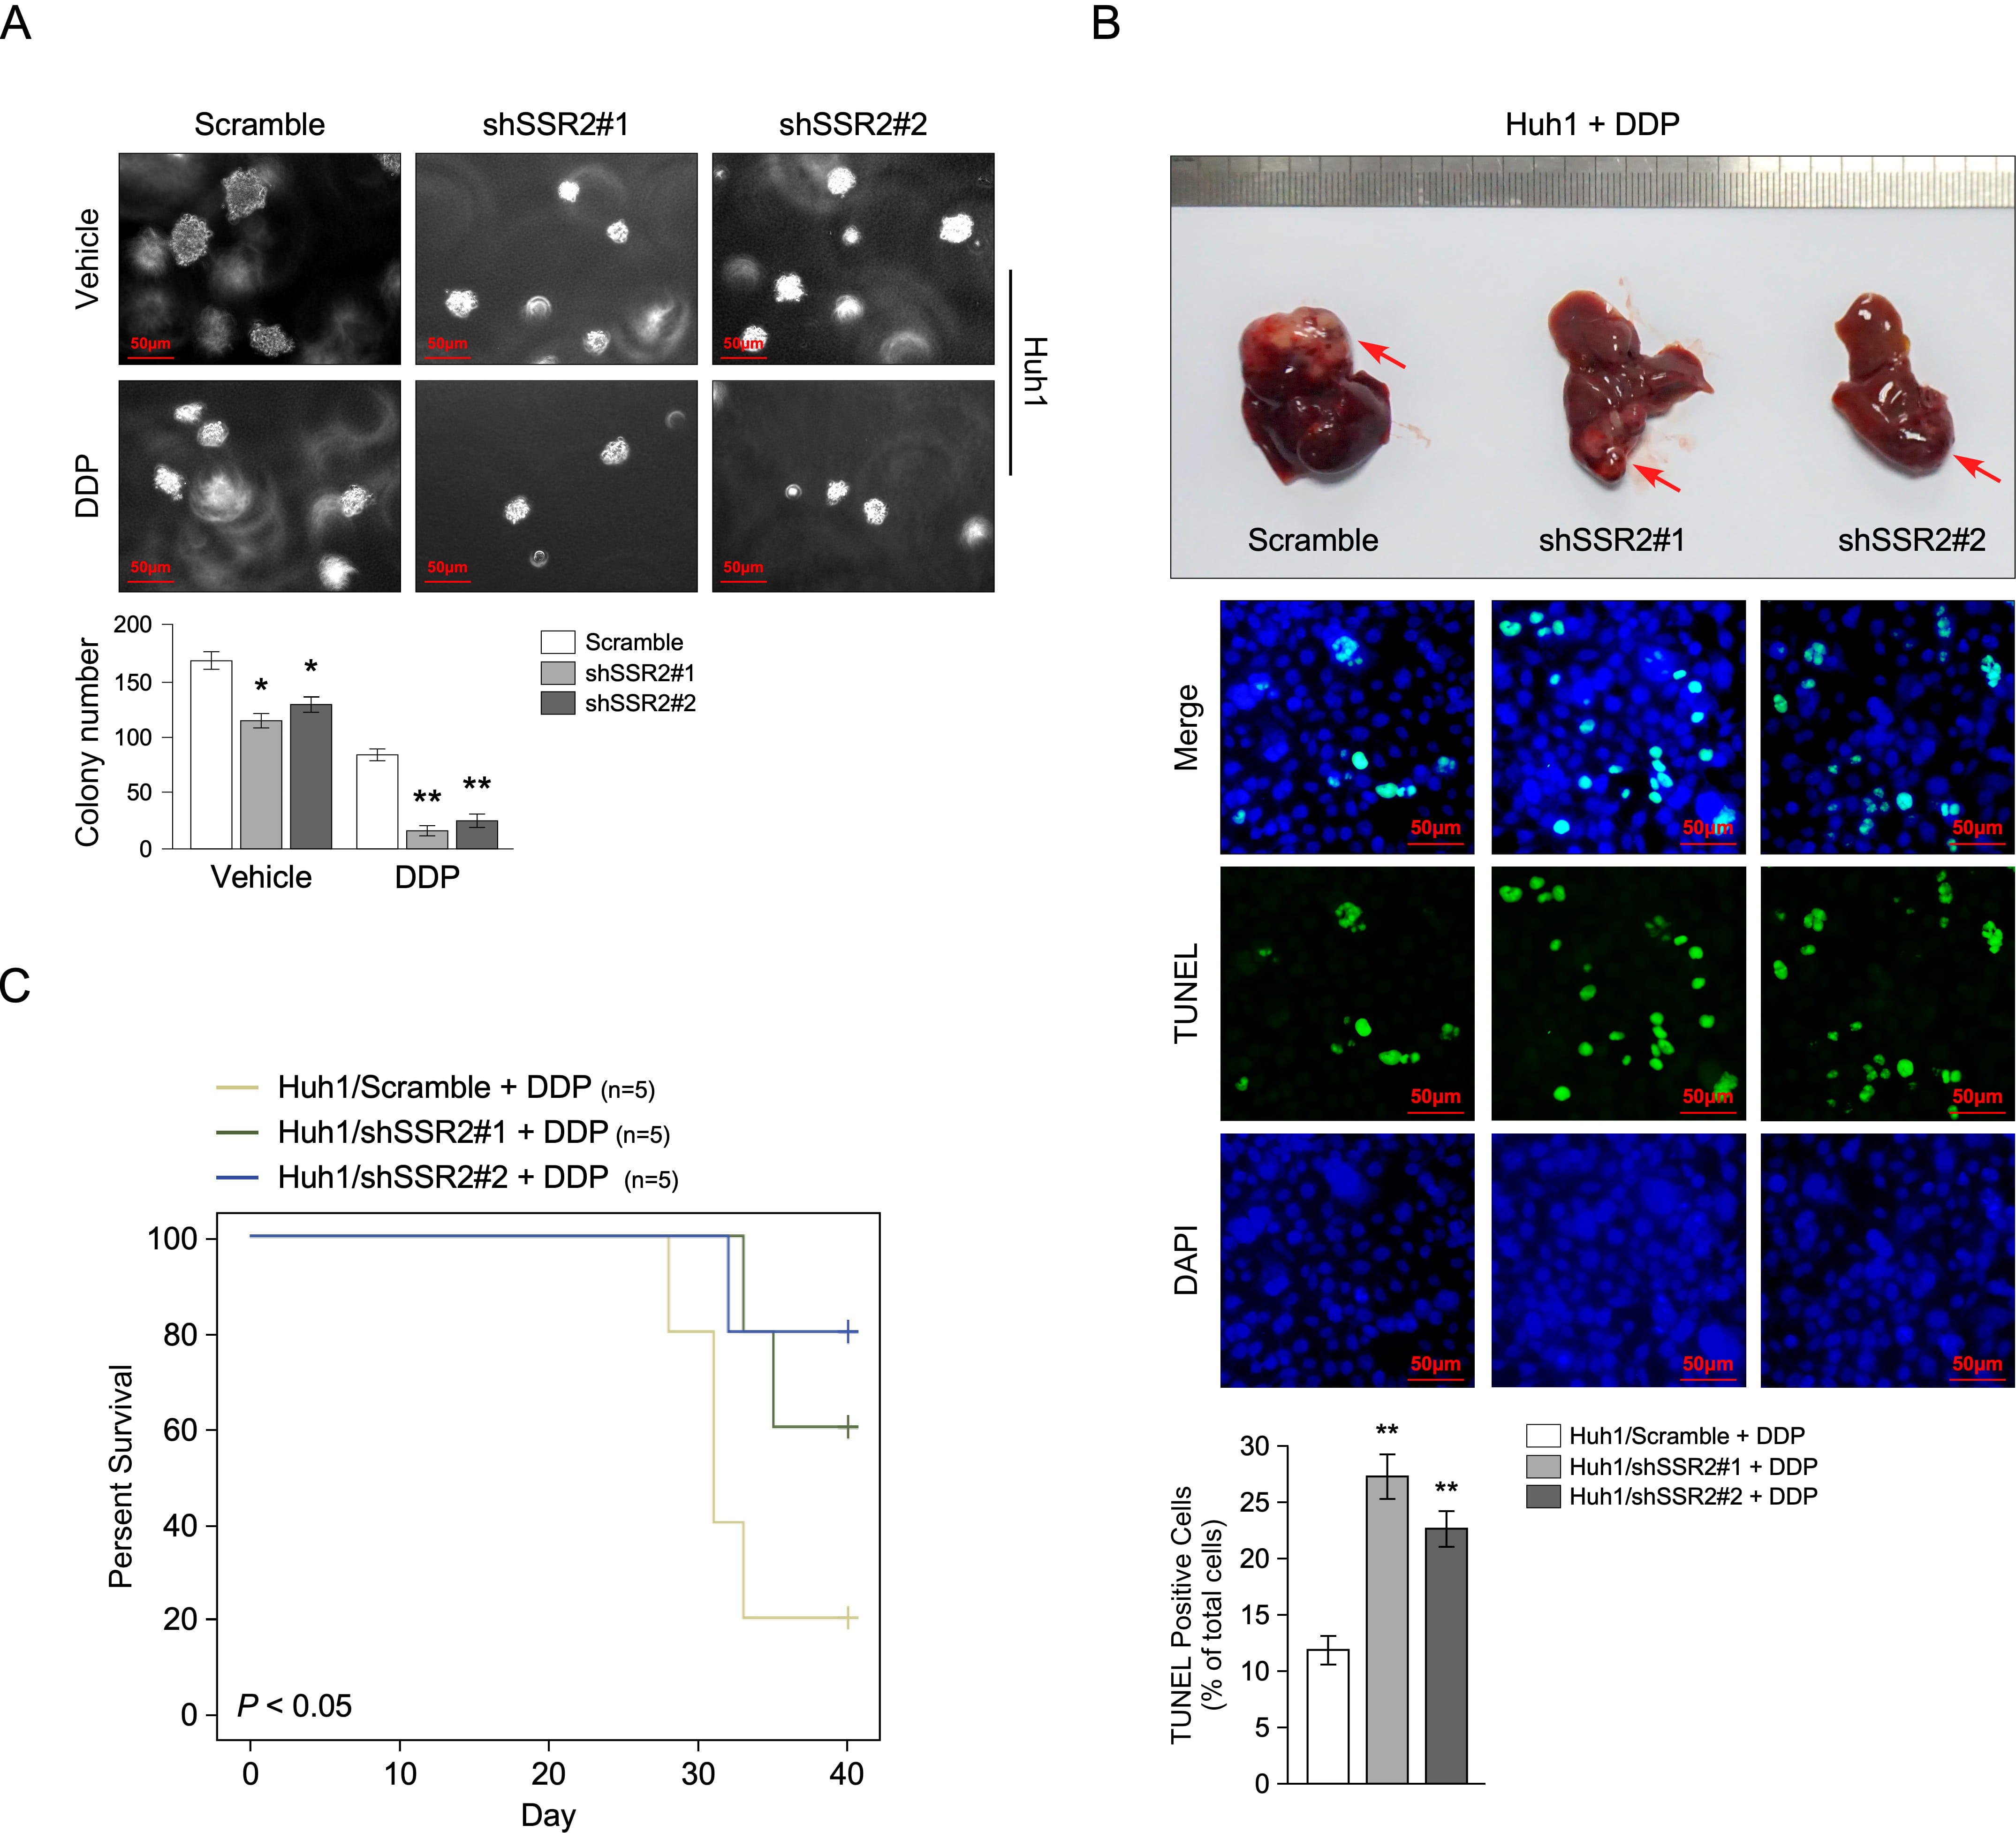 Fig. 4.
SSR2 downregulation increased the HCC sensitivity to Cisplatin
(DDP) in vivo. (A) The HCC colonies in an anchorage-independent colony
formation assay (n=3). (B) The orthotopic animal transplant model illustrates that SSR2
downregulation and DDP treatment inhibited tumorigenesis (upper panel) and
induced apoptosis (lower panel) of HCC. The red arrow indicates the location of the tumor (n=5). (C) Downregulation of SSR2 prolonged the
survival time of mice being treated with DDP. * p
Collectively, these results showed that SSR2 knockdown inhibited the viability and tumorigenesis of HCC cells undergoing DDP treatment, suggesting that the downregulation of SSR2 can enhance HCC cell sensitivity to DDP.
Furthermore, we investigated the mechanisms of SSR2 in HCC. GSEA of the expression in HCC samples from the TCGA showed that SSR2 might be involved in the Hippo signaling pathway (Fig. 5A). We validated the prediction by detecting the transcription activity of TEAD, the main downstream transcription factor in the Hippo pathway. The luciferase reporter assay showed that the upregulation of SSR2 was significantly increased. At the same time, the downregulation of SSR2 inhibited the transcription of TEAD (Fig. 5B). The Western blotting assay revealed that SSR2 overexpression inhibited the phosphorylation of YAP but promoted its nuclear translocation. In contrast, the downregulation of SSR2 showed inverse (Fig. 5C). Moreover, the upregulation of SSR2 promoted the expression of downstream Hippo signaling genes such as CCNE1, DIAPH1, and BCL2L11. However, the downregulation of SSR2 inhibited their expression (Fig. 5D).
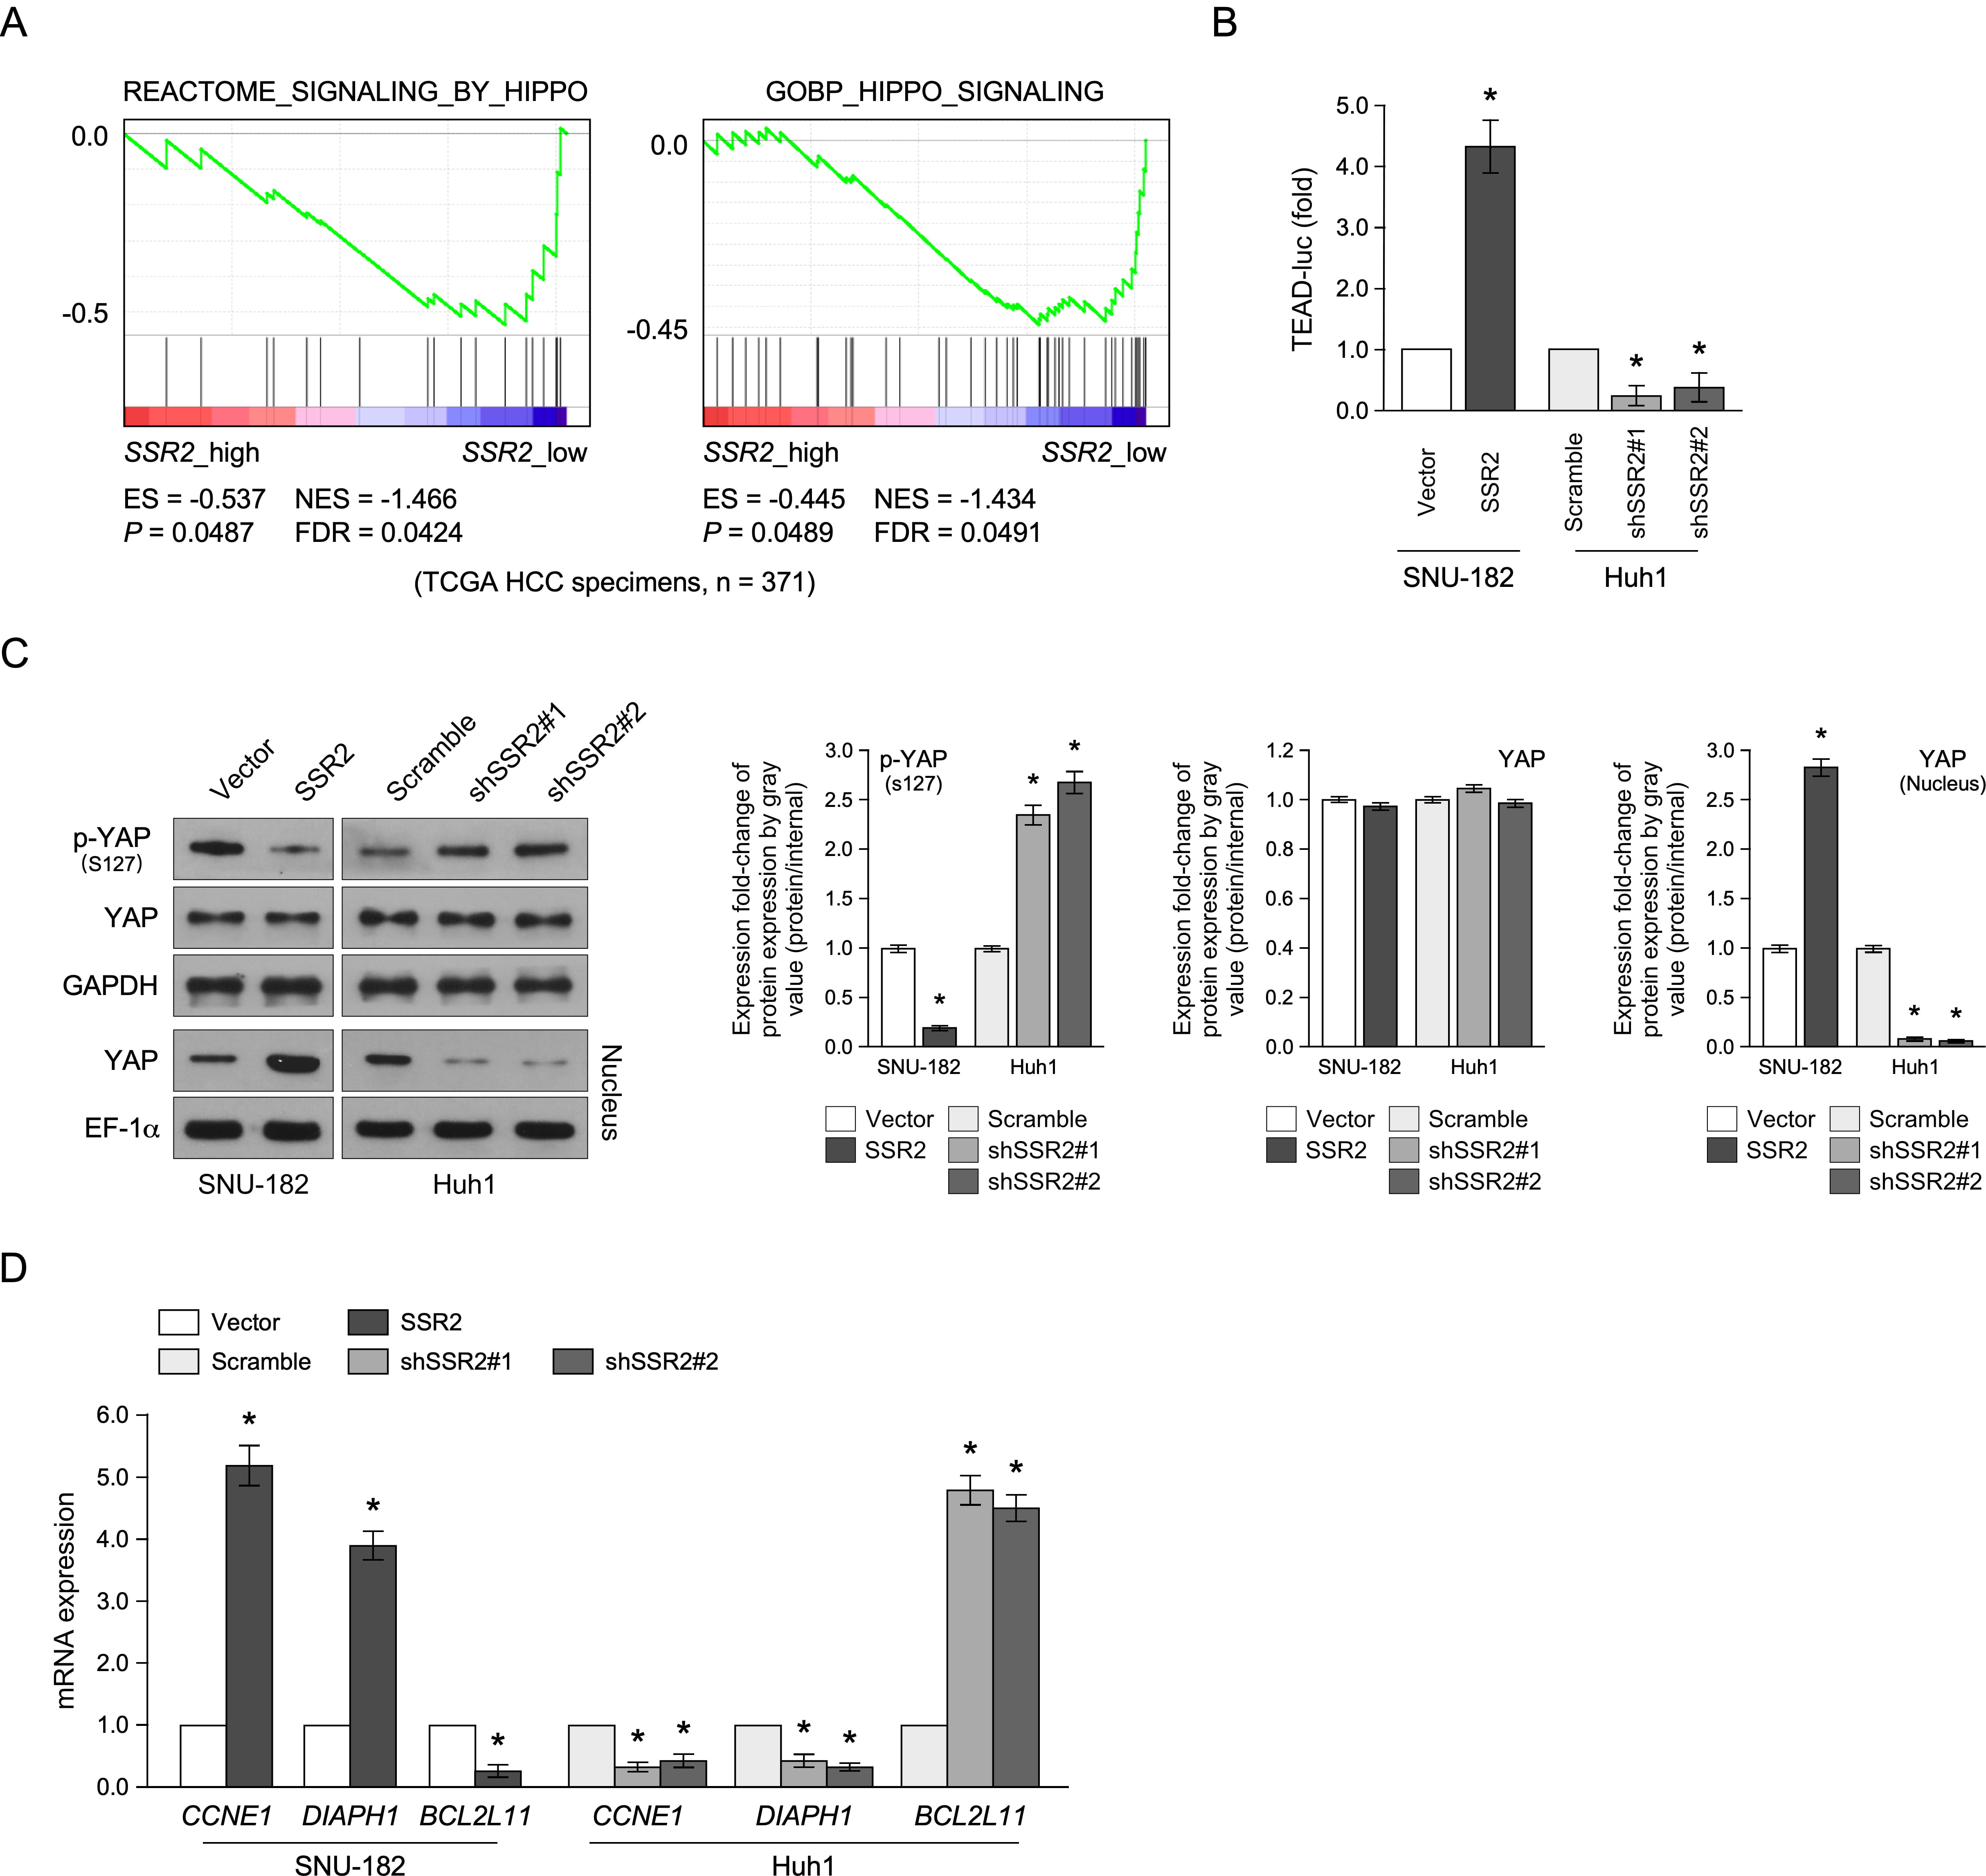 Fig. 5.
SSR2 regulates the Hippo signaling pathway. (A) GSEA for the
correlation between SSR2 and Hippo signaling pathway. (B) The luciferase reporter
assay for the effect of SSR2 on the transcriptional activity of TEA domain transcription factor (TEAD) (n=3). (C) Western
blotting assay for the effect of SSR2 on yes-associated protein (YAP) activity. EF-1α is used as the internal control for nuclear protein (n=3). (D) The effect of SSR2 on
the expression of Hippo signaling downstream genes such as CCNE1, DIAPH1, and BCL2L11. EF-1α is used as the internal control for nuclear protein (n=3). * p
Then, cells expressing upregulated SSR2 were treated using peptide 17, a Hippo signaling inhibitor that interferes with the binding of TEAD to YAP/TAZ. A colony formation assay suggested that pharmacological inhibition of the Hippo pathway significantly blocked the colony number and size of HCC cells, and the presence of DDP amplified the difference (Fig. 6A). Additionally, peptide 17 also inhibited the tumorigenesis of HCC cells in an in vivo animal model (Fig. 6B), suggesting that activation of Hippo signaling is critical for SSR2 to promote tumorigenesis of HCC cells.
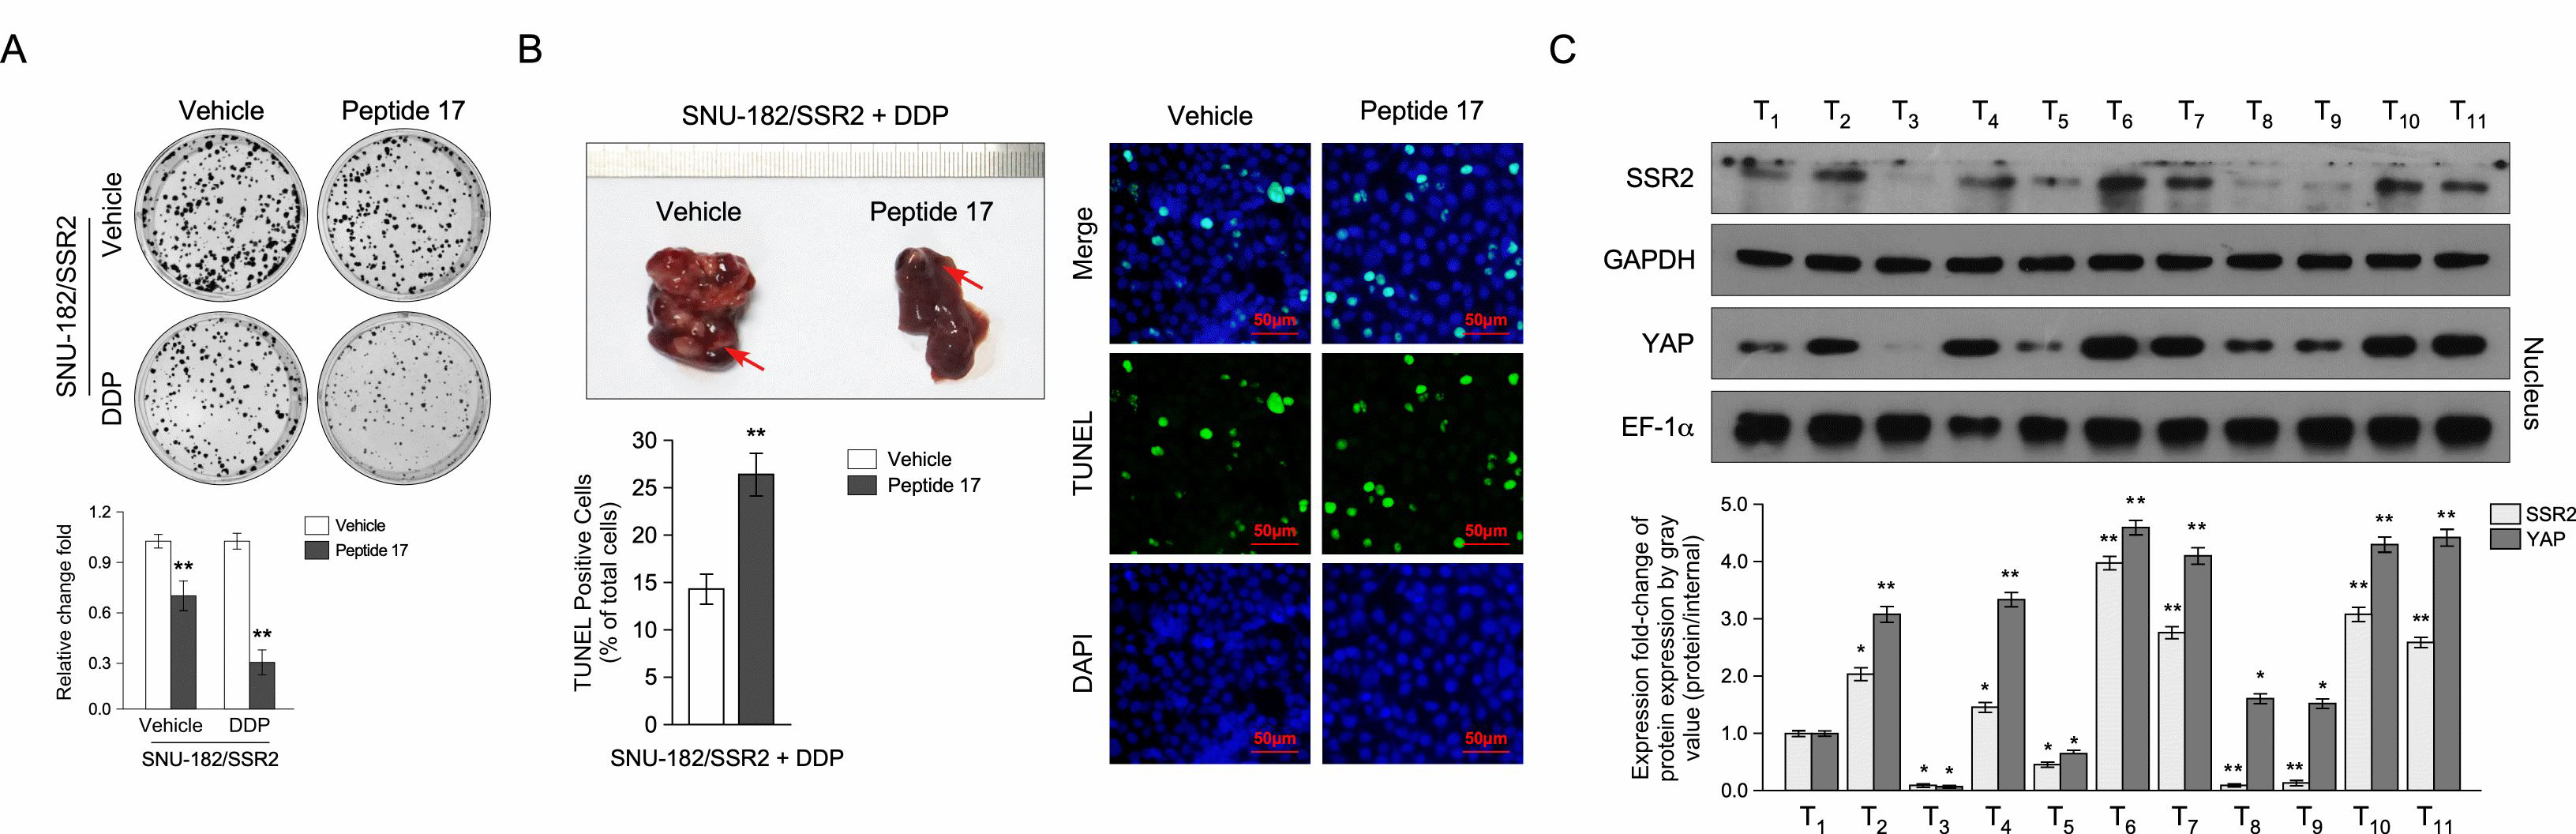 Fig. 6.
Hippo signaling activation is critical for SSR2 to promote
tumorigenesis of HCC cells. (A) Colony formation assay shows that the Hippo
pathway inhibitor, peptide 17, significantly blocks colony formation of HCC cells
with upregulated SSR2 (n=3). (B) The Hippo pathway inhibitor inhibits the tumorigenesis
of HCC cells in vivo. The red arrow indicates the location of the tumor (n=5). (C) Correlation analysis of SSR2 and nuclear YAP
in fresh HCC tissues. T1, HCC tumor sample 1. EF-1α is used as the internal control for nuclear protein. * p
Finally, Western blotting determined the correlation between SRR2 and YAP in fresh 11 HCC tissues. As shown in Fig. 6C, nuclear YAP positively correlates with SSR2 protein levels.
Collectively, our results showed that SSR2 regulates hippocampal signaling, and hippocampal pathway activation is essential for SSR2 to promote cancer progression.
Our present study found that SSR2 was significantly upregulated in HCC and predicted poor prognosis for HCC patients. Further investigation revealed that overexpression of SSR2 promoted cell viability tumorigenesis, while SSR2 knockdown illustrated the reverse results. Mechanically, SSR2 regulated HCC tumorigenesis through Hippo signaling, and pharmacologic inhibition of the Hippo pathway significantly blocked viability and tumorigenesis of HCC cells with upregulated SSR2. In conclusion, our study proved that SSR2 played a key role in HCC tumorigenesis and in predicting the prognosis of patients with HCC. The downregulation of SSR2 can promote DDP sensitivity in HCC cells, suggesting that targeting SSR2 might be a potential target to overcome DDP resistance by HCCs.
HCC is one of the most common clinical malignant cancers, and chemotherapy failure is a principal factor that threatens the survival of patients with HCC [22, 23, 24]. Therefore, exploring the underlying molecular mechanisms of drug resistance in HCC might provide an effective strategy to overcome chemo-resistance and promote improved prognosis of patients. Our results found that SSR2 is significantly overexpressed in HCC. Thus, targeting SSR2 can inhibit the viability and tumorigenesis of HCC cells, suggesting that targeting SSR2 can promote increased sensitivity to DDP.
Mechanically, we found that SSR2 can regulate Hippo signaling. Our results
showed that the downregulation of SSR2 induced the phosphorylation of YAP S127,
which can generate a binding site of 14-3-3 in YAP/TAZ that led to YAP/TAZ
cytoplasmic retention. Accordingly, our results showed that the downregulation of
SSR2 can lead to YAP nuclear aggregation. YAP enhances cell viability by
mediating the activity of several transcription factors, such as TEADs [25]. In
our results, the luciferase reporter assay showed that SSR2 upregulation
significantly promoted TEAD transcription, while downregulation inhibited its
transcription. Moreover, interfering with the binding of TEAD to YAP/TAZ using
the pharmacologic method can block the promoting roles of SSR2 in cell viability
and tumorigenesis. These results confirmed that SSR2 regulated the YAP/TAZ-TEAD
signaling axis, and the activation of the Hippo pathway is essential for SSR2 to
promote tumorigenesis of HCC cells. Multiple direct target genes of YAP/TAC–TEAD
have been identified in mammalian cells, such as CCNE1, CTGF, and CCN1 [26, 27].
The results showed that upregulating SSR2 can promote the transcription of CCNE1,
CTGF, and CCN1 while downregulating SSR2 showed the reverse results. Despite the
main role of TEADs in the YAP/TAZ function, other transcription factors that
contain PPXX motifs have also been confirmed to bind with the WW domains of
YAP/TAZ, including Smad1, RUNX, ErbB4, and p73 for YAP [28, 29, 30, 31], and RUNX,
PPAR
Significantly increased SSR2 expression in HCC cell lines and tissues was confirmed by analyzing several public datasets. High SSR2 expression levels predict poor survival for HCC patients. Upregulation of SSR2 promoted improved cell viability through the Hippo pathway, both in the absence and presence of DDP. Downregulation of SSR2 can promote increased DDP sensitivity by HCC cells, suggesting that targeting the SSR2/Hippo pathway axis might be a potential strategy to overcome DDP resistance in HCC.
SSR2, signal sequence receptor subunit; GSEA, gene set enrichment analysis; TWF1, Twinfilin Actin Binding Protein 1; TCGA, The Cancer Genome Atlas; HCC, hepatocellular carcinoma; GEO, Gene expression.
All data analyzed during this study are included in this published article. And the original datasets are available from the corresponding author upon reasonable request.
RY, BHX and HPL conceived and designed all the experiments. XSZ and YSX established the plasmid, and performed the luciferase assay. And RY, LY and YLG performed the remaining in vitro experiments. CFF and QQL performed the in vivo experiments. HHZ analyzed the data. HPL and BHX wrote and revised the manuscript. All authors contributed to editorial changes in the manuscript. All authors read and approved the final manuscript. All authors have participated sufficiently in the work and agreed to be accountable for all aspects of the work.
The human experiments were conducted in accordance with the Declaration of Helsinki and prior patient consent was obtained. The study was carried out in compliance with the ARRIVE guidelines (https://arriveguidelines.org), and all procedures in animal experiments followed ethical standards. The human and animal experiments involved in this article have been approved by the Ethics Committee of the First Affiliated Hospital of Gannan Medical University (ethical approval number: LLSC-2022051901).
Not applicable.
This work was supported by grants from Natural Science Foundation of China (No.82260466); Clinical Research Program of the East Hospital of the First Affiliated Hospital of Sun Yat-sen University (No.2019003); the Science and technology research project of the Education Department of Jiangxi Province (No.GJJ2201418, No.GJJ2201433, No.GJJ2201419); Natural Science Foundation of Jiangxi Province (20232BAB206088).
The authors declare no conflict of interest.
References
Publisher’s Note: IMR Press stays neutral with regard to jurisdictional claims in published maps and institutional affiliations.