


1 Department of Oncology, The Second Affiliated Hospital of Nanjing Medical University, 210000 Nanjing, Jiangsu, China
2 Department of Respiratory and Critical Care Medicine, Affiliated Hospital 2 of Nantong University, 226001 Nantong, Jiangsu, China
3 Department of Respiratory and Critical Care Medicine, The Second Affiliated Hospital of Nanjing Medical University, 210000 Nanjing, Jiangsu, China
Abstract
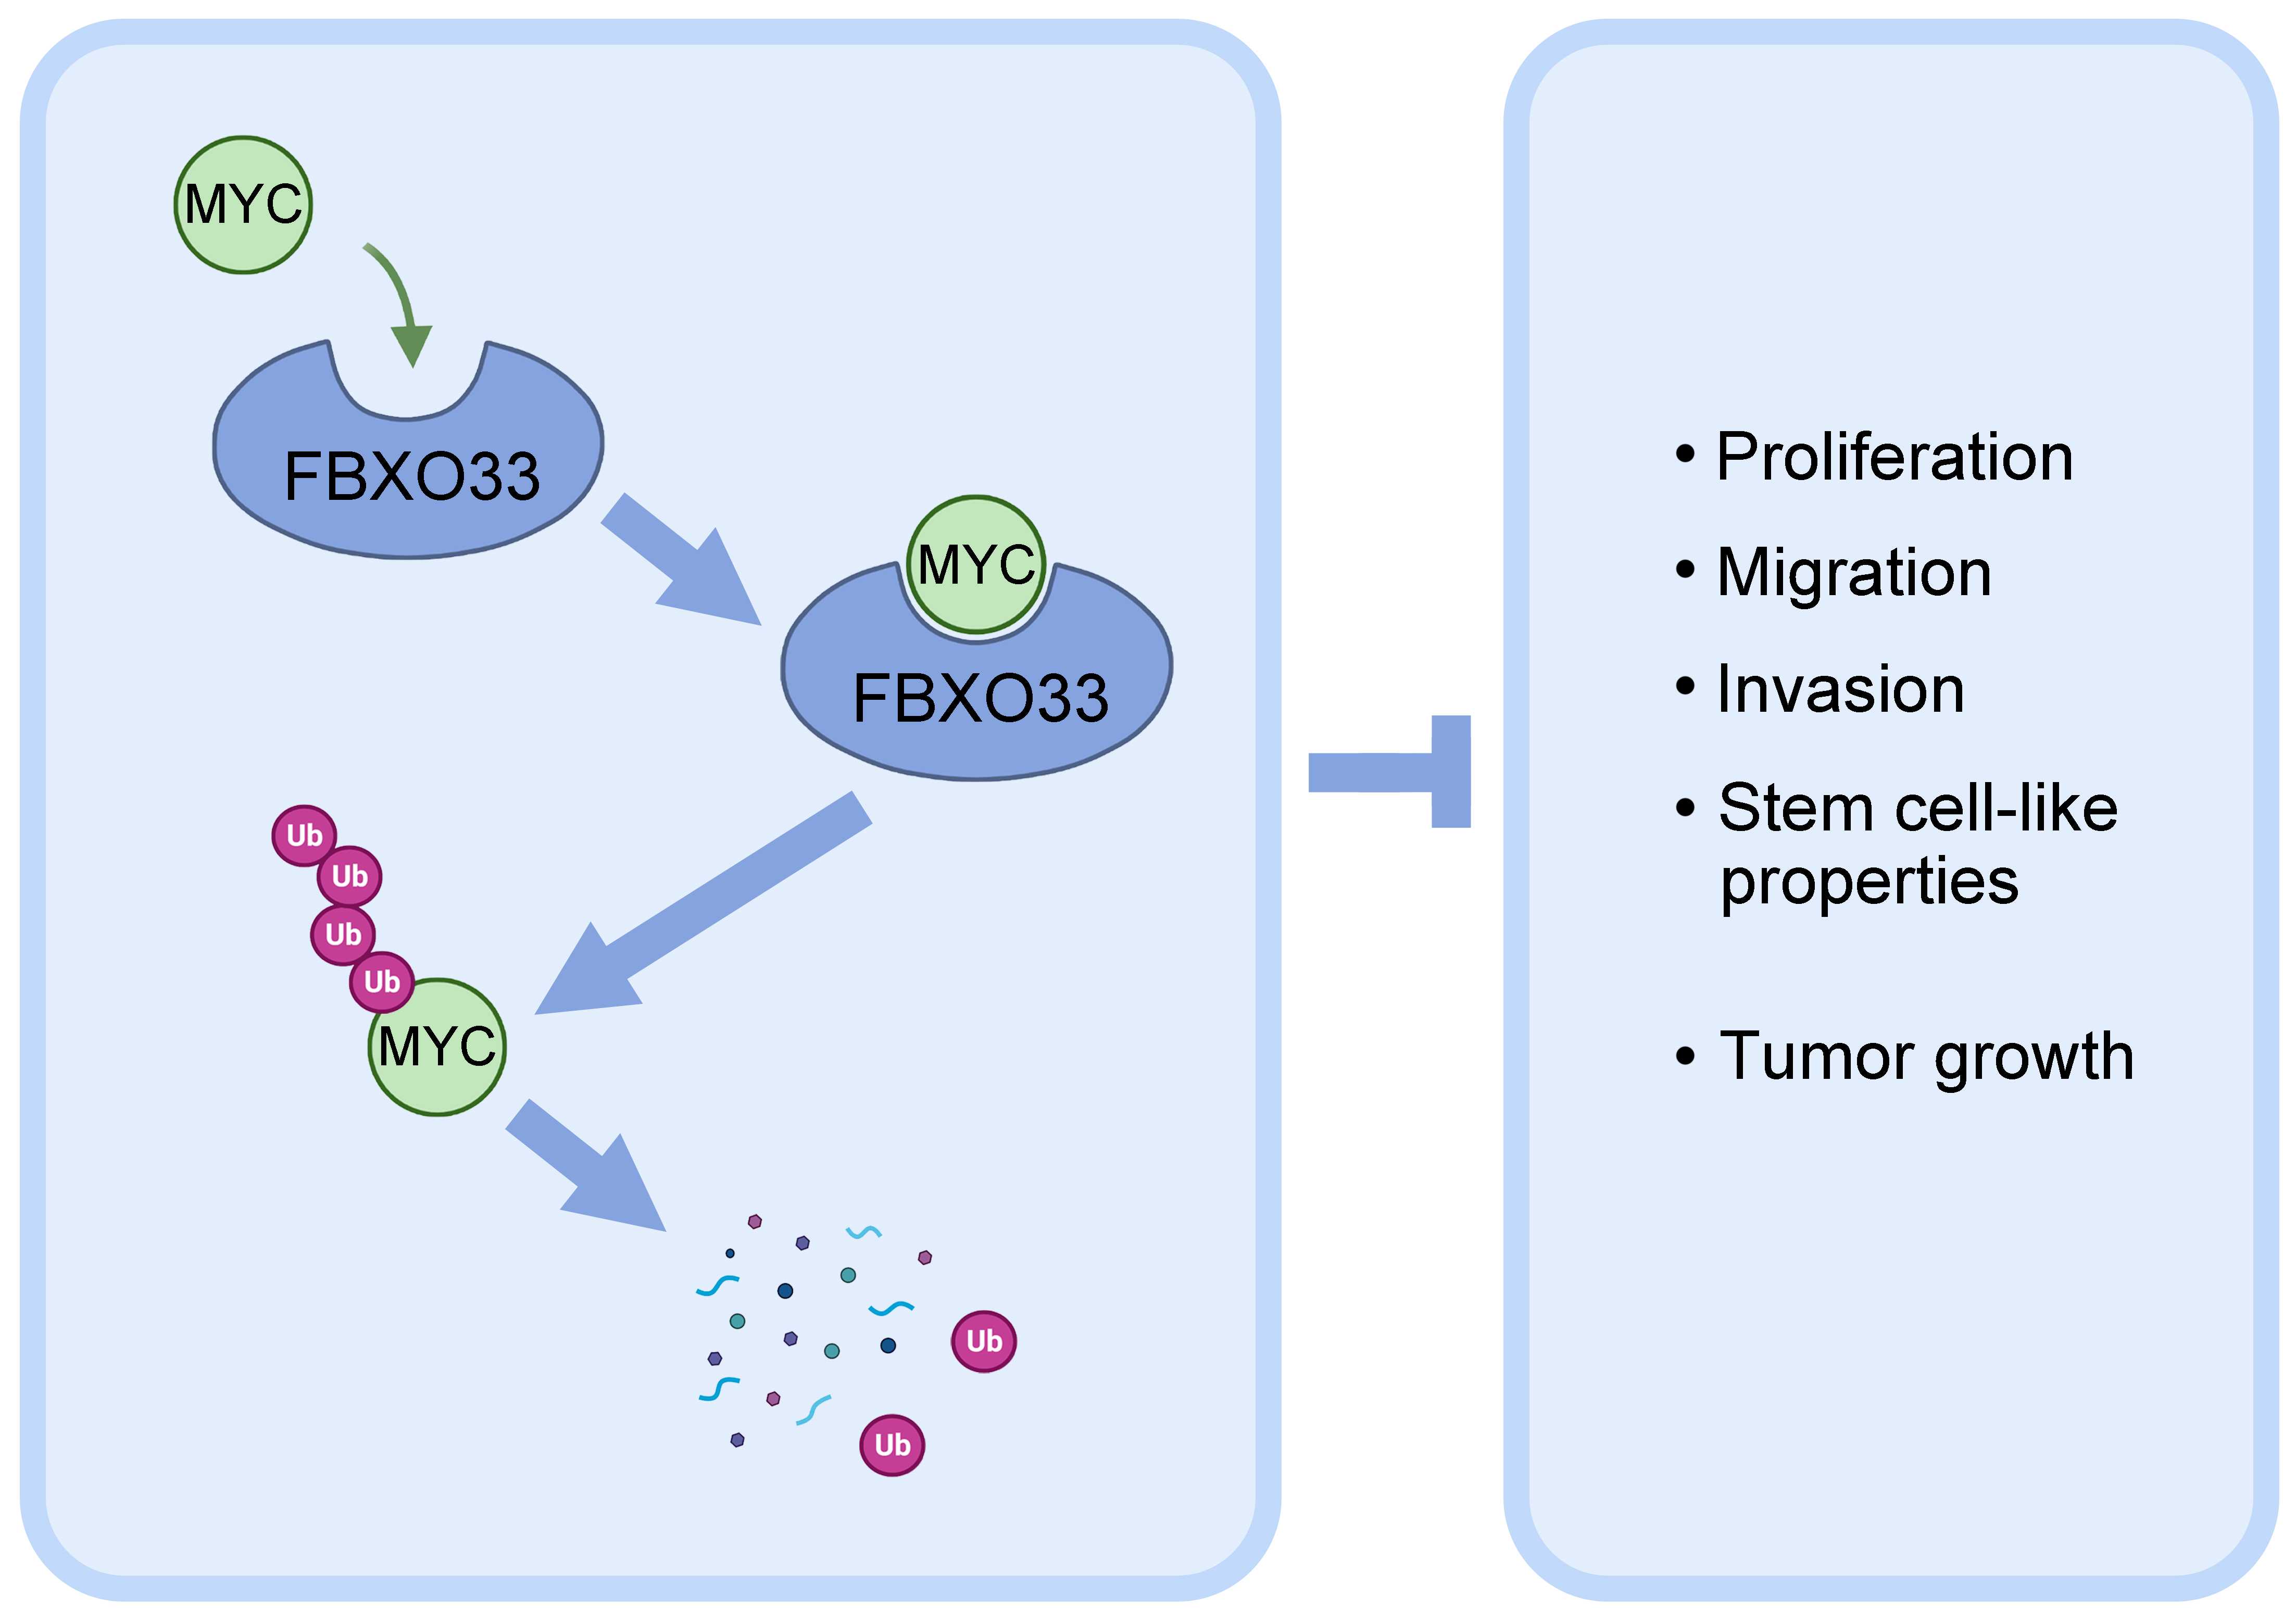
Background: Non-small cell lung cancer (NSCLC) is a malignant form of lung cancer, and its prognosis could be improved by identifying key therapeutic targets. Thus, this study investigates the potential role of F-box Only Protein 33 (FBXO33) in NSCLC. Methods: The expression levels of FBXO33 in NSCLC were determined using University of Alabama at Birmingham Cancer Data Analysis Portal (UALCAN) prediction, and its correlation with overall survival (OS) was analyzed via Kaplan-Meier survival analysis. These results were validated through quantitative polymerase chain reaction (qPCR), western blot (WB), and immunofluorescence (IF). We modulated FBXO33 expression by overexpression or knockdown and analyzed its effects on cell growth, proliferation, migration, invasion, and stemness characteristics in NSCLC cell lines. Additionally, the interaction between FBXO33 and Myelocytomatosis (Myc) and its impact on Myc ubiquitination were examined. An in vivo NSCLC xenograft model was used to corroborate the in vivo experimental results. Results: The study found an inverse correlation between FBXO33 expression in NSCLC and OS. Lower FBXO33 expression enhanced the growth, proliferation, migration, invasion, and stemness characteristics of NSCLC cell lines. FBXO33 interacted with Myc to promote its ubiquitination and subsequent degradation, which suppressed NSCLC development. Conclusion: FBXO33 is expressed at low levels in NSCLC and correlates with lower OS. Overexpression of FBXO33 promotes Myc ubiquitination and degradation and inhibits tumor cell proliferation, migration and stemness characteristics, thereby impeding NSCLC progression.
Graphical Abstract
Keywords
- NSCLC
- FBXO33
- Myc
- stemness
Lung cancer has high morbidity and mortality, and its incidence has increased over the past 50 years [1, 2, 3]. Histopathologically, lung cancer is classified into small cell lung cancer and non-small cell lung cancer (NSCLC), with NSCLC accounting for approximately 80% of cases. Another classification divides lung cancers into NSCLC, squamous cell carcinoma, and large cell lung cancer. Among NSCLC cases, squamous cell carcinoma and adenocarcinoma constitute 80% [4]. The high metastatic potential of lung cancer results in a poor prognosis. NSCLC arises from multiple complex factors, including genetic, molecular, and chromosomal changes [5]. Despite advancements in medicine, the precise mechanisms underlying the occurrence and development of lung cancer remain unclear. Therefore, exploring the pathogenesis of lung cancer, identifying new targets for early diagnosis and treatment, and improving the prognosis of lung cancer are of great significance [6].
Recent studies indicate that the ubiquitin protein post-translational
modification system plays a crucial role in tumors. This modification induces
specific protein degradation, thereby regulating signal transduction, metabolic
regulation, and stemness maintenance. Although the ubiquitination system
contributes to lung cancer development, it is complex and diverse. The
SKP1-CUL1-F-box (SCF) E3 ligase, also known as CRL1, comprises four subunits,
with the F-box protein acting as a substrate acceptor and determining substrate
specificity [7]. There are three subgroups of F-box proteins: FBXW, FBXL, and
FBXO [8]. As E3 ubiquitin ligases, F-box proteins significantly regulate tumors.
For instance, FBXW2 promotes
F-box Only Protein 33 (FBXO33) is a typical member of the F-box protein family with E3 ligase function. Studies have shown that FBXO33 can regulate the ubiquitination and solubility of polyglutamine disease proteins, potentially serving as a target for treating type 3 spinocerebellar ataxia [13]. FBXO33 ligase interferes with YB-1-mediated functions by binding and ubiquitinating the multifunctional regulator Y-box-binding protein 1 (YB-1)/dbpB/p50, leading to proteasomal degradation [14].
Meloclytomatosis (Myc) is a well-known oncogene involved in cell proliferation, growth, and apoptosis, and its regulation is critical in cancer biology [15]. Ubiquitination significantly affects Myc stability and activity [16]. F-box proteins, particularly FBXW7, target Myc for ubiquitination and degradation, thus regulating its oncogenic potential [17]. Dysregulation of Myc ubiquitination can lead to its stabilization and increased oncogenic activity, contributing to tumorigenesis, including lung cancer. However, there are few reports on FBXO33 in lung cancer, and its mechanism remains unclear. The Cancer Genome Atlas Program (TCGA) analysis found that FBXO33 was downregulated in patients with lung adenocarcinoma and squamous cell carcinoma, and its low expression was associated with poor prognosis [18, 19]. In this study, we investigate the potential significance of FBXO33 in NSCLC and its underlying mechanism.
The cells (BEAS-2B, A549, H1299 and PC-9) were cultured in a humidified atmosphere of 95% air and 5% CO2 at 37 °C. For stem cell growth, cells were seeded in ultra-low attachment plates (Costar, Corning, NY, USA) and cultured in serum-free DMEM (Cat. No. 11320033, Gibco, Waltham, MA, USA)/F-12 medium supplemented with 0.4% BSA (Cat. No. 15260037, Gibco, Waltham, MA, USA), 50 µg/mL EGF (Cat. No. P02307, Solaria, Beijing, China), 20 µg/mL bFGF (Cat. No. P00032, Gibco, Beijing, China), 5 µg/mL ITS (Cat. No. YA0811, Gibco, Beijing, China) PREMIX, 2% B-27, 2 µM L-glutamine, and 200 µg/mL penicillin/streptomycin. The medium was changed every 3 days, and spheroid formation was assessed using a microscope on days 0, 7, and 14.
All cell lines used in this study were obtained from National Infrastructure of Cell Line Resource (NICR; Beijing, China) who authenticated the cell lines through Short Tandem Repeat profiling. Mycoplasma tests were routinely performed by the suppliers to ensure the cell lines were free from contamination.
The University of Alabama at Birmingham Cancer Data Analysis Portal (UALCAN) [20] was utilized to analyze the difference in FBXO33 expression levels between tumor and non-tumor tissues. Through the ‘TCGA Analysis’ module of UALCAN, differential expression of FBXO33 mRNA was obtained. UALCAN accesses TCGA level 3 RNA-seq and clinical data from 31 cancer types, offering comprehensive insights into gene expression and survival correlations. The analysis was performed using default settings, comparing normal and tumor tissue samples to identify significant differences in FBXO33 expression.
The Kaplan-Meier (KM) plotter, a bioinformatics tool [21], was employed to evaluate the potential prognostic value of FBXO33 expression in NSCLC patients. The ‘automatic selection of the best cutoff’ model was utilized in this analysis. All possible cutoffs were calculated to determine the best-performing threshold, ensuring the most statistically significant division between high and low FBXO33 expression groups. The KM plotter integrates gene expression data and survival information from various databases, including Gene Expression Omnibus (GEO), European Genome-phenome Archive (EGA), and TCGA, to provide robust survival analysis results.
RNA extraction was performed using the RNA extraction kit (Labled, Beijing,
China), and reverse transcription was conducted using the reverse transcription
kit (Labled, Beijing, China) on the NSCLC tissue samples used in this study were sourced from patients at the Affiliated Hospital 2 of Nantong
University, with all procedures approved by the Ethics Committee (Approval No. 2023KT053), and informed consent was obtained from all participants. RT-qPCR was carried out using SYBR Green Master Mix (Labled,
Beijing, China). The expression of the internal control gene,
FBXO33 shRNA lentiviral particles (Cat. No. sc-92223-V, Santa Cruz, CA, USA), control lentiviral particles (Cat. No. sc-108080, Santa Cruz, CA, USA), and the pGEX vector containing the cDNA sequence of FBXO33 -6P-3 (Cat. No. K240020, Addgene, MA, USA) overexpression vector (sequenced) were used to transfect A549 and H1299 cells. Briefly, according to the manufacturer’s protocol, the cells were seeded onto a 12-well plate and cultured with Opti-MEM (Cat. No. 31985062, Thermo Fisher, MA, USA) for 24 hours until reaching approximately 50% confluence. Then, the complete medium was mixed with polybrene (Cat. No. sc-134220, Santa Cruz, CA, USA) to a final concentration of 5 µg/mL. The original medium was then replaced with 1 mL of the polybrene mixture. After 24 hours, the original medium was replaced with 1 mL of complete medium devoid of polybrene. After overnight incubation, stable clones expressing the shRNA were selected at a 1:4 split cell ratio and incubated for an additional 48 hours. Subsequently, stable clones were screened for 72 hours using puromycin dihydrochloride to assess shRNA efficiency.
The cells were transfected or overexpressed with FBXO33 for 72 hours before
conducting cell viability assays using the cell counting kit-8 (CCK-8) (Cat.No. CA1210, Solarbio, Beijing, China). Briefly,
cells were seeded into 96-well plates at a density of 5
Cell proliferation was assessed using EdU staining. After transfection or FBXO33
overexpression, the cells were seeded into 96-well plates at a density of 5
A transwell system with 8 µm pore size membranes (Costar, Corning, NY,
USA) was utilized. Briefly, the upper chamber was seeded with 6
Tumorspheres were generated by trypsinizing cells using 0.05% trypsin-EDTA and
seeding them into ultra-low attachment plates (Costar, Corning, NY, USA). The
culture medium consisted of 0.4% BSA, 50 µg/mL EGF, 20
µg/mL bFGF, 5 µg/mL ITS PREMIX, 2% B-27, and
serum-free RPMI-1640 medium supplemented with 2
FBXO33 and Myc proteins were extracted using RIPA buffer (Thermo Fisher, Waltham, MA, USA). Protein A/G agarose beads were incubated with anti-FBXO33 (Cat. No. NBP1-91890, 1:50, Novus Biologicals, Co., Centennial, CO, USA), c-Myc (Cat. No. NB600-335, 1–4 µg/mg lysate, Novus Biologicals, Co., USA) or IgG (Cat. No. NBP3-21815, 1:50, Novus Biologicals, Co., USA) antibodies for 30 minutes on a rotating wheel at 4 °C, followed by two washes. The beads were then mixed with the protein lysate and incubated on a rotating wheel overnight at 4 °C. After three washes with extraction buffer, the immunoprecipitates were collected by centrifugation at 3000 g and analyzed by WB. Cell extracts were immunoprecipitated with the specified antibodies for 4 hours at 4 °C to determine ubiquitination levels. The immune complexes were washed four times with RIPA buffer and then separated by WB for analysis.
The cells were fixed with 4% paraformaldehyde for 15 minutes at 37 °C, followed by permeabilization with 0.2% Triton X-100 (Cat. No. T8787, Sigma-Aldrich, Waltham, MA, USA) at room temperature for 15 minutes. After blocking with 5% BSA (Cat. No. 15260037, Gibco, Waltham, MA, USA) for 1 hour, cells were incubated with primary antibodies against FBXO33 (Cat. No. NBP1-91890, 0.25–2 µg/mL, Novus Biologicals, Co., USA) and c-Myc (Cat. No. NB600-335, 1:100, Novus Biologicals, Co., USA) at 4 °C overnight. The following day, the cells were incubated with fluorescently labeled secondary antibodies for 1 hour at room temperature.
For colocalization analysis, the cells were mounted with a DAPI-containing mounting medium and examined under an Olympus FV1000 (Hamburg, Germany) laser scanning confocal microscope. Images were captured at higher magnification to clearly demonstrate the colocalization of FBXO33 and Myc. The intensity profiles of both proteins were analyzed to confirm their colocalization within the cells.
Transfected cells were treated with CHX at a final concentration of 50 µg/mL to inhibit protein synthesis. After CHX treatment, cells were harvested at various time points (0, 1, and 2 hours). Protein extraction was performed using RIPA buffer supplemented with protease inhibitors and deubiquitination inhibitors. The samples were then subjected to WB analysis to detect Myc protein levels. The degradation rate of Myc was calculated by comparing the protein levels at different time points.
An animal model was established to assess the effect of FBXO33. Briefly, 12
BALB/c nude mice (female, 6–8 weeks old, weighing 18–22 g) were obtained from
the Laboratory Animal Center of Nantong University and divided into two groups: a
control group and an FBXO33 overexpression group, each containing 6 mice. The
FBXO33 overexpression group received intratumoral injections of 50 µL
adenovirus expressing FBXO33 (1
NSCLC tissues or cells were lysed using RIPA buffer, and protein quantification
was conducted with the BCA protein assay kit (PC0020, Solarbio, China).
Subsequently, equal amounts (30 µg) of proteins were subjected to sodium
dodecyl sulfate-polyacrylamide gel electrophoresis (SDS-PAGE) and transferred
onto a PVDF membrane. The membranes were incubated separately with specific
primary antibodies, including FBXO33 (Cat. No. NBP1-91890, 1:20, Novus
Biologicals, Co., USA), CD133 (Cat. No. NB120-16518, 1:1000, Novus Biologicals,
Co., USA), ALDH1A1 (Cat. No. NBP2-15339, 1:1000, Novus Biologicals, Co., USA),
OCT4 (Cat. No. NB100-2379, 1:500, Novus Biologicals, Co., USA), SOX2 (Cat. No.
NB110-37235, 1:2000, Novus Biologicals, Co., USA), Myc (Cat. No. NB600-335,
1:1000, Novus Biologicals, Co., USA), and
Data analyses were conducted using SPSS 22.0 (IBM Corp., Chicago, IL, USA). Prior to
comparisons, normality and variance homogeneity tests were conducted. If the data
met the criteria of normality and homogeneity of variances, t-tests or
one-way ANOVA were applied. Conversely, if the data did not meet these criteria,
the Wilcoxon signed-rank test was utilized. A significance level of p
The analysis conducted using UALCAN comprised 59 normal lung tissues and 515 primary Lung Adenocarcinoma (LUAD) tissues, as well as 52 normal lung tissues and 503 primary Lung Squamous Cell Carcinoma (LUSC) tissues. The findings revealed a significant reduction in the expression level of FBXO33 in primary tumors (LUAD/LUSC) compared to normal tissues (Fig. 1A,B). Subsequent survival analysis indicated a correlation between low FBXO3 expression and poor overall survival (OS) in NSCLC (Fig. 1C).
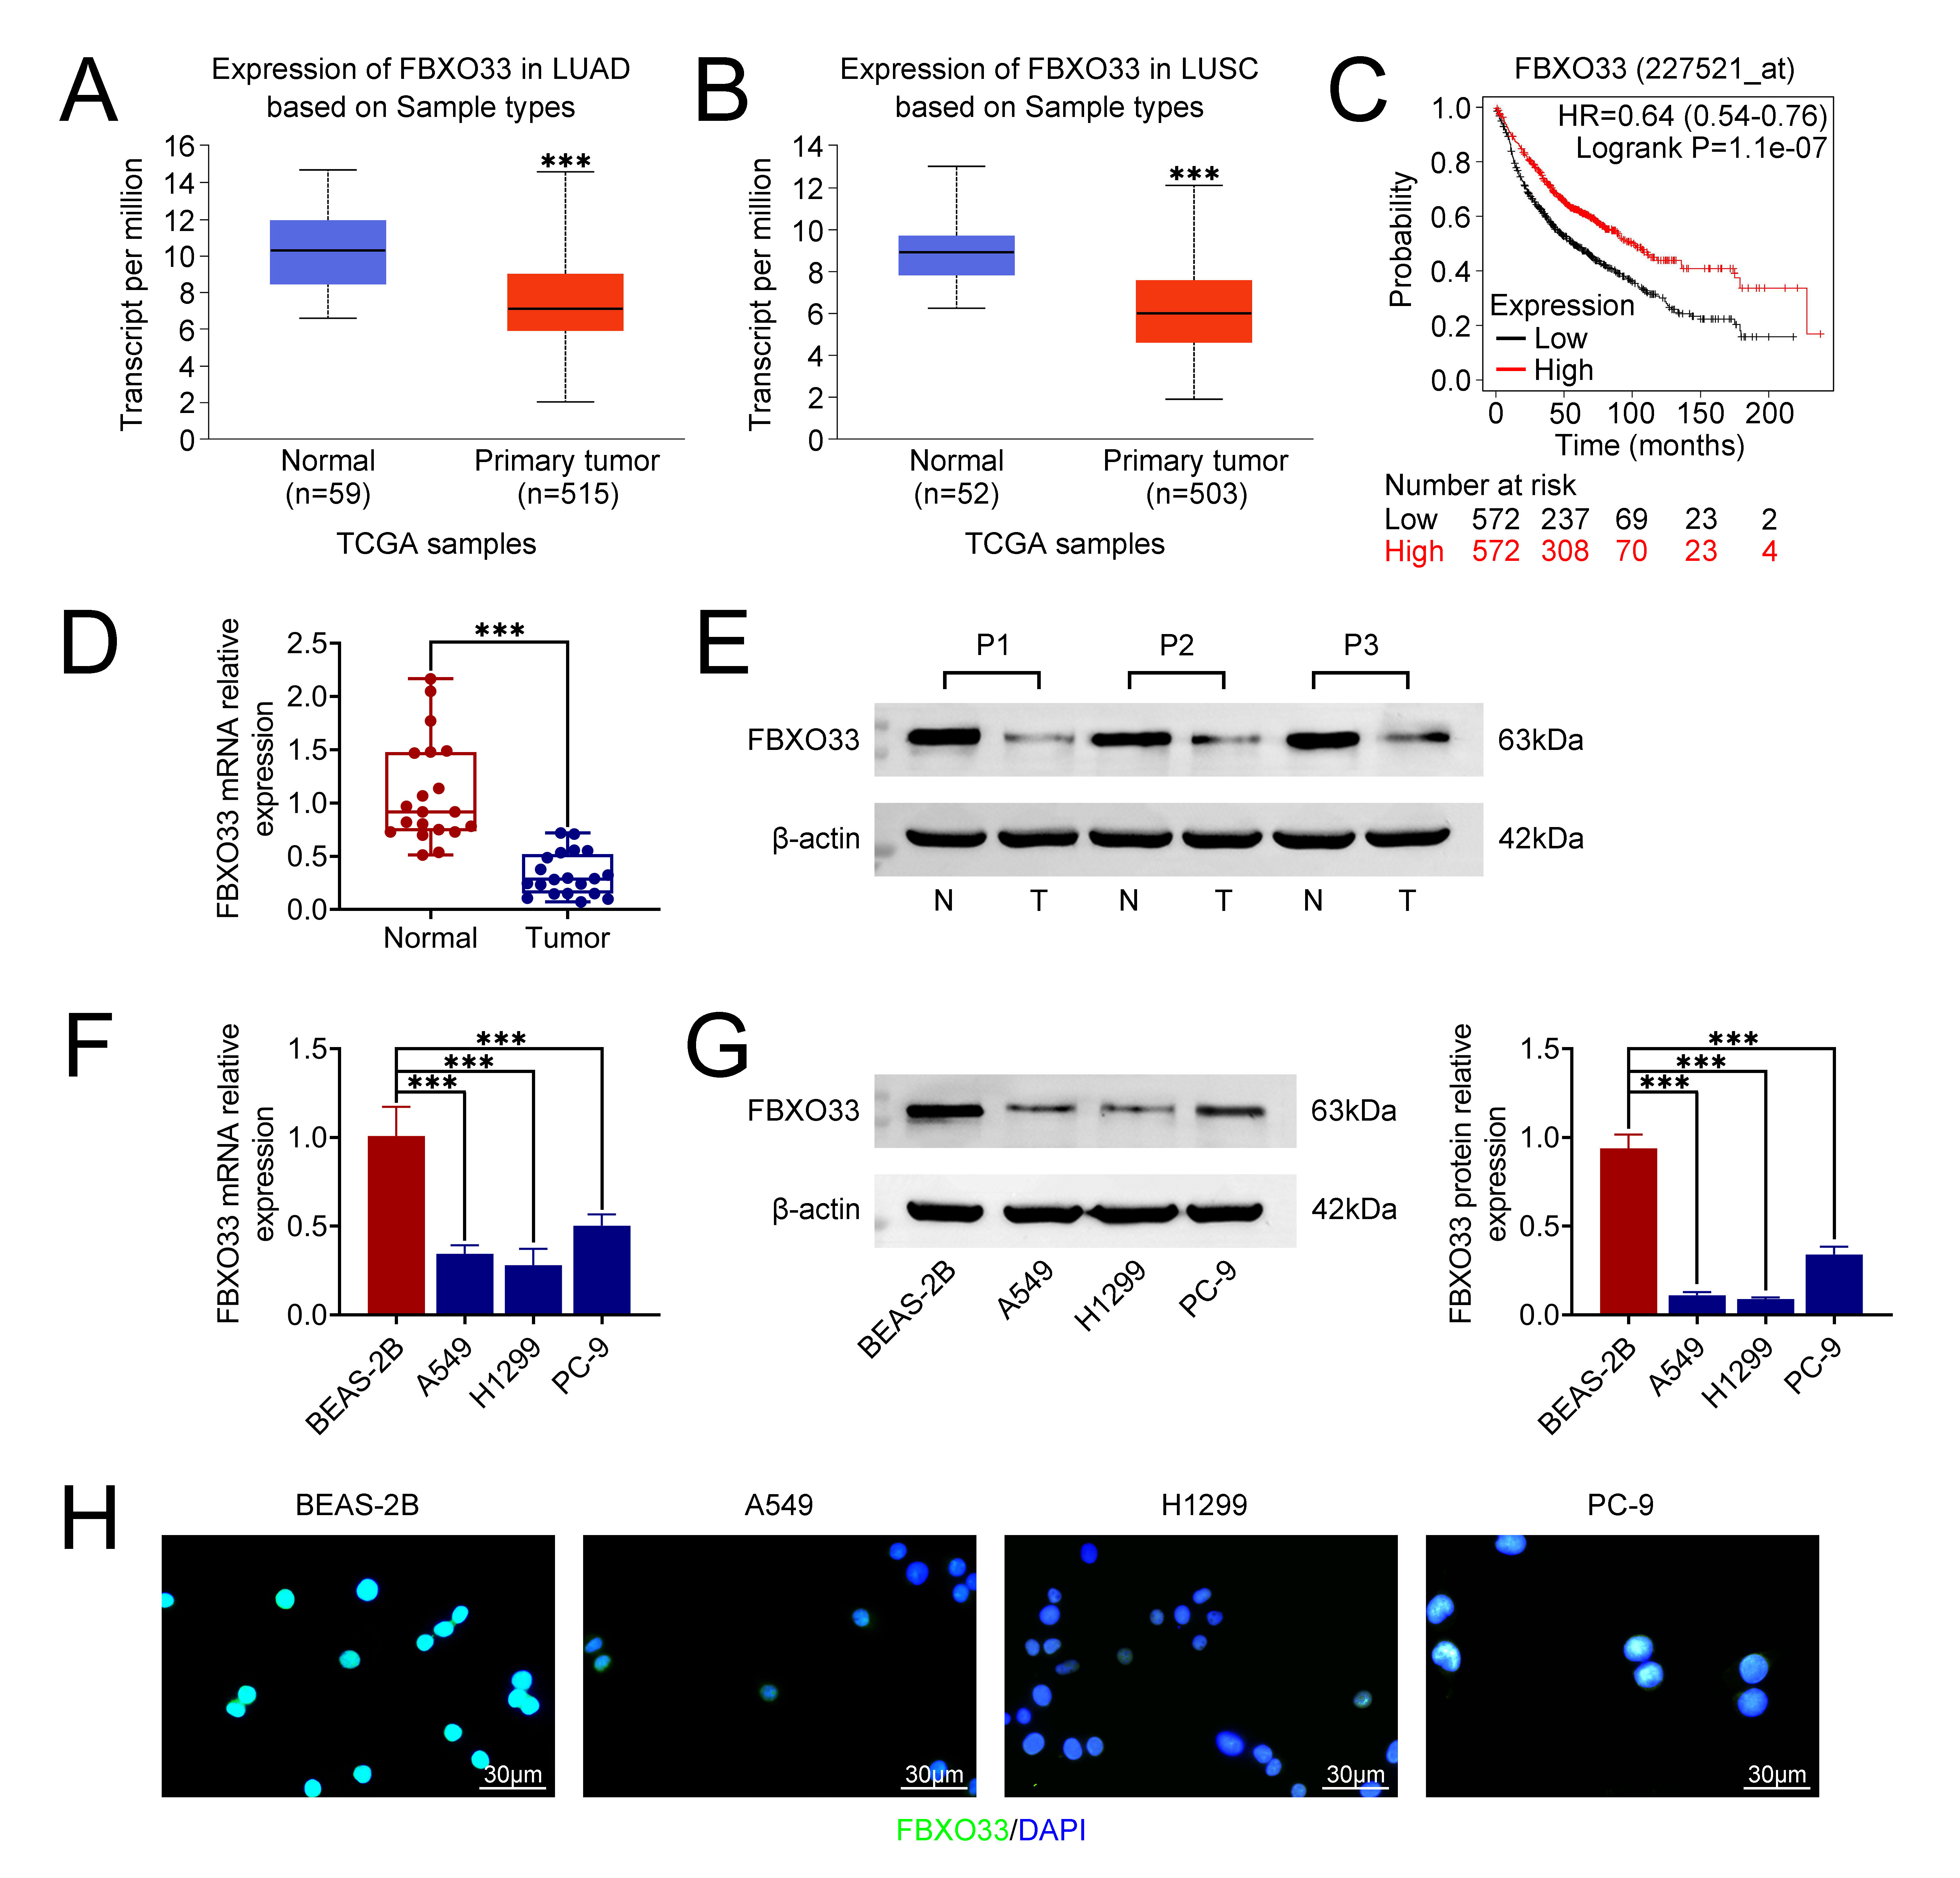 Fig. 1.
Prediction of F-box Only Protein 33 (FBXO33) expression in
non-small cell lung cancer (NSCLC) tissues. (A) Comparison of FBXO33 expression
between normal lung tissues and Lung Adenocarcinoma (LUAD) tumor tissues. (B)
Comparison of FBXO33 expression between normal lung tissues and Lung Squamous
Cell Carcinoma (LUSC) tumor tissues. (C) Kaplan-Meier survival analysis depicting
the correlation between FBXO33 expression and overall survival (OS) in NSCLC. (D)
Relative expression of FBXO33 mRNA in NSCLC tissues assessed by reverse
transcription-quantitative polymerase chain reaction (RT-qPCR). (E) Protein
expression of FBXO33 in NSCLC tissues analyzed by Western blot (WB). (F) Relative
expression of FBXO33 mRNA in human normal lung epithelial cells and NSCLC cell
lines. (G) Protein expression levels of FBXO33 in human normal lung epithelial
cell line and NSCLC cell lines. (H) Immunofluorescence localization of FBXO33 in
cells. N = 3, ***p
To validate these bioinformatics predictions, FBXO33 mRNA and protein expression levels were evaluated in clinical NSCLC samples and cell lines. Both RT-qPCR and WB analyses demonstrated a significant reduction in FBXO33 mRNA expression in tumor tissue relative to the control group (Fig. 1D,E). Additionally, mRNA and protein expression levels of FBXO33 were examined in human normal lung epithelial cells (BEAS-2B) and NSCLC cell lines (A549, H1299, PC-9). The results revealed significantly lower expression of FBXO33 in all NSCLC cell lines compared to normal lung epithelial cells (Fig. 1F,G). Furthermore, IF staining illustrated relatively higher FBXO33 expression in BEAS-2B cells compared to A549, H1299, and PC-9 cells (Fig. 1H). Collectively, these findings underscore the diminished expression of FBXO33 in NSCLC.
The effects of FBXO33 overexpression or knockdown on NSCLC cell behavior were examined in A549 and H1299 cell lines. Initially, WB analysis demonstrated a significant increase in FBXO33 expression relative to the control group following overexpression. Conversely, compared to the shNC group, FBXO33 expression notably decreased after knockdown, indicating the effectiveness of overexpression and knockdown (Fig. 2A). Subsequently, the influence of FBXO33 expression on NSCLC cell growth was investigated. As shown in Fig. 2B, at 24 h, 48 h, and 72 h post-transfection, inhibiting FBXO33 expression led to significantly higher cell viability in the shFBXO33 group of both cell lines compared to the shNC group. Comparatively, FBXO33 overexpression significantly reduced cell viability in both cell lines compared to the control group. Furthermore, EdU staining (Fig. 2C) revealed that overexpression of FBXO33 significantly reduced cell proliferation compared to the control group. FBXO33 knockdown significantly increased cell proliferation relative to the shNC group. Moreover, cell migration and invasion were assessed (Fig. 2D,E). Overexpression of FBXO33 significantly reduced the number of migrating and invading cells compared to the control group, while knockdown of FBXO33 led to a significant increase in the number of migrating and invading cells compared to the shNC group. Overall, these findings indicate that FBXO33 suppresses the growth, migration, and invasion of NSCLC cells.
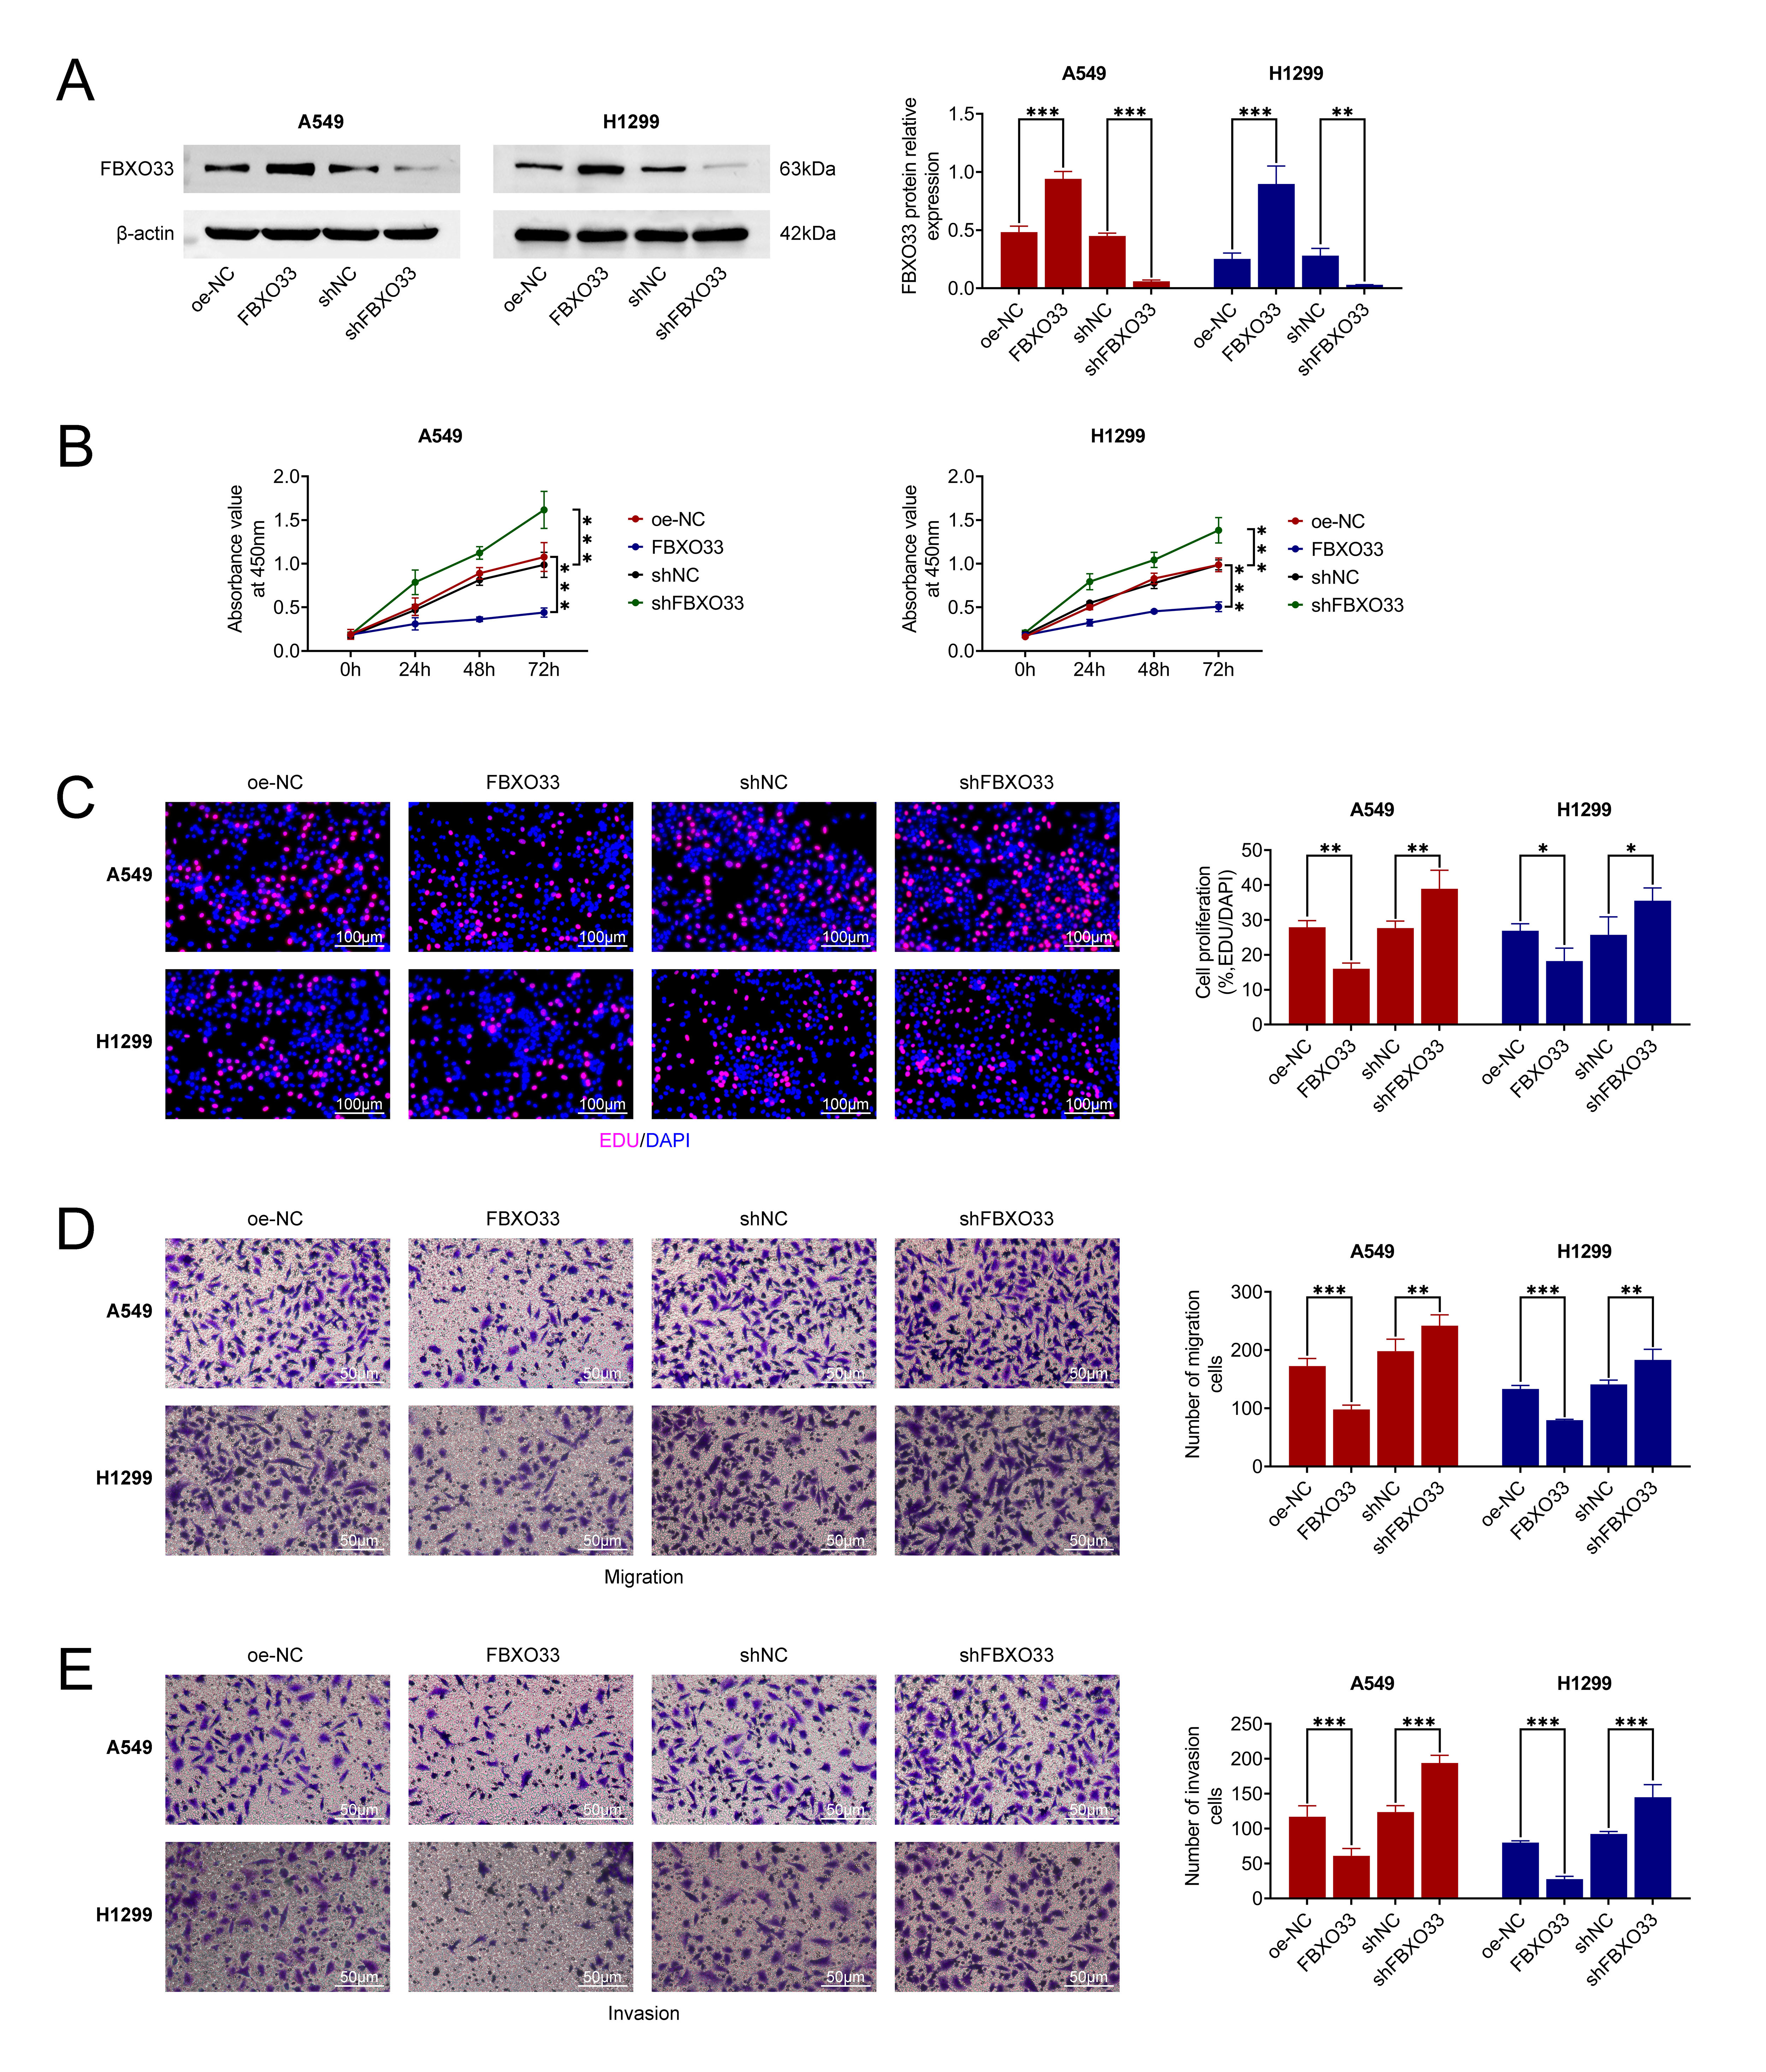 Fig. 2.
Effects of FBXO33 on the growth, migration, and invasion of
NSCLC cells. (A) Western blot analysis confirming the efficiency of FBXO33
overexpression or knockdown. (B) Impact of FBXO33 overexpression or knockdown on
cell growth. (C) Influence of FBXO33 overexpression or knockdown on cell
proliferation. Scale bar 100 µm. (D) Effects of FBXO33 knockdown on cell migration. Scale bar 50 µm. (E) Effects of
FBXO33 overexpression or knockdown on cell invasion. Scale bar 50 µm. N = 3, *p
To assess the impact of FBXO33 on the stemness characteristics of NSCLC cells, the protein expressions of stemness markers, including CD133, OCT4 and SOX2, were evaluated via WB. As shown in Fig. 3A, in the A549 and H1299 cell lines, the protein levels of CD133, OCT4 and SOX2 were significantly reduced compared to the control group after FBXO33 overexpression, while the expression levels of these proteins were elevated compared to the shNC group. Additionally, the number of tumor spheres formed per 500 cells was determined through tumor sphere formation and MSFE experiments. As shown in Fig. 3B, the control group exhibited a certain number of cells with a spherical morphology. However, after FBXO33 overexpression, the observed field of view was less populated with tumor spheres compared to the shNC group, and knocking down FBXO33 resulted in an increased number of tumor spheres observed in the field of view. These findings collectively suggest that FBXO33 suppresses the stemness characteristics of NSCLC cells.
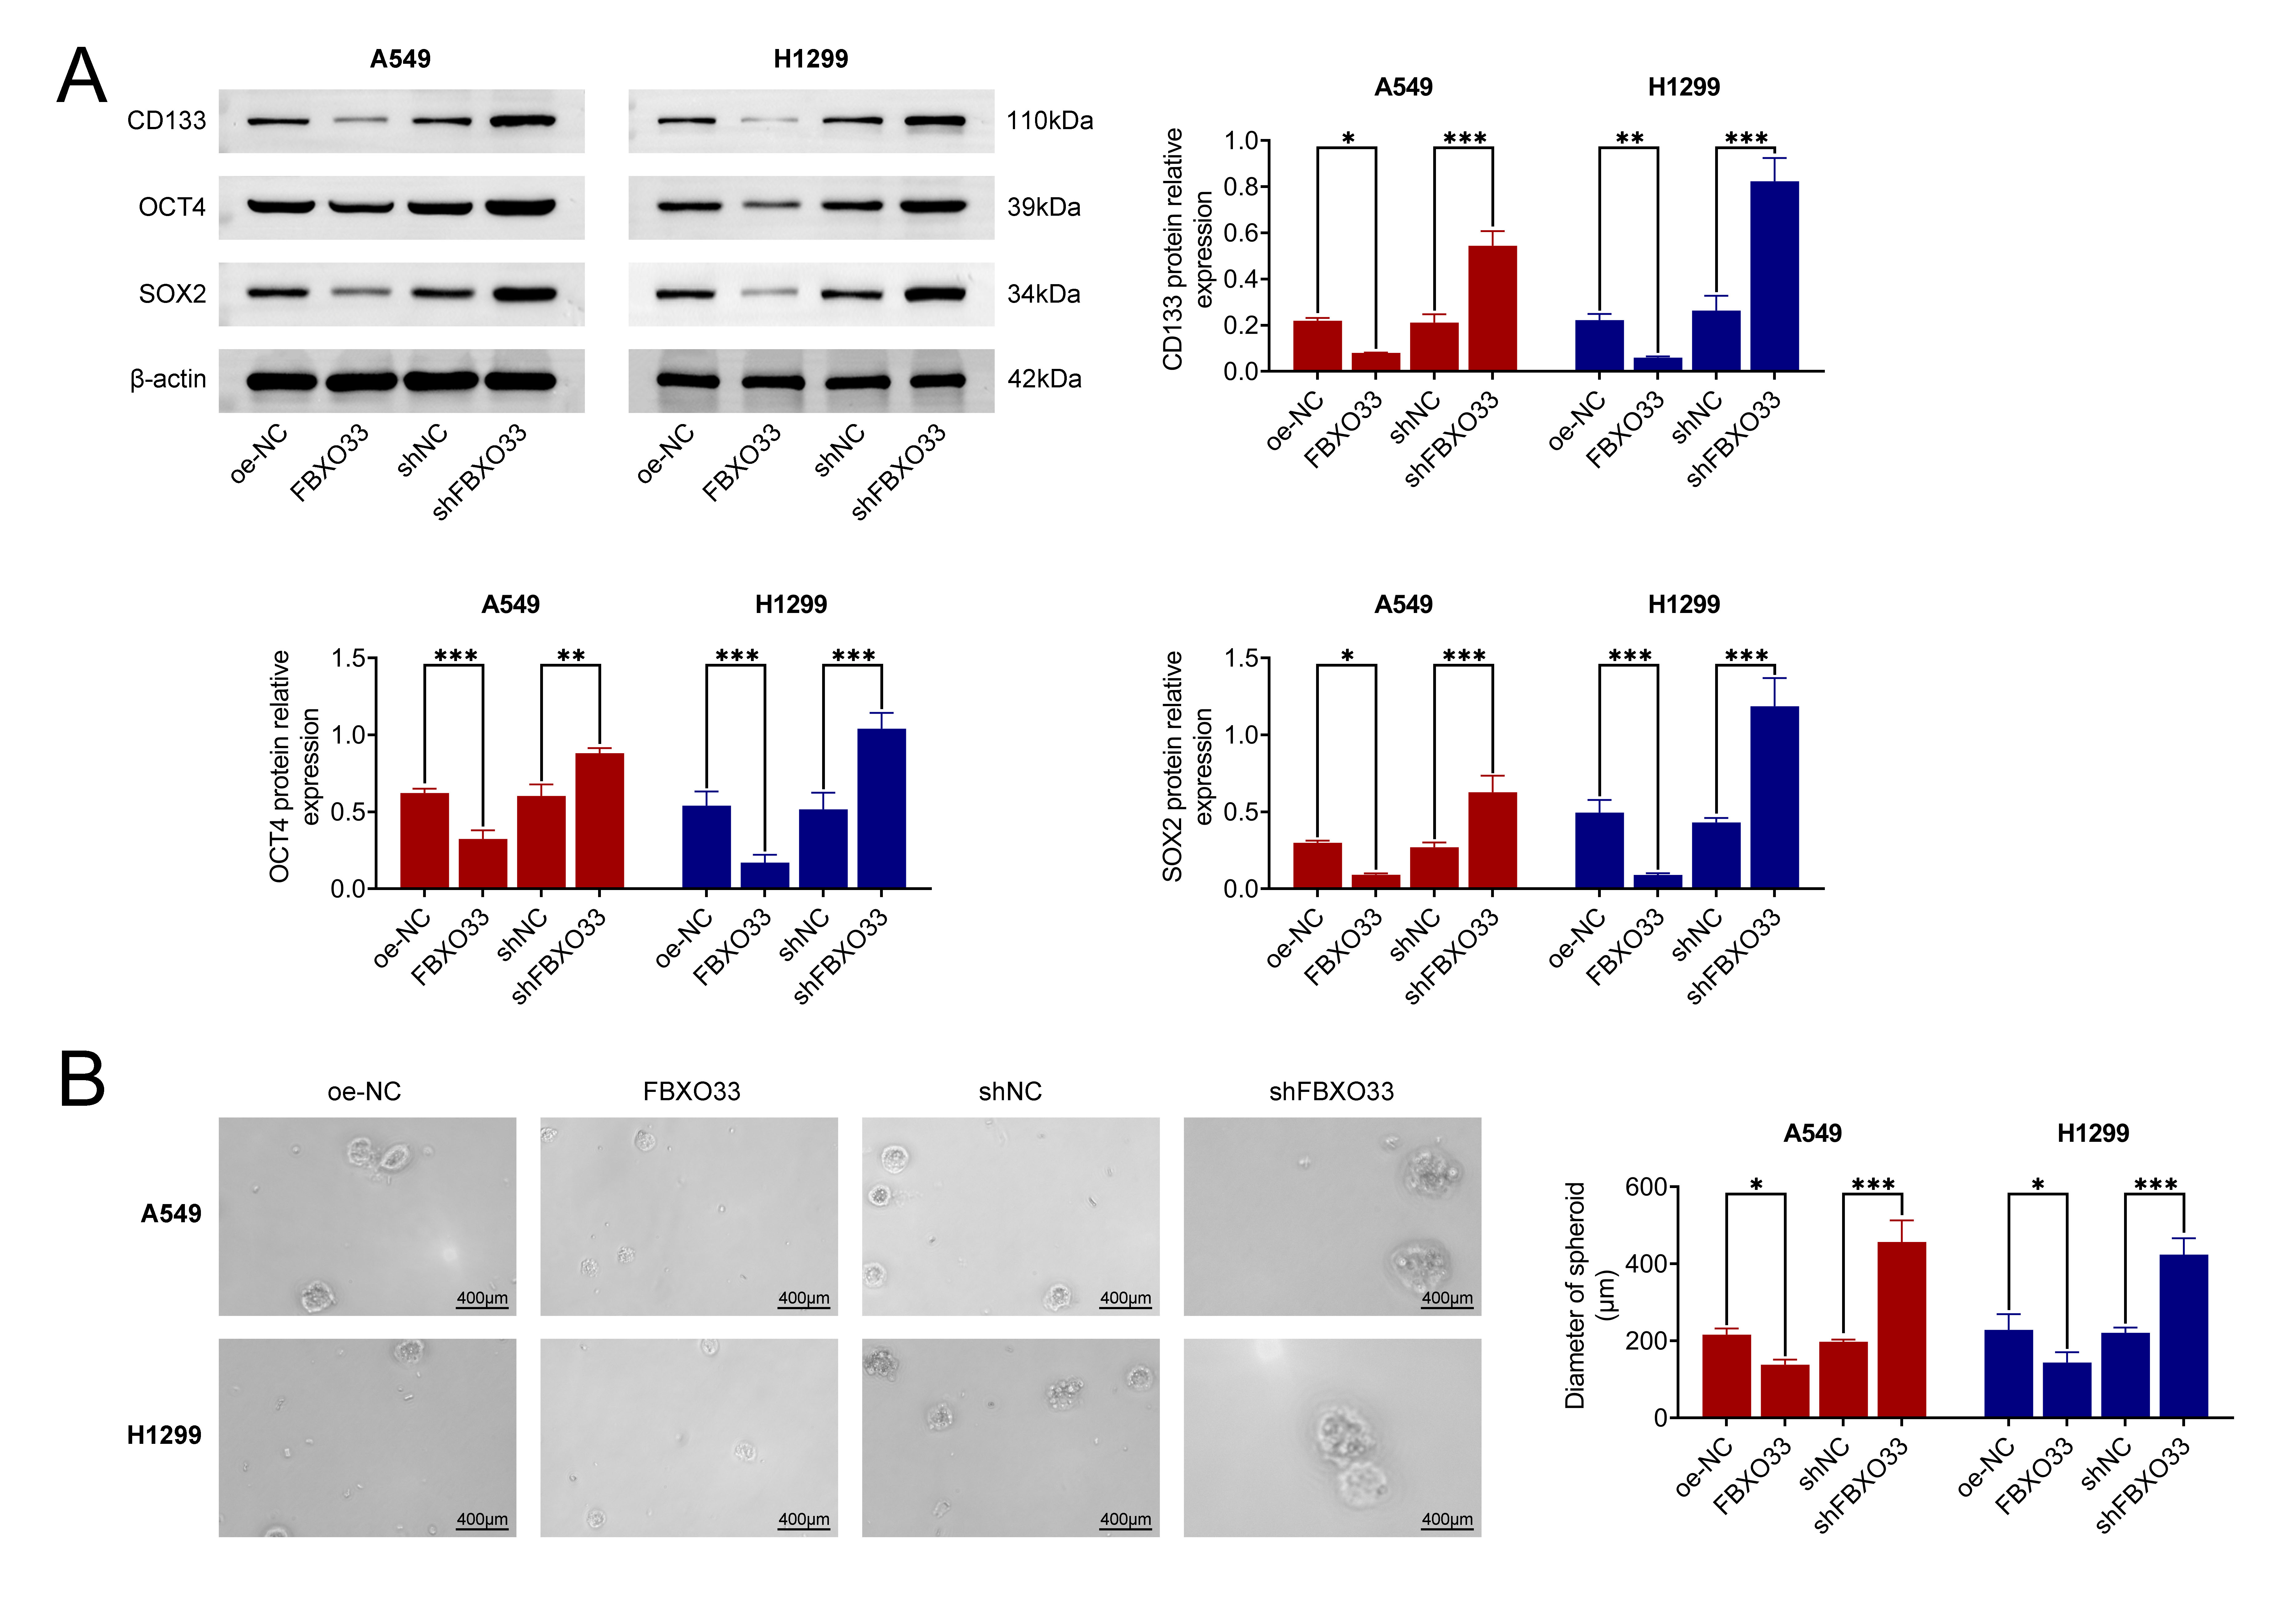 Fig. 3.
Effects of FBXO33 on the stemness characteristics of NSCLC
cells. (A) Impact of FBXO33 overexpression or knockdown on the protein
expression levels of CD133, OCT4, and SOX2. (B) Influence of FBXO33
overexpression or knockdown on the formation of tumor spheres. N = 3, *p
Firstly, the expression of Myc was assessed in A549 cells. As shown in Fig. 4A, the protein expression level of Myc significantly decreased following FBXO33 overexpression, whereas it markedly increased after FBXO33 knockdown compared to the shNC group. Subsequently, the interaction between FBXO33 and Myc was investigated using Co-IP. The results shown in Fig. 4B revealed the expression of both FBXO33 and Myc, indicating their binding to each other. Notably, IgG expression was absent. Furthermore, Myc ubiquitination levels were evaluated via Immunoprecipitation (IP). The findings indicated an increase in Myc ubiquitination in the presence of FBXO33. Additionally, CHX degradation experiments were conducted to assess the degradation rate of Myc. Within 2 hours of CHX treatment, the degradation rate of Myc was significantly lower in cells with FBXO33 knockdown compared to the shNC group (Fig. 4C–E). These results collectively suggest that FBXO33 promotes the ubiquitination and degradation of Myc.
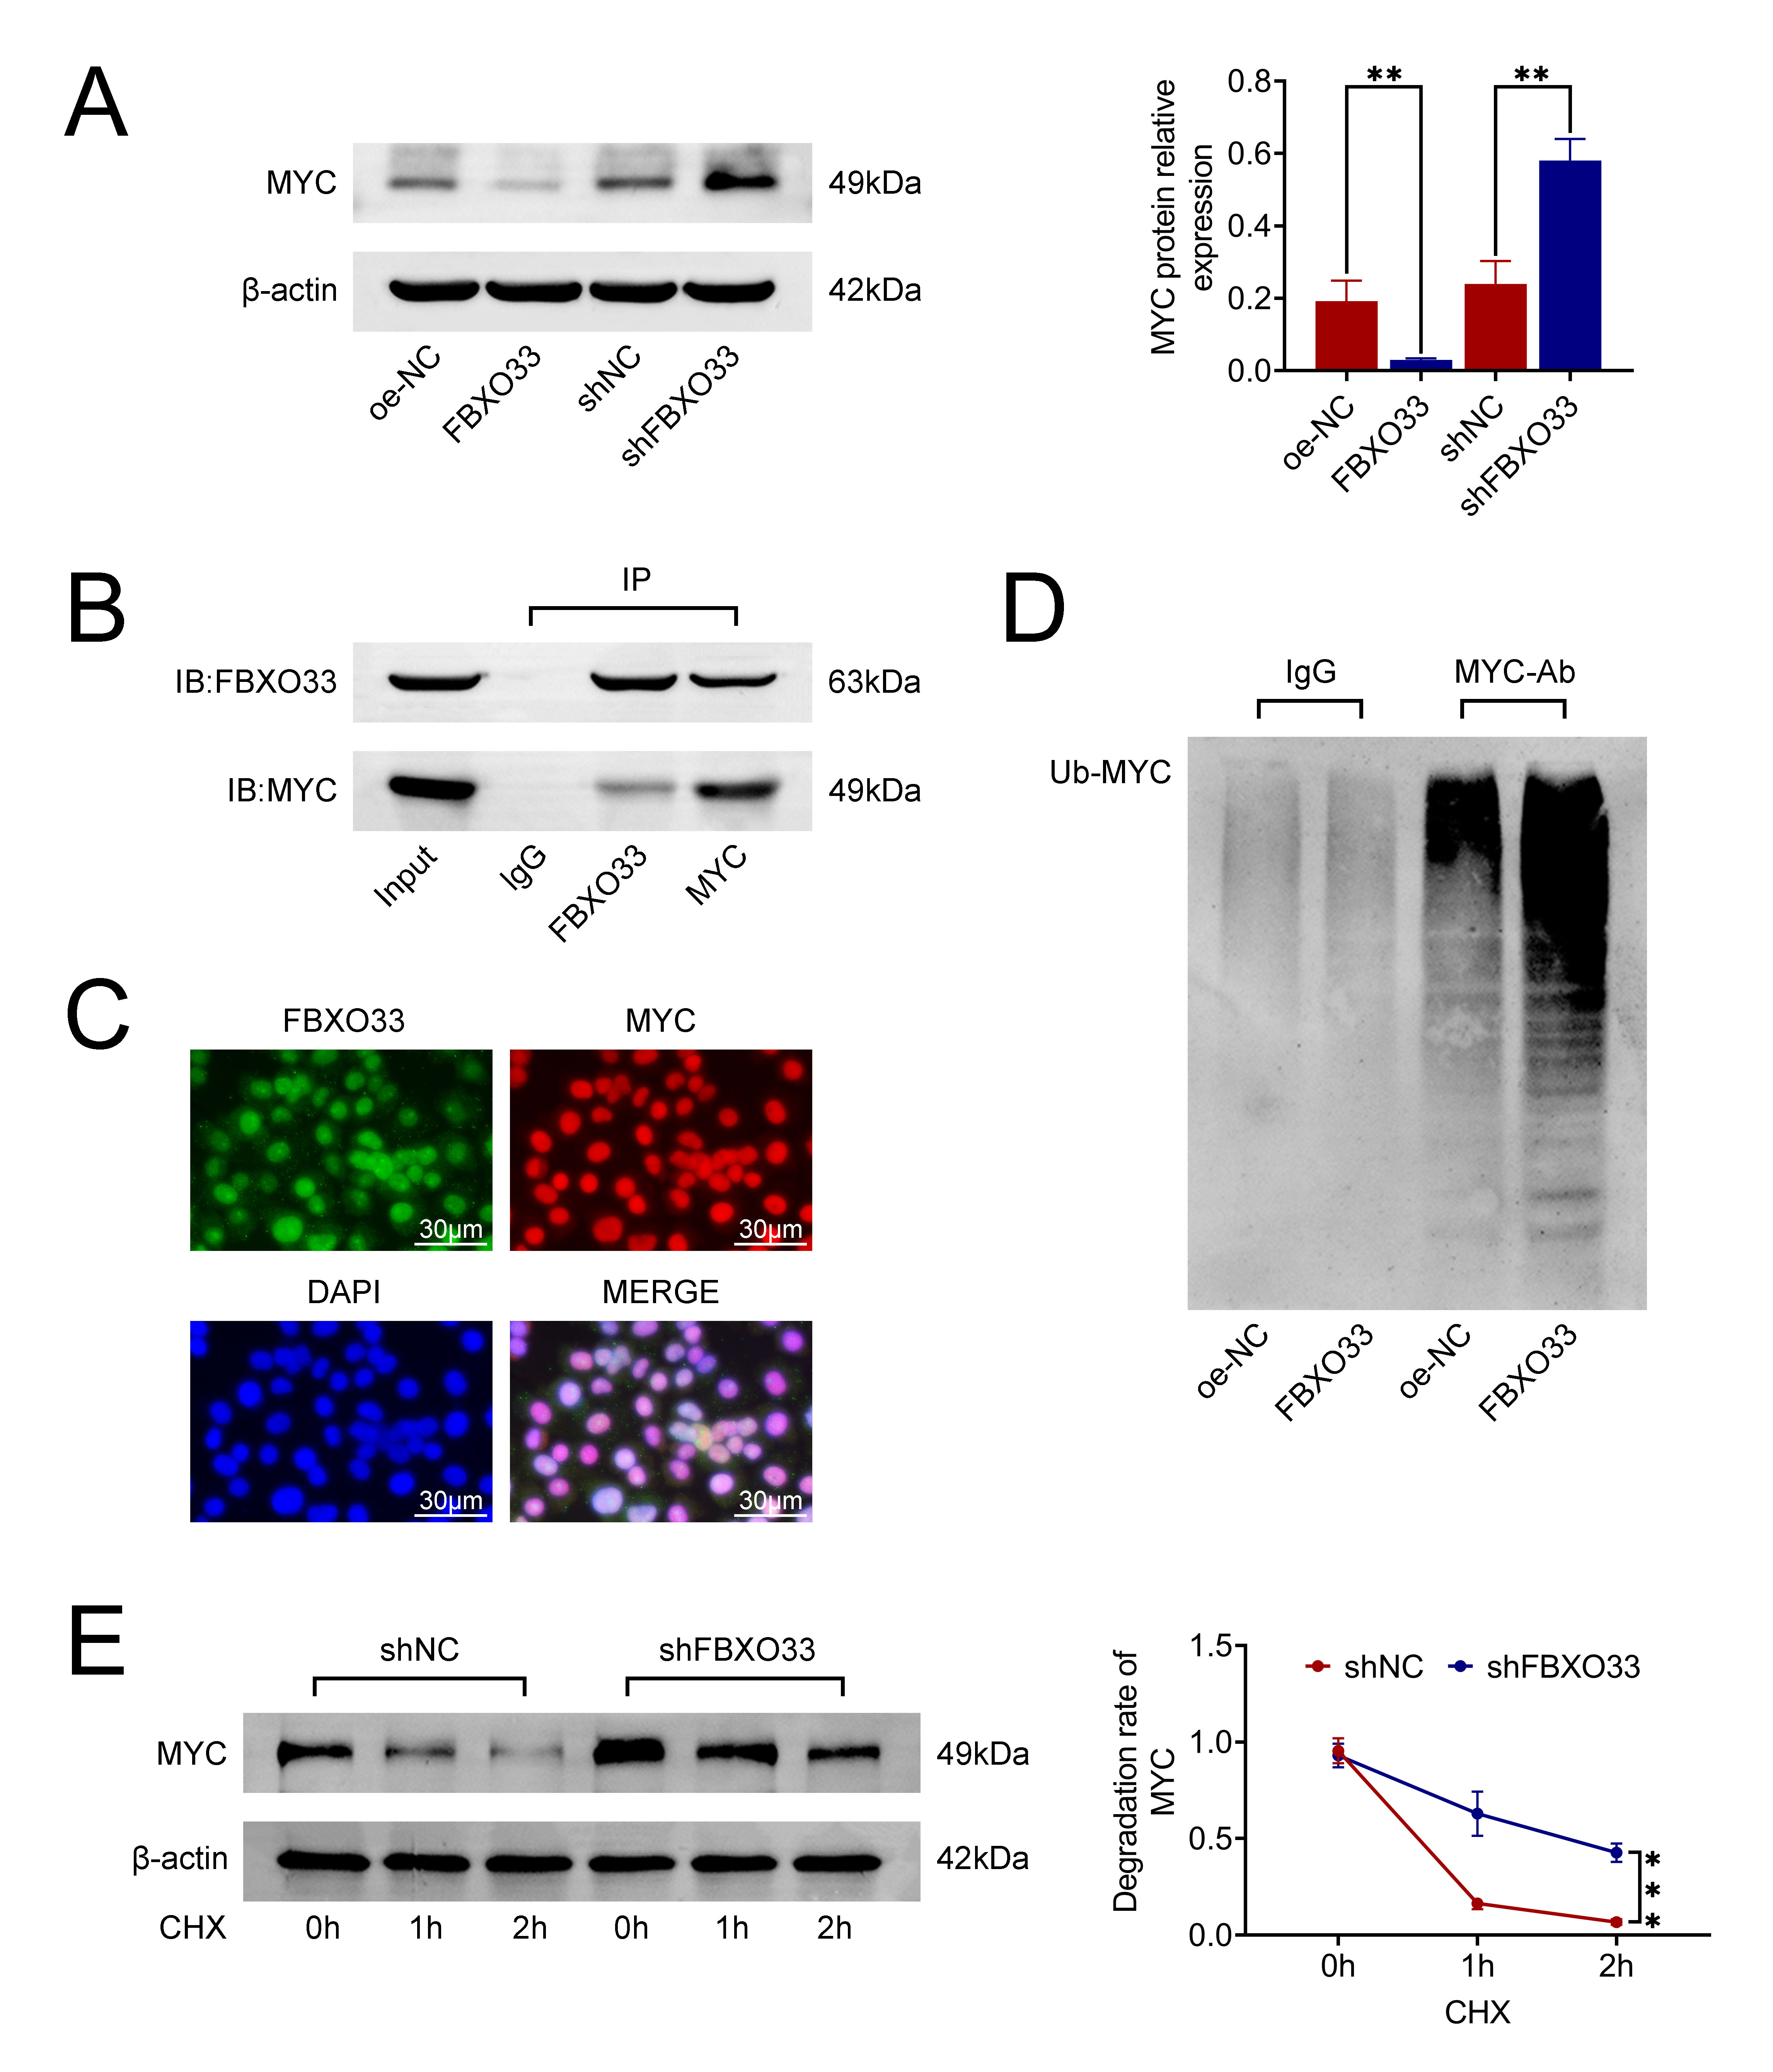 Fig. 4.
Effects of FBXO33 on the ubiquitination and degradation of
Myelocytomatosis (Myc). (A) Impact of FBXO33 overexpression or knockdown on the
protein expression level of Myc. (B) Co-immunoprecipitation assay illustrating
the protein interaction between FBXO33 and Myc. (C) Immunofluorescence
localization of FBXO33 and Myc in cells. Scale bar 30 µm. (D) Cycloheximide (CHX) assay
demonstrating the ubiquitination degradation of Myc following FBXO33
overexpression. (E) Western blot detection of the effect of FBXO33 knockdown on
the degradation rate of Myc within 2 hours. N = 3, **p
A xenograft NSCLC tumor model was established in BALB/c nude mice, and tumor weight and volume were monitored over 21 days. The results showed that compared to the control group, which exhibited intact tumor morphology, tumors overexpressing FBXO33 had reduced volume (Fig. 5A). Furthermore, within the 21-day timeframe, both tumor volume and mass were lower in the FBXO33 overexpression group compared to the control group. Subsequent analysis to detect KI67, FBXO33, and Myc staining in tumor tissues demonstrated a significant reduction in the number of KI67 and Myc-positive cells following FBXO33 overexpression compared to the control group (Fig. 5B), while the number of FBXO33-positive cells was significantly increased. These findings collectively indicate that FBXO33 inhibits NSCLC tumor growth in vivo.
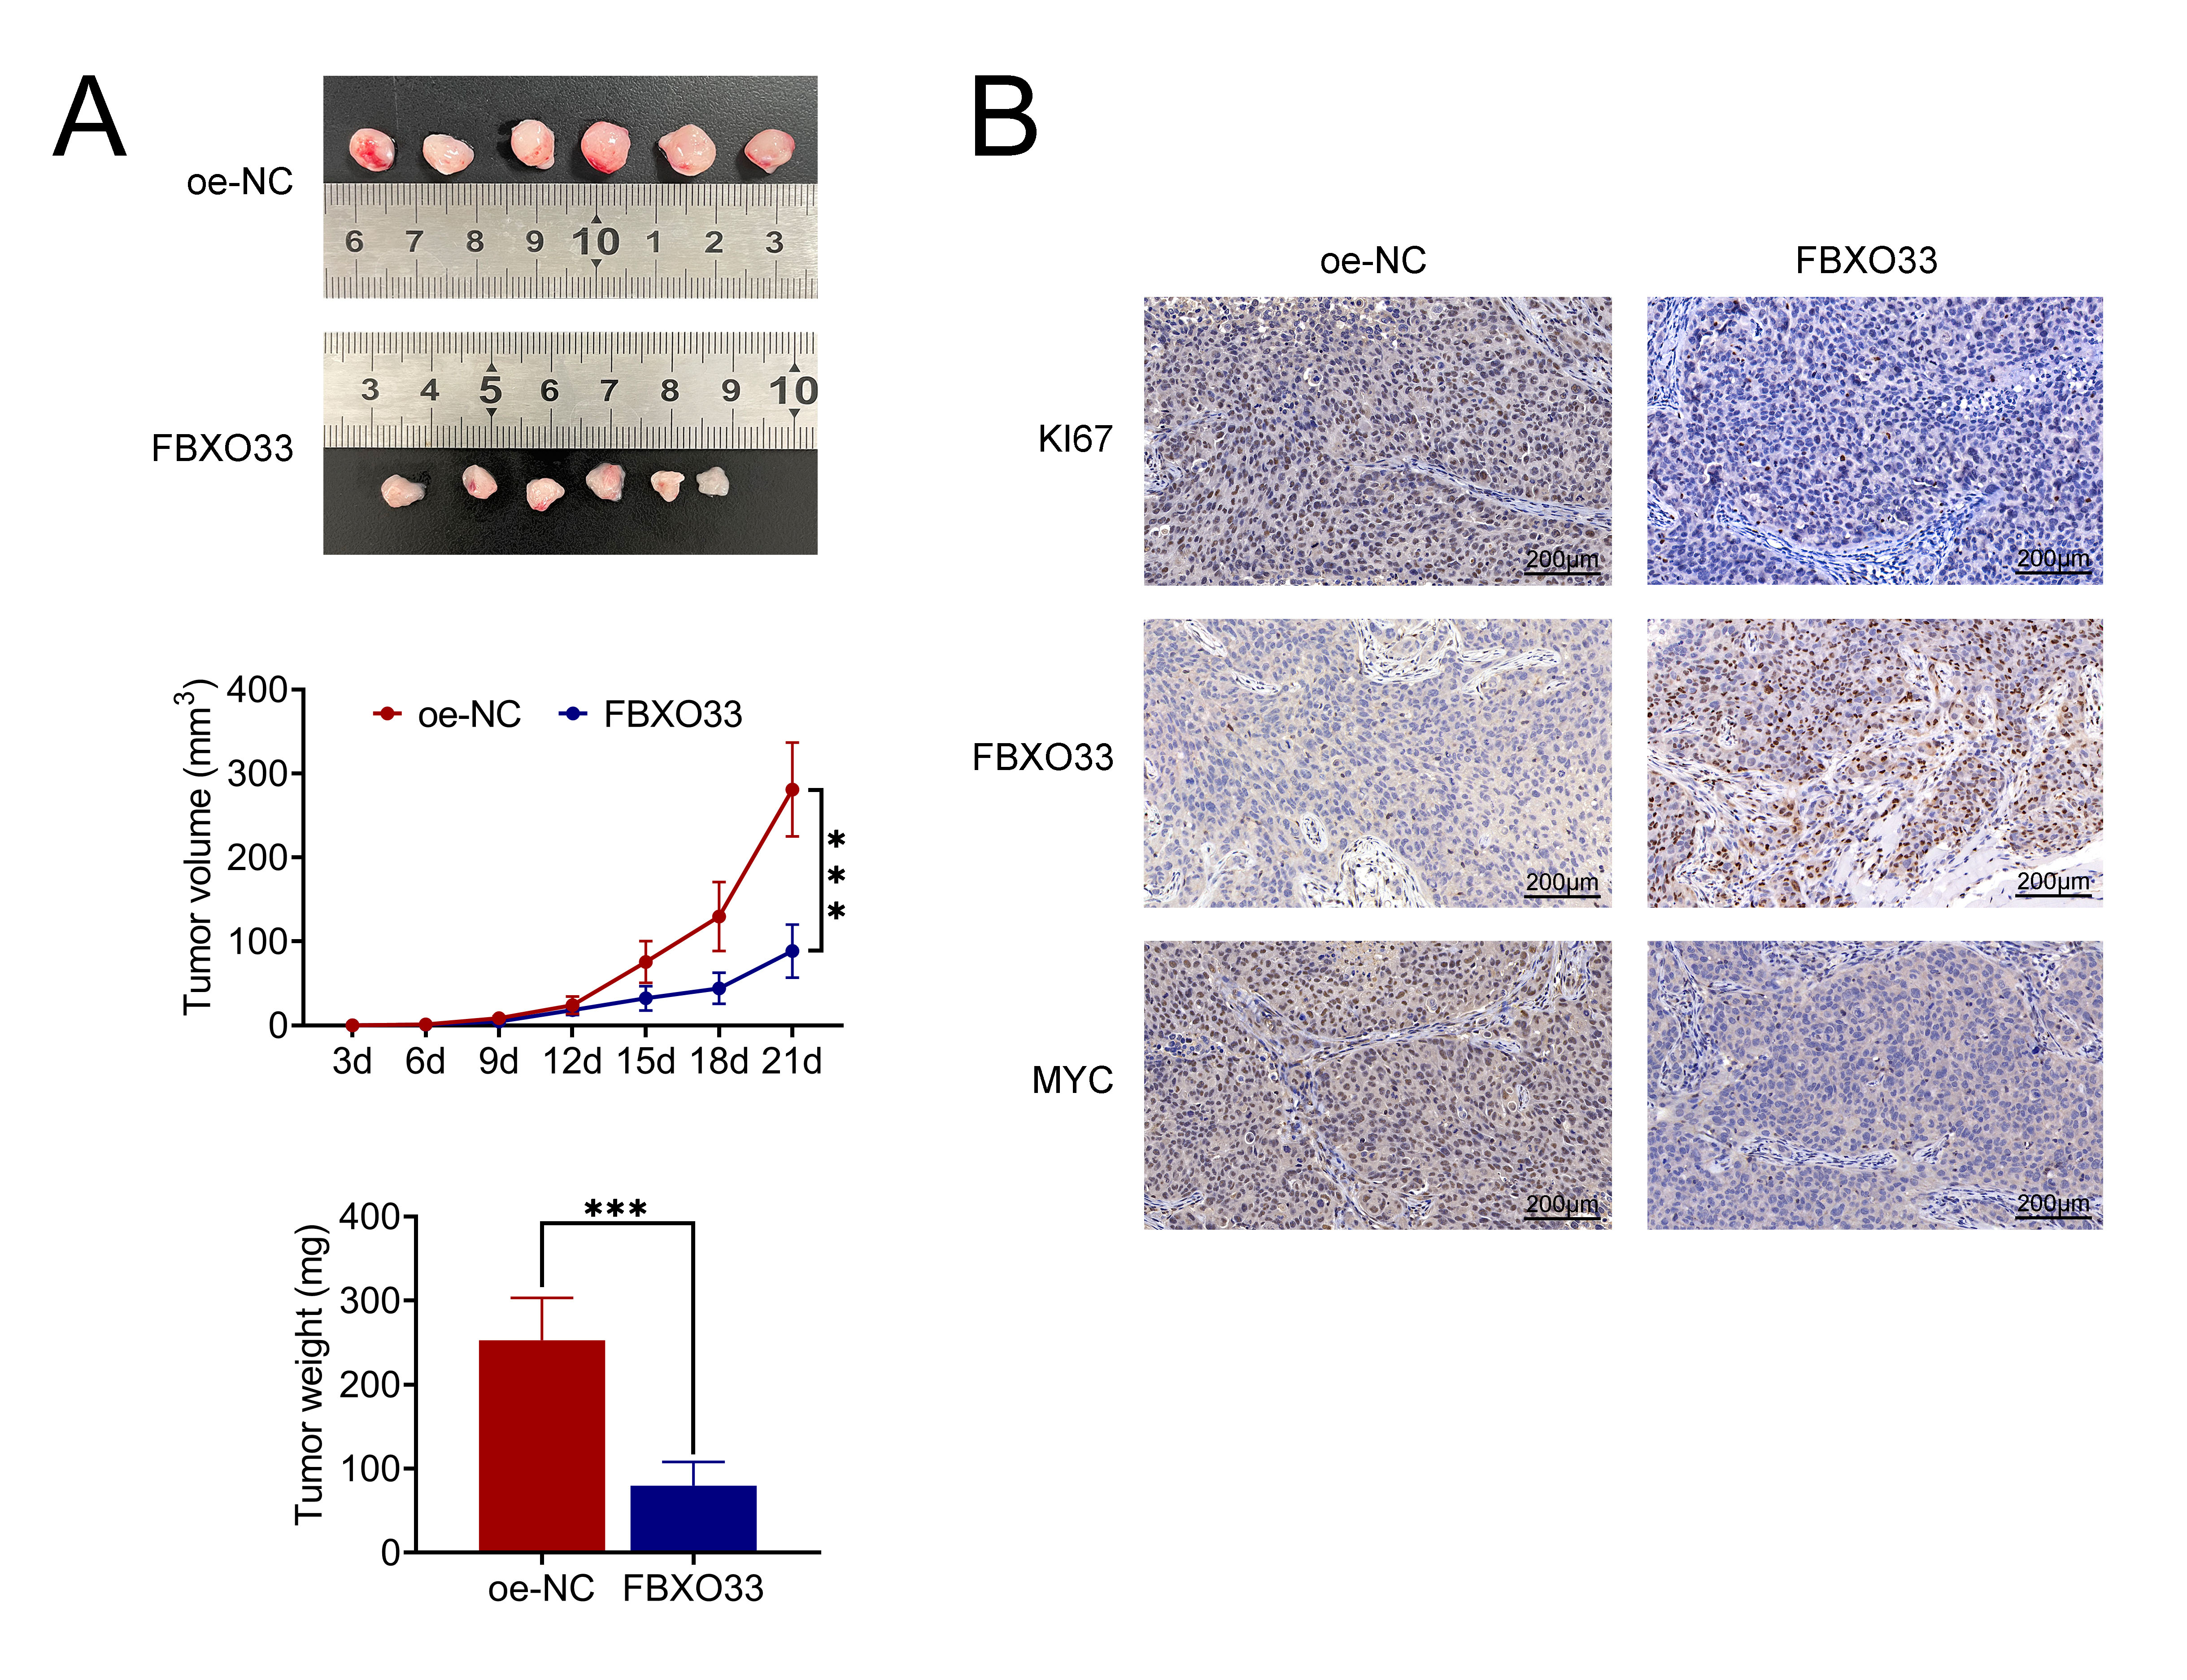 Fig. 5.
Effects of FBXO33 on NSCLC tumor growth in vivo. (A)
Morphological changes, tumor volume, and weight over 21 days. (B)
Immunohistochemical staining showing KI67 and Myc positive cells following FBXO33
intervention. N = 6, ***p
Lung cancer remains the leading cause of cancer death worldwide. Despite advancements in NSCLC research, it remains the primary cause of cancer-related mortality worldwide. Dysregulated gene expression is a significant contributor to NSCLC pathogenesis, underscoring the promise of targeted gene therapy. This study investigates the expression and functional role of FBXO33 in NSCLC, providing crucial insights for potential gene therapy strategies. The findings offer a solid preclinical foundation, highlighting FBXO33 as a promising therapeutic target in NSCLC treatment.
In this study, TCGA analysis conducted via UALCAN revealed a significant downregulation of FBXO33 expression in NSCLC, with low FBXO33 expression correlating with reduced OS. Experimental validation further confirmed these findings. Remarkably, prior research had not investigated FBXO33 expression in lung cancer, making our study the first to identify its reduced expression in NSCLC. Notably, a comprehensive analysis integrating TCGA and GEO databases previously identified genes, such as PEBP4, FAM83A, and SPOCK1, associated with OS in lung adenocarcinoma patients [22]. Our innovative prediction results expand upon these findings, elucidating the association between low FBXO33 expression and NSCLC development.
This study investigated the effects of FBXO33 expression on NSCLC cell behavior,
encompassing growth, proliferation, migration, and invasion. The findings
revealed that FBXO33 overexpression notably suppressed these cellular activities,
contrasting with the observed trend following its knockdown. Prior
investigations, such as one involving Circ_0002476, have demonstrated the
regulation of cell growth and invasion in NSCLC through modulation of the
miR-1182/TFAM axis, aligning with our study’s outcomes [23]. Furthermore, this
study also found that FBXO33 expression suppressed the stemness characteristics
and tumorsphere formation of NSCLC cell lines. This finding resonates with a
prior study indicating that chronic intermittent hypoxia (CIH), serving as a transcriptional activator of ATAD2,
triggers HIF-1
The tumor-suppressive effects of FBXO33 in NSCLC likely occur through the ubiquitination and degradation of the Myc protein. Myc, a well-established oncogene, governs various cellular processes such as cell growth, proliferation, and apoptosis [25]. FBXO33 promotes Myc ubiquitination and degradation, diminishing Myc stability and activity, thus reducing NSCLC cell proliferation and increasing apoptosis. Moreover, FBXO33’s inhibition of Myc likely affects multiple downstream signaling pathways implicated in cell cycle control, metabolism, and cellular stress responses [26]. Future investigations could focus on delineating these pathways and comprehensively understanding the FBXO33-Myc interactions in NSCLC. Our in vivo NSCLC model demonstrated FBXO33’s inhibitory impact on tumor growth, suggesting its potential as a foundation for preclinical drug development.
Although this study presents novel insights into the role of FBXO33 in NSCLC, several limitations warrant consideration. Firstly, comparative analyses with previously identified genes related to NSCLC have not been conducted, and future research is needed to address this gap. Secondly, while the interaction between FBXO33 and Myc has been identified, further investigation into the associated signaling pathways is warranted in subsequent studies. Additionally, although the potential significance of c-Myc regulation by FBXO33 is acknowledged, this study did not explore c-Myc expression. Future investigations could focus on elucidating the specific pathways and interactions involving FBXO33 and c-Myc in NSCLC.
In conclusion, this study reveals that FBXO33 is downregulated in NSCLC tissues and is correlated with poor prognosis. Its overexpression promotes the ubiquitination and degradation of Myc, thereby inhibiting the proliferation, migration and stemness of tumor cells and consequently impeding NSCLC progression.
BCA, Bicinchoninic Acid; CCK-8, cell counting kit-8; Co-IP,
Co-immunoprecipitation; CRL1, Cullin-Ring Ligase 1; CHX, Cycloheximide; EdU,
5-Ethynyl-2
The datasets used and/or analyzed during the present study are available from the corresponding author on reasonable request.
QW and GF designed the research study. ZL performed the research. JZ provided help and advice on the ELISA experiments. WJ, HX and KW analyzed the data. All authors contributed to editorial changes in the manuscript. All authors read and approved the final manuscript. All authors have participated sufficiently in the work and agreed to be accountable for all aspects of the work.
Ethical approval was obtained from the Ethics Committee of Affiliated Hospital 2 of Nantong University (Nantong First People’s Hospital, Approval No. 2023KT053). Informed consent was obtained from all participants.
Not applicable.
This work was supported by the National Natural Science Foundation of China (Grant No. 81972278) and Project of Nantong Municipal Health Commission (Grant No. QA2021012).
The authors declare no conflict of interest.
References
Publisher’s Note: IMR Press stays neutral with regard to jurisdictional claims in published maps and institutional affiliations.