


 , Pengxin Duan 3,†, Bo Nie 4, Zhe Zhang 5, Rui Shi 1,2, Qiming Liu 1,2, Shiduo Wang 1,2, Tiantian Xu 1,2, Junbiao Tian 5,*
1 Major of Integrated Traditional Chinese and Western Medicine, Hebei University of Chinese Medicine, 050013 Shijiazhuang, Hebei, China
2 Major of Integrated Traditional Chinese and Western Medicine, First Affiliated Hospital of Hebei University of Chinese Medicine, 050013 Shijiazhuang, Hebei, China
3 School of Mathematics and Statistics, Hebei University of Economics and Business, 050061 Shijiazhuang, Hebei, China
4 Department of Neurology, The Seventh Affiliated Hospital, Sun Yat-sen University, 518107 Shenzhen, Guangdong, China
5 Department of Neurology, Hebei Provincial Hospital of Traditional Chinese Medicine, 050013 Shijiazhuang, Hebei, China
†These authors contributed equally.
Abstract
Background: Intracranial aneurysm (IA) is a localized abnormal dilation of the cerebral vascular wall, the degeneration of which is closely related to high oxidative stress. Methods: Clinical information and RNA-seq data from five public datasets were downloaded from the Gene Expression Omnibus (GEO). Using the “GSVA” package, enrichment analysis was performed on the gene sets of the oxidative stress, reactive oxygen species (ROS), metabolism, and inflammatory pathways retrieved from the MsigDB and Kyoto encyclopedia of genes and genomes (KEGG) databases. Weighted gene co-expression network analysis (WGCNA) was conducted using the “WGCNA” package, followed by using the “limma” R package to select differentially expressed genes (DEGs). Key genes were determined by applying three machine learning algorithms (random forest, Lasso, and SVM-RFE). The expression levels of the key genes were verified by the quantitative real-time polymerase chain reaction (qRT-PCR) in IA. Finally, ESTIMATE and CIBERPSORT algorithms were used for immune infiltration analysis. Results: The enrichment score of the oxidative stress, ROS, metabolism, and inflammatory pathways was calculated, and we found that these pathways were significantly activated in IA samples with higher immune infiltration. The intersection between the blue module related to oxidative stress (610 genes identified by WGCNA) and 380 upregulated DEGs contained a total of 209 key genes, which were further processed by machine learning algorithms to obtain four crucial diagnostic markers (FLVCR2, SDSL, TBC1D2, and SLC31A1) for IA. These key genes are highly expressed in human brain vascular smooth muscle cells. The expressions of the four markers were significantly positively correlated with the abnormal activation phenotypes of oxidative stress, the ROS and glucometabolic pathways, and suppressive immune infiltration. Conclusion: This study employed WGCNA combined with three machine learning algorithms to identify four oxidative stress-related signature markers for IA, providing novel insights into the clinical management of IA patients.
Keywords
- intracranial aneurysm (IA)
- WGCNA
- diagnostic marker
- oxidative stress signatures
- immune infiltration
- prognostic analysis
Intracranial aneurysm (IA), or cerebral aneurysm, is a localized abnormal dilation of the weakened area or defective cerebral artery lumen or vascular wall due to increased intracranial pressure [1, 2]. Intracranial magnetic resonance angiography studies showed that the prevalence of IA is approximately 2–5% in adults worldwide, and 50–80% of patients will not develop into a rupture during their lifetime [3, 4]. Both genetic and clinical factors, especially smoking, alcohol consumption, hypertension, and female gender, are regarded as important risk contributors to IA formation and growth [5, 6]. Aneurysmal rupture as the main cause of subarachnoid hemorrhage (SAH) [7] often results in permanent disability (30%) or death (30–50%) [8]. Particularly, around 5–15% of stroke cases are closely associated with a ruptured IA [9]; the death rate from SAH is 30–40%, and up to three-fifths of SAH patients that survive require long-term nursing care due to their persisting cognitive symptoms in daily activities [10]. Currently, invasive endovascular angiographic occlusion clipping [11, 12] and endovascular embolization with thrombogenic coils (coiling) are the primary treatments to prevent rupturing [13]. However, the risk of intraoperative rupture and permanent neurological damage could still increase the death and disability risks for IA patients [14]. Currently, the pathogenesis and therapeutic targets for IA remain limited, making non-invasive treatments a clinical challenge. Therefore, to bridge this gap, a comprehensive analysis of the pathogenesis of IA is required to improve the early diagnosis of IA and facilitate the design of effective and safe drugs.
Loss of mural cells (death) and their inability to proliferate and repair, as
well as inflammatory cell infiltration and luminal thrombi organization, are all
considered important events in vascular degeneration, contributing to the onset
and progression of IA [6]. A previous study demonstrated that the degeneration of
the wall and loss of mural cells are closely associated with high oxidative
stress and impaired endothelial functions [6, 15]. Redox homeostasis refers to
the balance between the action of antioxidants and the production of reactive
oxygen species (ROS) under normal physiological conditions [16]. The brain has
high metabolic requirements and pro-oxidative potential but is particularly
vulnerable to oxidative stress [17, 18]. In the pathological state of IA, the
main source of ROS is the leakage of superoxide anions from mitochondria,
normally caused by ischemic disruption of the electron transfer chain and a
cascade of free radicals originating from hemoglobin auto-oxidation [19].
Subsequently, a cascade of ROS will result in the increased production of
superoxide anions (O2.-), hydrogen peroxide (H2O2), hydroxyl
radical (
The clinical information and RNA-seq data of patients with IA were downloaded from the GEO (http://www.ncbi.nlm.nih.gov/geo) database [32]. After filtering, five GEO cohorts, including GSE75436 (15 IA and 15 control samples), GSE26969 (3 IA and 3 control samples), GSE13353 (19 IA samples), GSE15629 (14 IA and 5 control samples), and GSE54083 (13 IA and 10 control samples, Agilent platform), were included in this study.
In the GEO cohorts, only GSE54083 was collected from the Agilent platform, while the other four cohorts came from the Affymetrix platform. Thus, the expression matrix of the Affymetrix cohorts was subjected to background correction, quantile normalization, and log2 transformation to eliminate differences between groups using the robust multi-array average (RMA) algorithm in the “oligo” R package [33]. Meanwhile, the Agilent cohort was also performed with the quantile normalization and log2 transformation using the same method. Then, the probes were mapped to the genes based on the annotation files. The median value was taken to represent the gene expression level when one gene matched multiple probes, while the probe was removed when it mapped numerous genes. Further, the Combat algorithm was employed to eliminate the batch effects between different datasets [33]. Finally, 64 IA (GEO-IA) and 33 control samples were included in this study.
The 13 oxidative stress-related pathways (GO accession was shown in Supplementary Materials) and the “hallmark gene sets” of ROS and inflammatory response pathways from The Molecular Signatures Database (MsigDB, http://www.gsea-msigdb.org/gsea/downloads.jsp) were downloaded to assess the activation of oxidative stress pathway in IA samples [34]. In addition, the gene lists of amino acid metabolism pathways, carbohydrate metabolism, and lipid metabolism were downloaded from the Kyoto Encyclopedia of Genes and Genomes (KEGG, https://www.kegg.jp/) database using the keggGet function in the “KEGGREST” R package [35]. Then, we used the “GSVA” R package to perform the single-sample gene set enrichment analysis (ssGSEA) for calculating pathway enrichment score and for Gene Ontology (GO) and KEGG analyses [36].
The median absolute deviation (MAD) of encoding protein genes in each sample was calculated to obtain the top 70% of genes with potential expression dysregulation. These genes were subjected to WGCNA by using the “WGCNA” R package [37] to calculate the proper soft threshold (β) to ensure that the network was scale-free [38]. In addition, the topological overlap matrix (TOM) was converted from the weighted adjacency matrix to reduce noise and false correlation [39], and the Dynamic Tree Cut method was used to section the modules further [40]. Finally, the correlation between the modules and the ROS score was analyzed to determine the oxidative stress-related gene modules.
Under the thresholds of adj. p
The random forest (RF) algorithm was run in the “randomForest” R package [43]. Lasso logistic regression was performed in the “glmnet” R package with minimal lambda as the optimal [44]. Additionally, the SVM classifier was developed by the “e1071” R package, and then SVM-RFE was performed using the RFE function in the “caret” R package [45] based on 10-fold cross-validation [46]. The timeROC R package [47] was applied to perform the receiver operating characteristic (ROC) analysis with the area under curve (AUC).
The ESTIMATE algorithm, including the stromal score, immune score, and ESTIMATE score, was used to assess the immune infiltration using the “estimate” R package [38]. The CIBERPSORT algorithm was used to evaluate the infiltration of 22 immune cells in the “CIBERPSORT” R package [48].
Human brain vascular smooth muscle cells (VSMCs) from the human brain were purchased from Bnbio (BNCC102172, Beijing, China). These cells were grown in Smooth Muscle Cell Medium (SMCM, Sciencell, San Diego, CA, USA) supplemented with 2% fetal bovine serum (FBS, Sciencell, San Diego, CA, USA), 5 mL of smooth muscle cell growth factor (SMCGS, Sciencell, San Diego, CA, USA), and 5 mL of penicillin/streptomycin (P/S, Sciencell, San Diego, CA, USA) in a 5% CO2 incubator at 37 °C. Cells have been STR identified and the mycoplasma detection results are negative.
The TRIzol reagent extraction kit (Invitrogen, Thermo Fisher Scientific, Inc., Carlsbad, CA, USA) was utilized to isolate total RNA from both human brain VSMCs and control cells (untreated group). RNA concentrations were determined using a NanoDrop 2000 spectrophotometer (Thermo Scientific, Carlsbad, CA, USA). The conditions for the PCR reaction were set as follows: an initial step at 95 °C for 30 seconds (s), followed by at 95 °C for 10 s, at 60 °C for 30 s, and at 70 °C for 34 s for a total of 40 cycles. All the data were calculated using 2-ΔΔCT and normalized to GAPDH. The experiments were performed in triplicate. The primers used are listed in Table 1.
| Gene | Forward primer (5 |
Reverse primer (5 |
|---|---|---|
| FLVCR2 | CCCTGAGCTATGCCTTGACC | ATCACCATGCGATTCAGAAGAG |
| SDSL | GACGGCTGGGAGAATGTCC | ATGGCCGCATTGAAGCAGT |
| SLC31A1 | GGGGATGAGCTATATGGACTCC | TCACCAAACCGGAAAACAGTAG |
| TBC1D2 | TGTGCCCTGTGAAAACACCC | GCCACGGATGTTGTGCATTG |
| GAPDH | GGTGGTCTCCTCTGACTTCAACA | GTTGCTGTAGCCAAATTCGTTGT |
The R software (v3.6.3, New York, NY, USA) package was used in all statistical
analyses and data visualization in this study. Spearman’s method and the Wilcoxon
test were adopted for correlation analysis and assessing significant differences
(p
To explore the potential mechanisms of oxidative stress pathways in IA, we found that compared to the normal samples, the activation of oxidative stress pathways (Fig. 1A), such as the neuronal apoptosis signaling pathway, cellular regulation pathway, and regulation of response in response to oxidative stress was significantly increased in patients with IA. Similar results were also observed in the ssGSEA score (Fig. 1B), as the neuronal apoptosis signaling pathway and other pathways score was noticeably higher in IA samples than in control samples. The hallmark score of the ROS pathway in IA samples was also significantly higher than that in the control samples (Fig. 1C). Subsequently, we analyzed the correlation between the 13 oxidative stress pathways in IA samples and control samples and found that these pathways were closely correlated with each other in the two sample types (Fig. 1D). Specifically, the correlation coefficient between the regulation of cellular response to oxidative stress pathway and regulation of response to oxidative stress pathway in IA samples (lower triangle) and control samples (upper triangle) was 0.96 and 0.94, respectively. These results indicated that the abnormal activation of oxidative stress pathways may be closely associated with the development of IA.
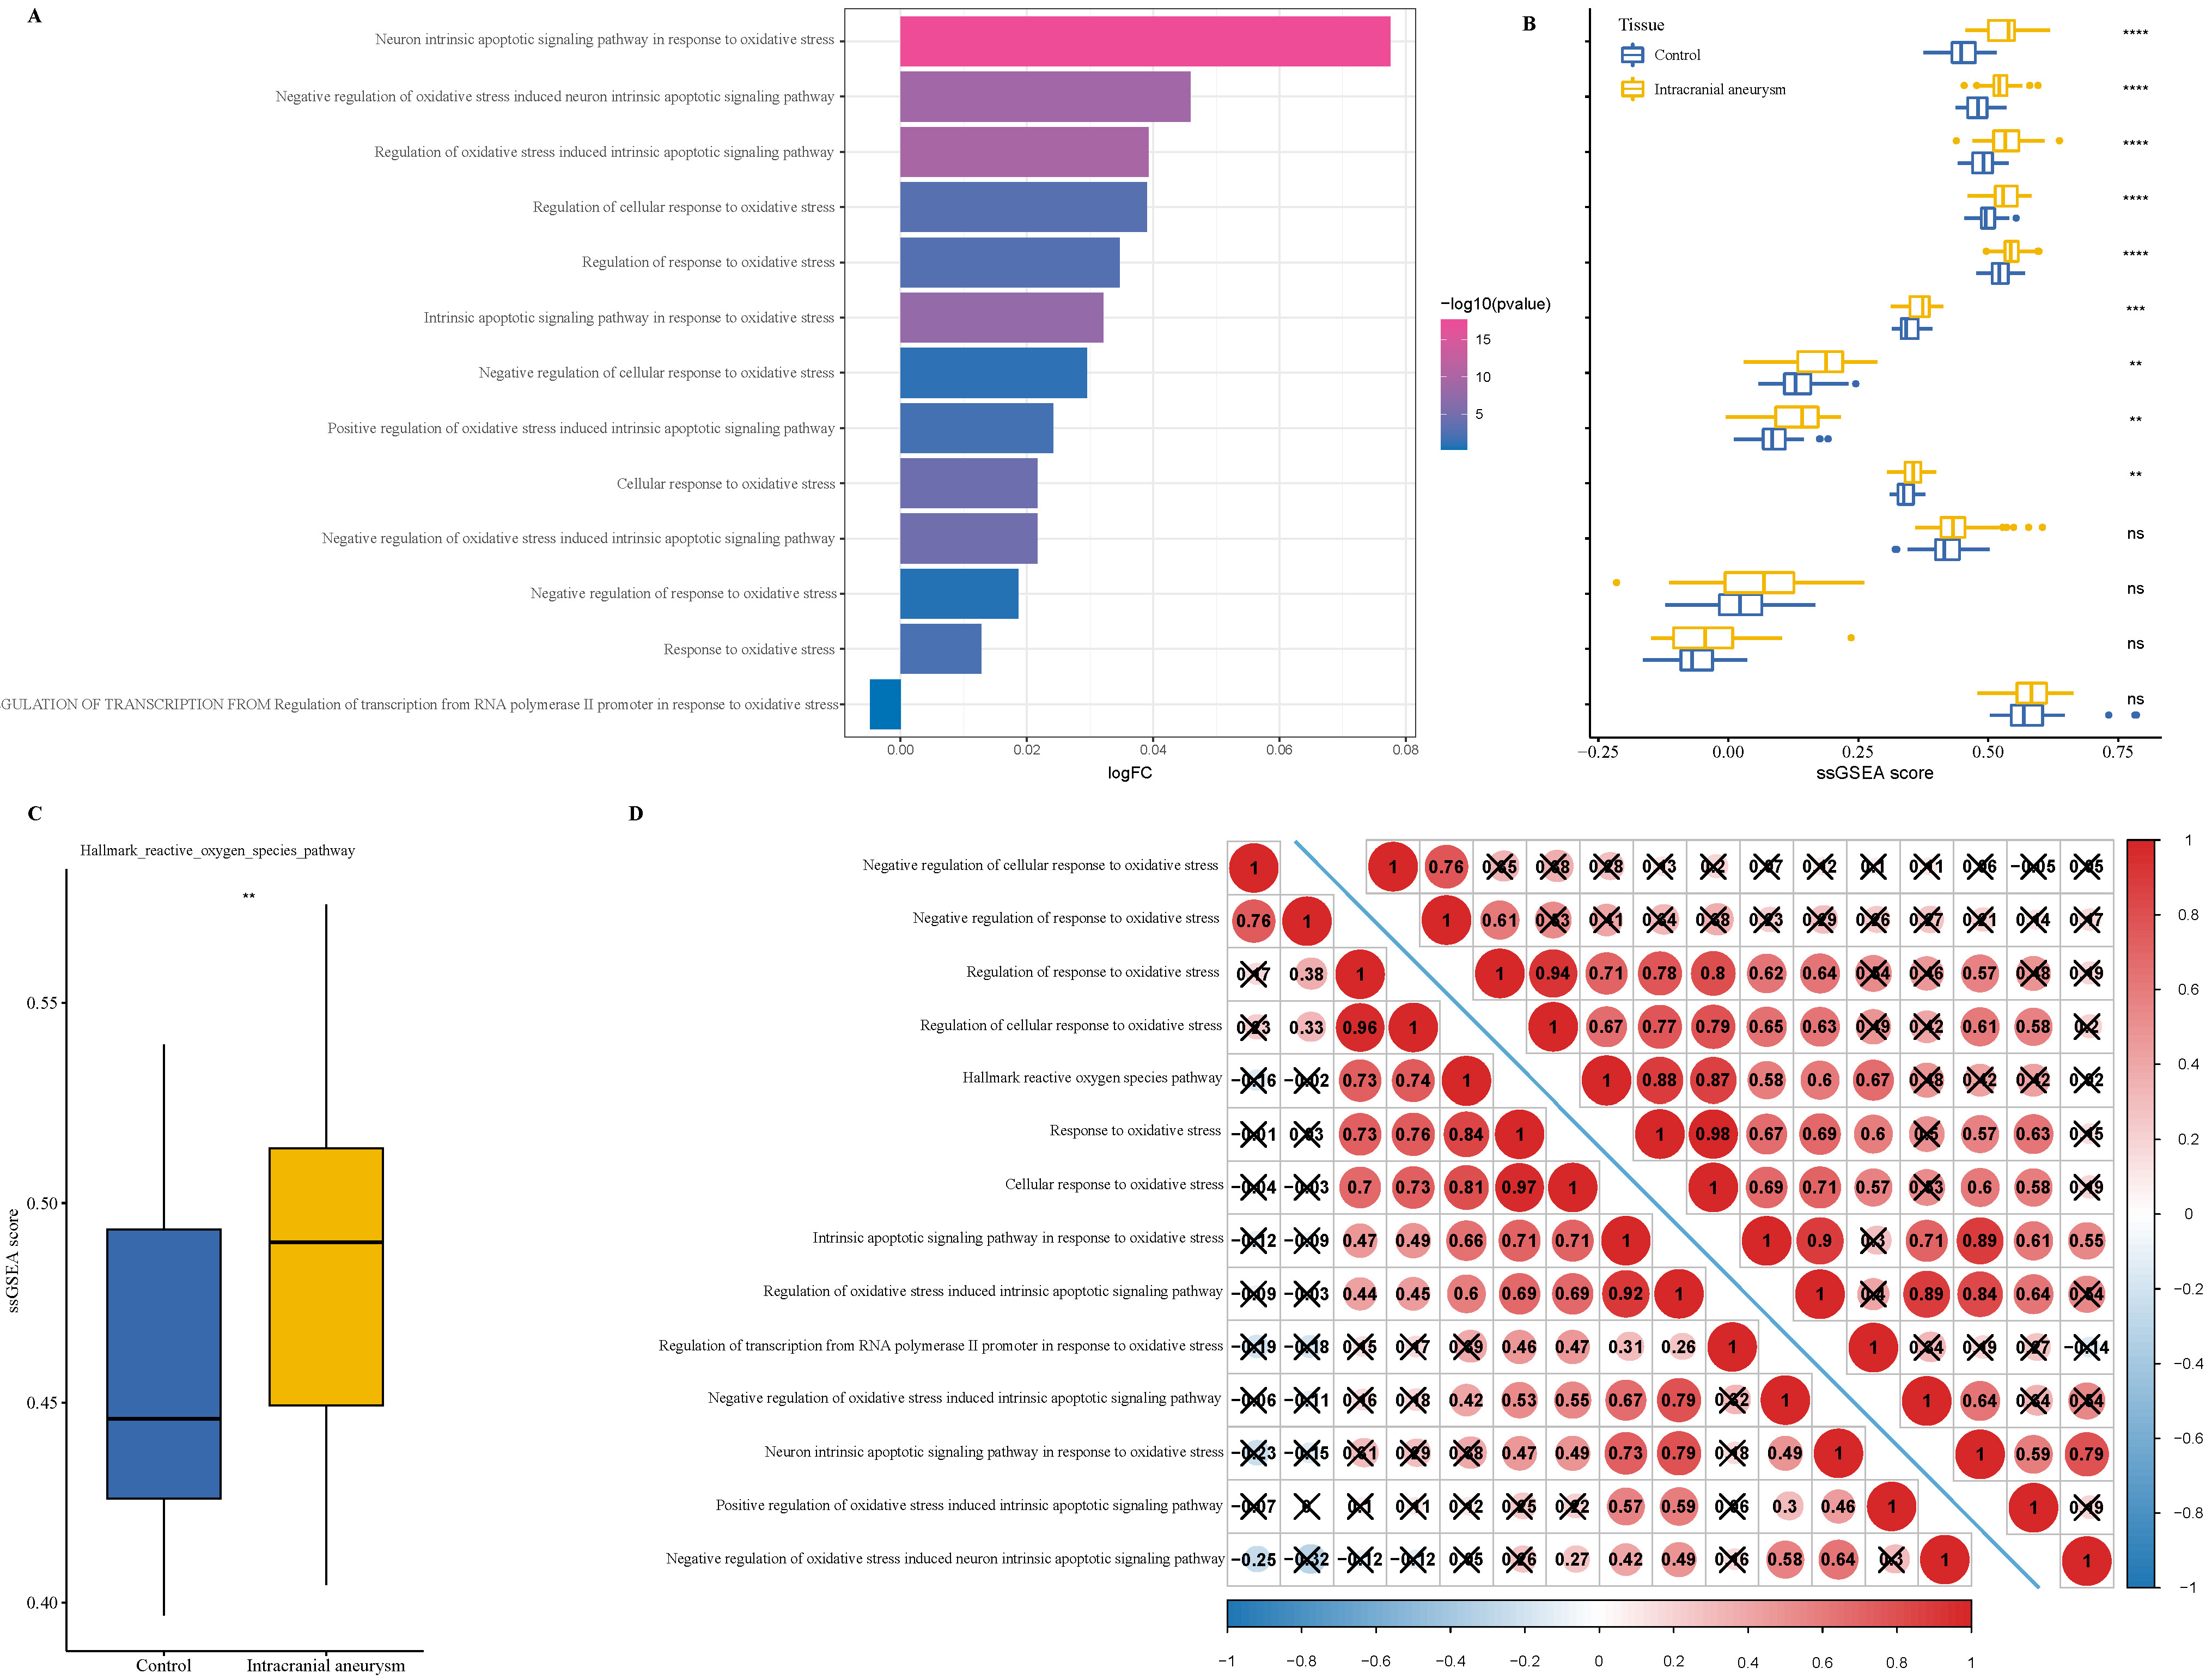 Fig. 1.
The enrichment analysis of oxidative stress pathways in
intracranial aneurysm (IA) progression. (A) The single-sample gene set
enrichment analysis (ssGSEA) of 13 oxidative stress pathways in Gene Expression
Omnibus (GEO)–IA cohort. (B) The difference in ssGSEA between IA and control
samples in 13 oxidative stress pathways. (C) The enrichment of hallmark reactive
oxygen species (ROS) pathway in IA and control samples. (D) Correlation analysis
between 13 oxidative stress pathways in IA and control samples (upper triangle
represented the control samples; lower triangle represented the IA samples). ns
p
The ssGSEA score of metabolism pathways was computed to explore the metabolic
difference. In carbohydrate metabolism, multiple metabolic pathways, such as the
fructose and mannose and amino sugar and nucleotide sugar metabolism, starch and
sucrose, galactose, pentose phosphate pathway (PPP), were
significantly activated in the IA samples, while the pyruvate, propanoate,
ascorbate and aldarate metabolism pathways butanoate, glyoxylate and
dicarboxylate were significantly activated in the control samples (p
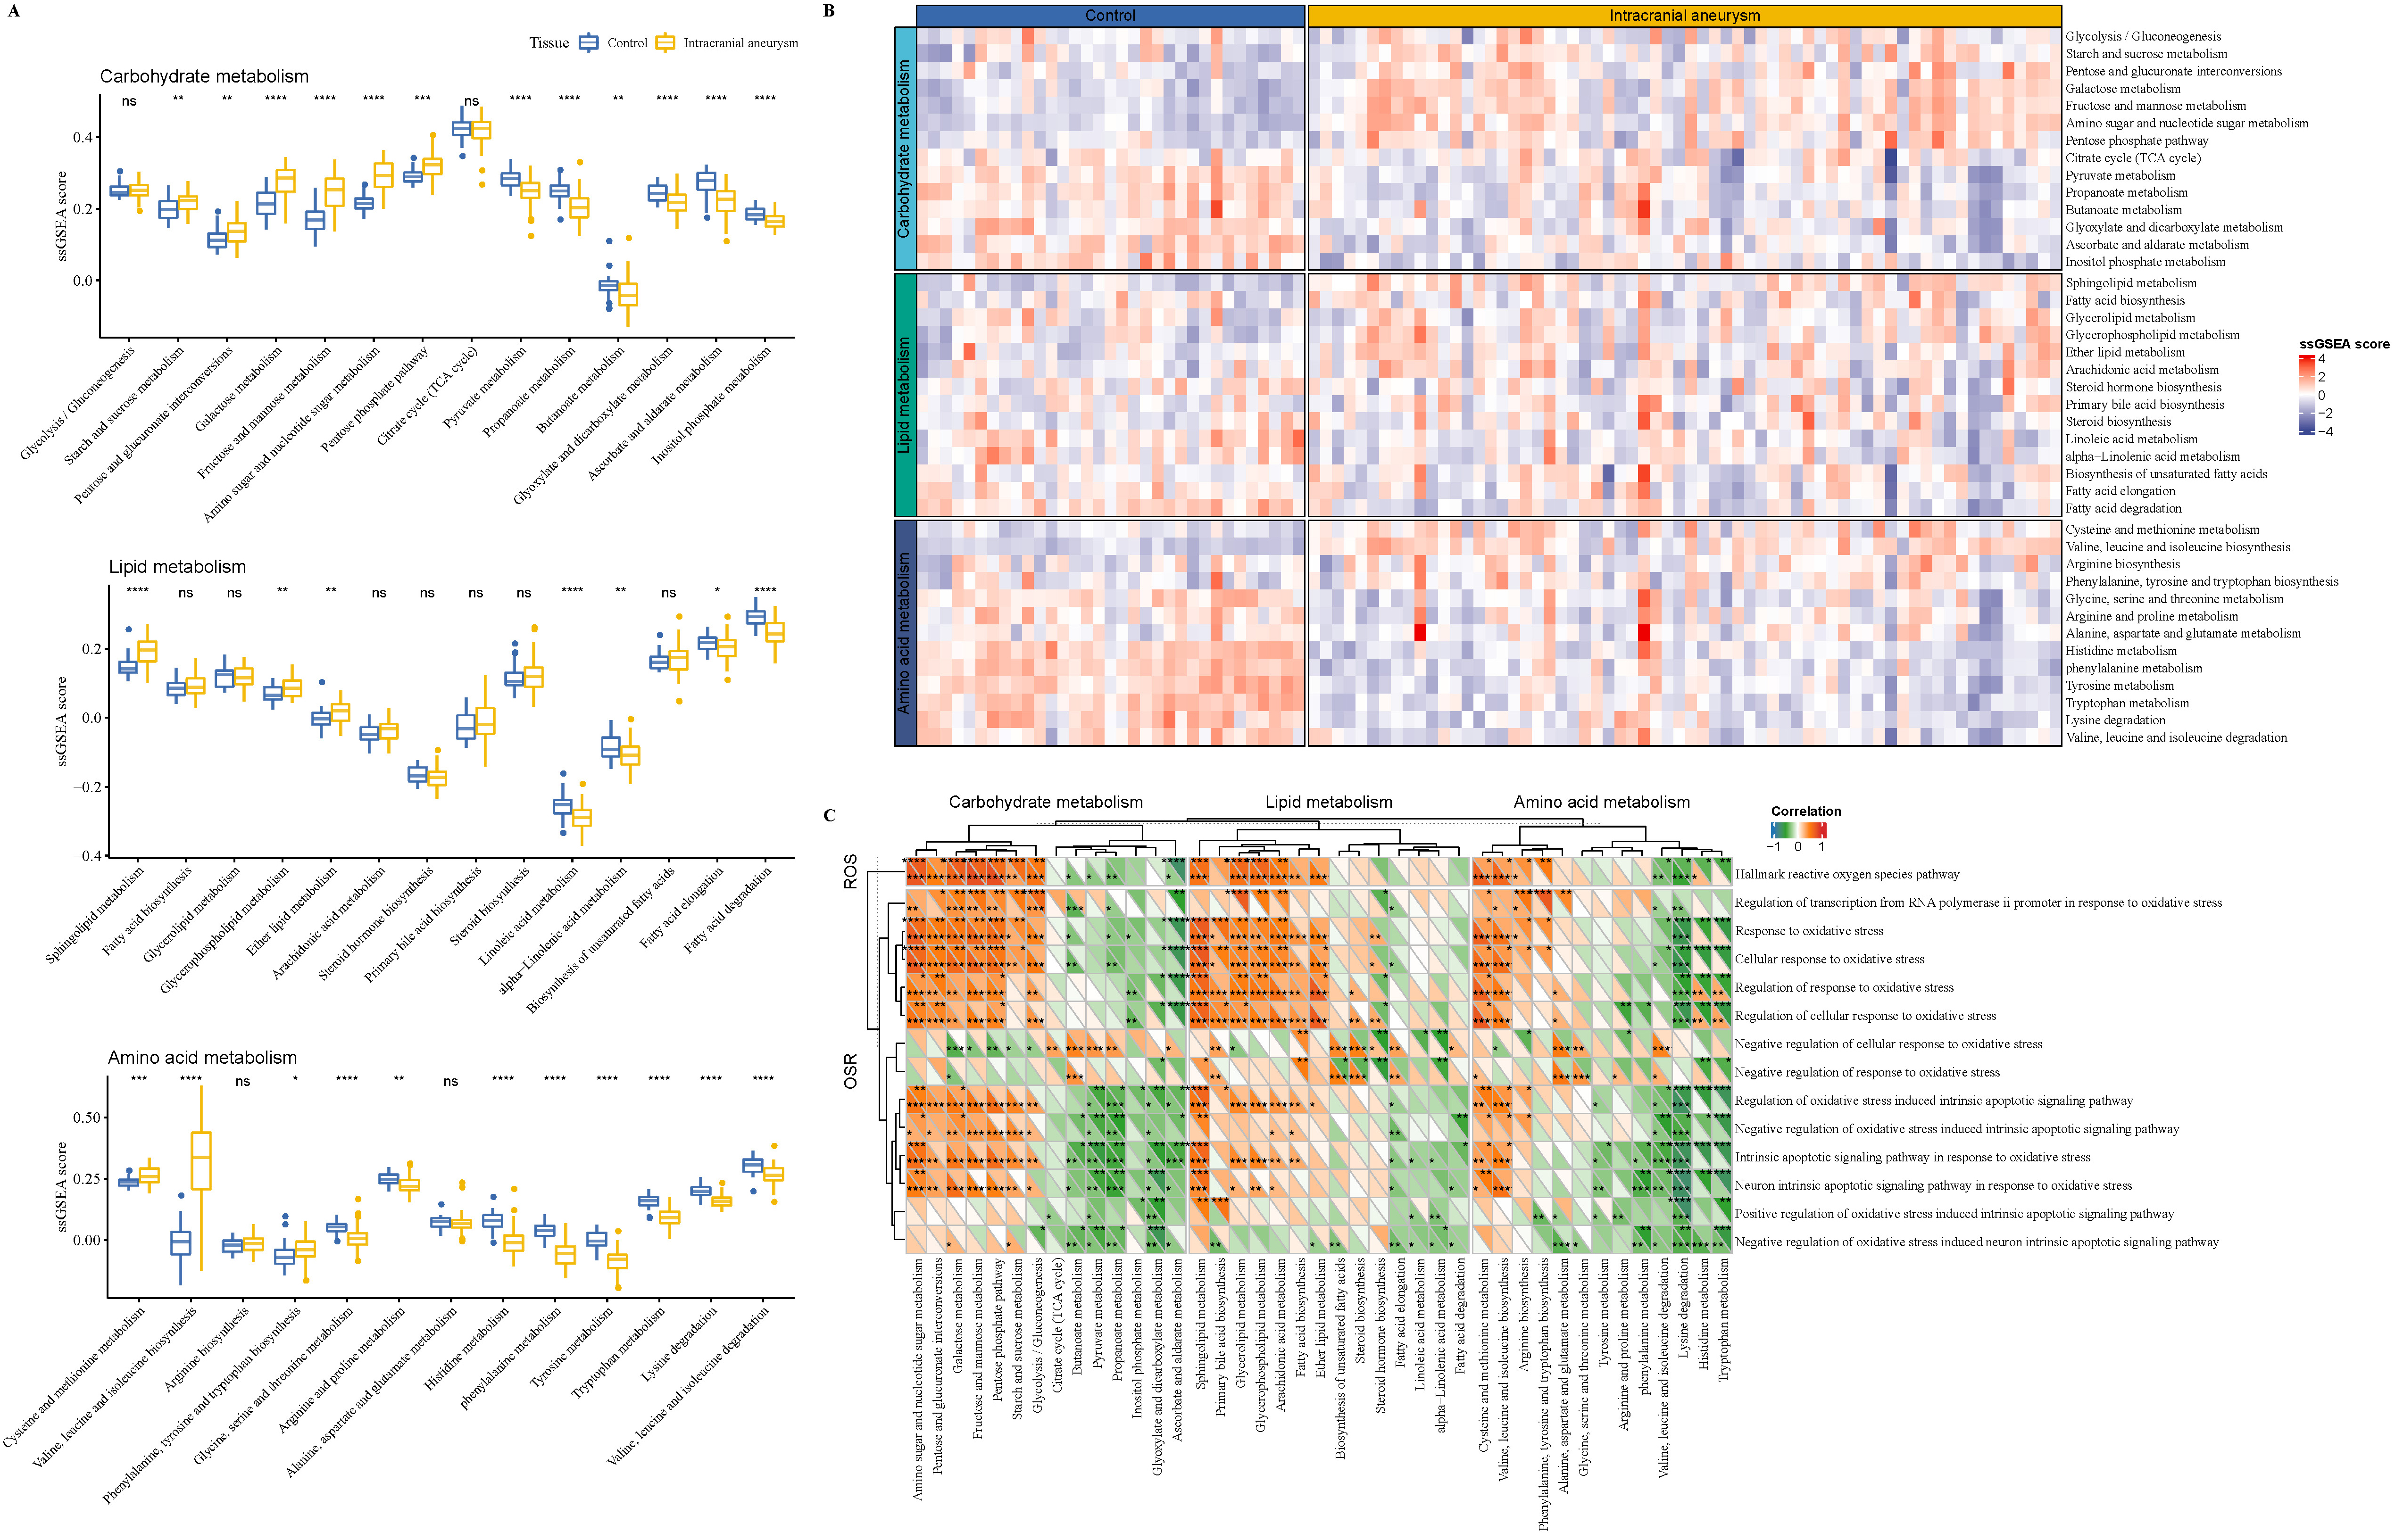 Fig. 2.
The enrichment analysis of metabolism pathways in IA
progression. (A) The enrichment of carbohydrate, lipid, and amino acid metabolic
pathways in IA and control samples. (B) The carbohydrate, lipid, and amino acid
metabolic enrichment heatmap for IA and control samples. (C) The correlation
analysis between oxidative stress pathways and metabolism pathways in IA and
control samples (upper triangle represented the control samples; lower triangle
represented the IA samples). ROS, reactive oxygen species; OSR, oxidative stress response. ns p
Furthermore, we calculated the immune infiltration-related score to explore differences in tumor microenvironment (TME) difference in the two types of samples. The ESTIMATE analysis showed that IA samples had significantly higher stromal, immune, and ESTIMATE scores than the control samples (Fig. 3A); meanwhile, the inflammation response pathways, including the MAPK, PI3K–Akt–mTOR, and IL6–JAK–STAT3 signaling pathways, also presented a significantly high ssGSEA score in the IA samples (Fig. 3B). In addition, CD8 T cells, gamma delta T cells, macrophages M2 and activated mast cells showed noticeably high infiltration levels, contributing to an immune response in the IA samples, while the naïve B cells, resting mast cells, and resting CD4 memory T cells had been significantly infiltrated in the control samples (Fig. 3C). The correlation analysis between the immune infiltration and oxidative stress pathways demonstrated that these inflammation-related pathways were closely correlated with theses oxidative stress pathways (Fig. 3D).
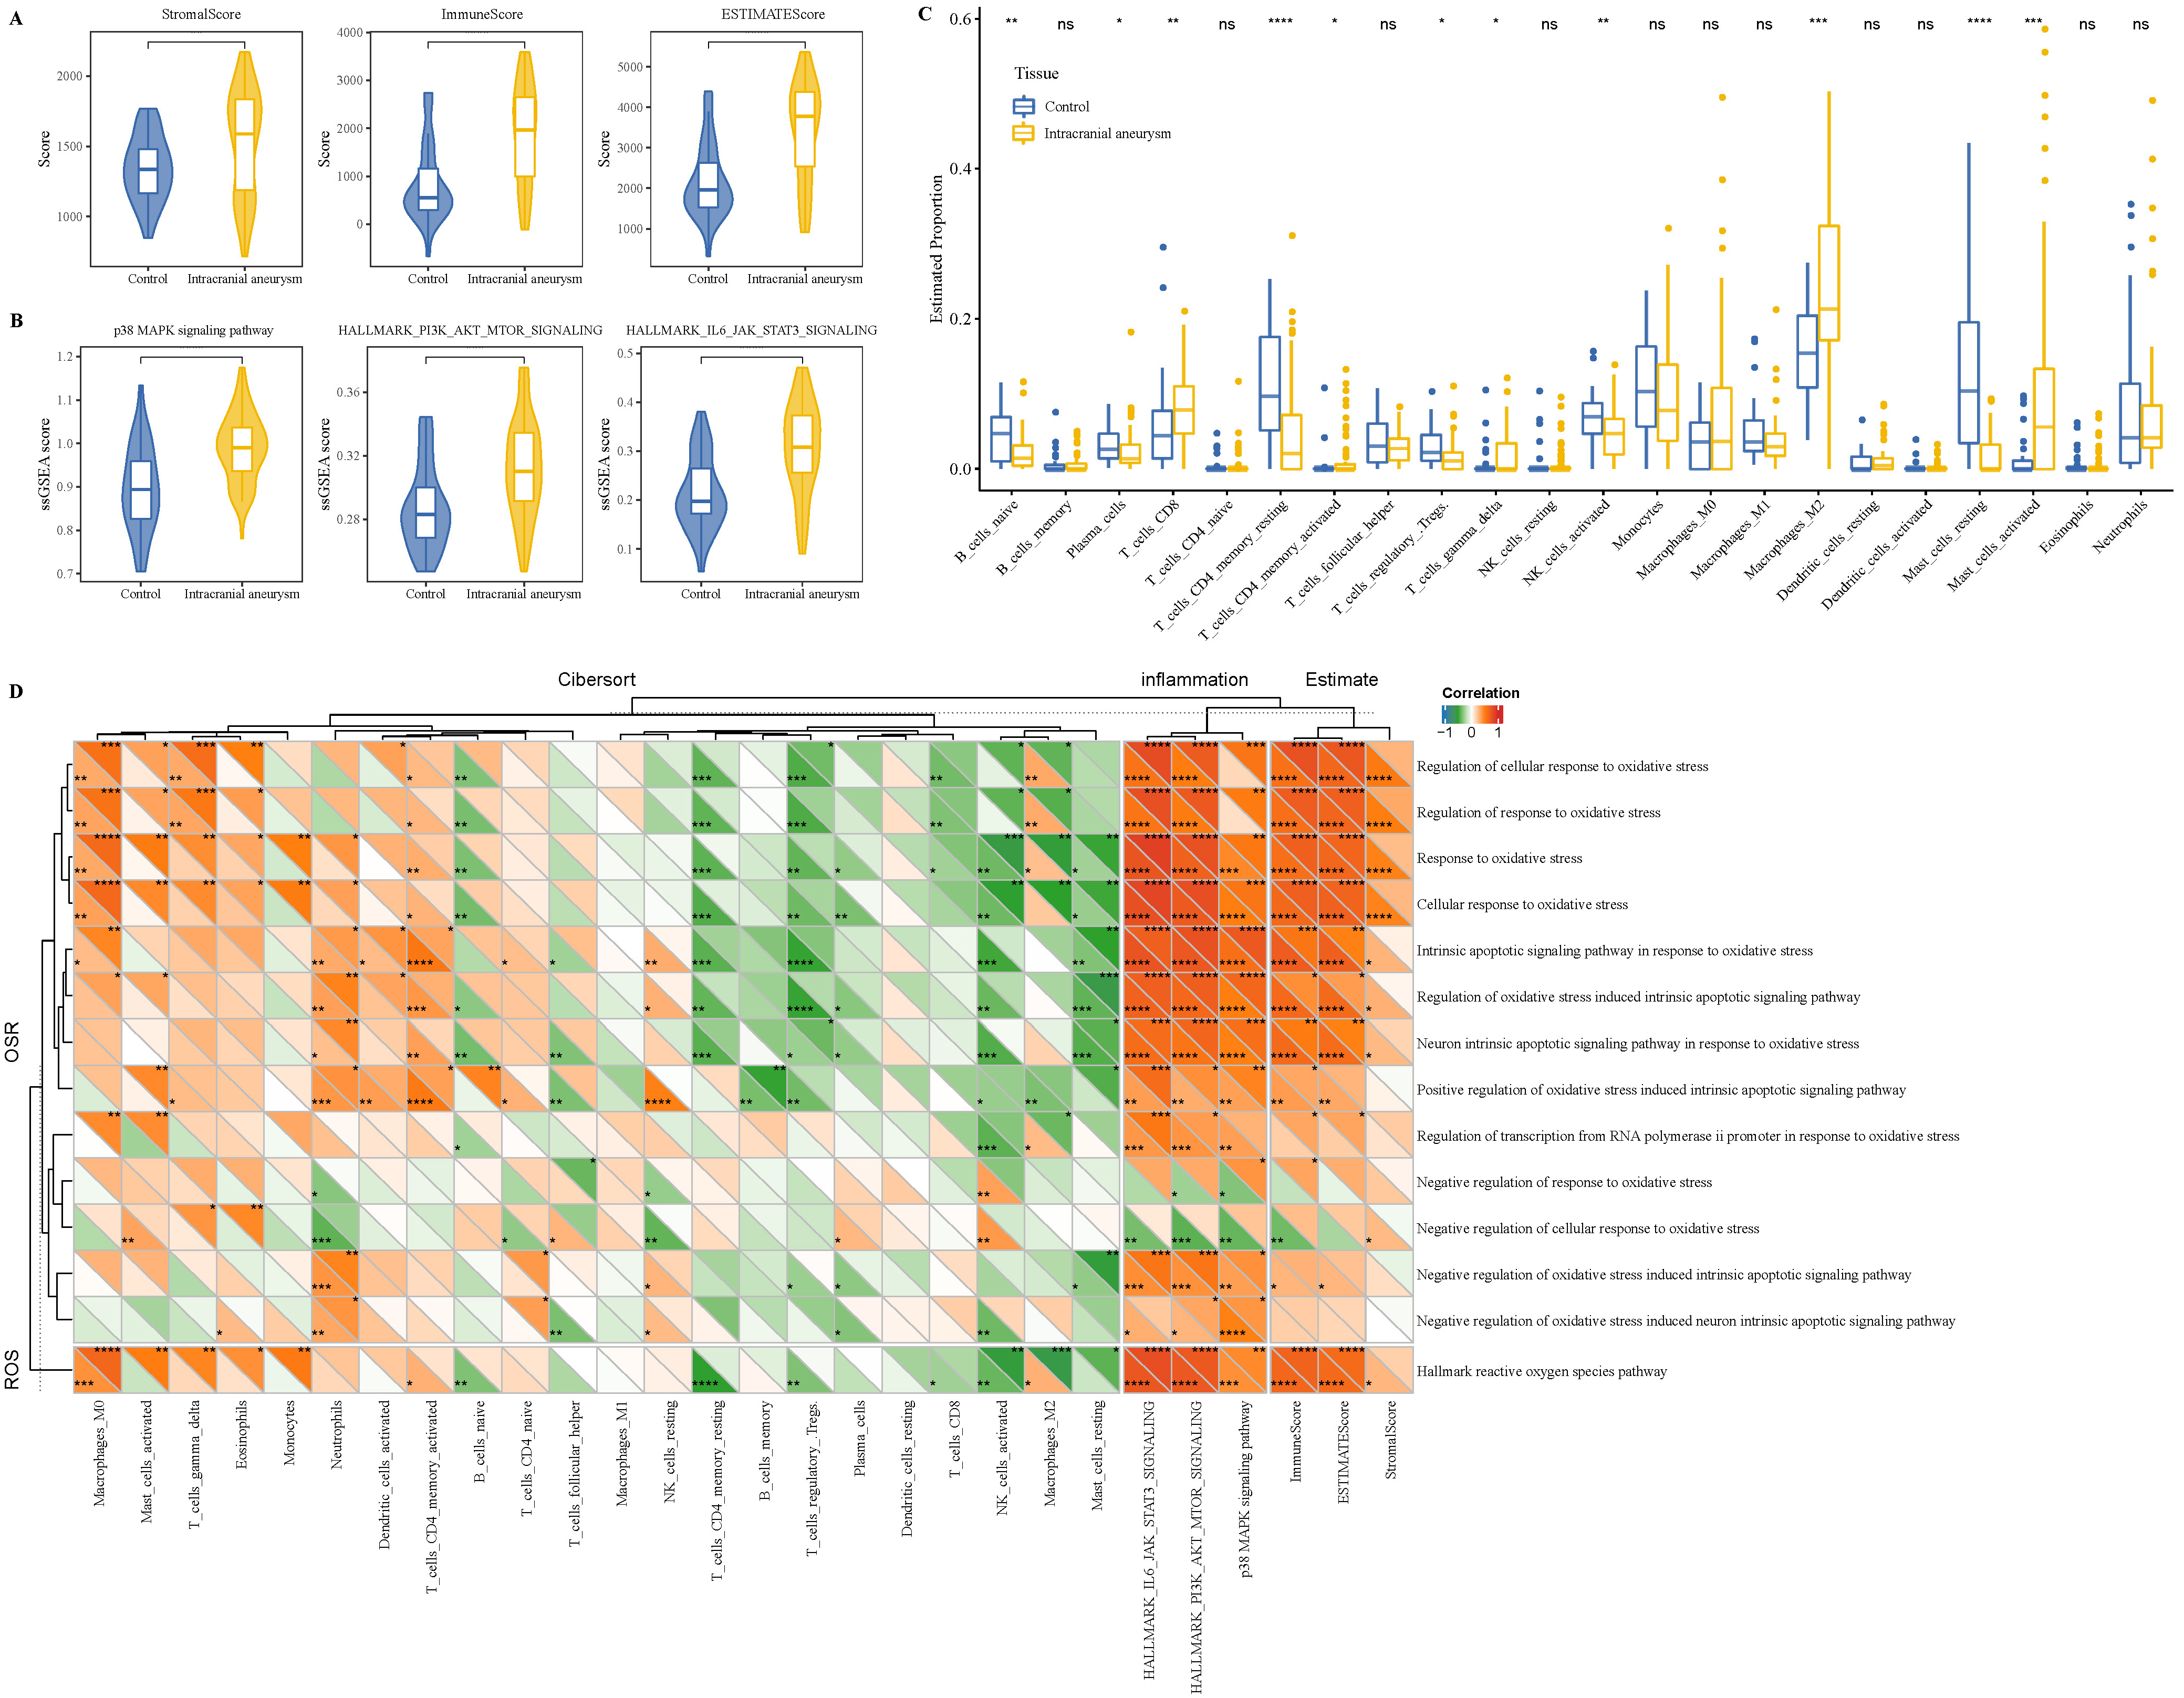 Fig. 3.
Immune infiltration difference between IA and control samples.
(A) ESTIMATE analysis between IA and control samples. (B) The ssGSEA of the
inflammation response pathway in IA and control samples. (C) CIBERPSORT analysis
between IA and control samples. (D) The correlation analysis between oxidative
stress pathways and immune infiltration in IA and control samples (upper triangle
represented the control samples; lower triangle represented the IA samples). ns
p
We performed WGCNA to classify oxidative stress-related gene modules. The top
70% of genes above the MAD were subjected to WGCNA under the soft threshold
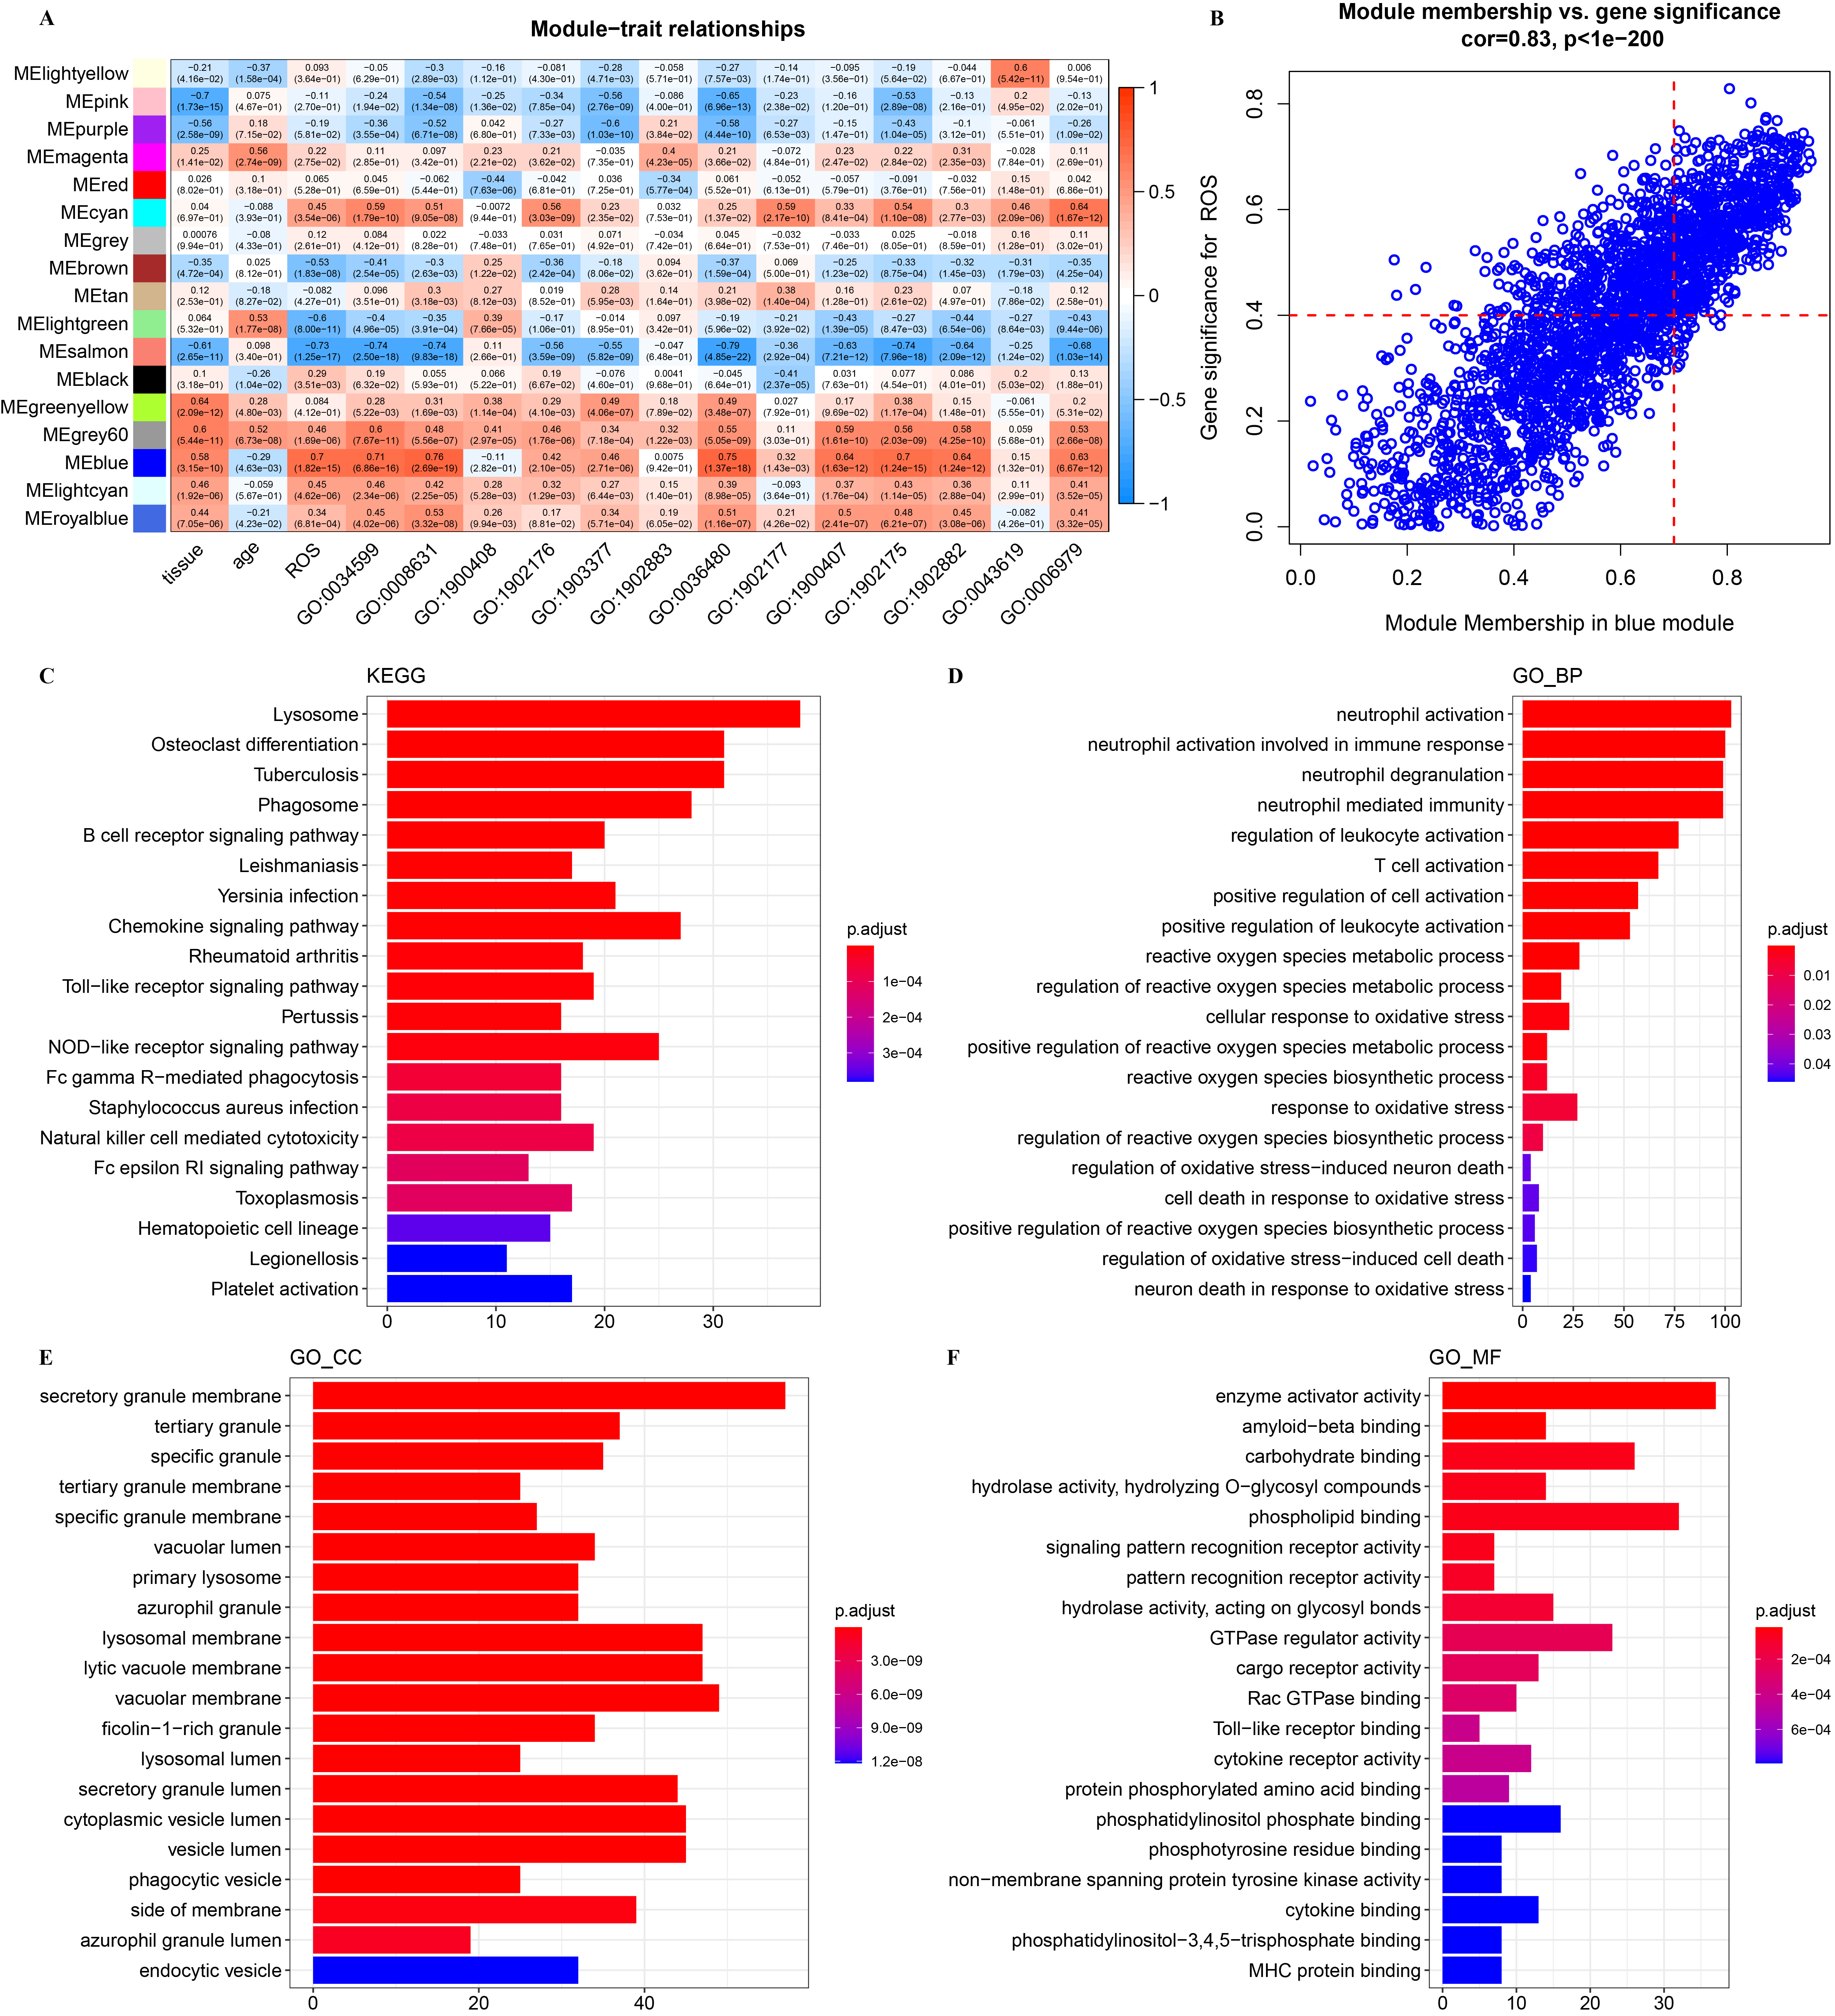 Fig. 4.
WGCNA for oxidative stress-related gene module. (A) Correlation
analysis between module eigengenes and clinical traits in the Gene Expression Omnibus (GEO). (B) The high
correlation between GS and MM in the blue module (p
Analysis of the DEGs between the IA and control samples determined 770 DEGs (Fig. 5A), among which 380 genes were upregulated and 390 were downregulated (Fig. 5B). The function enrichment of these upregulated genes indicated that they were closely associated with the neutrophil immune activation, cytokine production, biotic stimulus, and oxidative stress pathways (Fig. 5C). Interestingly, neutrophil peroxidases have been reported as a potent source of oxidative stress [49]. These downregulated genes were closely associated with muscle and circulation regulation and the tissue differentiation pathway (Fig. 5D). The results of the GSEA showed that the oxidative stress pathways, such as the neuron intrinsic apoptotic signaling pathway in the intrinsic apoptotic signaling pathway, cellular response to oxidative stress, response oxidative stress in response to oxidative stress, were significantly enriched in the IA samples (Fig. 5E). Overall, these results suggest that the abnormal activation of the oxidative stress pathway was significantly associated with IA progression.
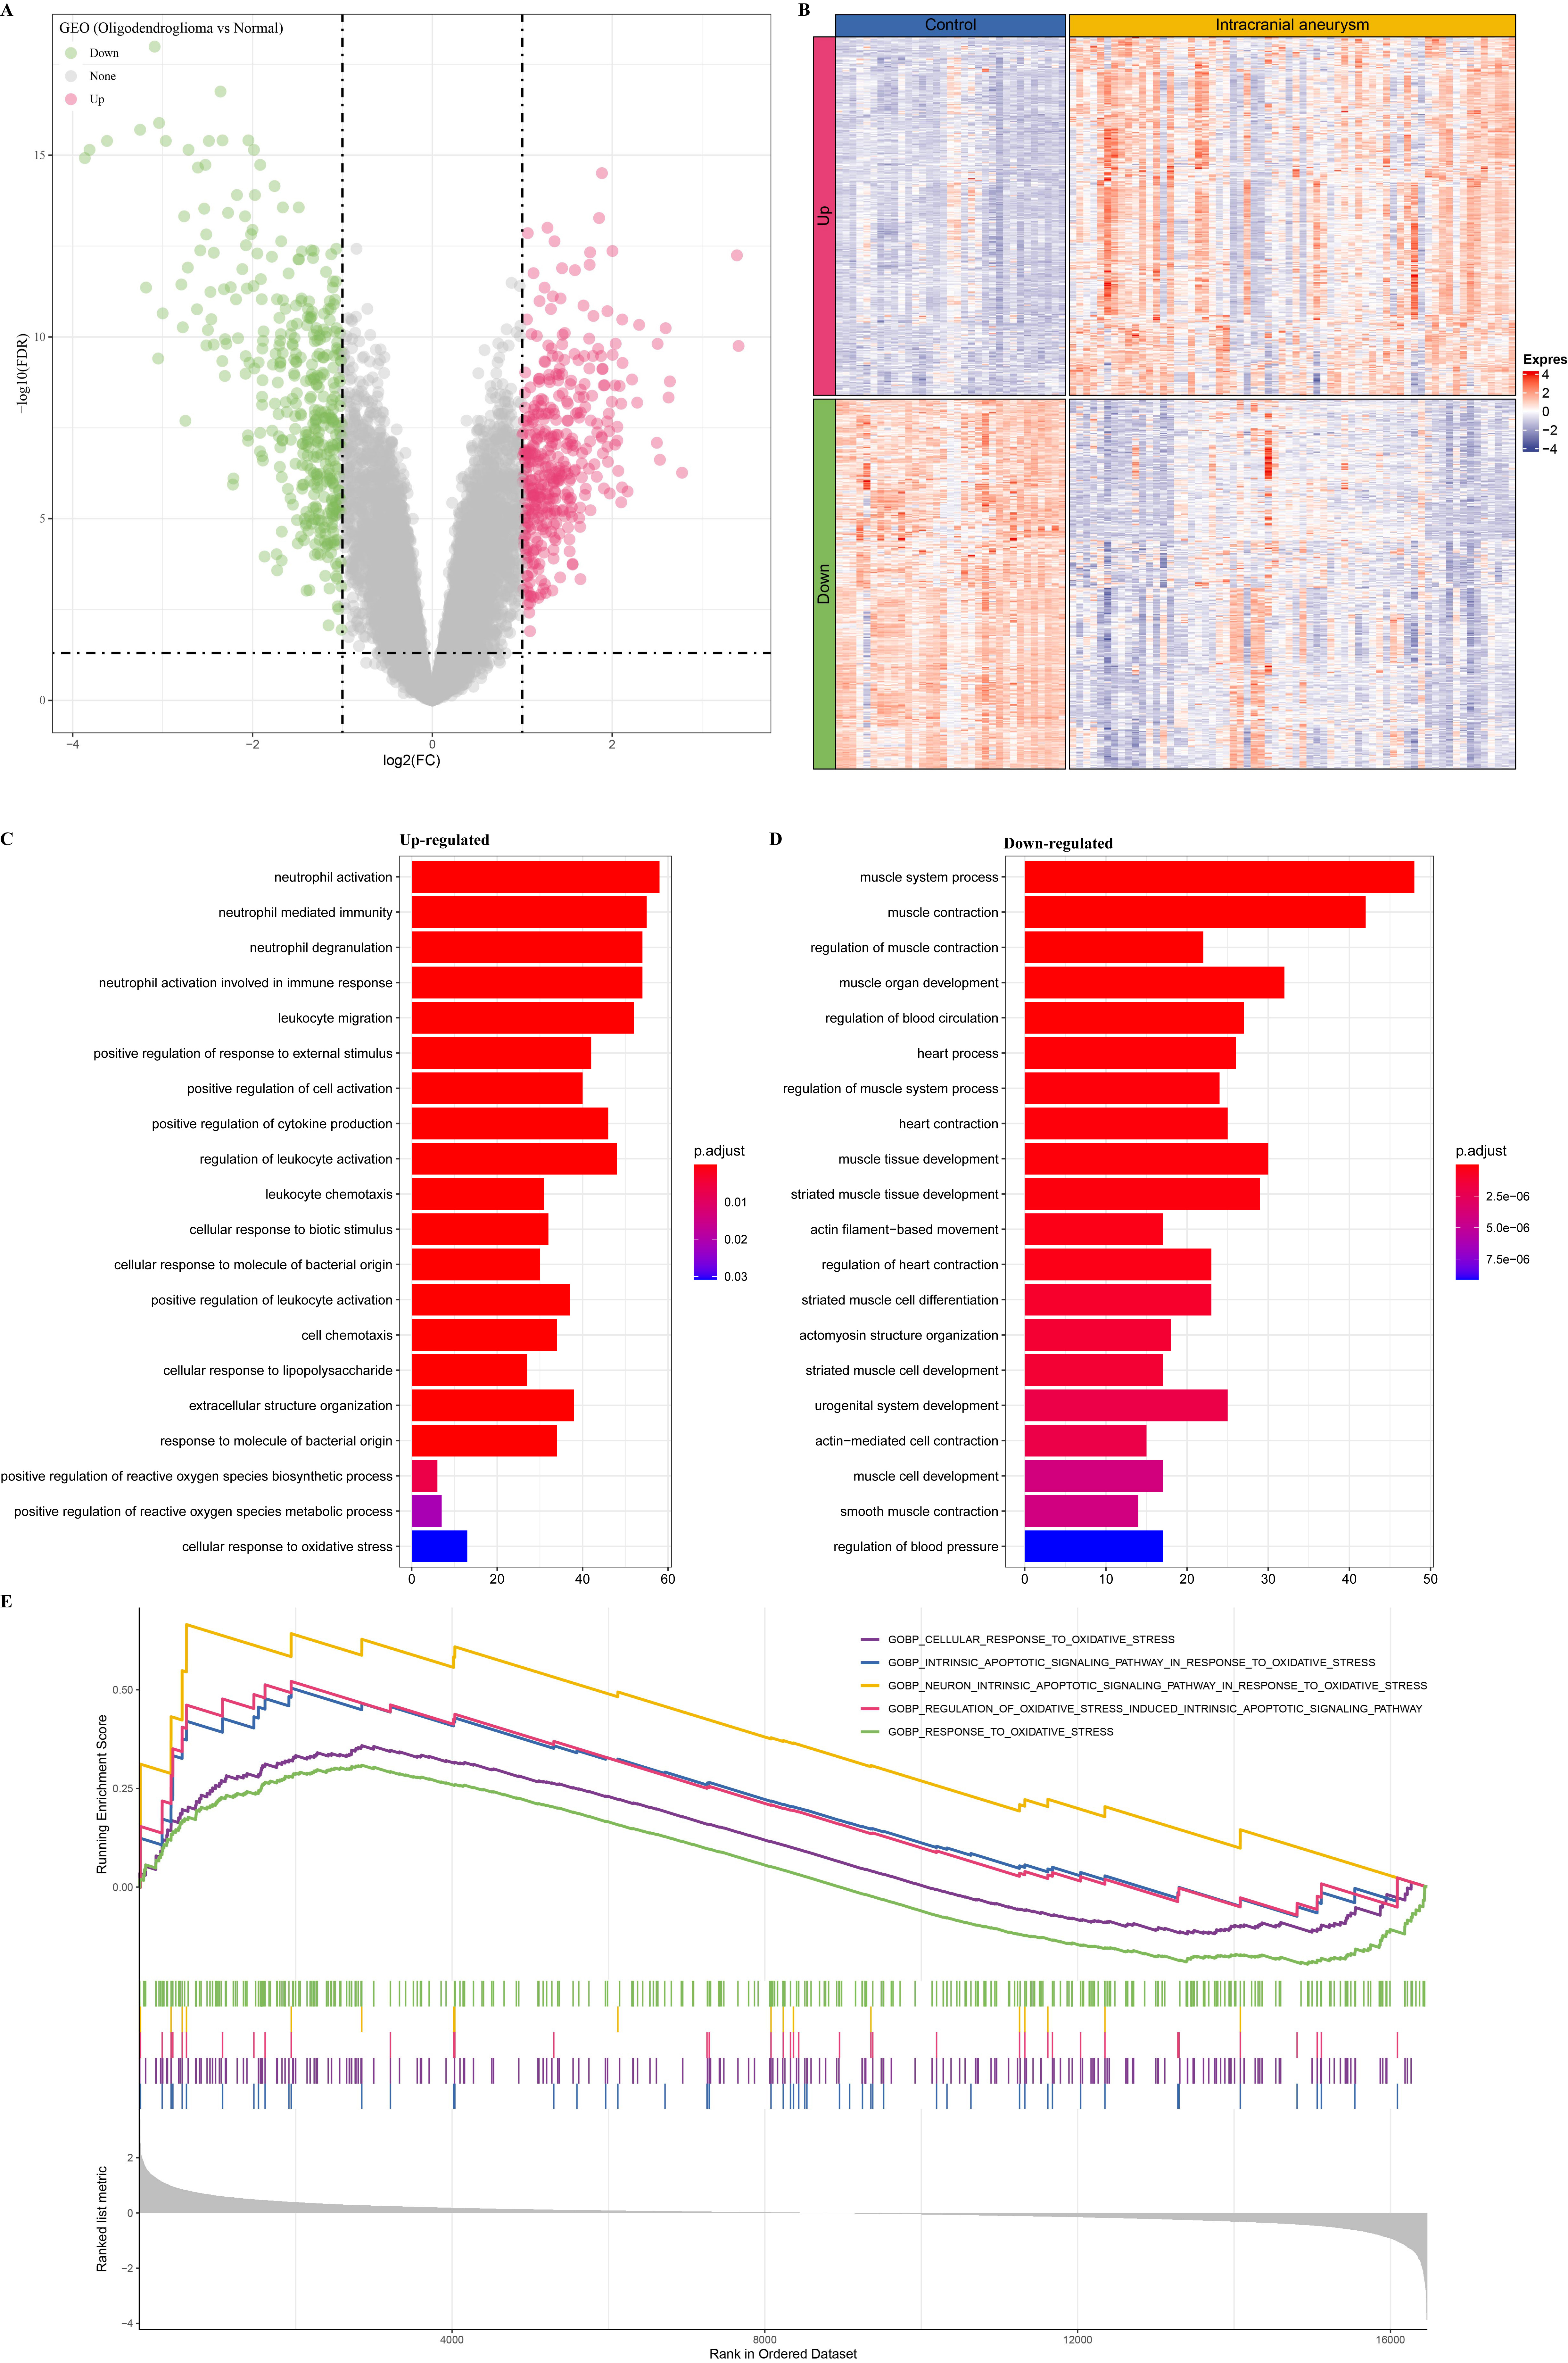 Fig. 5.
Differential expression analysis in IA and control samples. (A) Identification of differentially expressed genes (DEGs) between IA and control samples. (B) The heatmap of DEGs in IA and control samples. (C) The enrichment analysis of upregulated genes. (D) The enrichment analysis of downregulated genes. (E) The GSEA of IA samples.
We obtained 209 upregulated key oxidative stress-related genes from the intersection between the 171 upregulated DEGs and the 610 key oxidative stress-related genes identified by WGCNA (Fig. 6A). Thus, we aimed to identify the key biomarkers of oxidative stress for IA from these 209 genes. First, 13 potential biomarker candidate genes were detected by running the SVM-RFE algorithm (Fig. 6B). Next, we used the Lasso–Cox regression analysis to identify 10 potential biomarker candidate genes (Fig. 6C). Finally, the RF algorithm screened 10 crucial genes associated with the oxidative stress response (Fig. 6D). The Venn plot of these above candidate genes showed that FLVCR2, SDSL, TBC1D2, and SLC31A1 in the intersection (Fig. 7A) could be defined as the key markers associated with oxidative stress for the diagnosis of IA.
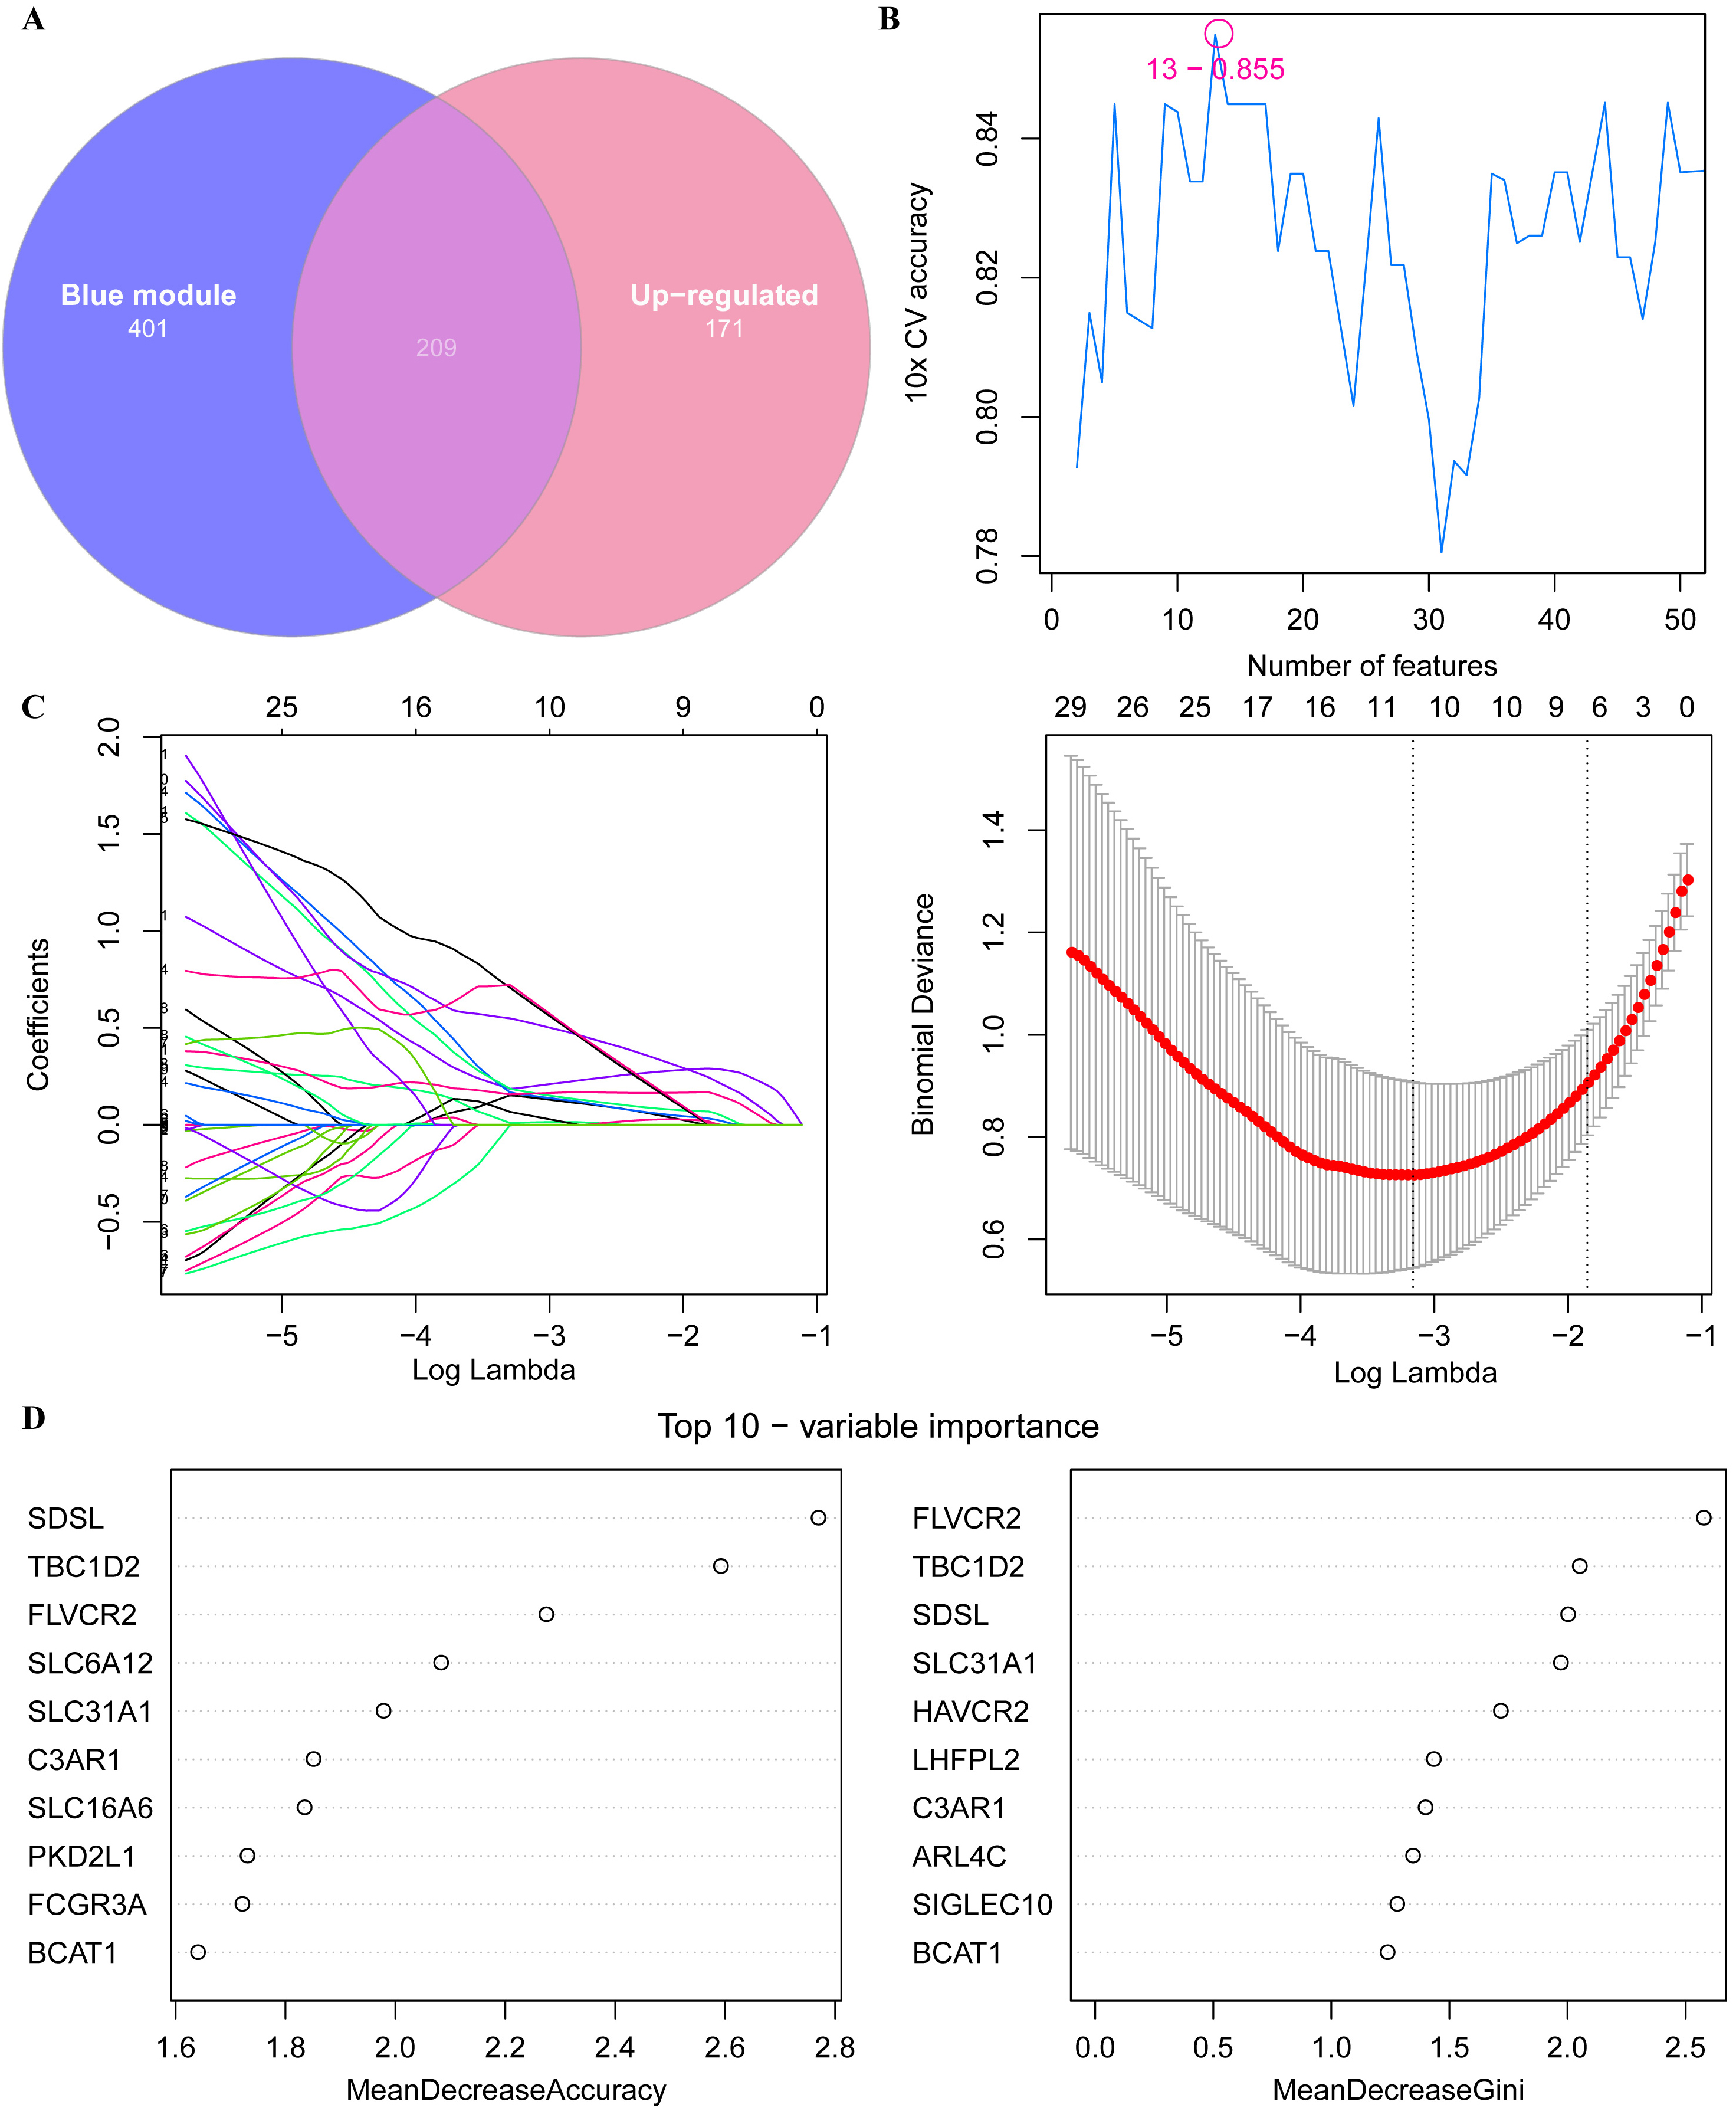 Fig. 6.
Screening key oxidative stress-related biomarkers for IA patients. (A) Venn plot of the upregulated DEGs and key oxidative stress-related module genes. (B) SVM-RFE-screened biomarkers. (C) Lasso-logistic regression algorithm for screening diagnostic markers. (D) Using random forest (RF) algorithm for screening biomarkers.
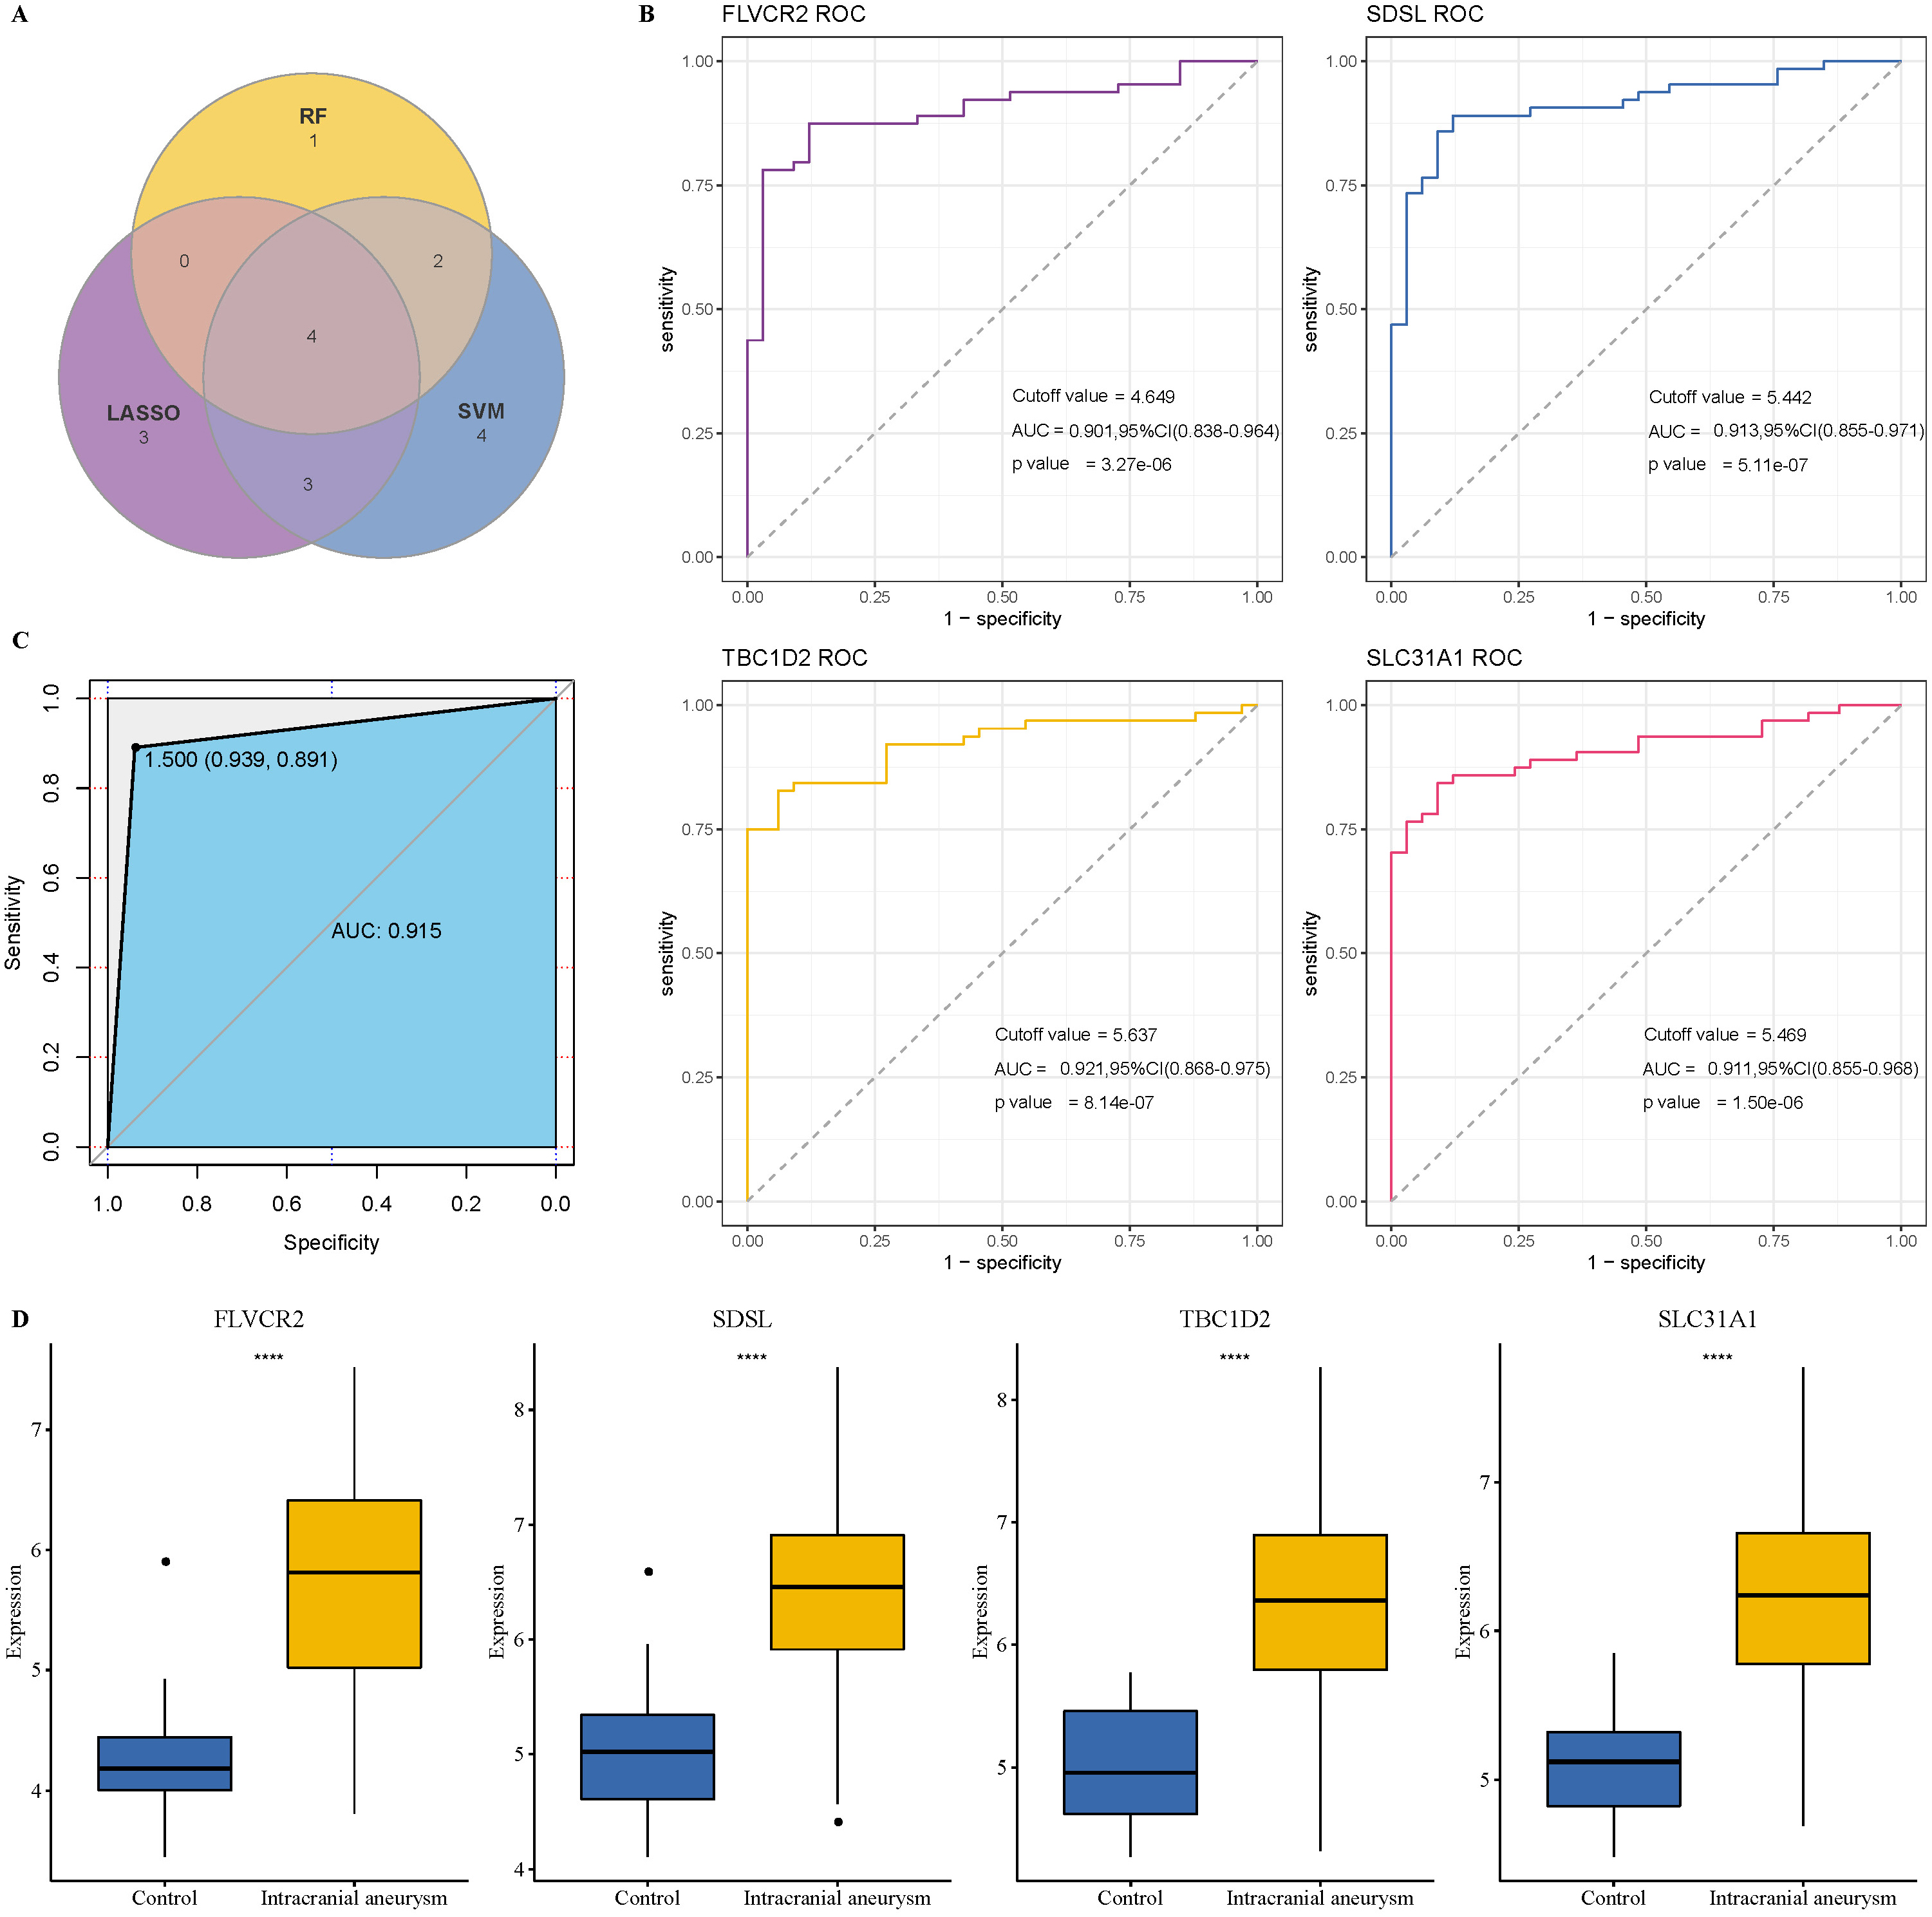 Fig. 7.
Verification of the diagnostic biomarkers. (A) Venn plot of key
biomarkers identified by SVM-RFE, Lasso, and RF algorithms. (B) ROC analysis of
the four biomarkers for verifying diagnostic performance. (C) Receiver operating characteristic (ROC) analysis of the
combination of the four biomarkers for verifying diagnostic performance. (D) The
expression differences in the four biomarkers in the IA and control samples.
****p
We performed the ROC analysis for each gene to explore the clinical value of these four genes in diagnosing IA. The results showed that the AUC values of FLVCR2, SDSL, TBC1D2, and SLC31A1 were as high as 0.901, 0.913, 0.921, and 0.911, respectively (Fig. 7B), indicating that these four biomarkers had a high predictive value accuracy. Moreover, the combination of these four genes reached an AUC of 0.951 (Fig. 7C), which showed that the combined use of these four biomarkers also had excellent classification performance and clinical diagnostic value. In addition, these genes were significantly highly expressed in IA patients (Fig. 7D). Vascular smooth muscle cells play an important role in the formation and development of IA [50]. Therefore, to validate the potential impact of these four biomarkers on IA development further, we detected their expression in human brain VSMCs using qRT-PCR. As shown in Supplementary Fig. 2, the expressions of FLVCR2, SDSL, TBC1D2, and SLC31A1 were significantly upregulated in human brain VSMCs compared to the controls.
The correlation analysis between the four biomarkers and oxidative stress
pathways was performed. The results showed that the FLVCR2 expression was
significantly positively correlated with multiple oxidative stress pathways, such
as the regulation of the response, cellular response, and intrinsic apoptotic
signaling pathway in response to oxidative stress (p
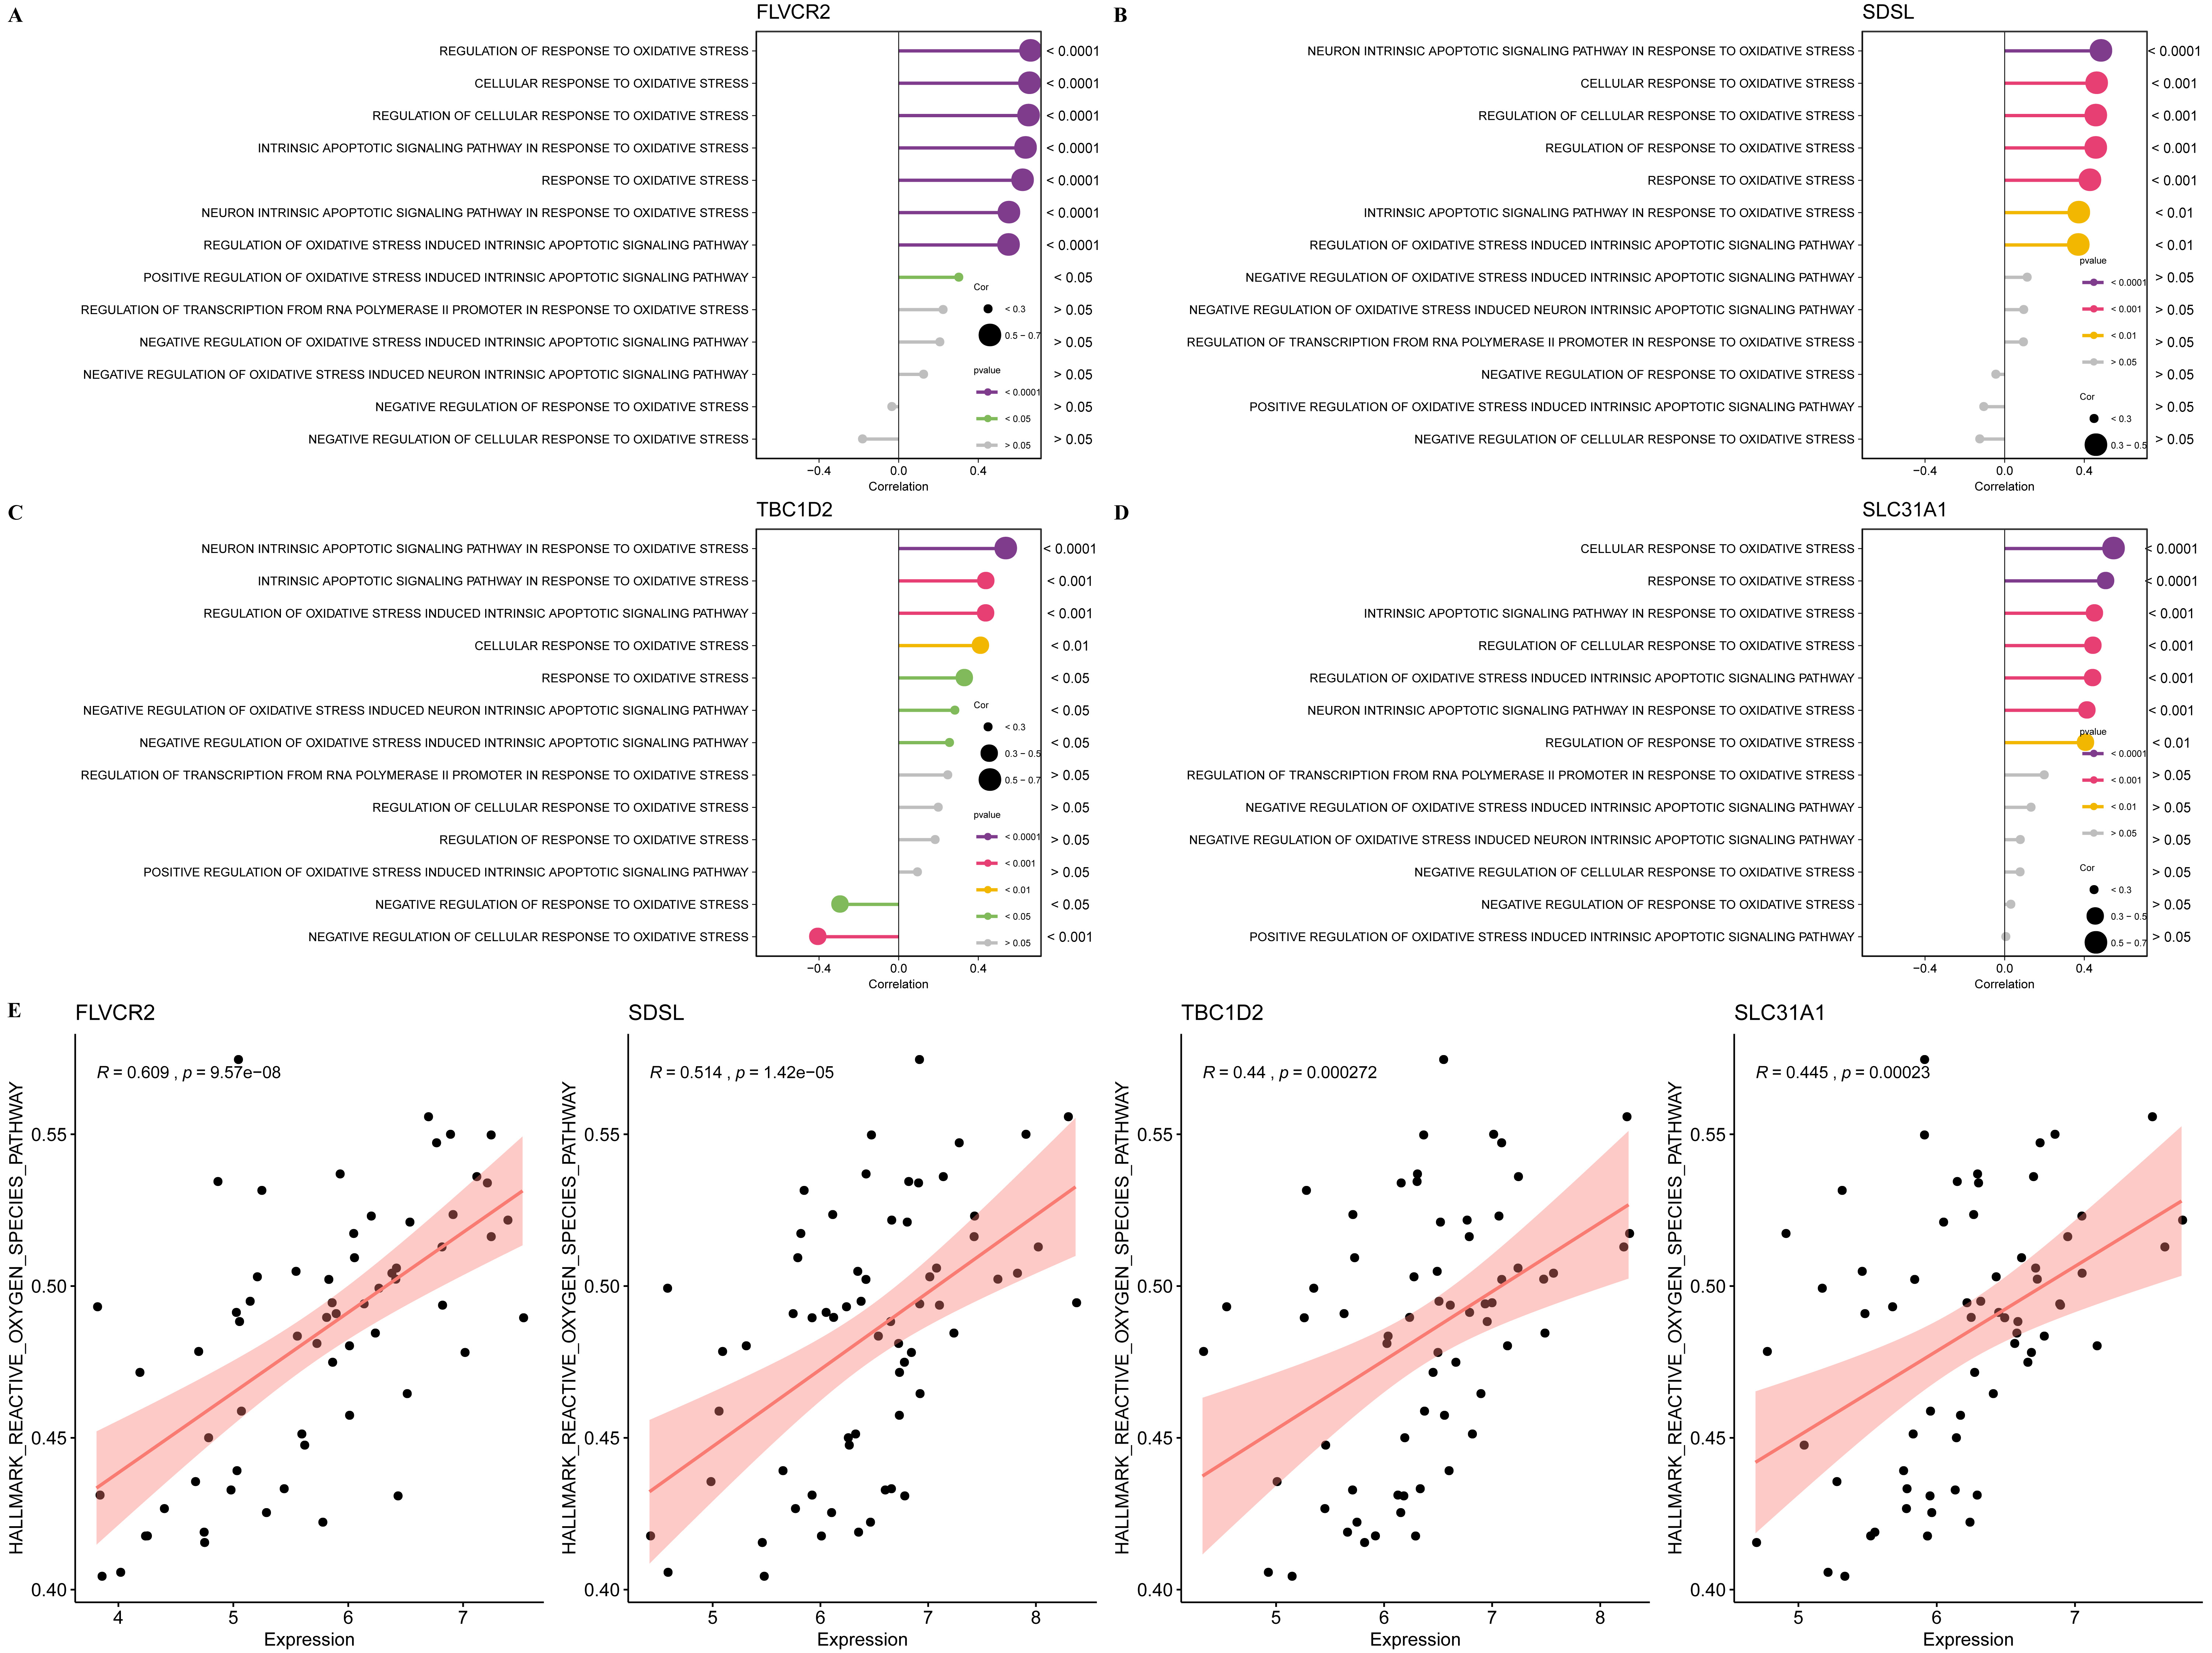 Fig. 8.
The relationship between the four biomarkers and oxidative stress activation. (A) The correlation between oxidative stress pathways and FLVCR2 expression. (B) The correlation between oxidative stress pathways and SDSL expression. (C) The correlation between oxidative stress pathways and TBC1D2 expression. (D) The correlation between oxidative stress pathways and SLC31A1 expression. (E) The correlation between ssGSEA of ROS pathway and the expression of the four biomarkers.
Subsequently, the relationship between the biomarkers and immune infiltration
[51] was analyzed, and we observed that the expression of FLVCR2 was
significantly positively correlated with the infiltration of activated CD4 memory
T cells, macrophage M0 and M2 but significantly negatively correlated with
activated NK cells and naïve B cells (p
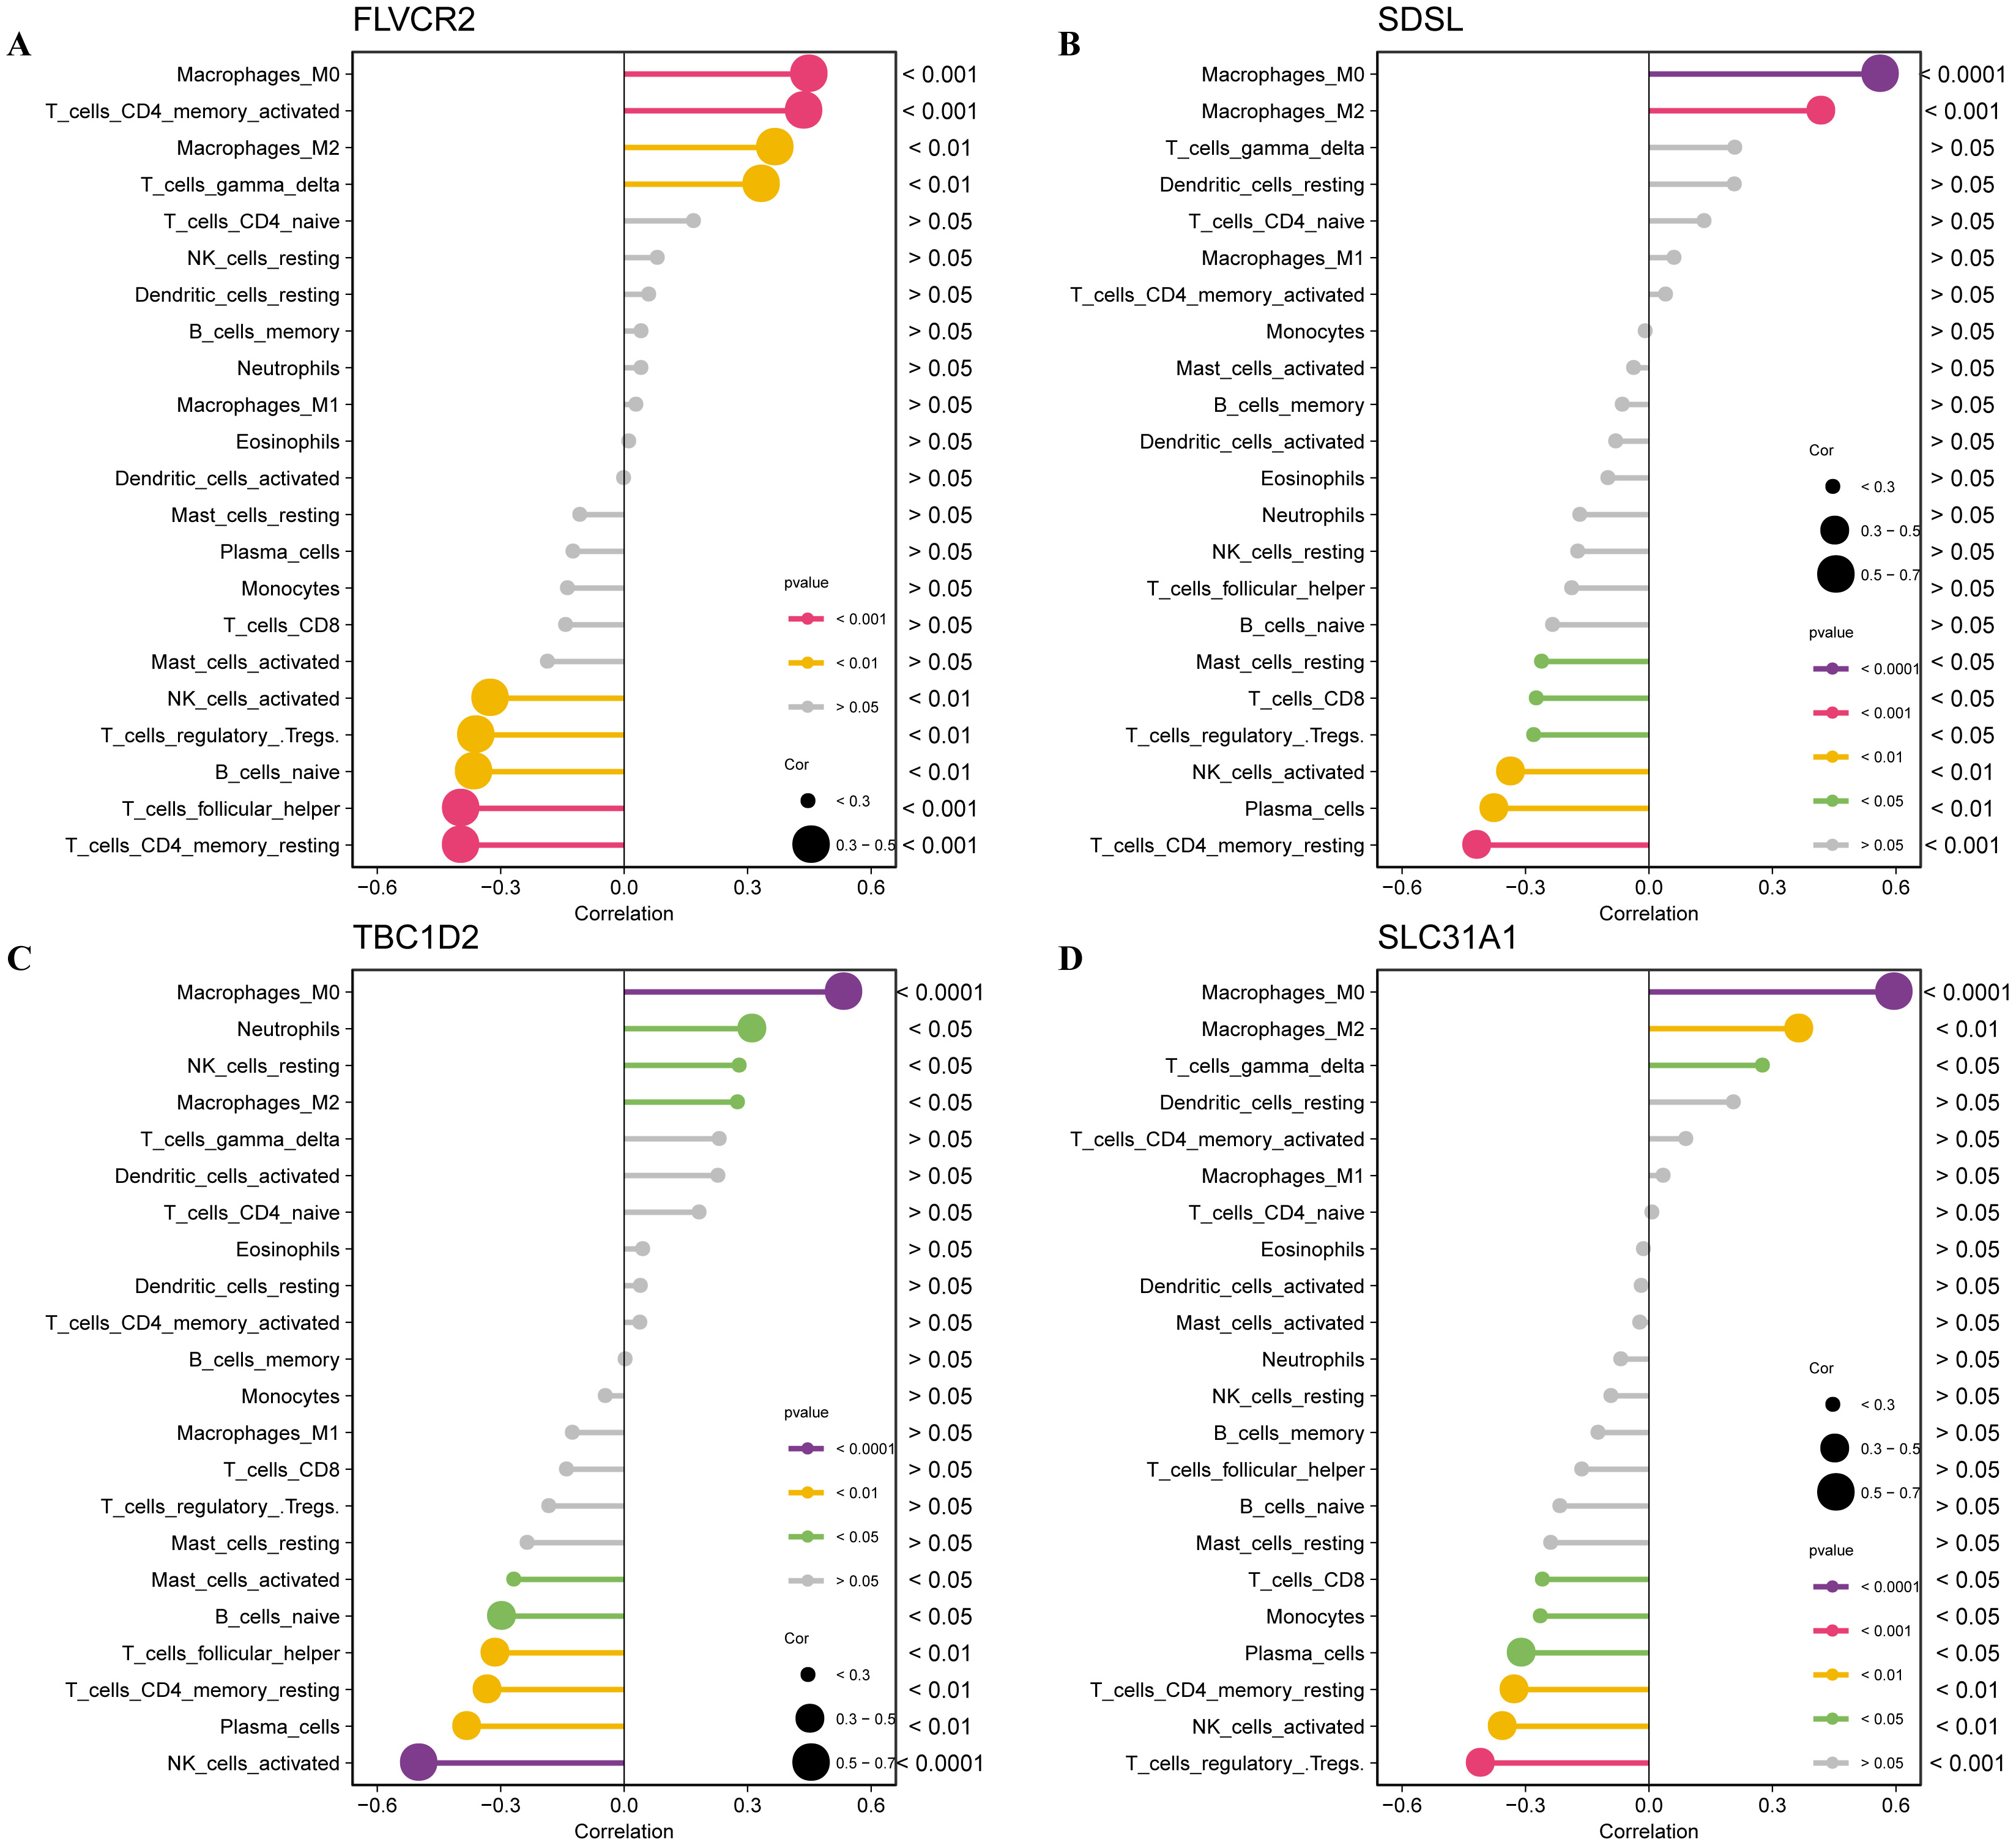 Fig. 9.
The relationship between the four biomarkers and immune infiltration. (A) The correlation between immune cell infiltration and FLVCR2 expression. (B) The correlation between immune cell infiltration and SDSL expression. (C) The correlation between immune cell infiltration and TBC1D2 expression. (D) The correlation between immune cell infiltration and SLC31A1 expression.
Correlation analysis between the biomarkers and metabolism pathways revealed that these four biomarkers were closely associated with multiple metabolism pathways (Fig. 10). For example, the expression of FLVCR2 and SDSL was significantly positively correlated with sphingolipid, glycerophospholipid, glycerolipid, fructose, and mannose metabolism, amino sugars and nucleotide sugars, ether lipids, arachidonic acid, linoleic acid, and galactose but they were all significantly negatively correlated with several amino acid metabolic pathways, such as glycine, serine, threonine, and tyrosine metabolism, and the valine, leucine, and isoleucine degradation pathways (Fig. 10). The expression of TBC1D2 and SLC31A1 was significantly positively correlated with the galactose metabolic pathway, linoleic acid, and amino sugars and nucleotide sugars (Fig. 10). Interestingly, the metabolism of linoleic acid, glycolysis pathways, fructose and mannose metabolism, amino sugars and nucleotide sugars, galactose, and pentose phosphate (PPP) were closely associated with the expression of these four biomarkers, indicating that these pathways played critical roles in promoting IA progression.
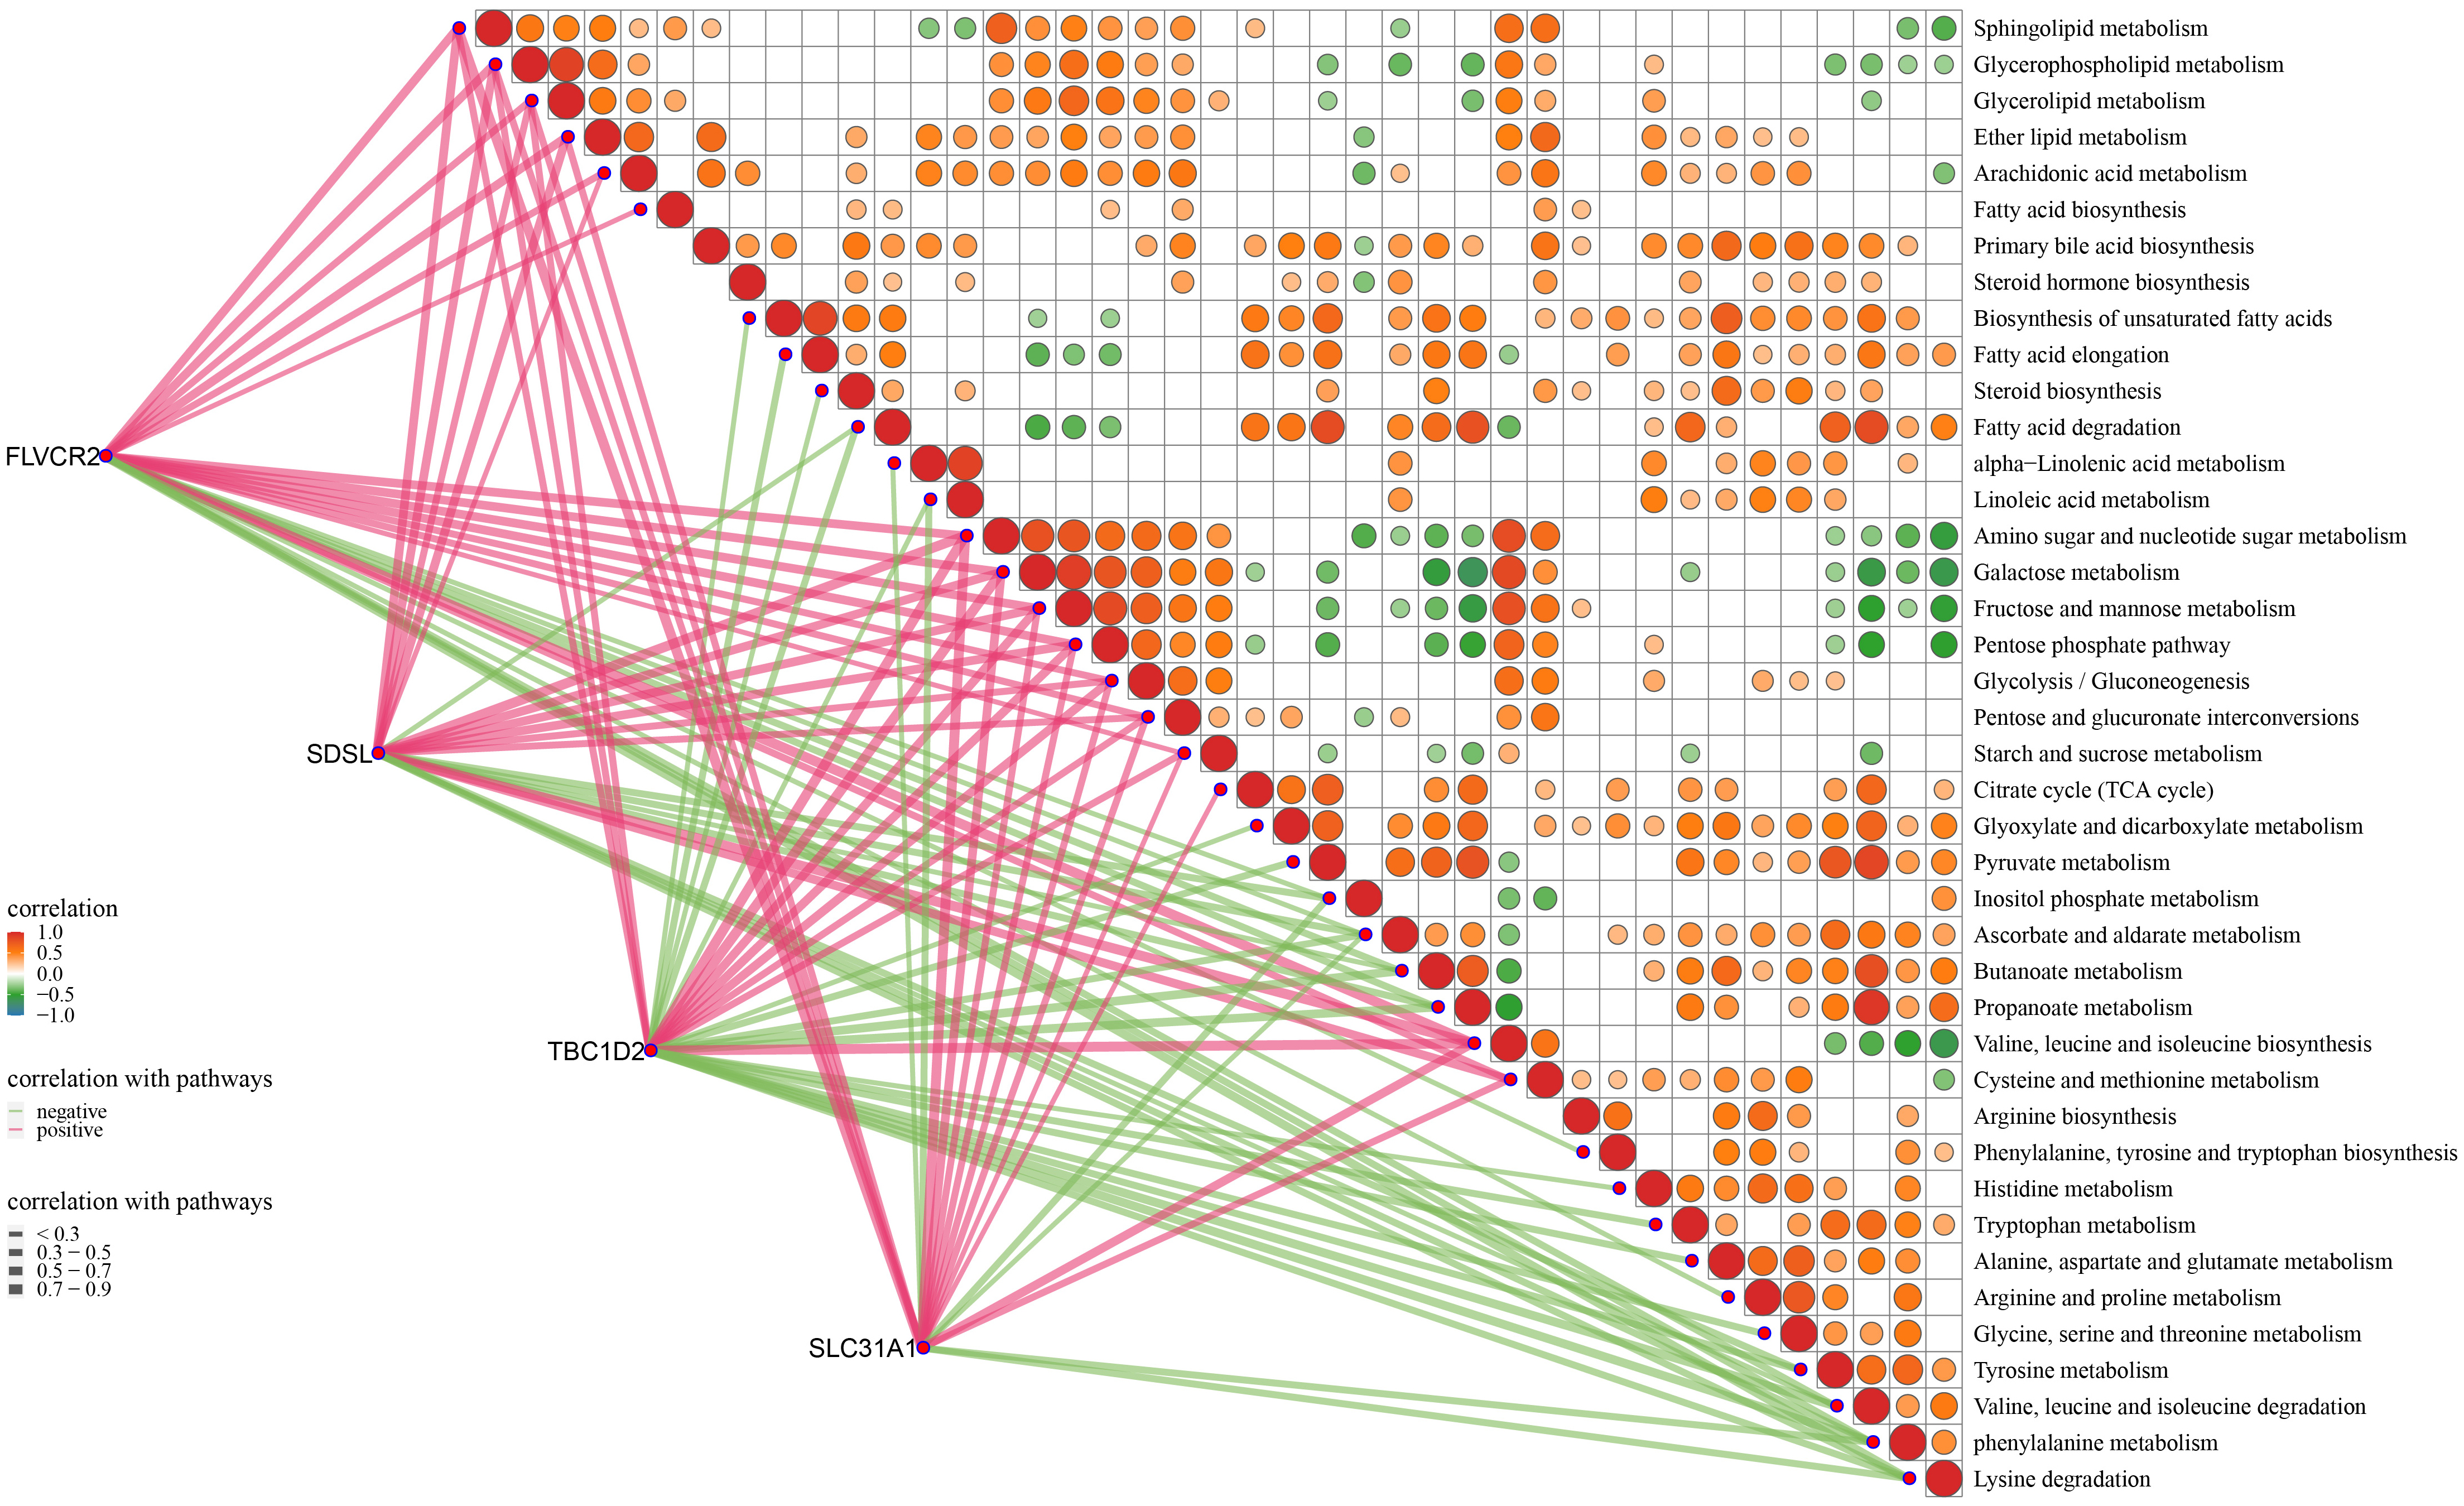 Fig. 10.
The relationship between the four biomarkers and metabolic pathways.
IA is a localized abnormal dilation of the cerebral vascular wall [1] and a leading cause of SAH with high disability and mortality. Many studies have reported that oxidative stress is involved in various cancers, as the elevated ROS level is oncogenic, potentially damaging DNA proteins and lipids. Moreover, ROS is also a pro-tumorigenic signaling molecule that can cause the loss of functions to tumor suppressor genes, increase glucose metabolism, generate oncogenic mutations, and activate pro-survival signaling pathways [52, 53, 54]. In this study, we employed WGCNA and three machine learning algorithms to identify four oxidative stress-related diagnostic markers. Further analysis revealed that the expression of these diagnostic markers was significantly positively correlated with the abnormal activation phenotype of oxidative stress, ROS, and glucometabolic pathways, and suppressive immune infiltration.
IA is characterized by a loss of arterial wall integrity, including intimal hyperplasia, endothelium dysfunction, disorganized extracellular matrix (ECM), and reduced cellular components [6]. The pathway enrichment analysis revealed that multiple pathways, including ROS in response to oxidative stress, were activated in IA patients, indicating that the oxidative stress reaction was a reliable pathological phenotype in IA progression. Tumor cells have enough antioxidant capacity to scavenge excessive ROS to maintain ROS at a pro-tumorigenic level, which allows for tumor progression and the development of resistance to apoptosis [55]. Overproduction of ROS can promote oncogene activation, reduce tumor suppressor activity, and increase cellular metabolism. ROS signaling activates the p38 MAPK, PI3K–Akt–mTOR, and IL6–JAK–STAT3 signaling pathways to inhibit transcription and the expression of tumor suppressors [53]. In breast cancer, H2O2 is a by-product of estrogen metabolism responsible for activating the ERK1/2 signaling pathway to promote tumor proliferation [56], and it also activates the pro-survival PI3K/Akt signaling pathway [57]. The activated Akt pathway phosphorylates and inactivates its target proteins, including pro-apoptotic FOXO, Bim, Bax, and Bad transcription factors for cell survival [58, 59]. H2O2 oxidizes and inactivates the negative regulators of PI3K/Akt signaling and phosphatases phosphatase and tensin homolog (PTEN) and PTP1B to promote cell survival [60, 61]. However, to prevent cells from damage, the level of ROS in tumor cells should be properly regulated [62], during which the superoxide dismutase (SOD) protein expression is upregulated [63], while H2O2 enzymes [64] and tumor suppressor genes (e.g., PTEN) as a part of the antioxidant system [65] are inactivated [66]. Hypoxia often occurs at the site of primary or metastatic tumors due to the deficiency in O2 supply, allowing for the adaptation of tumor cells through activating glucose metabolism, which is known as the “Warburg effect” (enhanced glycolysis in tumor cells regardless of sufficient O2 supply [67]), and contributes to the aggressiveness of the phenotype [68]. Glycolysis plays an important role in redox homeostasis for tumor oxidative stress adaptation by transferring the produced intermediates to other metabolic pathways, such as the pentose phosphate pathway (PPP), to inhibit the production of NADPH and glutaminolysis-generated glutathione (GSH) [69]. Enhanced carbohydrate metabolism pathways, including the pentose phosphate pathway and amino sugar metabolism, were observed in IA samples. In addition, enhanced lipid metabolism is also involved in the rapid cellular energy supply and redox balance [70]. A high level of immune cell infiltration is the hallmark of IA [71]. Macrophages are a major contributor to inflammatory cells infiltrating the IA wall [72]. This is because macrophages infiltrate into the vascular wall to induce the formation of IA at an early stage [73], and their numbers increase as the IA develops [74], which will promote the risk of rupture [72]. In the macrophage-depleted model, the formation of IA is dramatically reduced compared to the normal samples [73], suggesting that accumulating macrophages play a vital role in IA progression. Previous studies indicated using ferumoxytol-enhanced MRI to realize macrophage imaging of the IA wall [75] and help evaluate the inflammation of the IA wall and the rupture risk. The leukocyte infiltration levels are related to the degenerative changes in the IA wall, such as loss of extracellular matri (ECM) degradation and vascular smooth muscle cells (SMCs) [76]. Moreover, increased mast cell infiltration in the IA wall was previously observed [77] to promote allergic inflammation via releasing cytokines and mediators [78]. Degenerative changes in the IA wall could be effectively suppressed by mast cell degranulation inhibitors [77].
Our study investigated the oxidative stress characteristics in IA patients and found that 13 oxidative stress-related pathways, ROS and inflammatory response pathways, and carbohydrate and lipid metabolism pathways were significantly activated in IA patients. Higher macrophage and mast cell infiltration supported IA development. WGCNA, in combination with three other machine learning algorithms, identified four crucial diagnostic markers, namely, FLVCR2, SDSL, TBC1D2, and SLC31A1, and their expression was closely associated with the activation of the 13 oxidative stress-related pathways, ROS, and inflammatory and carbohydrate and lipid metabolism pathways. Specifically, higher expression of these genes was positively correlated with higher inflammatory cell infiltration, including macrophages and mast cells. Therefore, these diagnostic markers can act as reliable biomarkers to help evaluate the degree of IA progression [79], and several metabolic pathways involved in these diagnostic markers have the potential to be developed for IA interventions.
We used WGCNA combined with three machine learning algorithms to identify four crucial oxidative stress-related diagnostic markers, the expression of which was closely associated with the activated phenotypes of oxidative stress, ROS, inflammation, carbohydrate and lipid metabolism, and higher inflammatory cell infiltration. Our findings could provide novel insights and directions for personalized IA treatment.
IA, Intracranial aneurysm; GEO, Gene Expression Omnibus; ROS, reactive oxygen species; MsigDB, Molecular Signatures Database; GO, gene ontology; MAD, Median Absolute Deviation; KEGG, Kyoto encyclopedia of genes and genomes; WGANA, Weighted gene correlation network analysis; TOM, topological overlap matrix; GSEA, Gene Set Enrichment Analysis; DEGs, differentially expressed genes; SAH, subarachnoid hemorrhage; RMA, Robust Multi-array Average; RF, random forests; Lasso, least absolute shrinkage and selection operator; SVM-RFE, support vector machine-recursive feature elimination; ROC, receiver operating characteristic; AUC, Area Under Curve; TME, tumor microenvironment; ECM, extracellular matrix; SMCs, smooth muscle cells.
The datasets generated and/or analyzed during the current study are available in the [GSE75436] repository, [https://www.ncbi.nlm.nih.gov/geo/query/acc.cgi?acc=GSE75436], [GSE13353] repository, [https://www.ncbi.nlm.nih.gov/geo/query/acc.cgi?acc=GSE13353], [GSE26969] repository, [https://www.ncbi.nlm.nih.gov/geo/query/acc.cgi?acc=GSE26969], [GSE15629] repository, [https://www.ncbi.nlm.nih.gov/geo/query/acc.cgi?acc=GSE15629] and [GSE54083] repository, [https://www.ncbi.nlm.nih.gov/geo/query/acc.cgi?acc=GSE54083]. The datasets analyzed during the current study are available from the corresponding author on reasonable request.
All authors contributed to this present work: JYZ & PXD designed the study, BN & ZZ acquired the data. TTX and JBT conducted the analysis for the work. RS, QML and SDW improved the figure quality. TTX and JBT drafted the manuscript, JYZ & PXD revised the manuscript. All authors contributed to editorial changes in the manuscript. All authors read and approved the final manuscript. All authors have participated sufficiently in the work and agreed to be accountable for all aspects of the work.
Not applicable.
Not applicable.
This work was supported by Clinical evaluation study on the treatment of ischemic stroke with the method of replenishing qi, activating blood, dissipating turbidity and detoxifying (20377710D).
The authors declare no conflict of interest.
References
Publisher’s Note: IMR Press stays neutral with regard to jurisdictional claims in published maps and institutional affiliations.