


1 Department of Gynecology, Clinical Oncology School of Fujian Medical University, Fujian Cancer Hospital, 350014 Fuzhou, Fujian, China
2 Department of Obstetrics and Gynecology, Shengli Clinical Medical College of Fujian Medical University and Fujian Provincial Hospital, 350001 Fuzhou, Fujian, China
3 Fujian Provincial Key Laboratory of Tumor Biotherapy, Clinical Oncology School of Fujian Medical University, Fujian Cancer Hospital, 350014 Fuzhou, Fujian, China
4 Department of Pathology, Clinical Oncology School of Fujian Medical University, Fujian Cancer Hospital, 350000 Fuzhou, Fujian, China
†These authors contributed equally.
Abstract
Background: Cervical cancer is the most common gynecological malignancy in the world and seriously threatens to women’s lives and health. Polypyrimidine tract binding protein 1 (PTBP1), as an important splicing factor, has been identified as a proto-oncogene in several cancers, but its role and mechanism in cervical cancer remain poorly understood. Thus, our aim is to explore the impact of PTBP1 on proliferation, migration, apoptosis of cervical cancer cells, and its underlying mechanisms. Methods: The biological functions in cervical cancer cells were determined using small interfering RNA (siRNA), agonist, Cell Counting Kit-8 (CCK-8), transwell, migration test, western blot, real-time-PCR, immunohistochemistry and immunofluorescence, respectively. Results: The results indicated that PTBP1 was highly expressed in cervical cancer patients and cervical cancer cell lines compared to the normal group. Moreover, PTBP1 silencing significantly inhibited cell proliferation, and migration in both HeLa and SiHa cells. The PTBP1 silencing also induced mitochondrial apoptosis through upregulating Bax and mitochondrial apoptotic protein Cytochrome C, and downregulating B-Cell Leukemia/Lymphoma 2 (Bcl2) protein. Additionally, PTBP1 silencing induced autophagy by downregulating Sequestosome I (p62) and upregulating the ratio of Light chain 3-Ⅱ/Light chain 3-Ⅰ (LC3-Ⅱ/LC3-Ⅰ). Mechanistically, we found that the Phosphoinositide 3-kinase (PI3K) agonist reversed the changes induced by PTBP1 silencing. Conclusions: Overall, PTBP1 silencing can induce cervical cancer cells apoptosis mainly through PI3K/AKT pathway and protective autophagy. This study provides preliminary evidence for PTBP1 as a therapeutic target or prognostic marker for cervical cancer.
Keywords
- cervical cancer
- PTBP1
- autophagy
- apoptosis
- PI3K/AKT pathway
Cervical cancer is a significant health issue worldwide and is the fourth most common cancer in women, contributing to nearly 8% of all female cancer deaths annually [1]. It is well known that cervical infection with human papillomavirus (HPV) is the main cause of cervical cancer. In recent years, with the implementation of anti-HPV vaccines and early screening, the incidence of cervical cancer has gradually decreased [2, 3]. However, metastasis is an important indicator of the deterioration of cervical cancer and a major factor affecting prognosis, and patients with tumor dissemination to lymph nodes require additional treatment [4]. The mortality risk increases substantially when the cancer metastasizes to lymph nodes, particularly if it progresses to stage III or beyond [5]. An analysis of the 5-year survival rates for cervical cancer revealed that stage IIIC1 (positive pelvic lymph nodes) was 60.8% (95% Confidence Interval (CI): 58.7%–62.8%), whereas stage IIIC2 was 37.5% (95% CI: 33.3%–41.7%) [4]. The development of lymph node metastasis in cervical cancer can facilitate distant metastasis of the tumor, ultimately affecting the patient’s overall health and quality of life [6]. Therefore, identifying cervical cancer-related target genes at the molecular level and exploring their pathogenic mechanisms could be of great significance to develop effective strategies to prevent and treat cervical cancer and improve prognostic survival.
Polypyrimidine tract binding protein 1 (PTBP1), an RNA binding protein, functions as a post-transcriptional gene expression regulator, involved in regulating mRNA splicing, translation, stability, and localization, and plays various biological roles [7]. In addition, selective splicing (also known as alternative splicing) affects more than 60% of human genes and its dysregulation plays a crucial role in tumorigenesis, making it a potential new tumor marker [8, 9]. PTBP1 is one of the main members of alternative splicing, and its most extensive role is to participate as a splicing factor in regulating alternative splicing of mRNA. PTBP1 has been shown to do a tumor-promoting role in different cancers, including breast, glioma, and colorectal cancer, by influencing tumorigenesis through modulation of tumor tissue energy metabolism, such as the Warburg effect and regulating tumor progression via modulation of tumor autophagy, apoptosis, epithelial mesenchymal transition, and tumor immunity. Therefore, it is closely associated with tumorigenesis and progression [10, 11]. PTBP1 functions throughout most of the cell cycle and is also involved in altering pathway activities in tumor therapy, possibly playing different roles in different tumor microenvironments [12].
However, the diverse biological functions of PTBP1 (i.e., proliferation, migration, and apoptosis) and their regulatory mechanisms in cervical cancer cells have not been extensively investigated. Therefore, we intend to examine the expression levels of PTBP1 in cervical cancer tissues and its correlation with cervical cancer prognosis. Moreover, we aim to explore the potential association between PTBP1 regulation and various biological functions of cervical cancer cells, including proliferation, migration, and apoptosis, as well as the dysregulation of the pathways involved to provide a scientific basis and a potential target for cervical cancer prevention and treatment.
Cervical cancer cell lines (HeLa and SiHa), were obtained from Procell Life Science & Technology Co., Ltd (Wuhan, China). The normal cervical cell HcerEpic was purchased from BIOESN Technology Co., Ltd (Shanghai, China). Dulbecco’s Modified Eagle Medium (DMEM), RPMI 1640 basic medium, Opti-MEM medium (11058021), Fetal bovine serum (FBS), 0.05% Trypsin-Ethylenediaminetetraacetic acid (EDTA) (1X), Penicillin-streptomycin solution (100X) (penicillin content of 104 U/mL, streptomycin content of 10 mg/mL), and phosphate buffered saline (PBS) were obtained from Gibco (Carlsbad, CA, USA). Whole protein extraction assay, Total RNA extraction kit, and Sodium dodecyl sulfate polyacrylamide gel electrophoresis (SDS-PAGE) gel preparation kit were acquired from Beyotime Biotechnology Co., Ltd (Shanghai, China). Secondary antibodies labeled by Horseradish Peroxidase (HRP), Cell Counting Kit-8(CCK-8), PBS, Sodium dodecyl sulfate polyacrylamide gel electrophoresis (SDS-PAGE) protein loading buffer (5X) and Bovine serum albumin (BSA) were obtained from Fude Biological Technology Co., Ltd (Hangzhou, China). Enhanced chemiluminescence (ECL) luminescence solution was obtained from Epizyme Biomedical Technology Co., Ltd (Shanghai, China). Primary antibodies, including: PTBP1, Sequestosome I (p62), Light chain 3-Ⅰ (LC3-Ⅰ), LC3-II, and GAPDH were purchased from Proteintech Group Inc. (Wuhan, China); Bax, Bcl2, Cytochrome C, phospho-Protein kinase B (p-AKT) and AKT were bought from Abcam (Cambridge, UK). Annexin V-FITC/PI Apoptosis Detection Kit was obtained from Keygen Biotechnology Co., Ltd (Nanjing, China). Real-Time-Polymerase Chain Reaction (RT-PCR) reverse transcription kit and fluorescence quantitative amplification kit were purchased from Takara Biomedical Technology Co., Ltd (Beijing, China). 740 Y-P was acquired from MedChemExpress (Shanghai, China). Lipofectamine 3000 was obtained from Thermo Fisher Scientific Inc. (Waltham, MA, USA). Formaldehyde, Paraffin, Ethanol, Chloroform, and Isopropanol were purchased Macklin Biochemical Technology Co., Ltd (Shanghai, China). EDTA-free trypsin, 0.1% Crystal violet, BSA, Diaminobenzidine (DAB), Hematoxylin, Neutral gum, and Diethyl Pyrocarbonate (DEPC) water were bought from Solarbio Science & Technology Co., Ltd (Beijing, China).
This experiment was conducted with the consent of the patient’s family or the
patient themselves, and was reviewed and approved by the Ethics Committee of
Fujian Cancer Hospital (NO: SQ2022-197). From January 2022 to October 2022, the
cancer tissues of 10 patients with cervical cancer who underwent surgical
resection were collected at Fujian Cancer Hospital, and confirmed as cervical
cancer tissues by pathological examination. Meanwhile, normal cervical tissue (as
the control patients) was collected from 10 patients with uterine leiomyoma who
underwent surgical resection. The basic information about patients is shown in
Table 1 (Detailed information including patient names, initials, and hospital
numbers can be obtained from the corresponding author, if necessary). Inclusion
criteria for cervical cancer tissue: Patients were diagnosed and treated for the
first time with cervical cancer at Fujian Cancer Hospital, and diagnosed as
cervical squamous cell carcinoma through histopathological biopsy. According to
the pathology, they were classified as high, medium, and low differentiated
squamous cell carcinoma. All patients have complete clinical data and their
Karnovfsky Performance Status (KPS) is
| Patient ID | Name | Age | Pathological diagnosis | Histologic tumor grading | Tumor size(cm) | Stage of International Federation of Gynecology and Obstetrics (FIGO stage) |
| 17XX | XXX | 50 | Cervical squamous cell carcinoma | G3 | 6.0 × 3.5 | IIA2 |
| 17XX | XXX | 41 | Cervical squamous cell carcinoma | G2 | 2.1 × 1.6 | IB1 |
| 17XX | XXX | 62 | Cervical squamous cell carcinoma | G2 | 5.1 × 3.4 | IIA2 |
| 17XX | XXX | 50 | Cervical squamous cell carcinoma | G2 | 4.8 × 4.4 | IIa2 |
| 18XX | XXX | 43 | Cervical squamous cell carcinoma | G2 | 3.4 × 3.8 | IB1 |
| 18XX | XXX | 40 | Cervical squamous cell carcinoma | G2 | 3.5 × 3.5 | IIa2 |
| 18XX | XXX | 62 | Cervical squamous cell carcinoma | G2 | 4.1 × 2.4 | IIA1 |
| 18XX | XXX | 53 | Cervical squamous cell carcinoma | G2 | 3.6 × 2.0 | IIa2 |
| 18XX | XXX | 54 | Cervical squamous cell carcinoma | G3 | 4.4 × 3.4 | IIa2 |
| 18XX | XXX | 47 | Cervical squamous cell carcinoma | G2 | 3.7 × 3.0 | IIa2 |
| 28XX | XXX | 52 | Uterine leiomyoma | 1.0–6.5 | ||
| 16XX | XXX | 48 | Uterine leiomyoma | 1.0–5.0 | ||
| 29XX | XXX | 62 | Uterine leiomyoma | 1.0–2.5 | ||
| 29XX | XXX | 44 | Uterine leiomyoma | 0.5–6.5 | ||
| 16XX | XXX | 48 | Uterine leiomyoma | 1.0–5.0 | ||
| 29XX | XXX | 49 | Uterine leiomyoma | 0.7–3.0 | ||
| 29XX | XXX | 44 | Uterine leiomyoma | 0.8–4.0 | ||
| 27XX | XXX | 52 | Uterine leiomyoma | 0.5–7.0 | ||
| 29XX | XXX | 45 | Uterine leiomyoma | 1.4–10.0 | ||
| 29XX | XXX | 48 | Uterine leiomyoma | 0.8–6.5 |
The Gene Expression Profiling Interactive Analysis (GEPIA) web (http://gepia2.cancer-pku.cn/#index.) server serves as a highly beneficial resource for conducting gene expression analysis on both tumor and normal samples obtained from the Genotype-Tissue Expression (GTEx, https://www.gtexportal.org/home/) and the Cancer Genome Atlas Program (TCGA, https://portal.gdc.cancer.gov/) databases. Survival analyses were conducted on cancer patient data from publicly accessible portals, namely the GEPIA2 portal (at http://gepia2.cancer-pku.cn/#index) [13]. In our study, GEPIA was used to verify the prognostic value of different expression levels of PTBP1 in cervical cancer. The GEPIA2 portal was utilized to conduct survival analyses through the ‘Survival Analysis’ tool. This tool examines overall survival data and median expression in order to calculate the hazard ratio (HR) accompanied by 95% confidence intervals.
We declared that HeLa, SiHa, and HcerEpic were validated by Short Tandem Repeat (STR) profiling and tested negative for mycoplasma. Cells were all cultured in a humidified incubator at 37 °C and 5% CO2.
Frozen cells, including HeLa, SiHa and HcerEpic, were quickly taken from the liquid nitrogen and placed in a 37 °C water bath for thawing, following which 5 mL of the prepared medium (90% basic medium, 10% FBS, and 1% penicillin-streptomycin solution) (SiHa and HeLa were cultivated in 1640 medium; HcerEpic was cultured in DMEM medium) was added to the cells in a biosafety cabinet. The cells were centrifuged at room temperature (800 rpm, 3 minutes), and the supernatant was removed. Next, 6 mL of prepared culture medium was used to gently resuspend the cells. The cells were then incubated in a 5% CO2, 37 °C, incubator. Passaging was performed every 2–3 days according to growth of the cells. When the cells reach the logarithmic growth phase, it can be used for other validation experiments.
After the HeLa and SiHa cells were dissociated from the culture flask wall, a
specific amount of cell suspension was taken for cell counting, and 1.0
The dissociated cells (HeLa and SiHa) were counted, and placed in 96-well plates at 104 cells/well. The plates were gently shaken and placed back into the cell incubator for further culture. After 24 h, 10 µL of CCK-8 solution was added to each well of 96 well plates, which were then returned to the cell incubator for 1 h. Subsequently, the optical density (OD) value of each well was measured using a microplate reader (BioTek, Winooski, VT, USA) at a 450 nm wavelength.
Cervical cancer tissues and normal tissues were fixed in formaldehyde and embedded in paraffin to prepare sections with a thickness of 4 µm. The sections were dewaxed, then a gradient of ethanol was used to hydrate and wash them with PBS. After antigen retrieval, the sections were incubated with a primary antibody PTBP1, then washed with PBS, incubated with a secondary antibody, washed with PBS, and stained with DAB. Hematoxylin re-staining was performed, followed by dehydration using a gradient of ethanol. Finally, the sections were made transparent and sealed with neutral gum. Positive staining was observed as brownish-yellow under an optical microscope, and the expression level was determined based on the intensity of the color. ImageJ software (National Institutes of Health, Bethesda, MD, USA) was used to quantify and compare the differences.
According to the instructions, the total RNA was extracted using total RNA
extraction kit from Beyotime, in brief, treated cells were collected, and 1 mL of
Beyozol was added to the cells. The mixture was transferred to an Eppendorf (EP) tube and
kept at room temperature (5 minutes). Next, the above was mixed with 0.2 mL of
chloroform and was shaken using a vortex instrument (15 seconds). The tube was
centrifuged at 1.2
Total protein was extracted from the treated cells using the whole protein
extraction kit. Briefly, after the cells were washed and centrifuged, the
supernatant was removed, and the Lysis Buffer (containing phosphatase inhibitor,
PMSF, and protease inhibitor; Beyotime Biotechnology Co., Ltd, Shanghai, China) was added. After sufficient lysis, the lysed cells
were centrifuged at 1.2
In this experiment, 5.0
Here, 5.0
The cells (1.0
For statistical analysis, the collected data was analyzed with GraphPad Prism7.0
software (GraphPad Software Co., Ltd, San Diego, CA, USA). Data are presented as
mean
As seen in Fig. 1A–E, immunohistochemistry results indicated that the
expression level of PTBP1 in cervical cancer tissues was significantly different
from that in normal tissues (p
 Fig. 1.
Polypyrimidine tract binding protein 1 (PTBP1) is highly
expressed in cervical cancer tissues and cells, and its expression is associated
with prognosis. (A) Immunohistochemical staining of PTBP1 (normal tissues)
(100
In HeLa cells (Fig. 2A,B), the protein expression level of PTBP1 in the si-PTBP1
group was significantly reduced after 48 h of si-PTBP1 interference, compared
with the siRNA-negative control (si-NC) group (p
 Fig. 2.
PTBP1 silencing can effectively downregulate PTBP1 expression
and inhibit the proliferation of cervical cancer cells. (A) Representative
protein bands (HeLa). (B) Relative quantification of PTBP1 protein expression
(HeLa). (C) Relative mRNA expression level of PTBP1 (HeLa). (D) HeLa cell
viability. (E) Representative protein bands (SiHa). (F) Relative quantification
of PTBP1 protein expression (SiHa). (G) Relative mRNA expression level of PTBP1
(SiHa); (H) SiHa cell viability. Protein levels were quantified by densitometry
using Image J and normalized to GAPDH levels. Data was shown as mean
After transfecting cells with si-PTBP1 for 48 h, as shown in the results of flow
cytometry detection, the lower left quadrant represents normal ventricular cells;
the lower right quadrant represents cells undergoing early apoptosis; the upper
right quadrant represents cells undergoing advanced apoptosis; the upper left
quadrant represents necrotic cells; cells undergoing early and late apoptosis
were collectively regarded as apoptotic cells. In HeLa cells, the si-PTBP1 group
(apoptosis rate: 18.96%
 Fig. 3.
PTBP1 silencing effectively promotes cervical cancer cell
apoptosis. (A) Representative plots of apoptosis (HeLa). (B) Quantification of
early and late apoptosis rates (HeLa). (C) Representative plots of apoptosis
(SiHa). (D) Quantification of early and late apoptosis rates (SiHa). Phosphoinositide 3-kinase (PI3K) agonist
was co-cultured for 48h. Data was presented as mean
The transwell assay showed that si-PTBP1 markedly reduced the migration ability
of HeLa cells after 60 h of transfection, compared with the si-NC group (Fig. 4I)
(p
 Fig. 4.
PTBP1 silencing prevented the migration of cervical cancer
cells. (A) Representative images of scratches (HeLa) at 0 h (200
Compared to the si-NC group, si-PTBP1 markedly reduced the phosphorylation level
of AKT (p
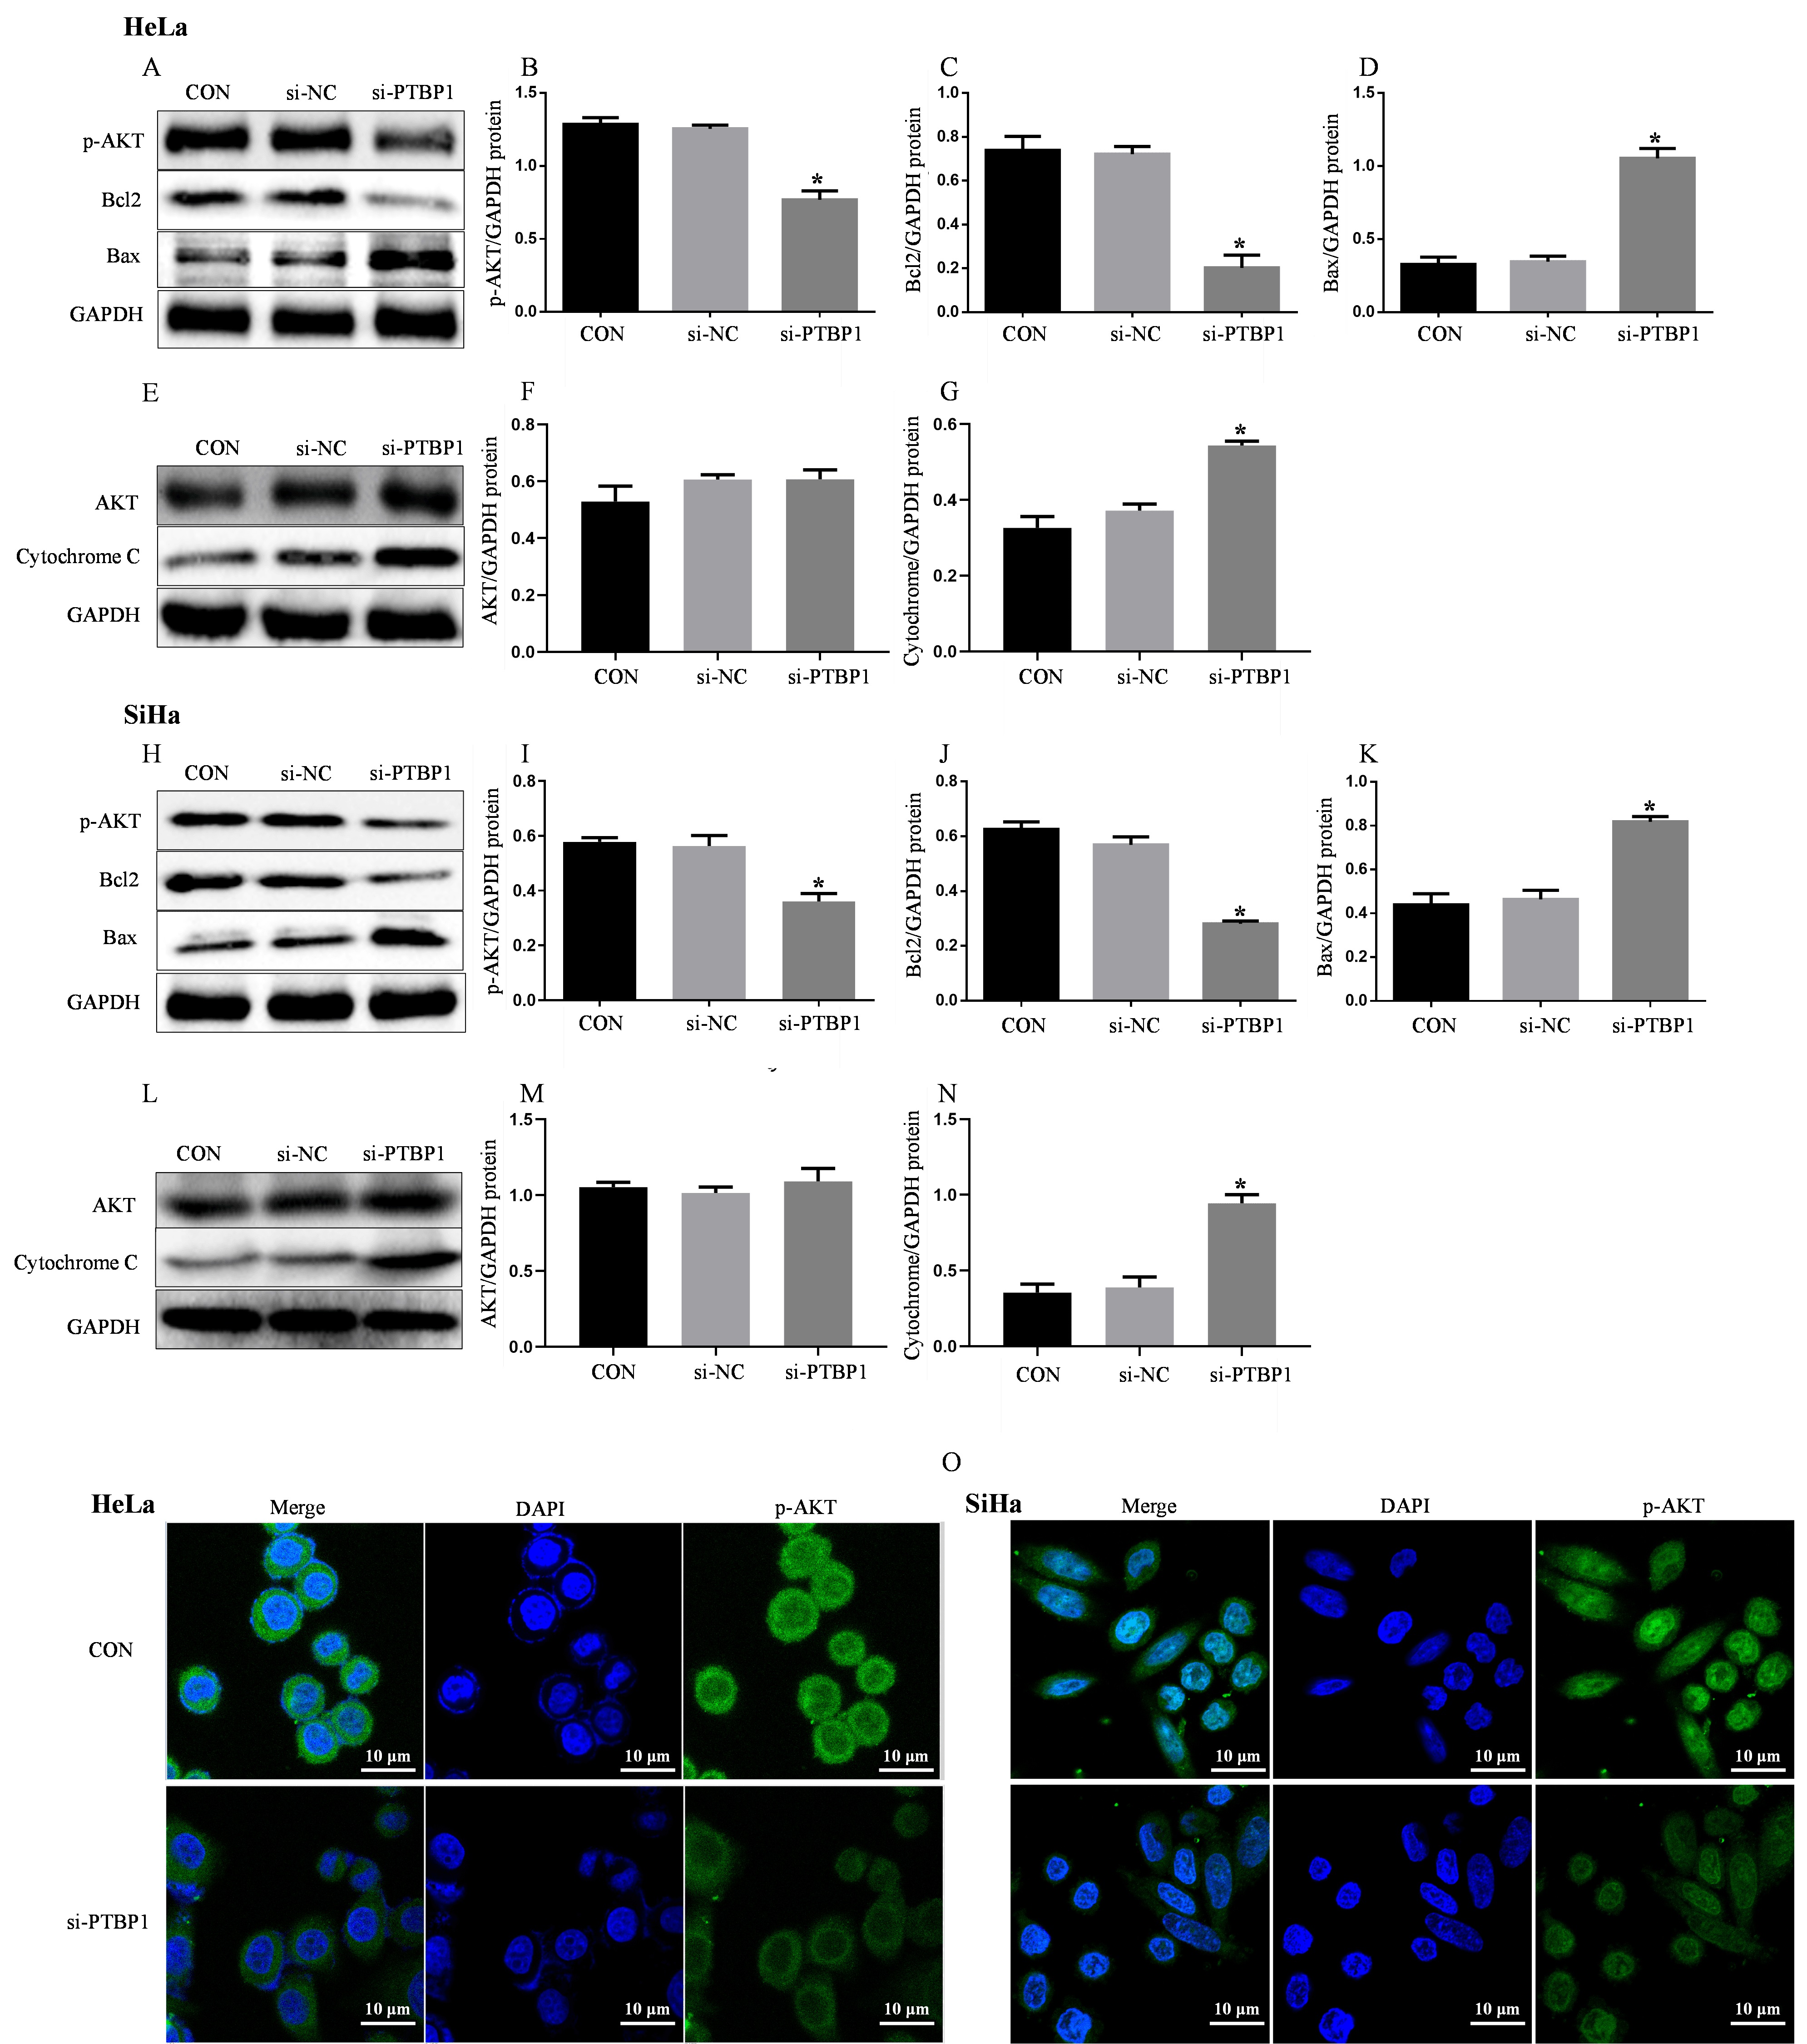 Fig. 5.
PTBP1 silencing inhibits the AKT pathway and induces
mitochondrial apoptosis in cervical cancer cells. (A) Representative protein
bands (HeLa). (B) Relative quantification of phospho-Protein Kinase B (p-AKT)
protein expression (HeLa). (C) Relative quantification of Bcl2 protein expression
(HeLa). (D) Relative quantification of Bax protein expression (HeLa). (E)
Representative protein bands (HeLa). (F) Relative quantification of AKT protein
expression (HeLa). (G) Relative quantification of Cytochrome C protein expression
(HeLa). (H) Representative protein bands (SiHa). (I) Relative quantification of
p-AKT protein expression (SiHa). (J) Relative quantification of Bcl2 protein
expression (SiHa). (K) Relative quantification of Bax protein expression (SiHa).
(L) Representative protein bands (SiHa). (M) Relative quantification of AKT
protein expression (SiHa). (N) Relative quantification of Cytochrome C protein
expression (SiHa). (O) p-AKT immunofluorescence images of HeLa and SiHa cells
(400
Regarding the effect on autophagy, silencing of PTBP1 obviously elevated the
expression of LC3-II (an autophagy protein), and the ratio of LC3-II/LC3-Ⅰ
(p
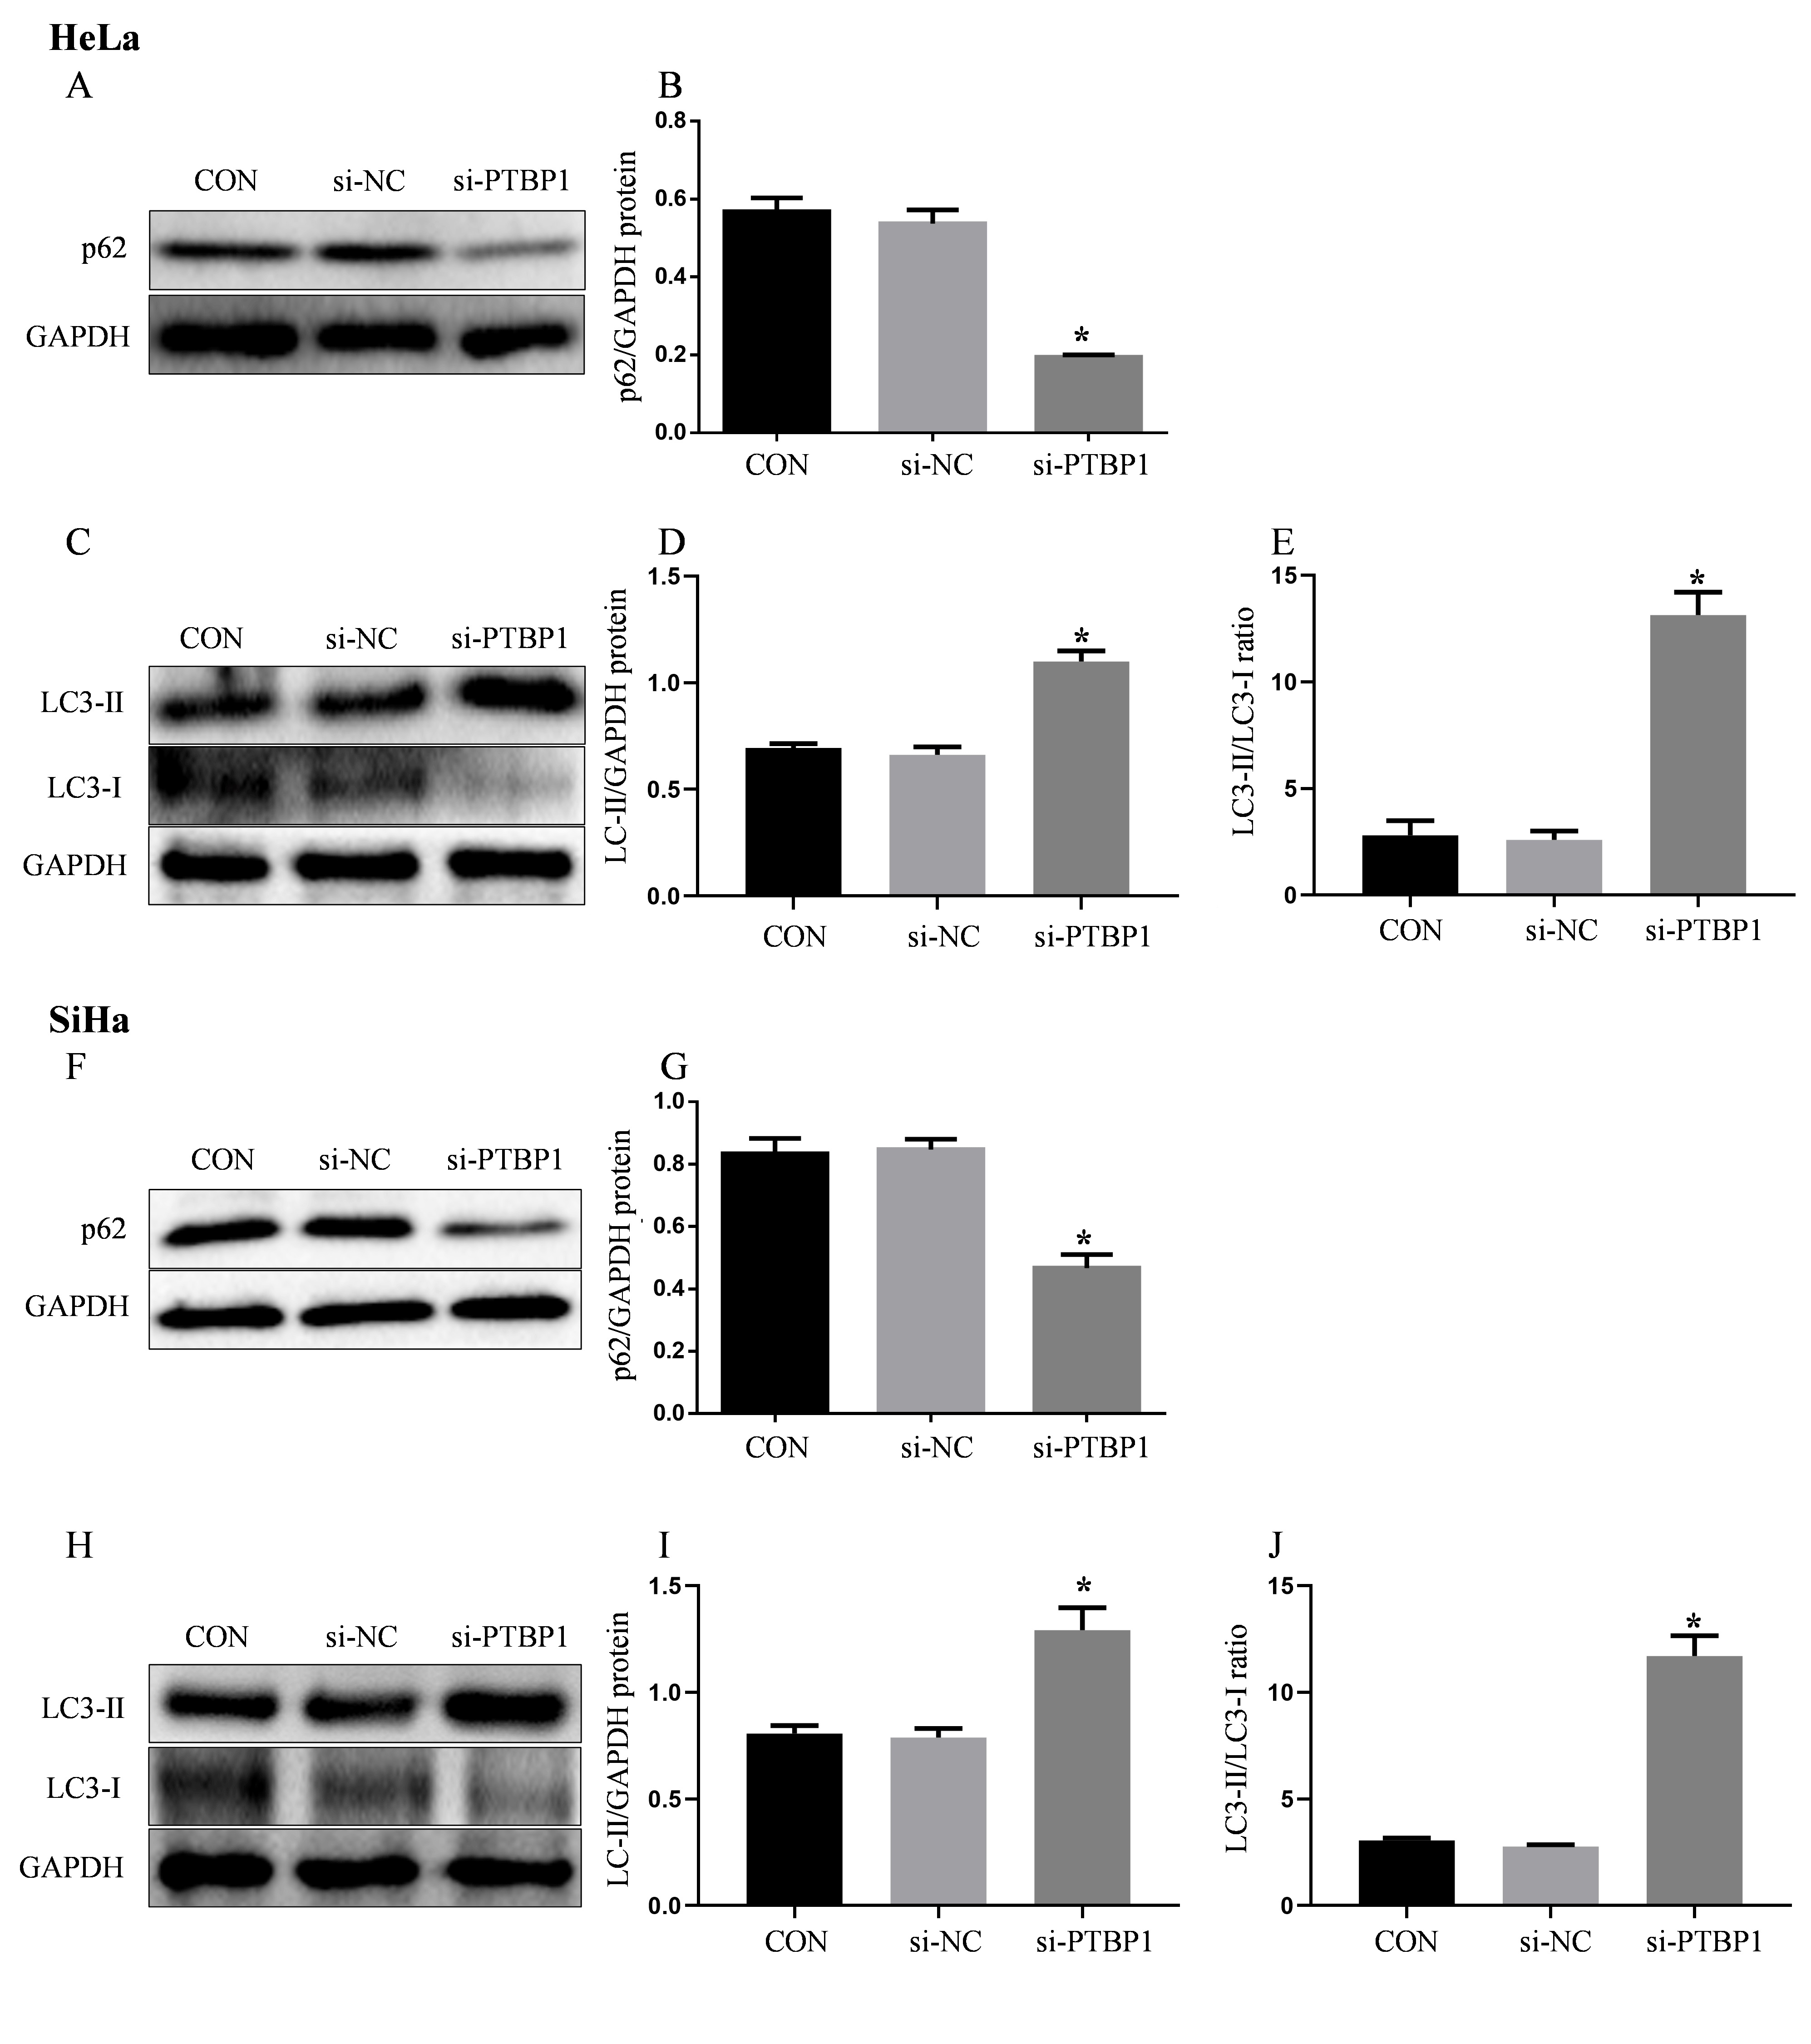 Fig. 6.
PTBP1 silencing promotes autophagy in cervical cancer cells.
(A) Representative protein bands (HeLa). (B) Relative quantification of
Sequestosome I (p62) protein expression (HeLa). (C) Representative protein bands
(HeLa). (D) Relative quantification of LC3-Ⅱ protein expression (HeLa). (E) Ratio
of LC3-Ⅱ/LC3-Ⅰ (HeLa). (F) Representative protein bands (SiHa). (G) Relative
quantification of p62 protein expression (SiHa). (H) Representative protein bands
(SiHa). (I) Relative quantification of LC3-Ⅱ protein expression (SiHa). (J) Ratio
of LC3-Ⅱ/LC3-Ⅰ (SiHa). Protein levels were quantified by densitometry using Image
J and normalized to GAPDH levels. Data was expressed as mean
To further investigate the role of PI3K/AKT pathway in PTBP1 regulation of
mitochondrial apoptosis and autophagy, we treated both HeLa and SiHa cells with a
PI3K agonist. The results showed that the PI3K agonist significantly upregulated
Bcl2 expression, while downregulated Bax expression and the mitochondrial
apoptotic protein Cytochrome C in both cell lines, compared with the si-NC group
(Fig. 7A,C,D,F,H,K,M,N,P,R). Moreover, in the si-PTBP1+PI3K agonist group, the
Bax/Bcl2 ratio and Cytochrome C expression were markedly reduced compared with
the si-PTBP1 group (p
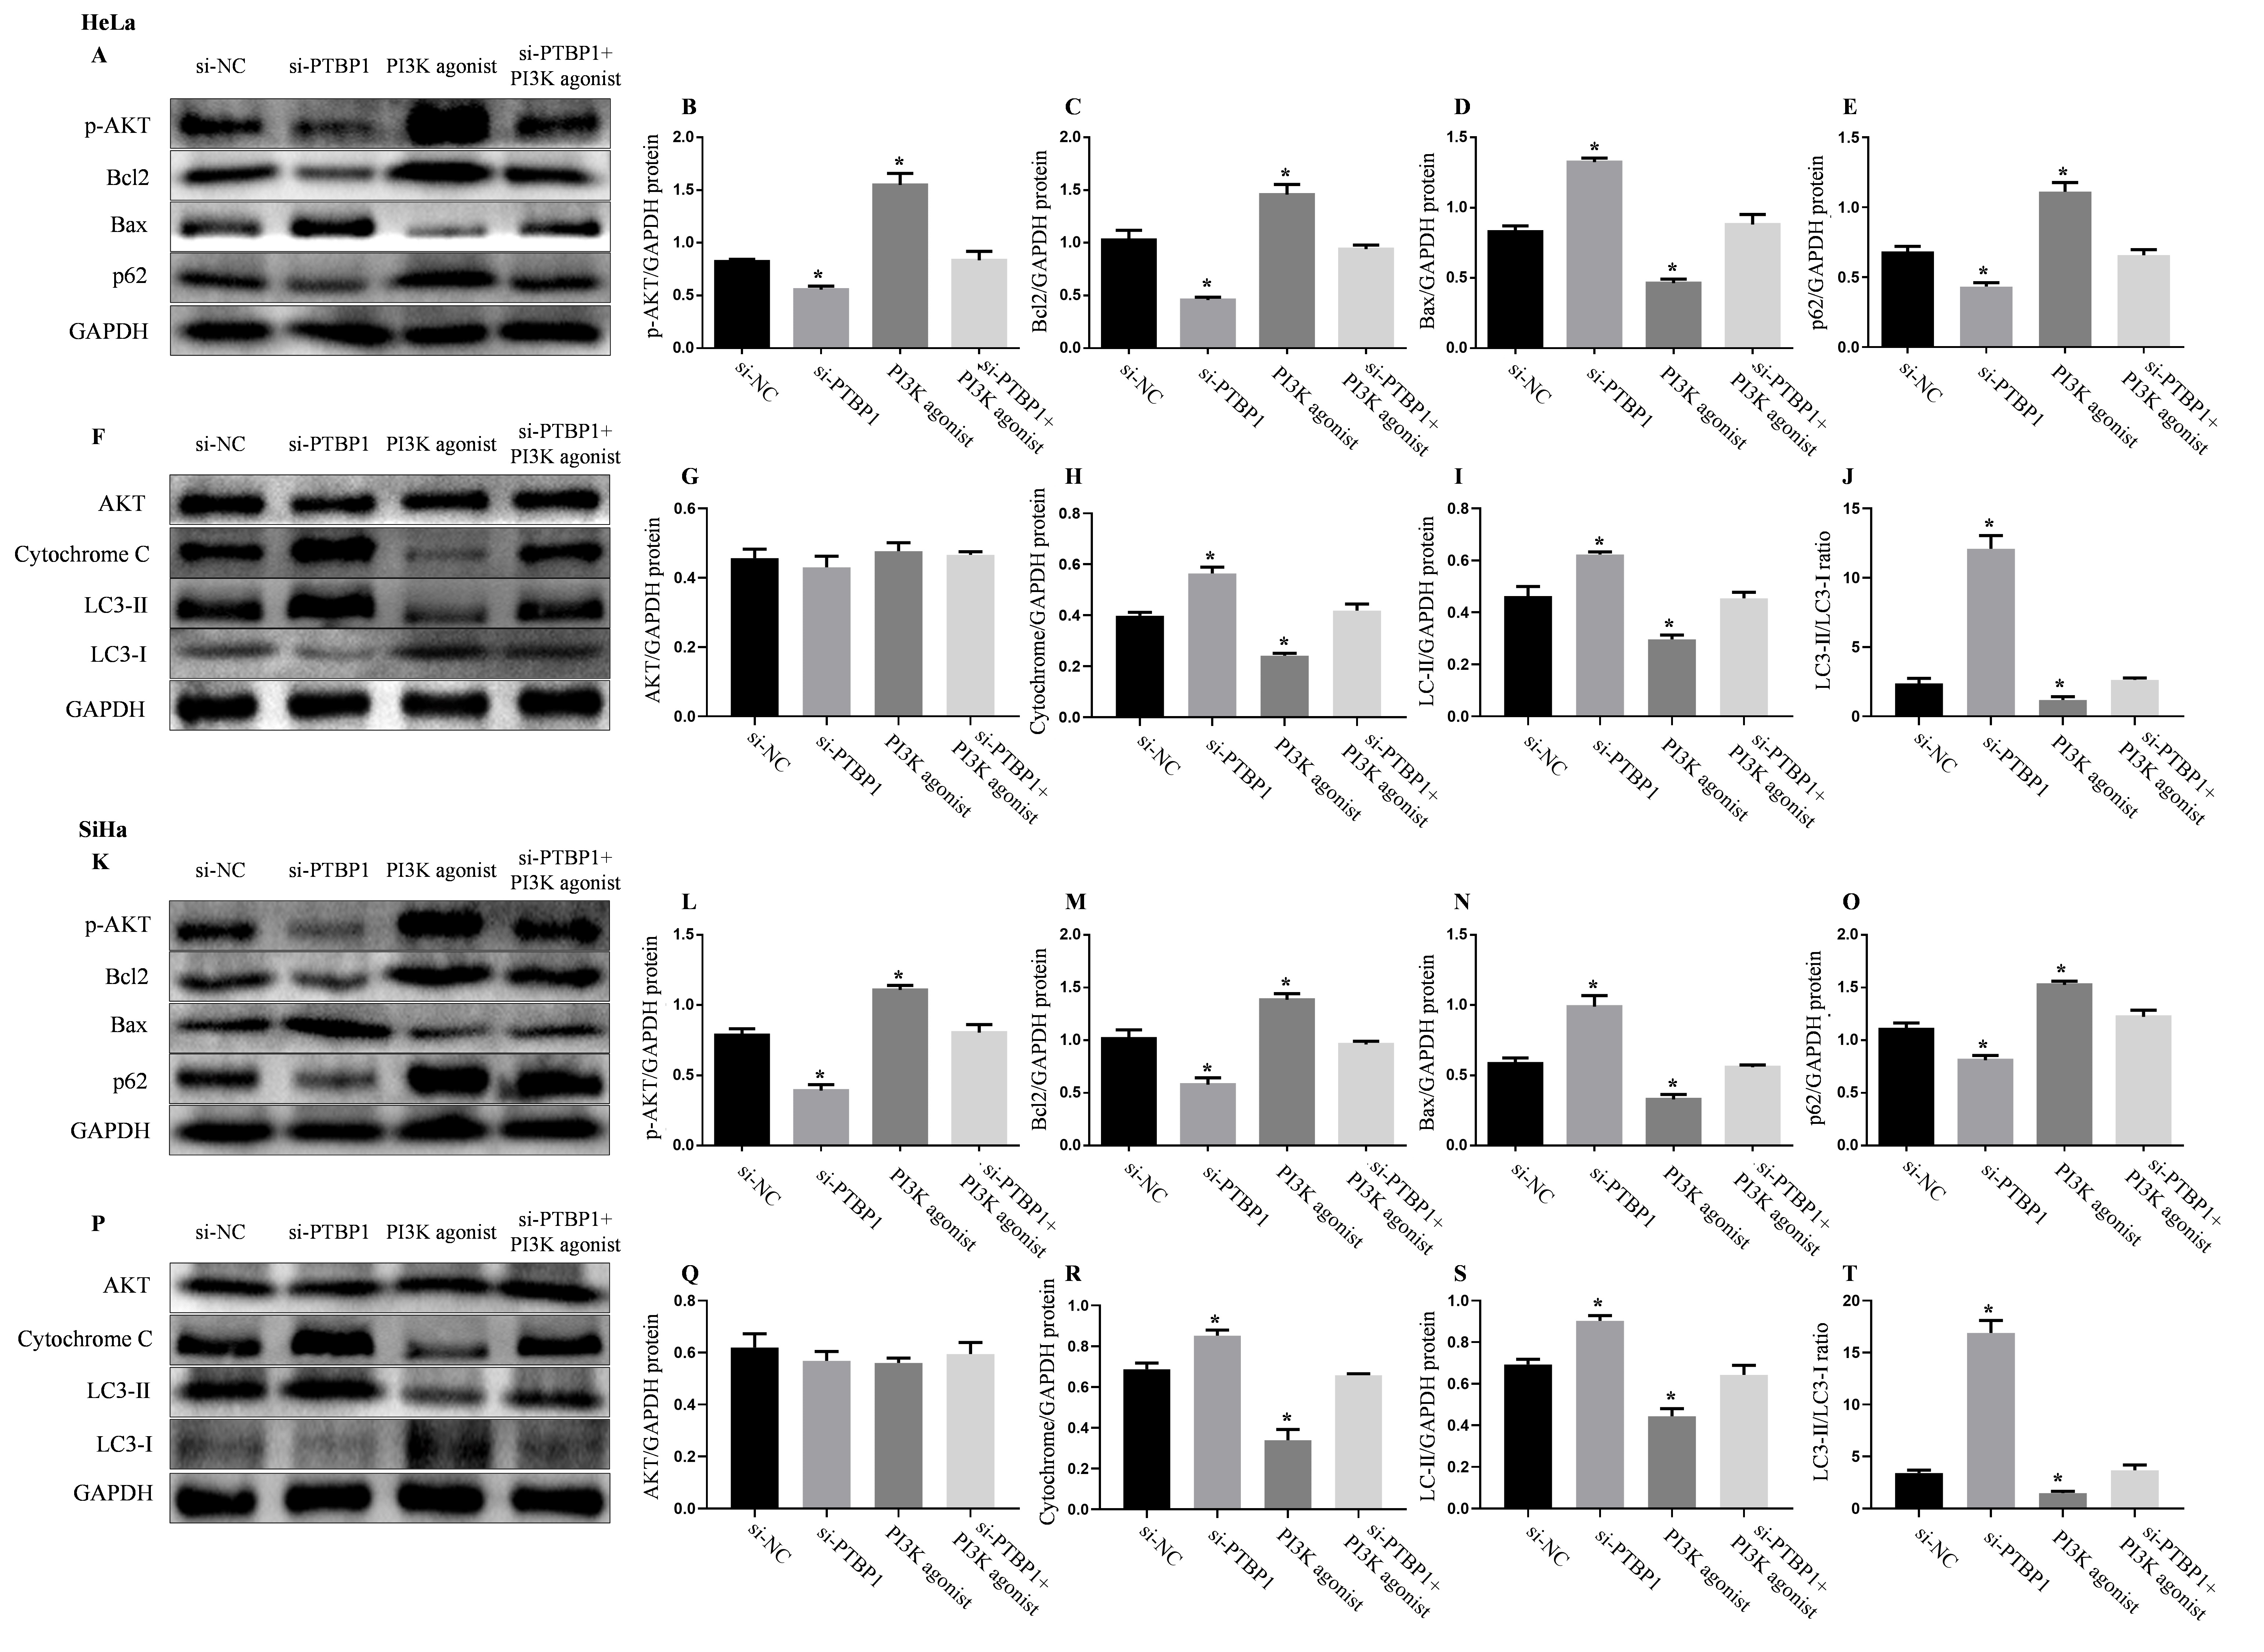 Fig. 7.
PI3K agonists reverse the effects of PTBP1 silencing on
autophagy and mitochondrial apoptosis in cervical cancer cells. (A)
Representative protein bands (HeLa). (B) Relative quantification of p-AKT protein
expression (HeLa). (C) Relative quantification of Bcl2 protein expression (HeLa).
(D) Relative quantification of Bax protein expression (HeLa). (E) Relative
quantification of p62 protein expression (HeLa). (F) Representative protein bands
(HeLa). (G) Relative quantification of AKT protein expression (HeLa). (H)
Relative quantification of Cytochrome C protein expression (HeLa). (I) Relative
quantification of LC3-Ⅱ protein expression (HeLa). (J) Ratio of LC3-Ⅱ/LC3-Ⅰ
(HeLa). (K) Representative protein bands (SiHa). (L) Relative quantification of
p-AKT protein expression (SiHa). (M) Relative quantification of Bcl2 protein
expression (SiHa). (N) Relative quantification of Bax protein expression (SiHa).
(O) Relative quantification of p62 protein expression (SiHa). (P) Representative
protein bands (SiHa). (Q) Relative quantification of AKT protein expression
(SiHa). (R) Relative quantification of Cytochrome C protein expression (SiHa).
(S) Relative quantification of LC3-Ⅱ protein expression (SiHa). (T) Ratio of
Light chain 3-Ⅱ (LC3-Ⅰ)/LC3-Ⅰ (SiHa). PI3K agonist was co-cultured for 24 h.
Protein levels were quantified by densitometry using Image J and normalized to
GAPDH levels. Data was shown as mean
Cervical cancer has one of the highest mortality rates among gynecologic malignant tumors. According to the molecular characteristics of cervical cancer, it has been reported that preneoplastic lesions at low degree may regress spontaneously, or progress to more malignant stages [19, 20]. Thus, despite improved outcomes for early-stage disease, many patients still die due to metastasis and recurrence [21]. There are about 500,000 new cases of cervical cancer each year in the world, but the majority of those cases occur in countries with no extensive HPV vaccine programs, and more than one-third of patients succumb to the disease [1]. Although, surgical treatments for cervical cancer have improved in recent years, its invasiveness and metastasis still pose a significant challenge to therapeutic effect. As a splicing factor, PTBP1 involves in metastasis of different cancer cells. For instance, PTBP1 has promoting role on the invasion and metastasis of hepatocellular carcinoma cells through influencing the alternative splicing of Tyrosine protein kinase receptor (AXL) exon 10 [22, 23]. In breast cancer, renal cell carcinoma, bladder cancer, and other cancer cells, PTBP1 promotes the proliferation and metastasis of cancer cells via acting on the selective splicing of the pyruvate kinase M isoform (PKM) [24, 25]. PTBP1 has been shown to be upregulated in various tumor tissues, and its high expression is remarkably correlated with the poor prognosis in patients. However, the biological function of PTBP1 in cervical cancer has not been reported yet. Herein, this study aims to investigate the effects of PTBP1 in cervical cancer. Previous study has reported that PTBP1 may be a novel candidate gene related to cervical lesion progression and carcinogenesis [26]. However, this study further proved that PTBP1 expression is highly upregulated in cervical cancer tissues, also in the cervical cancer cell lines (HeLa and SiHa cells). In addition, we analyzed data from 292 cervical cancer patients collected from the GEPIA dataset and found a significant correlation between PTBP1 expression levels and overall survival. Patients with high PTBP1 expression had a poorer prognosis, and indicated that PTBP1 was a risk factor for prognosis in cervical cancer patients.
Apoptosis is a type of programmed cell death that is extensively involved in keeping the homeostasis of tissues and organs, and also participates in the development of cancer. Inducing tumor cell apoptosis to promote tumor cell death is an effective strategy for cancer treatment. Studies have demonstrated that PTBP1 regulates tumor cell apoptosis and its high expression is positively associated with increased tumor volume and decreased survival rate [7, 27, 28]. In our study, we observed that silencing of PTBP1 in two cervical cancer cell lines inhibited cell proliferation, while significantly promoted cell apoptosis. It is consistent with recent studies that inhibition of PTBP1 can suppress cancer cell proliferation via inducing apoptosis [29]. Our results revealed that PTBP1 might function as an oncogene in the development of cervical cancer.
Mitochondrial apoptosis is one of the main forms of apoptosis. When presented with apoptotic signals, the expression of Bax and Bcl-2 homology region 3 (BH3) proteins increases, leading to the release of Bax/Bak from Bcl-2 and Bcl-xL. Free Bax and Bak then form oligomers, releasing Cytochrome C and inducing mitochondrial apoptosis [30]. In this study, we found that PTBP1 silencing decreased the expression of Bcl-2 (an anti-apoptotic protein), increased the expression of Bax (a pro-apoptotic protein), and induced the release of Cytochrome C in both HeLa and SiHa cells. As a result, the Bax/Bcl2 ratio and expression of Cytochrome C were significantly increased, demonstrating that an enhanced mitochondrial apoptotic response in cervical cancer cells with the silencing of PTBP1. Our study suggests that PTBP1 silencing may induce mitochondrial apoptosis in cervical cancer cells, thereby affecting the development of cervical cancer. A previous study demonstrated that PTBP1 participated in the development of glioma by affecting tumor cell apoptosis [27], which was consistent with our study findings. Furthermore, we also found that PTBP1 silencing promoted autophagy by increasing the expression of the autophagy-related gene LC3-II and the ratio of LC3-II/LC3-Ⅰ, and decreasing the expression of p62. Based on these results, we hypothesized that PTBP1 may also affect the development of cervical cancer by acting on autophagy genes and promoting cell apoptosis. Other studies have also reported that PTBP1 affected migration of colon cancer cells through directly interacting with autophagy-associated protein 10 (ATG10) [31]. Autophagy induces apoptosis due to excessive depletion of intracellular proteins and organelles, rendering the cells unable to continue to survive. Depletion of the p62 in an autophagy-deficient mouse model has been shown to reduce tumor production, while overexpression of p62 promotes tumor growth [32]. In summary, we speculated that PTBP1 could affect the development of cervical cancer through regulating autophagy genes to promote cervical cancer cells apoptosis.
The effect of PTBP1 in cervical cancer cell lines was further studied through silencing expression of PTBP1. In addition to apoptosis and proliferation, PTBP1 also participates in other biological functions. In our study, we discovered that the knockdown of PTBP1 obviously reduced the migration ability of both cervical cancer cells. Furthermore, in transwell assays, we also found that the knockdown of PTBP1 had a significant inhibitory effect on the migration ability of both cervical cancer cells. Consistent with our findings, other studies also demonstrated PTBP1 suppression reduced the migration of colorectal cancer cells, whereas, overexpression of PTBP1 reversed these effects induced by silencing of PTBP1 [33, 34, 35]. Collectively, it is indicated that PTBP1 dose a crucial effect on the migration of cervical cancer cells, thereby affecting metastasis, indicating that PTBP1 may affect the malignancy of cervical cancer cells.
Moreover, further studies were performed to reveal the molecular mechanism underlying tumor promoting role of PTBP1 in cervical cancer. The expression level of phosphorylation AKT was markedly reduced in both cervical cancer cells with PTBP1 silencing, and p-AKT/AKT ratio was markedly decreased. Several studies have found that PTBP1 is positively correlated with most genes of the Wnt and autophagy pathways, as well as some genes of the pyroptosis and epithelial-to-mesenchymal transition (EMT) pathways in pan-cancer [36, 37]. PTBP1 has also been reported to regulate the Phosphatase and tensin homologue deleted on chromosome ten (PTEN) PI3K/AKT pathway and autophagy, ultimately leading to the proliferation, invasion, and metastasis of breast cancer cells [38]. In our study, we demonstrated that 740 Y-P (an PI3K agonist) could reverse the biological functions, including: autophagy, apoptosis, proliferation, and migration induced by PTBP1 silencing. For tumors, PTBP1 can affect the occurrence and development of tumors by regulating various signaling pathways, including the PI3K/AKT pathway [39]. In breast cancer, PTBP1 knockdown can reduce AKT phosphorylation, but has no effect on total AKT protein [38]. Research has shown that PTBP1 reduces PTEN mRNA stability through YTH domain-containing family protein 2 (YTHDF2) mediated m6A modification, leading to PI3K/AKT activation [40]. PTEN is an upstream molecule of PI3K/AKT [41]. PTBP1 may activate AKT by affecting the mRNA stability of PTEN. These findings demonstrated that the PI3K/AKT signaling pathway might be involved in mediating the biological functions of cervical cancer cells regulated by PTBP1 (Fig. 8). However, animal models of cervical cancer should be performed to further validate the findings obtained in vitro; further study also need to be performed to explore the mechanism of PTBP1 in cervical cancer from the perspective of splicing factor.
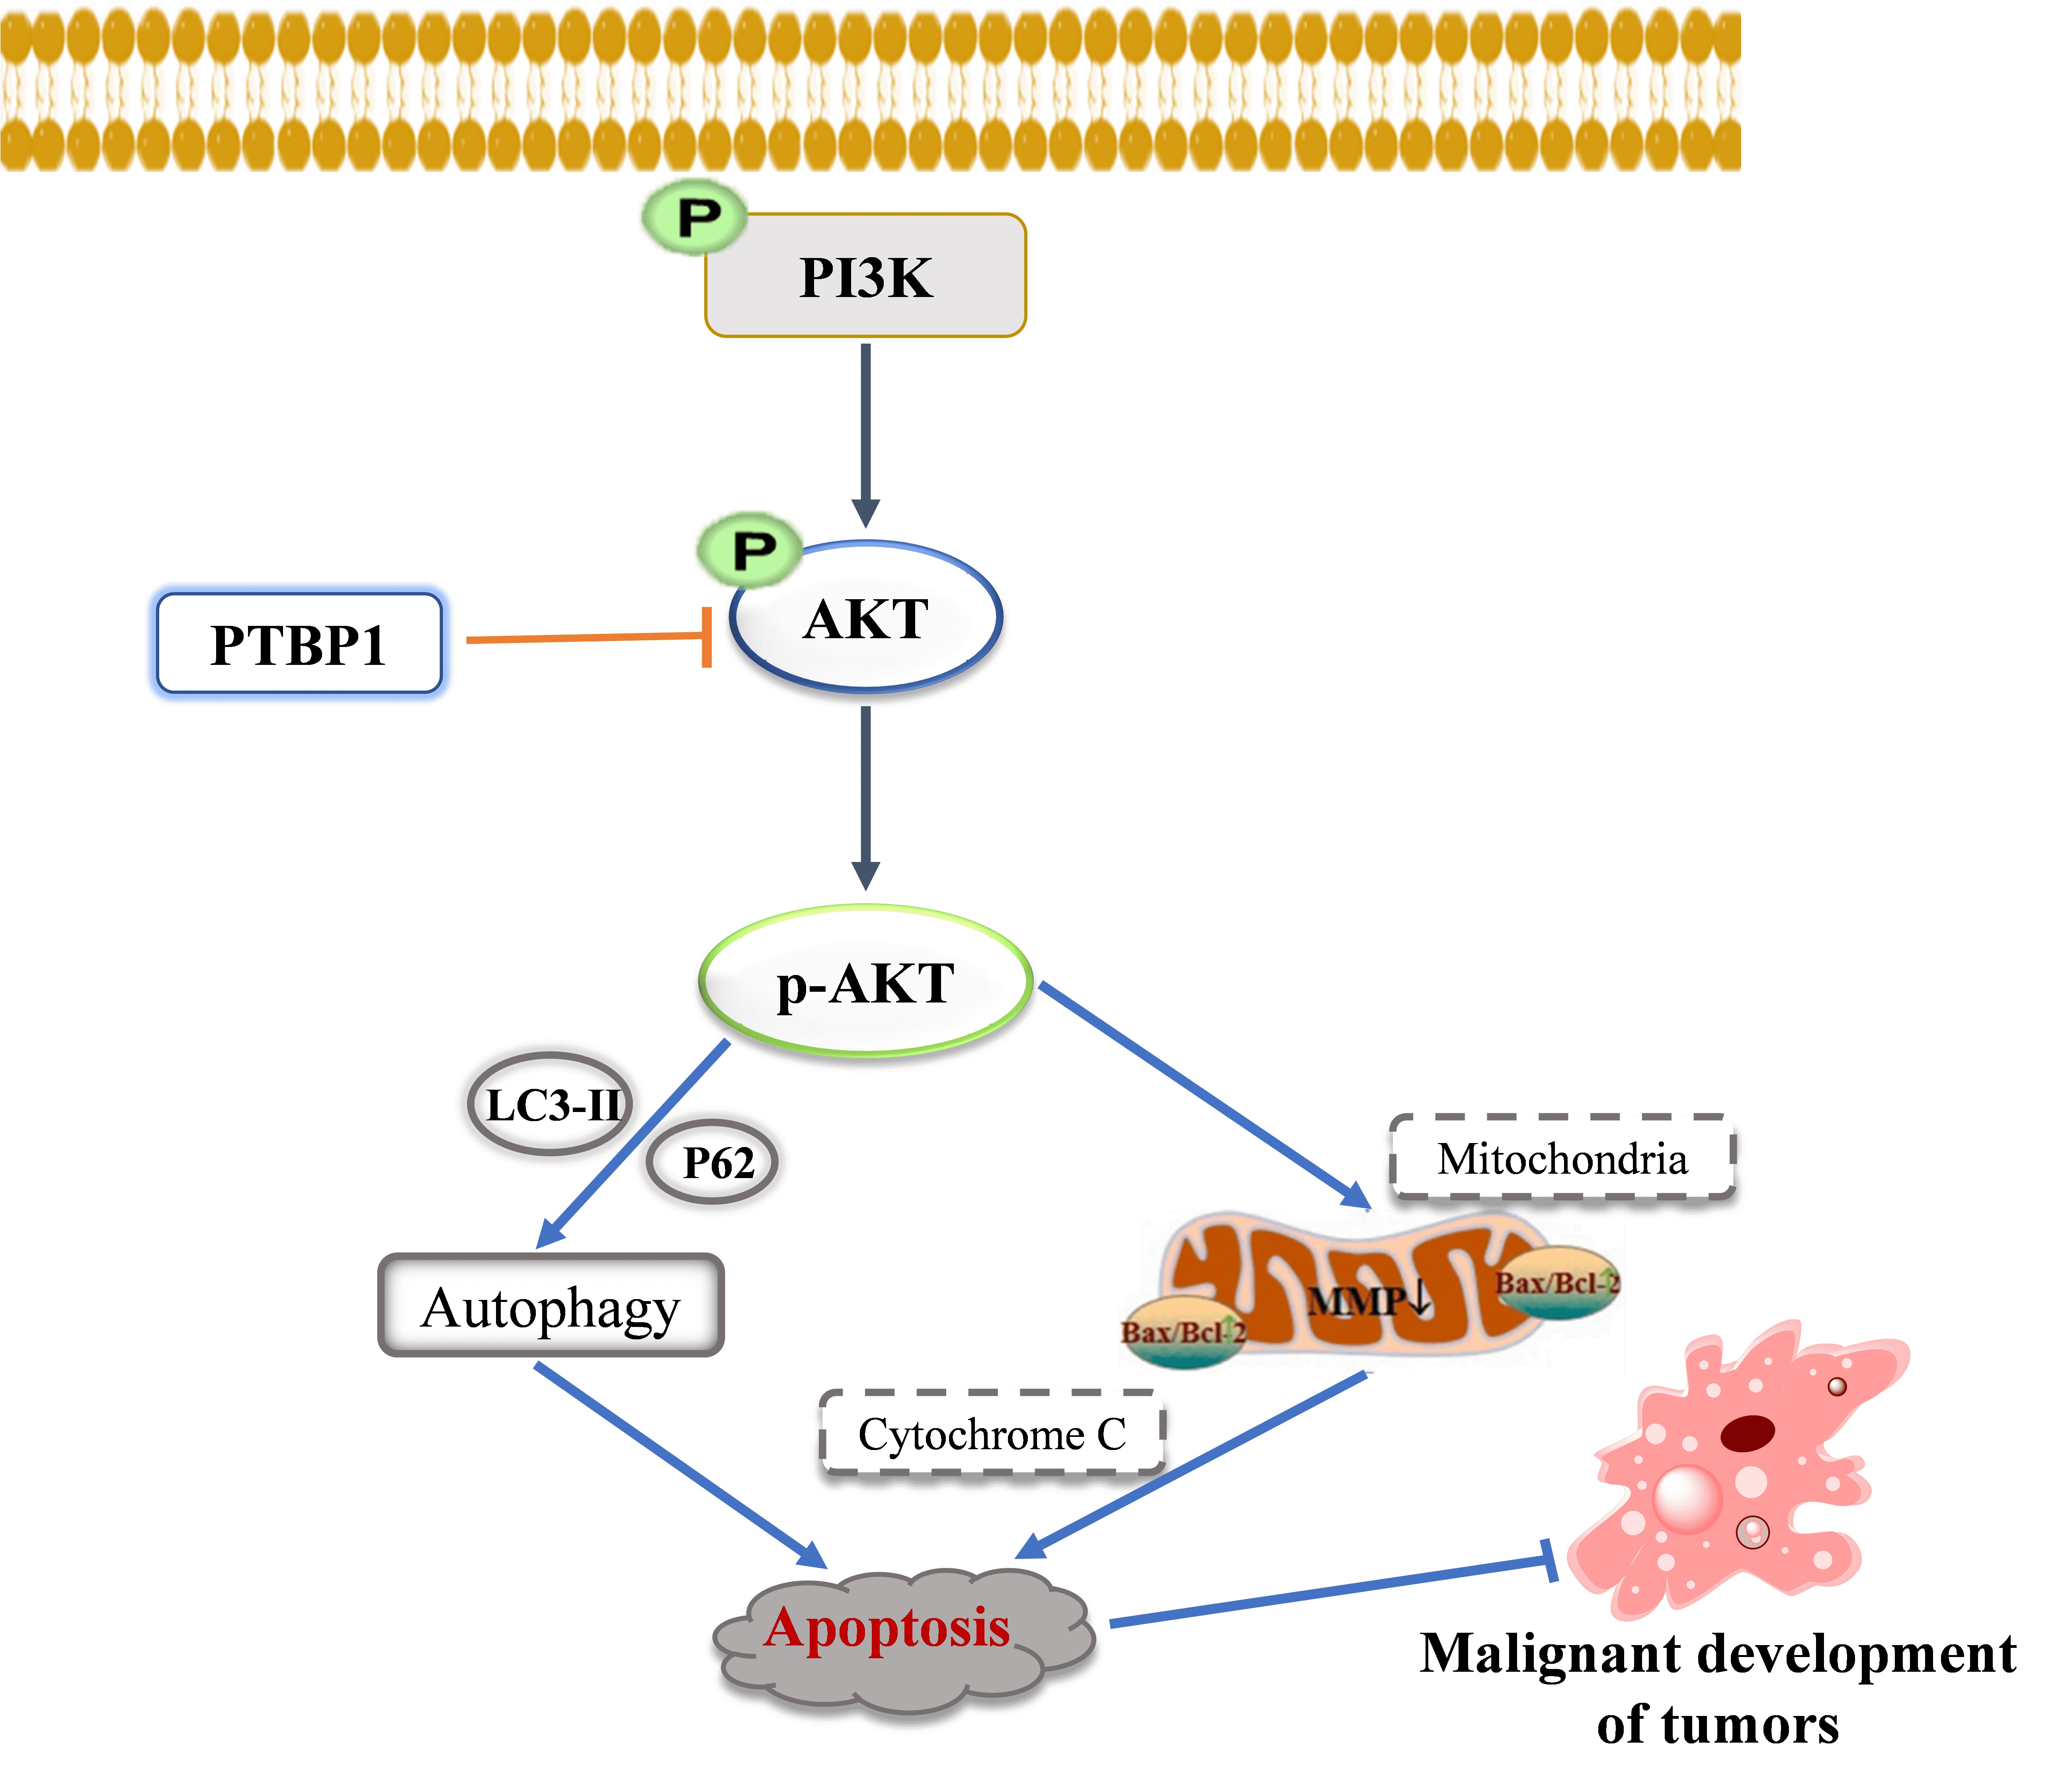 Fig. 8.
Molecular mechanism of PTBP1 involving in apoptosis of human cervical cancer cells.
In summary, this study provides new evidences that PTBP1 is highly expressed in cervical cancer; the high expression of PTBP1 may inhibit cancer cell apoptosis, and promote proliferation, and migration by regulating the PI3K/AKT pathway and autophagy; while silencing of PTBP1 could reverse above changes. The above results suggest that PTBP1 may play a promoting role in cervical cancer, and serve as a potential target for molecularly targeted therapy or a biomarker for cervical cancer.
PTBP1, Polypyrimidine Tract Binding Protein 1; PI3K, PI3K, Phosphoinositide 3 kinase; AKT, Protein Kinase B; BAX, BCL-2-associated X; Bcl2, B-cell lymphoma-2; p62, Sequestosome I; LC3, Light chain 3; CCK-8, Cell Counting Kit-8.
The datasets used and analyzed during the current study are available from the corresponding author on reasonable request.
YS, TL, YZ, and LC conceived the study, participated in the study design and coordination, and drafted the manuscript. YZ, QL, and DH collected the data and performed the statistical analysis. HJ, RH, and YL helped to collect the data, draft and check the manuscript. All authors have read and approved the final manuscript. All authors contributed to editorial changes in the manuscript. All authors have participated sufficiently in the work and agreed to be accountable for all aspects of the work.
This study was authorized by the Ethics Committee of Fujian Cancer Hospital (permission number: SQ2022-197), and we also detailly explained the informed consent form to the participated patients.
We would like to thank Englishgo for English language editing.
This work was supported financially by National Natural Science Foundation of China (Grant No: 81873045), Medical Innovation Proiect of Fuiian Province (Grant No: 2017-CX-9), and the Natural Science Foundation of Fujian Province (Grant No:2023J01121670).
The authors declare no conflict of interest.
References
Publisher’s Note: IMR Press stays neutral with regard to jurisdictional claims in published maps and institutional affiliations.