


 , Maolin He 3,*
1 Division of Neurosurgery, The First Affiliated Hospital of Guangxi Medical University, 530021 Nanning, Guangxi, China
2 Department of the First Clinical Medical College, Guangxi Medical University, 530021 Nanning, Guangxi, China
3 Division of Spinal Orthopedics, The First Affiliated Hospital of Guangxi Medical University, 530021 Nanning, Guangxi, China
Abstract
Background: Glioblastoma (GBM) is a highly aggressive and fast-growing
brain tumor, characterized by rapid progression, a very poor prognosis, and a
high likelihood of recurrence. Thus, effective new therapeutic targets are
urgently needed. Transmembrane proteins (TMEMs) have pro-cancer effects on
multiple cancer types, but the mechanisms underlying the effects of TMEM17,
particularly its role in GBM, remain unclear. Methods: We conducted
bioinformatics analyses and immunohistochemistry to evaluate the role of
TMEM17 in a variety of cancer types. Functional assays were conducted
included the Cell Counting Kit-8 assay, annexin V-FITC/PI double staining,
5-ethynyl-2
Keywords
- Glioblastoma
- transmembrane protein 17
- The Cancer Genome Atlas
- proliferation
- migration
- Ying Yang 1 transcription factor
Glioblastoma (GBM) is the most common and aggressive form of brain cancer [1]. According to statistics, brain cancer is the 10th leading cause of cancer-related death worldwide, and GBM accounts for nearly half of those deaths [2]. In addition to its high incidence, GBM often has a poor prognosis because of its rapid progression and the extremely aggressive nature of the tumor. The 5-year survival rate of GBM is less than 10%, and if no effective treatment measures can be taken, the patient’s survival time is typically no more than 3 months [3, 4]. Currently, the conventional treatment strategy for GBM includes a combination of surgery and radiotherapy/chemotherapy, and targeted and immunosuppressive therapies are also being actively pursued. However, the results of these treatments are often unsatisfactory due to individual differences between patients [5, 6]. In addition, the high recurrence rate of GBM is a major clinical challenge [7]. Clinical studies have shown that the recurrence rate of GBM is close to 100%, even after the initial combination of treatments (including surgery, radiation therapy, and chemotherapy). The median recurrence-free survival (i.e., the time from the start of treatment to the recurrence of disease) for GBM is approximately 6.9 months, which means that most patients experience disease recurrence within the first few months of treatment [8]. Thus, there is an urgent need to find new effective therapeutic targets for GBM.
Transmembrane protein 17 (TMEM17) belongs to the TMEM protein family, which is a group of membrane-spanning proteins localized to the plasma membrane or intracellular organelle membranes [9]. This family of proteins regulates numerous physiological processes including autophagy, smooth muscle contraction, and immunity [10]. Some proteins in this family such as TMEM25 [11] and TMEM7 [12], are potential prognostic biomarkers for cancer; however, the functions of many other proteins in the TMEM family have not yet been elucidated. TMEM17 consists of several transmembrane structural domains, which allows it to be stably embedded in the cell membrane. It has been indicated as a potential therapeutic target in colon cancer, but whether it has similar significance in GBM requires more research.
Therefore, in this study, we conducted bioinformatics analyses to explore the role of TMEM17 in GBM occurrence and progression in vitro and in vivo to provide novel therapeutic targets for the treatment of GBM.
Gene expression data and clinical information for pan-cancer analysis were obtained from The Cancer Genome Atlas (TCGA) database. First, the TCGA database (https://portal.gdc.cancer.gov/) was accessed to select RNA sequencing (RNA-Seq) gene expression data across multiple cancer types and the corresponding clinical information, including patient demographics, tumor staging, survival data, and treatment details.
Combining clinical data from The Cancer Genome Atlas with gene expression data, Kaplan–Meier analysis of patients’ overall survival (OS), disease-free survival (DSS), and progression-free interval (PFI) was performed. Furthermore, the prognostic significance of TMEM17 on OS was evaluated by univariate Cox regression analysis. we performed univariate and multivariate Cox regression analyses and utilized the “forestplot” package (version 3.1.3) to generate forest plots displaying the p-values, hazard ratios (HR), and 95% confidence intervals (CI) for each variable. Based on the results of the multivariate Cox proportional hazards model, we then constructed a nomogram using the “rms” package (version 6.8-1) to predict the overall recurrence rate over 5 years. The nomogram graphically represents these factors, allowing the calculation of individual patient prognosis risk based on the points associated with each risk factor.
To examine the differences in TMEM17 expression between GBM and adjacent normal tissues, Thirty GBM samples and thirty adjacent normal tissues were collected from the First Affiliated Hospital of Guangxi Medical University (Nanning, China). This study received ethical approval from The First Affiliated Hospital of Guangxi Medical University Ethics Committee (Approval No. 2023-E108-01).
LN229 and U87MG GBM cell lines were acquired from Procell Life Science & Technology Co., Ltd. (Wuhan, China). Cells were cultured in Dulbecco’s Modified Eagle Medium (Keygen Biotech, Nanjing, China) supplemented with 10% fetal bovine serum (Gibco, Thermo Fisher Scientific, Waltham, MA, USA) and 1% penicillin/streptomycin (100 U/mL) at 37 °C and 5% CO2. The TMEM17 antibody (sc-514433) was from Santa Cruz Biotechnology Inc. (Dallas, TX, USA). We employed lentivirus for transfection, and constructed TMEM17 knockdown (sh-RILP) and an empty vector control (sh-NC) (OBiO Technology Corp. Ltd., Shanghai, China). Validation of all cell lines was performed by short tandem repeat profiling, and cells with mycoplasma contamination was excluded.
The protein concentration was quantified using a Bicinchoninic Acid (BCA) protein assay kit (Beyotime, Beijing, China) after total protein extraction from the cells. A 10% sodium dodecyl-sulfate polyacrylamide gel electrophoresis (SDS-PAGE) gel was used to separate the protein samples, followed by electrotransfer to polyvinylidene difluoride (PVDF) membranes. After being blocked in 5% defatted milk in Tris-buffered saline with Tween 20 for 1 h, the membranes were incubated overnight at 4 °C with primary antibodies against TMEM17 (sc-94962; Santa Cruz Biotechnology), GAPDH (sc-47724; Santa Cruz Biotechnology), and rabbit IgG (Proteintech, Wuhan, China). Then membranes were incubated for 2 h at room temperature with horseradish peroxidase-conjugated secondary antibodies. Proteins were detected with an ECL kit (Beyotime) and quantified using ImageJ (version 1.47V, https://imagej.net/ij/).
For the Cell Counting Kit-8 (CCK-8) assay, LN229 and U87MG cells were seeded
into 96-well plates at a density of 5
To measure cell proliferation, the EdU assay was performed. Briefly, cells transfected with sh-NC or sh-TMEM17 were plated in 24-well plates and incubated overnight. According to the instructions of the EdU detection kit (RiboBio, Guangzhou, China), cells were incubated with EdU for 2 hours to allow incorporation into newly synthesized DNA. After incubation, cells were fixed with 4% paraformaldehyde for 15 minutes at room temperature, and then permeabilized with 0.5% Triton X-100 for 20 minutes. Subsequently, cells were stained with Apollo reaction cocktail for 30 minutes in the dark to visualize the incorporated EdU. Finally, cell nuclei were counterstained with Hoechst 33342 for 10 minutes. Proliferating cells were detected using fluorescence microscopy (Model BX50F, Olympus, Tokyo, Japan).
Transwell chambers (Corning, Corning, NY, USA) with diluted Matrigel (BD Biosciences, Franklin Lakes, NJ, USA) in each upper chamber were used for the invasion assays. Upper chambers were filled with serum-free medium, while lower chambers were filled with complete medium. In the lower chamber, 4% paraformaldehyde was used for cell fixation and 0.1% crystal violet was used to stain the cells after 24 h of incubation. Observations and counts were made under the microscope (Model CX23, Olympus, Tokyo, Japan) of the chamber.
Flow cytometry was used to measure apoptosis of LN229 and U87MG cells treated for 48 h with sh-NC and sh-TMEM17. Following trypsinization, the cells were collected, resuspended in Binding Buffer, and analyzed according to the instructions of the annexin V-FITC apoptosis detection kit (Thermo Fisher Scientific, Waltham, MA, USA). Next, the cells were analyzed by flow cytometry (BD FACSCanto II, BD Biosciences, San Jose, CA, USA) and quantified using FlowJo software (version 10.7, https://www.flowjo.com/solutions/flowjo).
The lentivirus was designed and constructed by OBiO Technology (Shanghai, China) for the overexpression of Ying Yang 1 (YY1) with GFP. Following the manufacturer’s instructions, lentiviral vectors were transfected into the cells. The control cells were transfected with an empty vector expressing GFP. YY1-overexpressing cells were named OE cells.
The dual luciferase assay was conducted using Promega Corporation’s Dual Luciferase Reporter Assay Kit (Madison, WI, USA). Wild type (WT) or mutant TMEM17 sequences were inserted into pGL3 luciferase reporter vectors. Transient transfection was carried out using Lipofectamine 3000 (Thermo Fisher Scientific, Carlsbad, CA, USA), according to the manufacturer’s instructions. The Dual-Glo Luciferase Assay System from Promega was used to measure firefly luciferase activity 1–2 days after transfection. Renilla luciferase activity was used as an internal control.
SPSS (Version 23, IBM-SPSS Statistics, IBM Corporation, Armonk, NY, USA) and
GraphPad Prism 7 (Version 7, GraphPad Software, San Diego, CA, USA) were used for
the statistical analyses. Continuous variables are expressed as the mean
A pan-cancer RNA sequencing study was conducted using TCGA and Genotype-Tissue Expression (GTEx) databases to examine TMEM17 expression. Our results indicated significant differences in TMEM17 expression across 33 cancer types, with 24 of them displaying distinct expression patterns. Specifically, in cancers such as cholangiocarcinoma (CHOL), colon adenocarcinoma, diffuse large B cell lymphoma (DBLCL), esophageal carcinoma, GBM, head and neck squamous cell carcinoma, kidney renal papillary cell carcinoma, acute myeloid leukemia, low-grade glioma, liver hepatocellular carcinoma (LIHC), lung adenocarcinoma, lung squamous cell carcinoma, pancreatic adenocarcinoma, pheochromocytoma and paraganglioma (PCPG), prostate adenocarcinoma, skin cutaneous melanoma (SKCM), stomach adenocarcinoma (STAD), thyroid carcinoma (THCA), and thymoma (THYM), TMEM17 was upregulated in tumor tissues compared to normal tissues. However, in adenoid cystic carcinoma (ACC), kidney chromophobe, kidney renal clear cell carcinoma (KIRC), ovarian (OV), and tenosynovial giant cell tumor (TGCT), TMEM17 expression was lower (Fig. 1A,B). To further elucidate the expression patterns of TMEM17, we conducted separate analyses using data from TCGA, GTEx, and Cancer Cell Line Encyclopedia (CCLE) datasets. In TCGA tumor tissues, TMEM17 was relatively highly expressed in PCPG, GBM, and THCA, while it had relatively low expression in DLBCL, LIHC, and STAD. In GTEx normal tissues, TMEM17 showed relatively high expression in TGCT, ACC, and GBM, but relatively low expression in THYM, DLBC, and LIHC. In a number of cancer cell lines from the CCLE dataset, TMEM17 exhibited relatively high expression in SKCM, small cell lung cancer, and GBM, but showed relatively low expression in DLBCL, chronic lymphocytic leukemia, and multiple myeloma (Fig. 1C). Additionally, our analyses of TMEM17 protein levels using the Human Protein Atlas (HPA) database revealed that in tumor tissues of breast cancer, GBM, uterine corpus endometrial carcinoma, and LIHC, TMEM17 levels were higher than in normal tissues (Fig. 1D). Subcellular localization of TMEM17 was evaluated in various cell lines, including A-431 epidermoid carcinoma, U-251MG GBM, and U-2OS osteosarcoma cell lines (Fig. 1E).
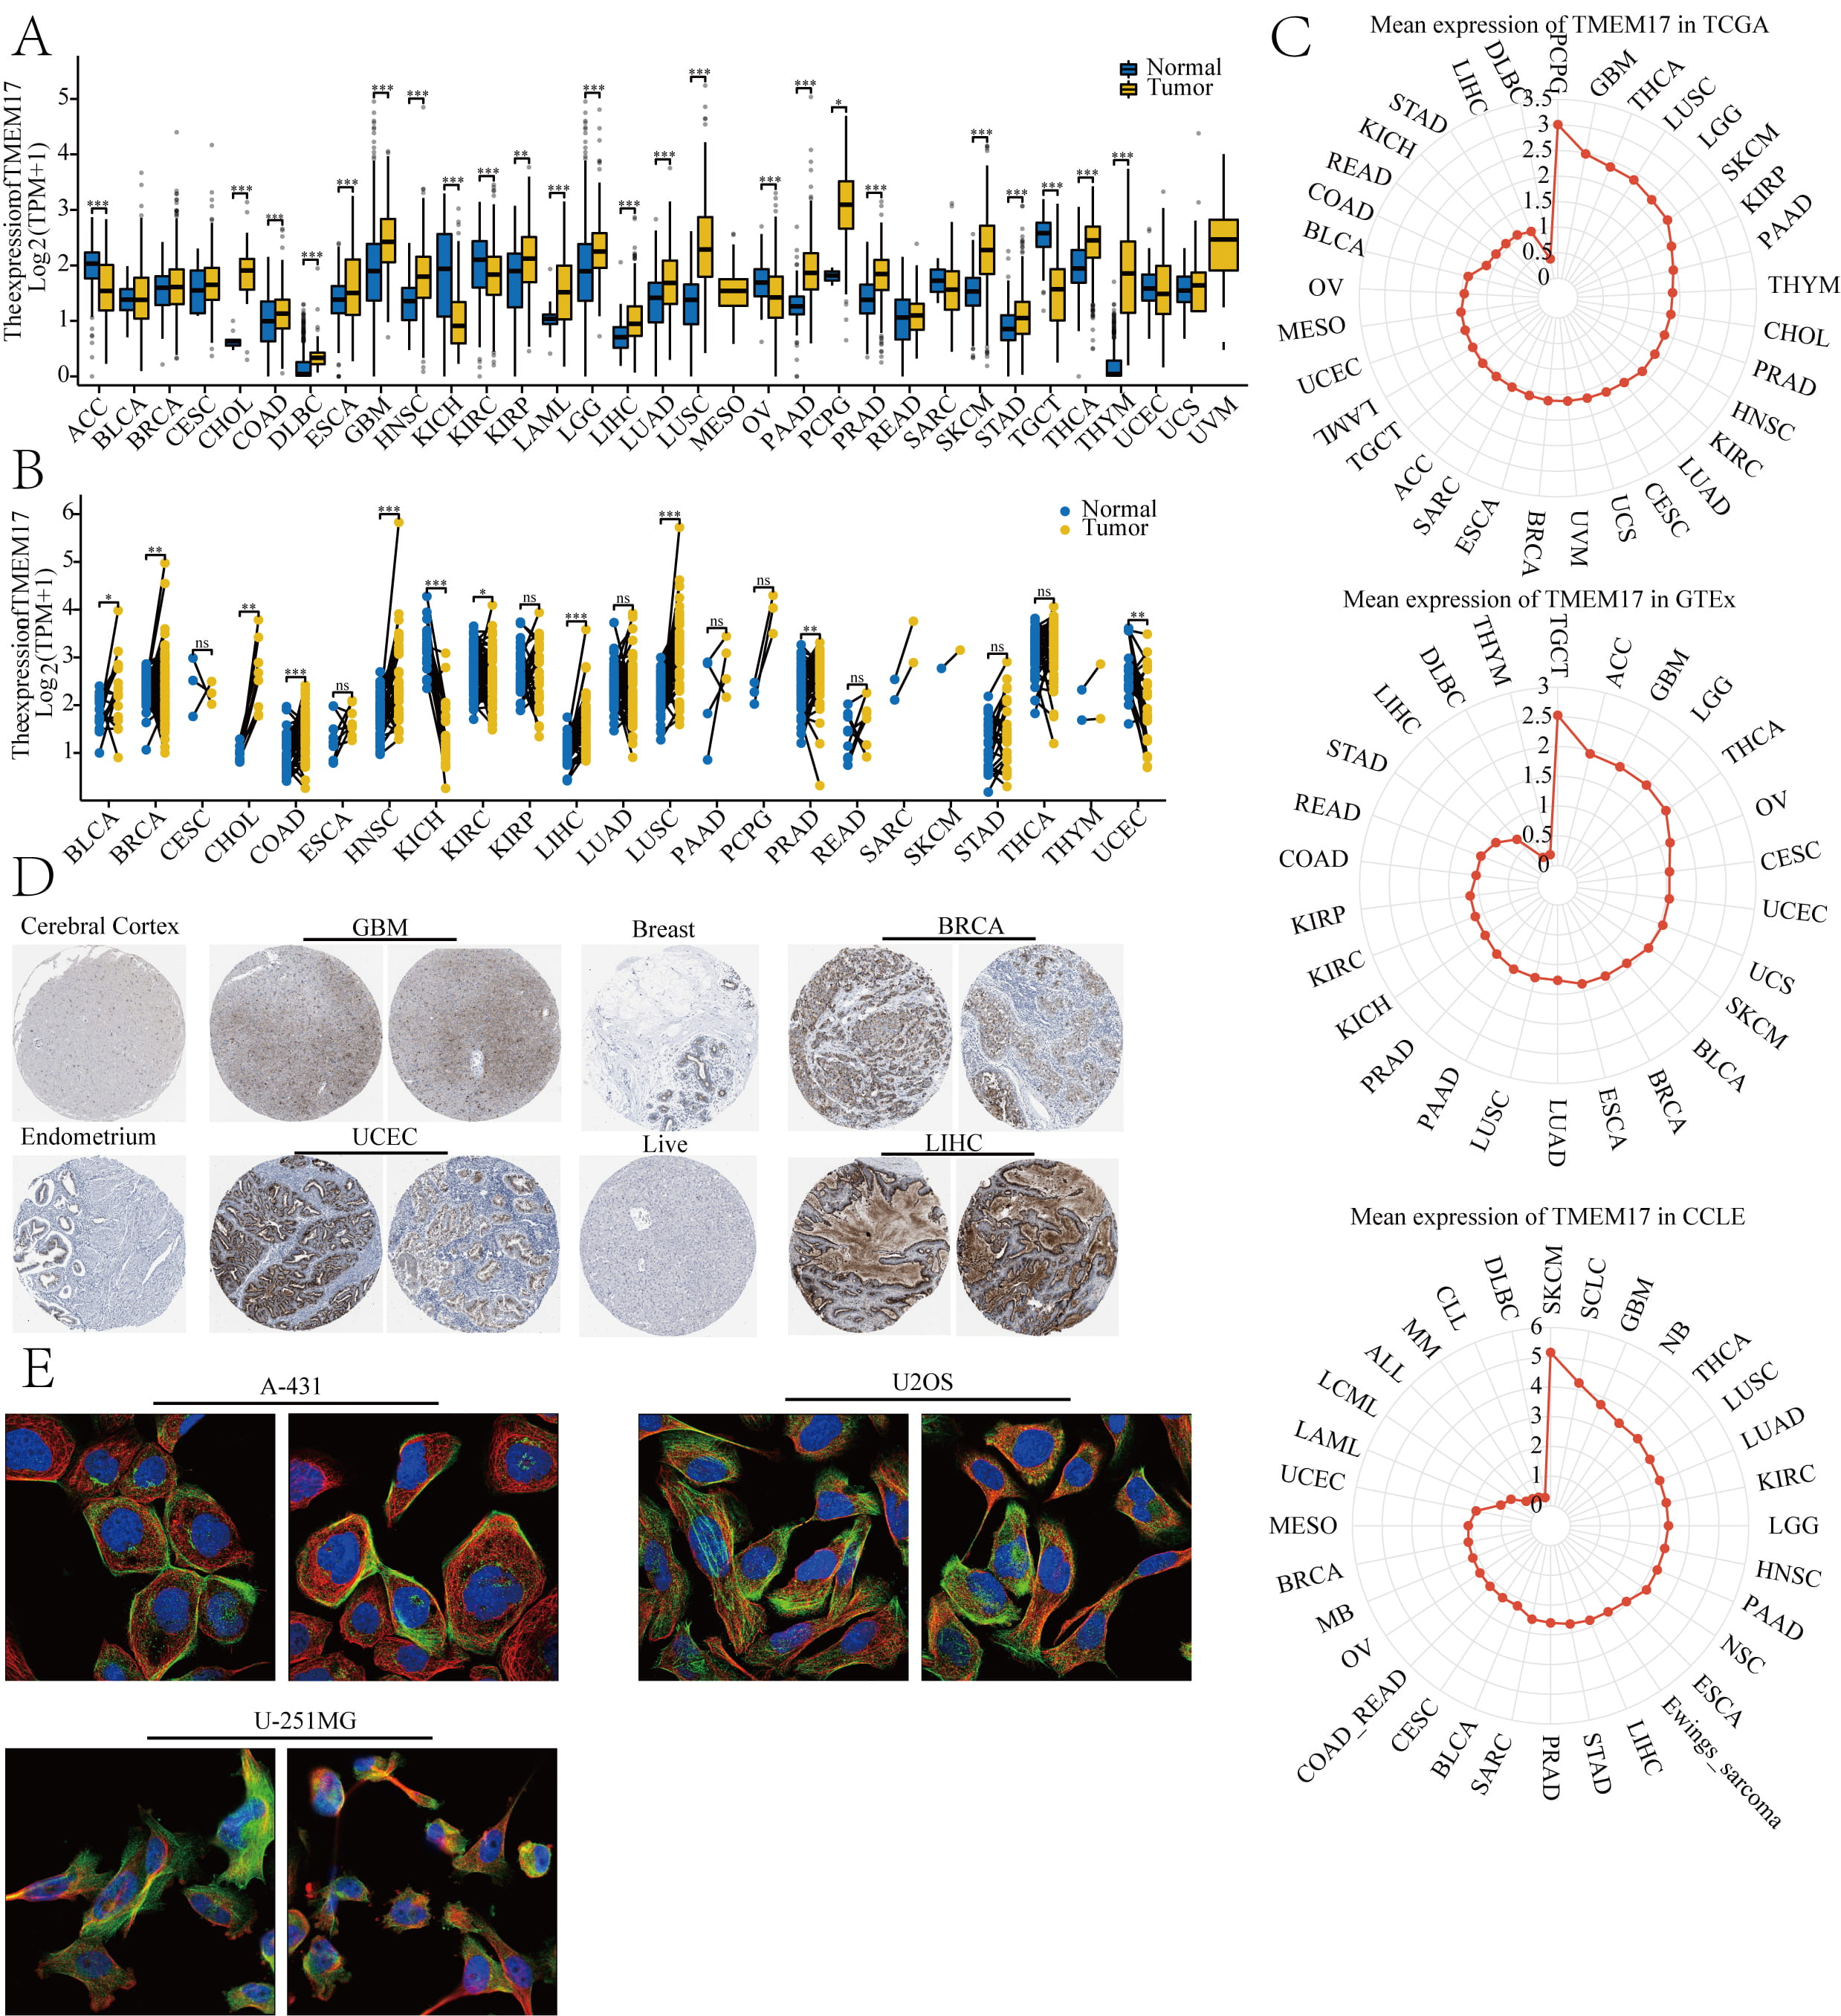 Fig. 1.
TMEM17 expression levels and localization. (A) Based on TCGA
database, the expression of TMEM17 was analyzed in paired samples. (B)
TMEM17 showed higher expression in paired tumor samples compared to
adjacent tissues. (C) Expression levels of TMEM17 were analyzed across
TCGA, GTEx, and CCLE databases. (D) Protein expression of phosphofructokinase,
platelet in tumor samples was compared with normal samples across various cancers
according to the HPA database. Image credit: Human Protein Atlas, available at
v20.proteinatlas.org. The direct URL:
https://www.proteinatlas.org/ENSG00000186889-TMEM17/tissue and
https://www.proteinatlas.org/ENSG00000186889-TMEM17/pathology. (E) Subcellular
localization of TMEM17 was investigated in A-431, U-251MG, and U-2 OS cell lines,
also sourced from the HPA dataset. Image credit: Human Protein Atlas, available
at v20.proteinatlas.org. The direct URL:
https://www.proteinatlas.org/ENSG00000186889-TMEM17/subcellular#human.
Statistical significance levels are indicated by ns, no significant, *p
By analyzing the clinical data of various tumors in TCGA, we investigated the prognostic role of TMEM17. The results of univariate Cox analysis of OS showed that high expression of TMEM17 was correlated with poor OS in ACC, bladder cancer (BLCA), CHOL, GBM, LIHC, and STAD, while it had the opposite effect in KIRC, mesothelioma (MESO), and SKCM, indicating that high expression of TMEM17 was associated with good OS (Fig. 2A). Kaplan–Meier analysis of OS also supported these results (Fig. 2B). It is worth noting that the random forest plot showed that TMEM17 is a risk factor for the prognosis of GBM (1.8008, 95% CI [1.2373, 2.62093]).
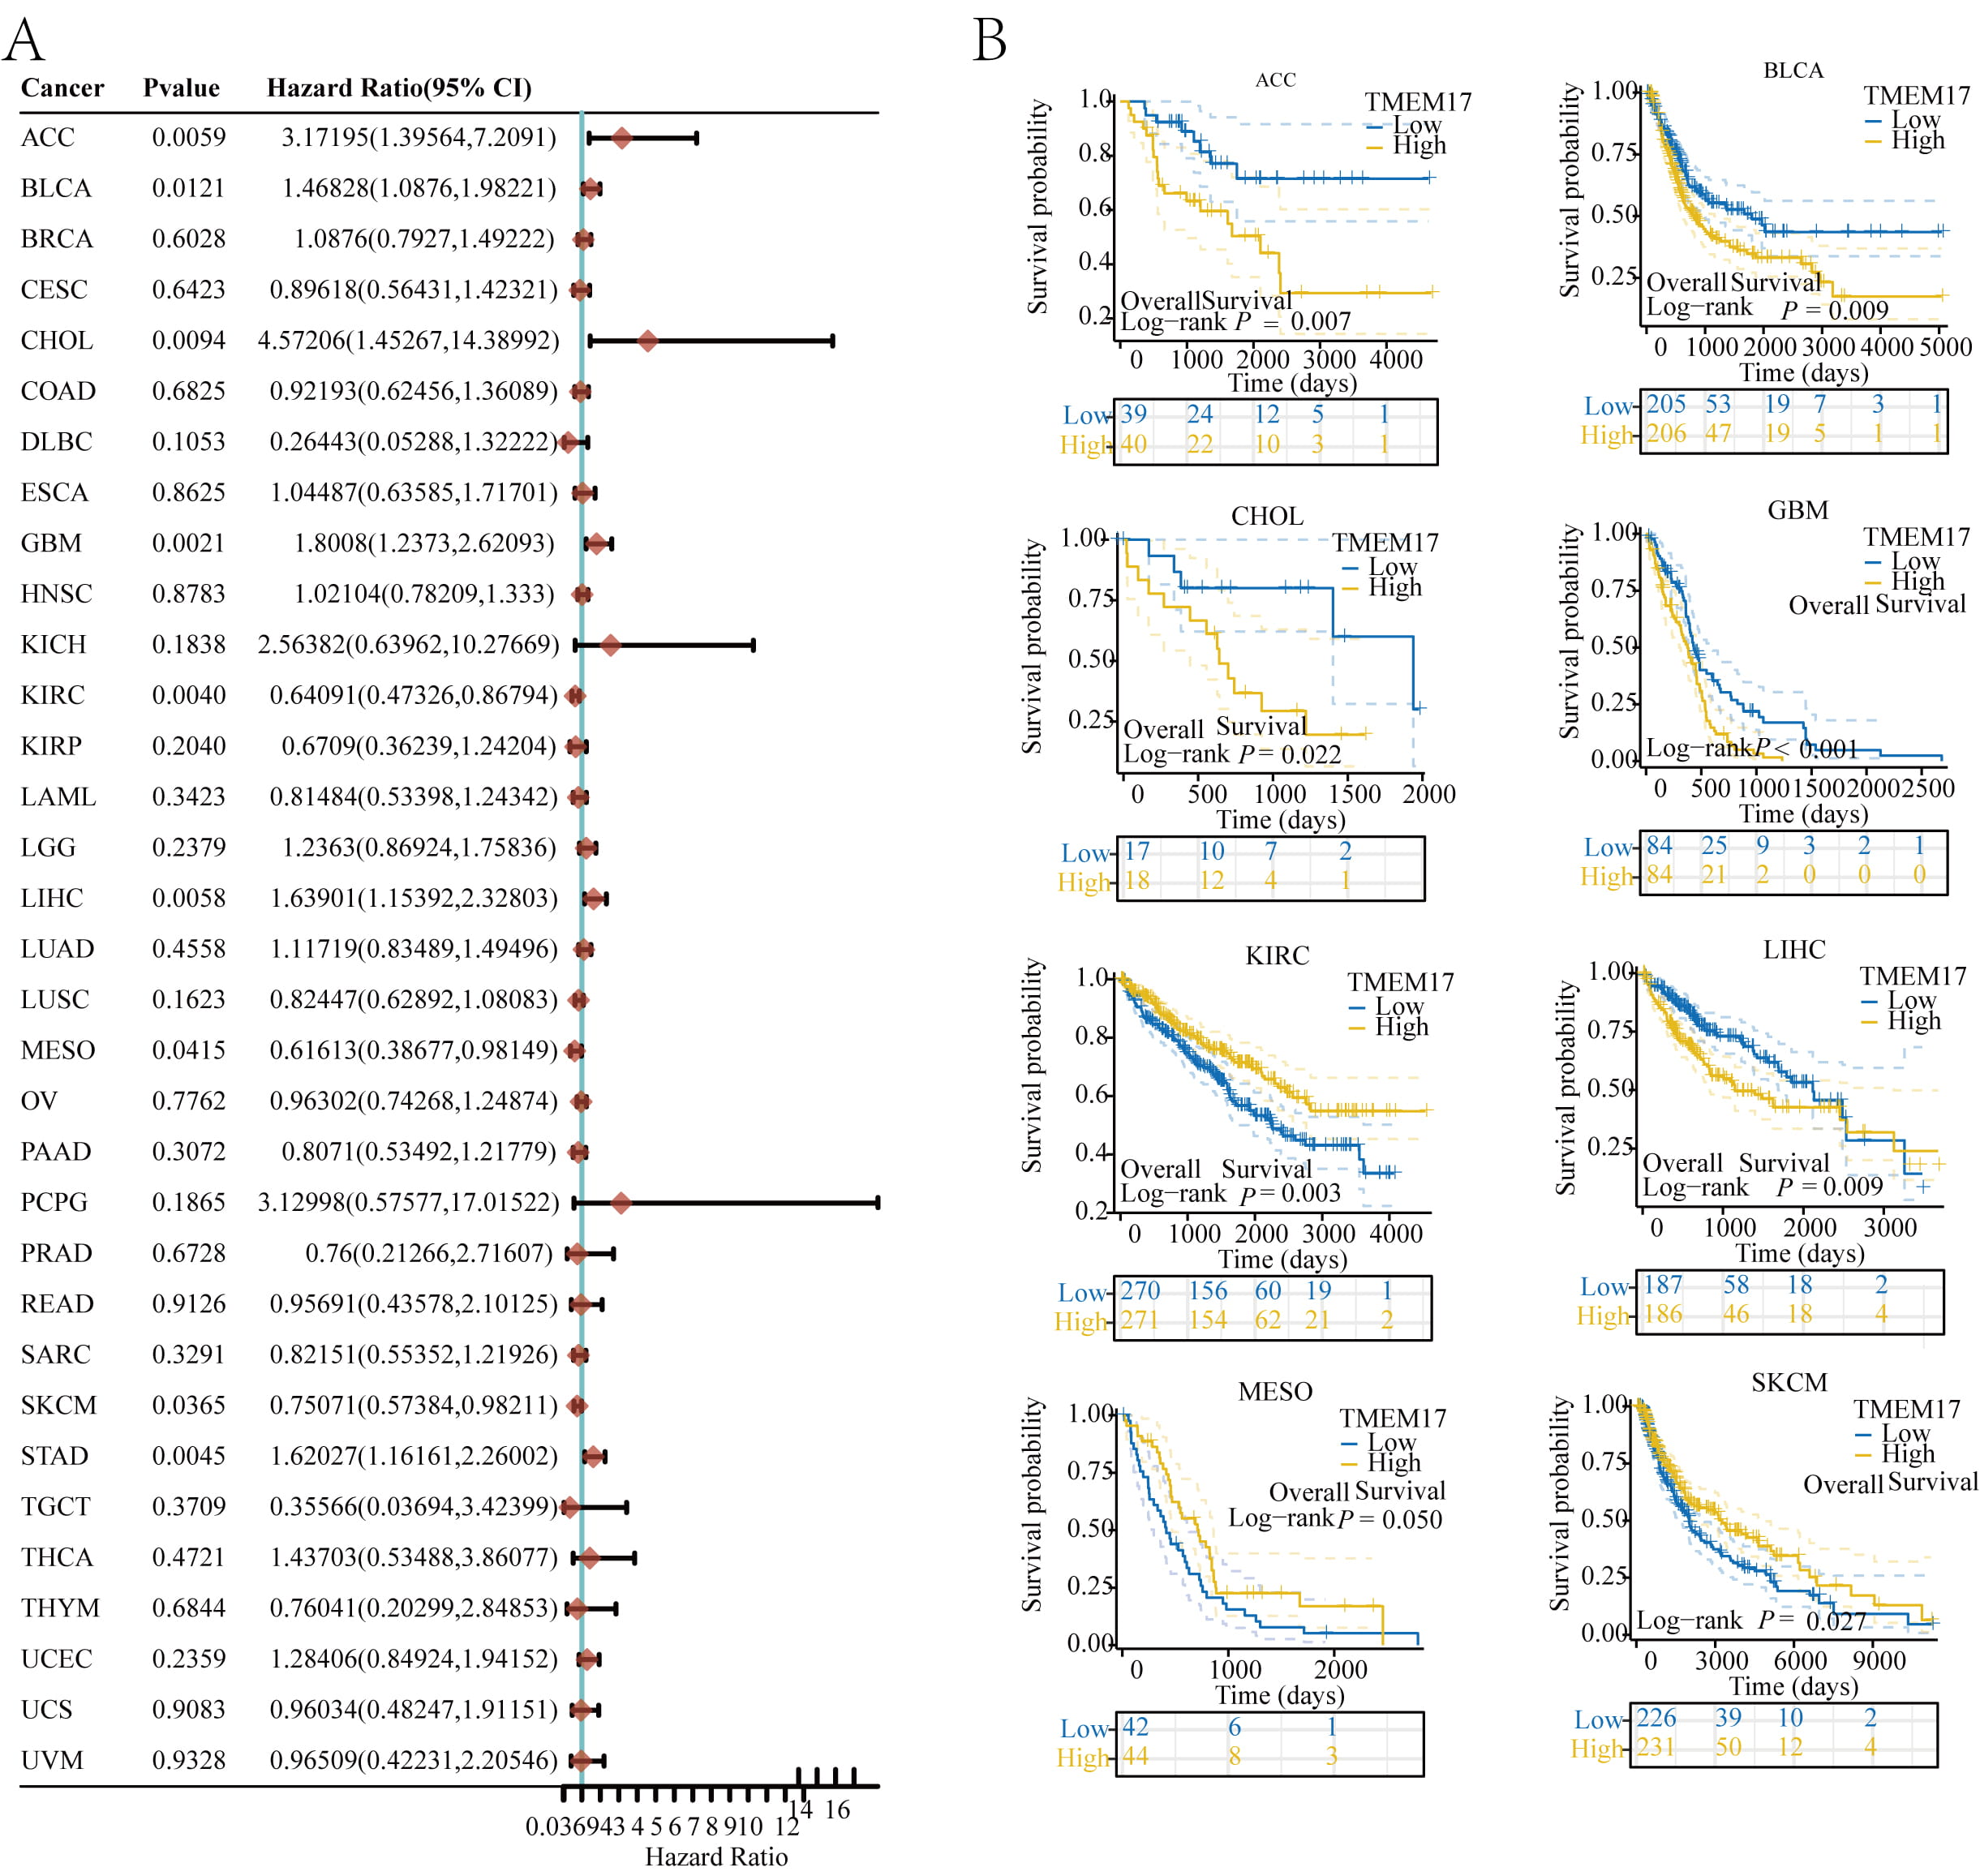 Fig. 2.
Prognostic value of TMEM17. (A) OS and expression of TMEM17 were correlated using random forest plots. (B) Kaplan–Meier curve shows the OS rates for different types of tumors including ACC, BLCA, CHOL, GBM, KIRC, LIHC, MESO, SKCM, and STAD. OS, overall survival; ACC, adenoid cystic carcinoma; BLCA, bladder cancer; CHOL, cholangiocarcinoma; GBM, Glioblastoma; KIRC, kidney renal clear cell carcinoma; LIHC, liver hepatocellular carcinoma; MESO, mesothelioma; SKCM, skin cutaneous melanoma; STAD, stomach adenocarcinoma; CI, confidence interval.
After conducting the aforementioned analyses, we found that TMEM17 exhibited a poor prognosis across all three types of GBM. As a result, we conducted a more comprehensive investigation into the prognostic impact of TMEM17 in GBM. Therefore, the baseline data of GBM patients from the database are shown in Table 1. To this end, we classified patients into two groups based on OV/PFI/DSS and analyzed the expression of TMEM17 within each group. According to the results, TMEM17 expression was not significantly different in OS, but there were noticeable differences in PFI and DSS between the two groups. Additionally, we assessed whether gene expression was correlated with patient survival status. Our findings indicated that as gene expression levels increased, the number of deceased patients increased, whereas the number of surviving patients decreased (Fig. 3A). The results of multivariate Cox proportional hazard regression analysis indicated that GBM patients who expressed high levels of TMEM17 were more likely to die sooner than those who did not. TMEM17 has been identified as an independent risk factor associated with decreased survival in patients with GBM (Fig. 3B). We used forest plots to display the scores of independent risk factor variables (Fig. 3C), and calibration curves to predict the accuracy of the model (Fig. 3D).
| Characteristics | Low expression of TMEM17 | High expression of TMEM17 | p value | |
| n | 84 | 84 | ||
| IDH status, n (%) | 0.257 | |||
| WT | 74 (46%) | 75 (46.6%) | ||
| Mut | 8 (5%) | 4 (2.5%) | ||
| Karnofsky performance score, n (%) | 0.156 | |||
| 23 (18%) | 13 (10.2%) | |||
| 46 (35.9%) | 46 (35.9%) | |||
| Gender, n (%) | 0.036 | |||
| Female | 36 (21.4%) | 23 (13.7%) | ||
| Male | 48 (28.6%) | 61 (36.3%) | ||
| Age, n (%) | 0.643 | |||
| 45 (26.8%) | 42 (25%) | |||
| 39 (23.2%) | 42 (25%) | |||
IDH, Isocitrate Dehydrogenase; WT, wild type; GBM, Glioblastoma.
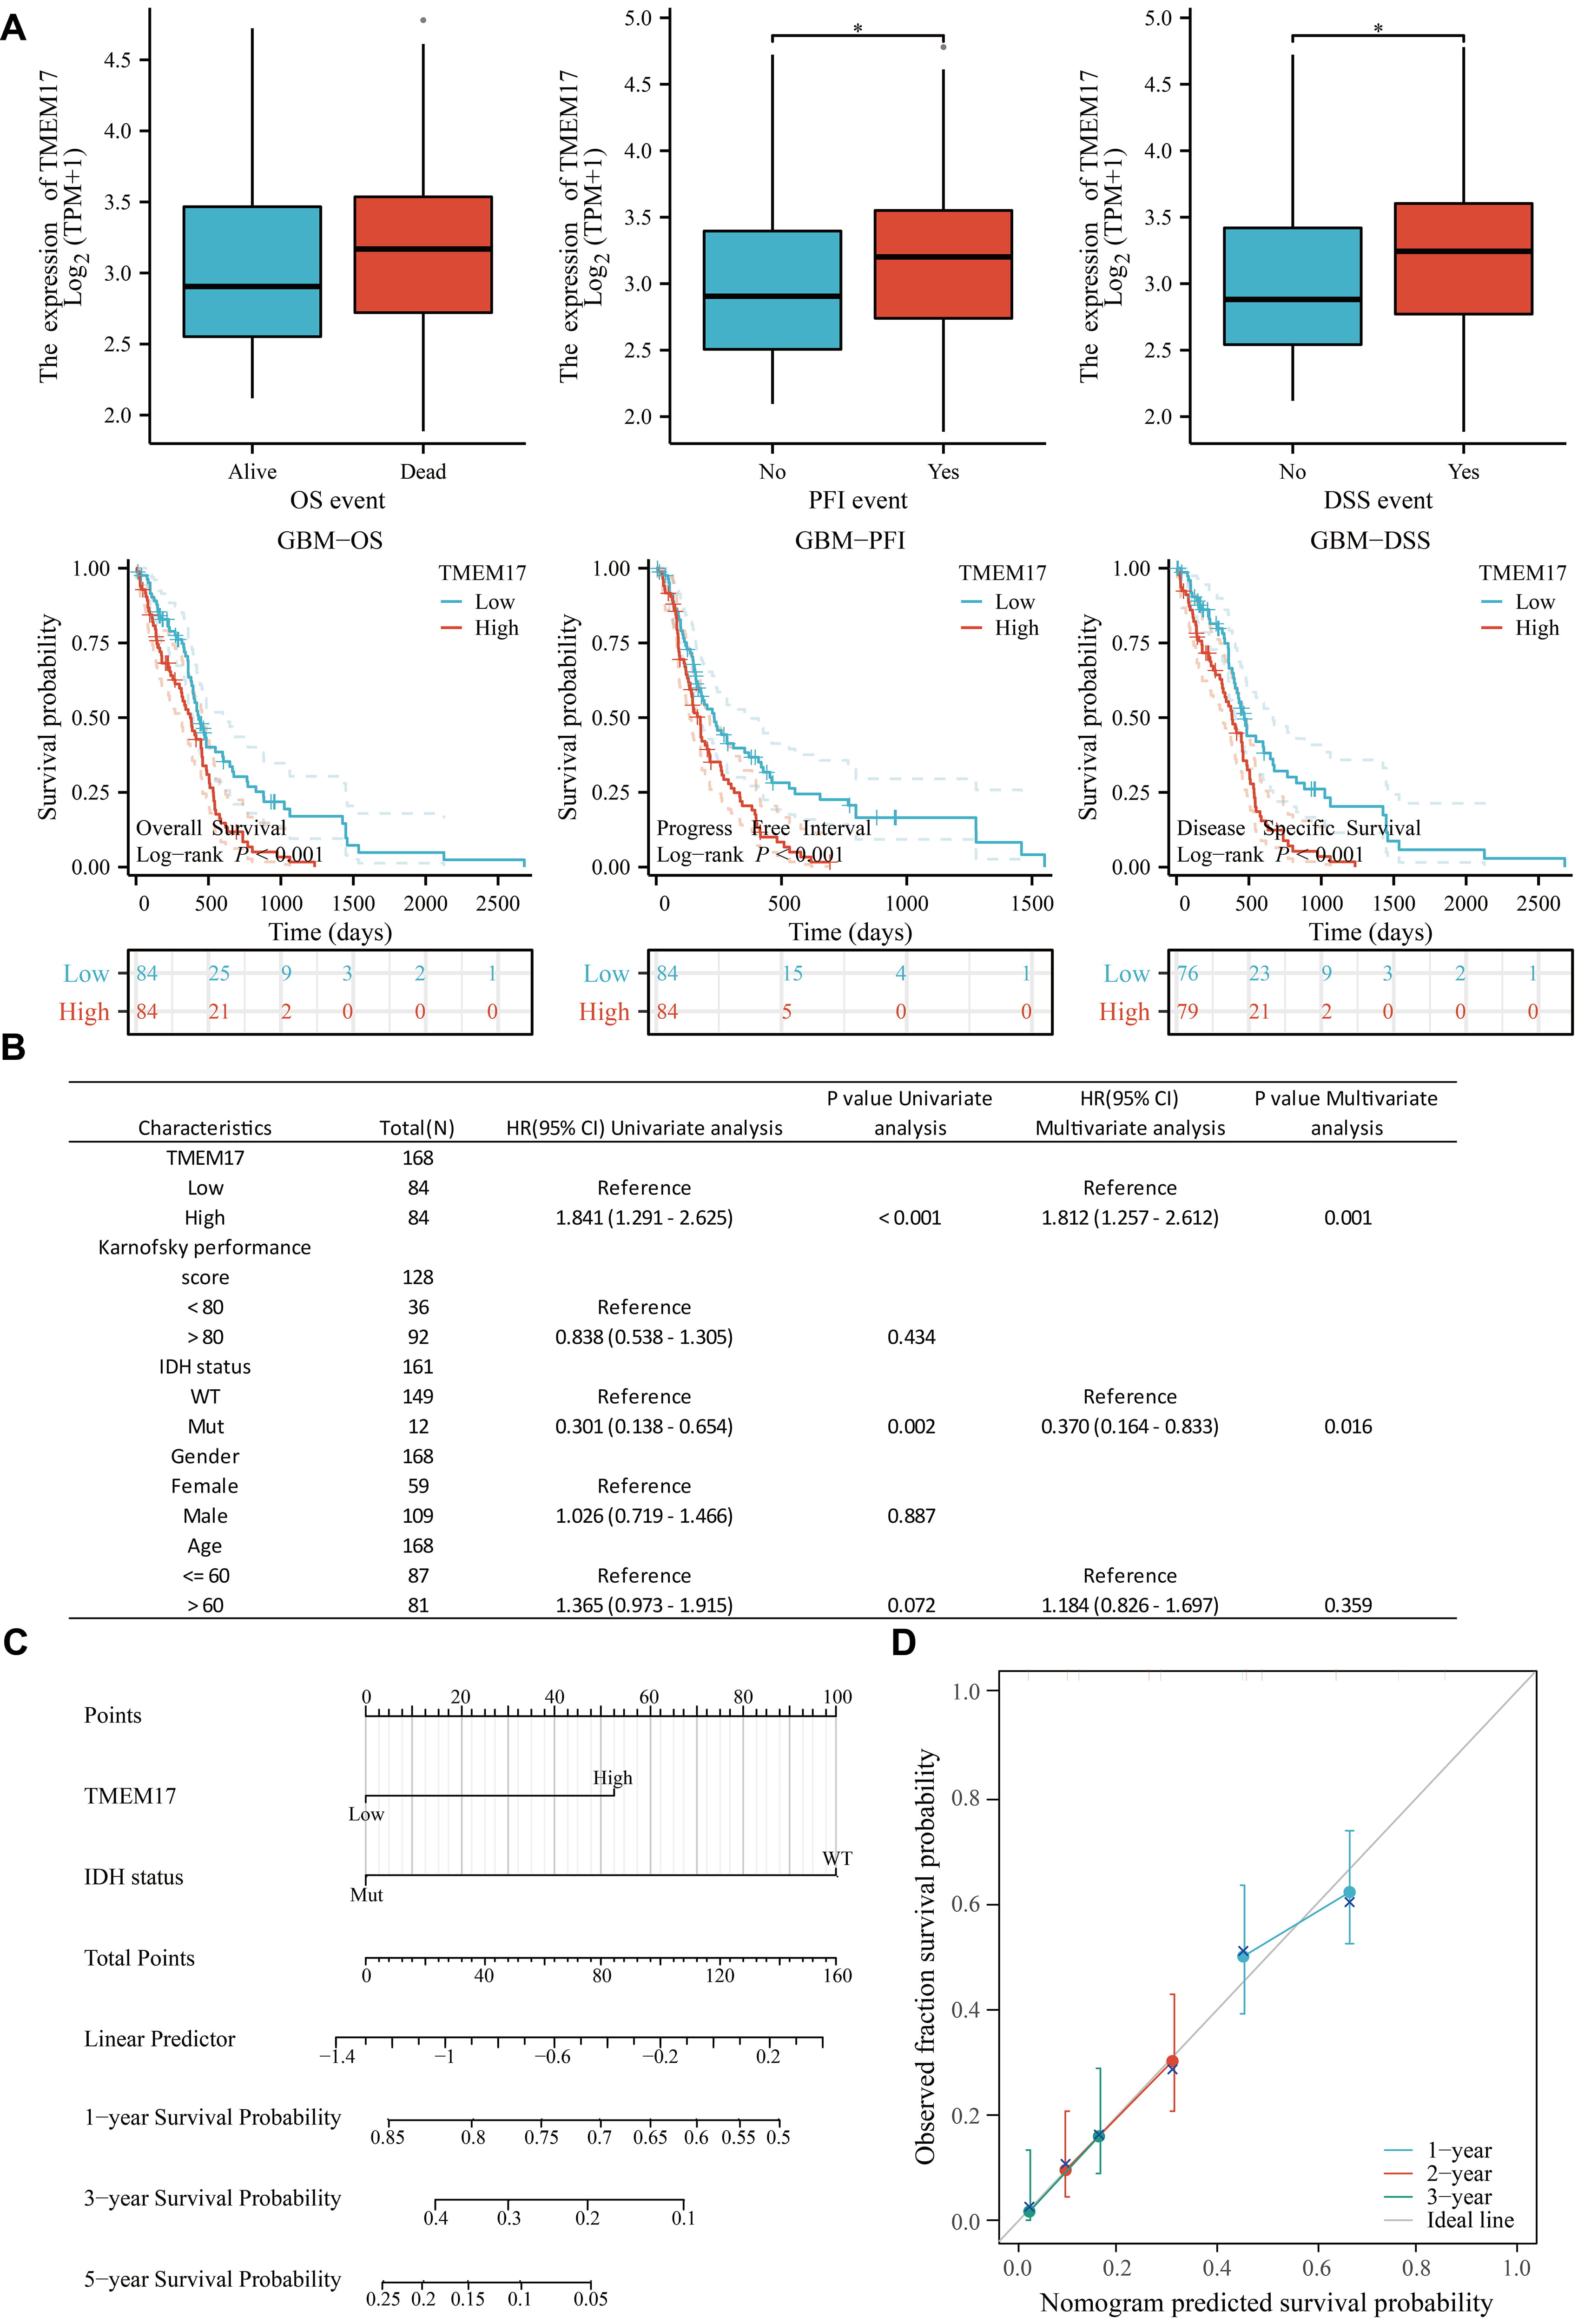 Fig. 3.
Survival prognosis analysis of TMEM17 in GBM.
(A) Expression of TMEM17 in surviving patients with different OS, Progression-Free Interval (PFI),
and Disease-Specific Survival (DSS), and its relationship with patient survival prognosis. (B) Univariate and
multivariate Cox analyses of TMEM17 in GBM. (C) Univariate and
multivariate forest plots. (D) Prognostic forest plot. Statistical significance
levels are indicated by *p
Our results confirmed the crucial role of TMEM17 in the progression of GBM. To further explore this finding, we randomly selected tumor tissues and adjacent normal tissues from 30 GBM patients from the sample bank of the First Affiliated Hospital of Guangxi Medical University. We analyzed the mRNA and protein levels of TMEM17 in these samples using Western blotting and quantitative PCR (qPCR) techniques. The study results showed that the mRNA and protein levels of TMEM17 were significantly higher in GBM tissues compared to normal tissues (Fig. 4A,B). Additionally, we analyzed the expression of TMEM17 in different GBM cell lines using the CCLE database (Fig. 4C), and further validated the protein levels of TMEM17 in different cell lines through Western blotting. LN229 and U87MG cell lines exhibited the highest TMEM17 protein expression compared to normal glial cells (Fig. 4D). qPCR results further confirmed higher transcription levels of TMEM17 in LN229 and U87MG cells (Fig. 4E). To further explore the function of TMEM17 in GBM, we designed small interfering RNAs targeting TMEM17 and conducted gene knockdown experiments on LN229 and U87MG cells, validating knockdown efficiency through Western blot analysis and qPCR (Fig. 4F,G). To further investigate the role of TMEM17 in GBM, we measured cell viability using CCK-8 and EdU assays. The results showed that inhibition of TMEM17 significantly reduced the proliferation of GBM cells (Fig. 5A,B). To further explore the regulatory role of TMEM17 in GBM cells, we analyzed apoptotic cells using flow cytometry. The results showed that knocking down TMEM17 significantly increased the apoptosis rate of LN229 and U87MG cells (Fig. 5C). Additionally, results from the transwell assay showed that knockdown of TMEM17 inhibited the migratory function of GBM cells (Fig. 5D).
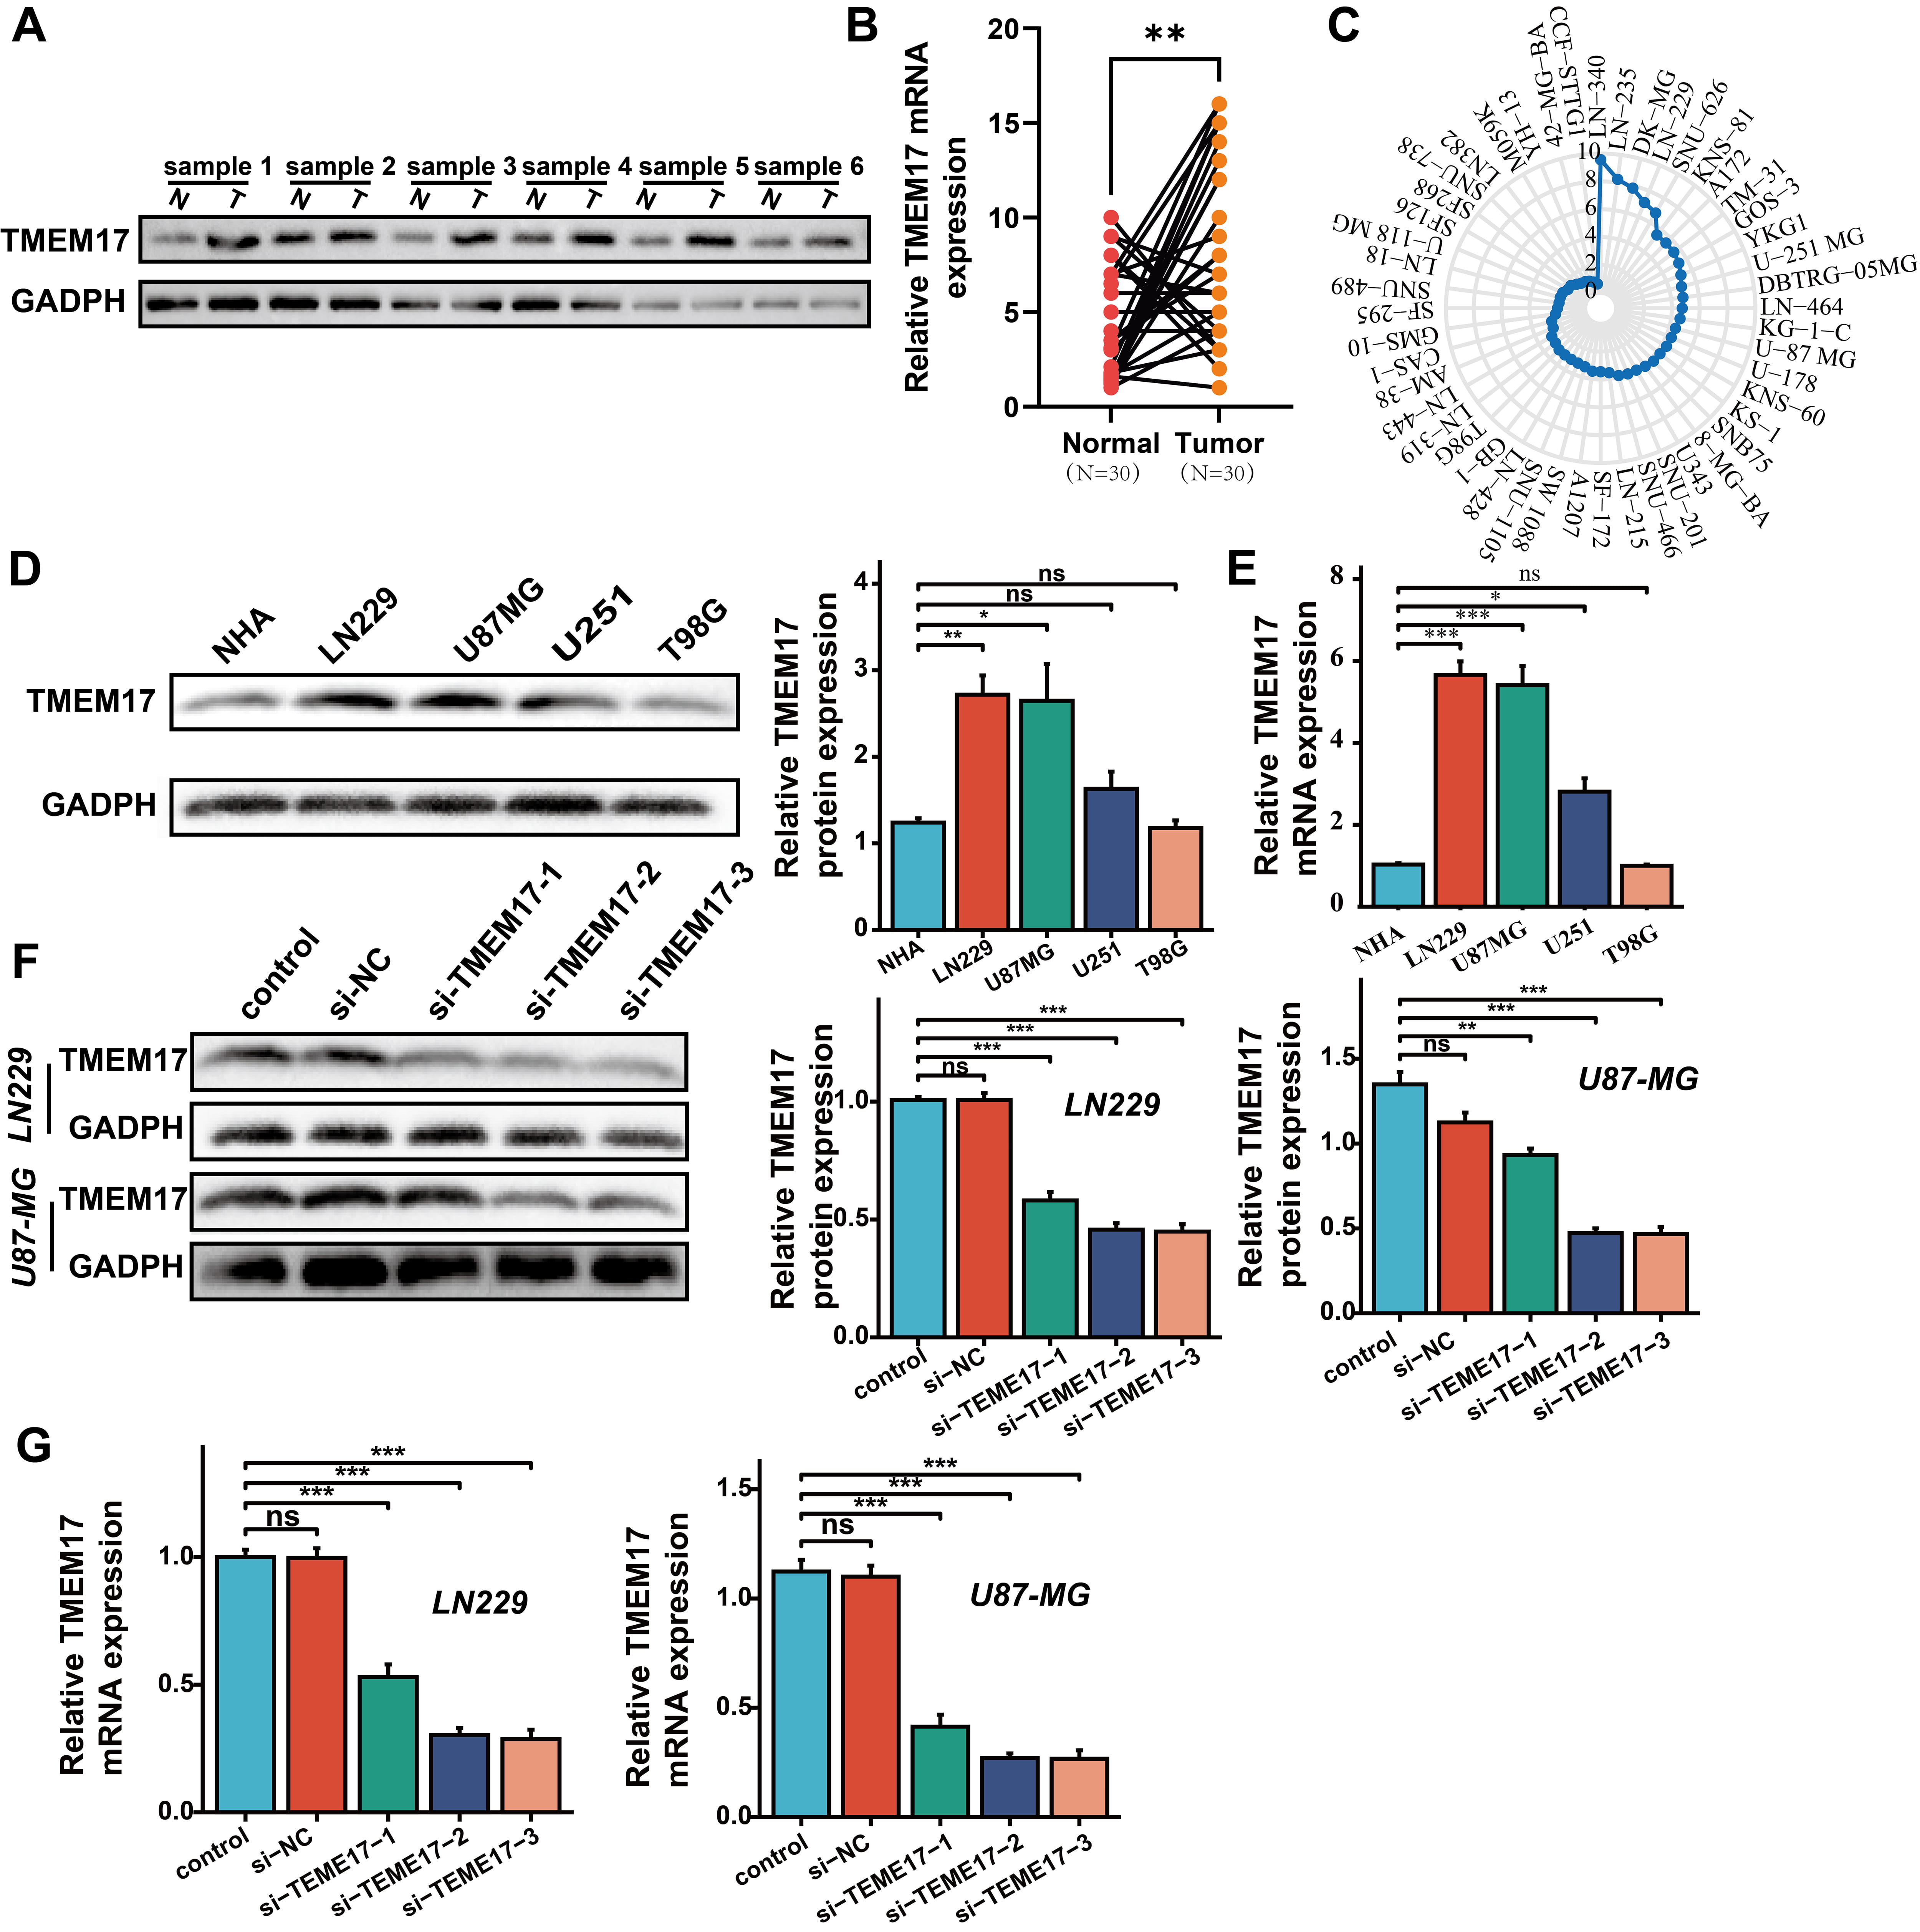 Fig. 4.
Validation of TMEM17 expression in GBM. (A) Western blot
analysis of TMEM17 protein levels in normal and tumor tissues. (B) Quantitative
polymerase chain reaction (qPCR) validation of TMEM17 mRNA levels in
normal and tumor tissues. (C) Expression of TMEM17 in GBM cell lines
from the Cancer Cell Line Encyclopedia (CCLE) database. (D) Western blot analysis
of TMEM17 protein levels in different GBM cell lines. (E) qPCR validation of
TMEM17 mRNA levels in different GBM cell lines. (F) Western blot
verification of TMEM17 knockdown efficiency in LN229 and U87MG cells. (G) qPCR
verification of TMEM17 knockdown efficiency in LN229 and U87MG cells.
Statistical significance levels are indicated by ns, no significant, *p
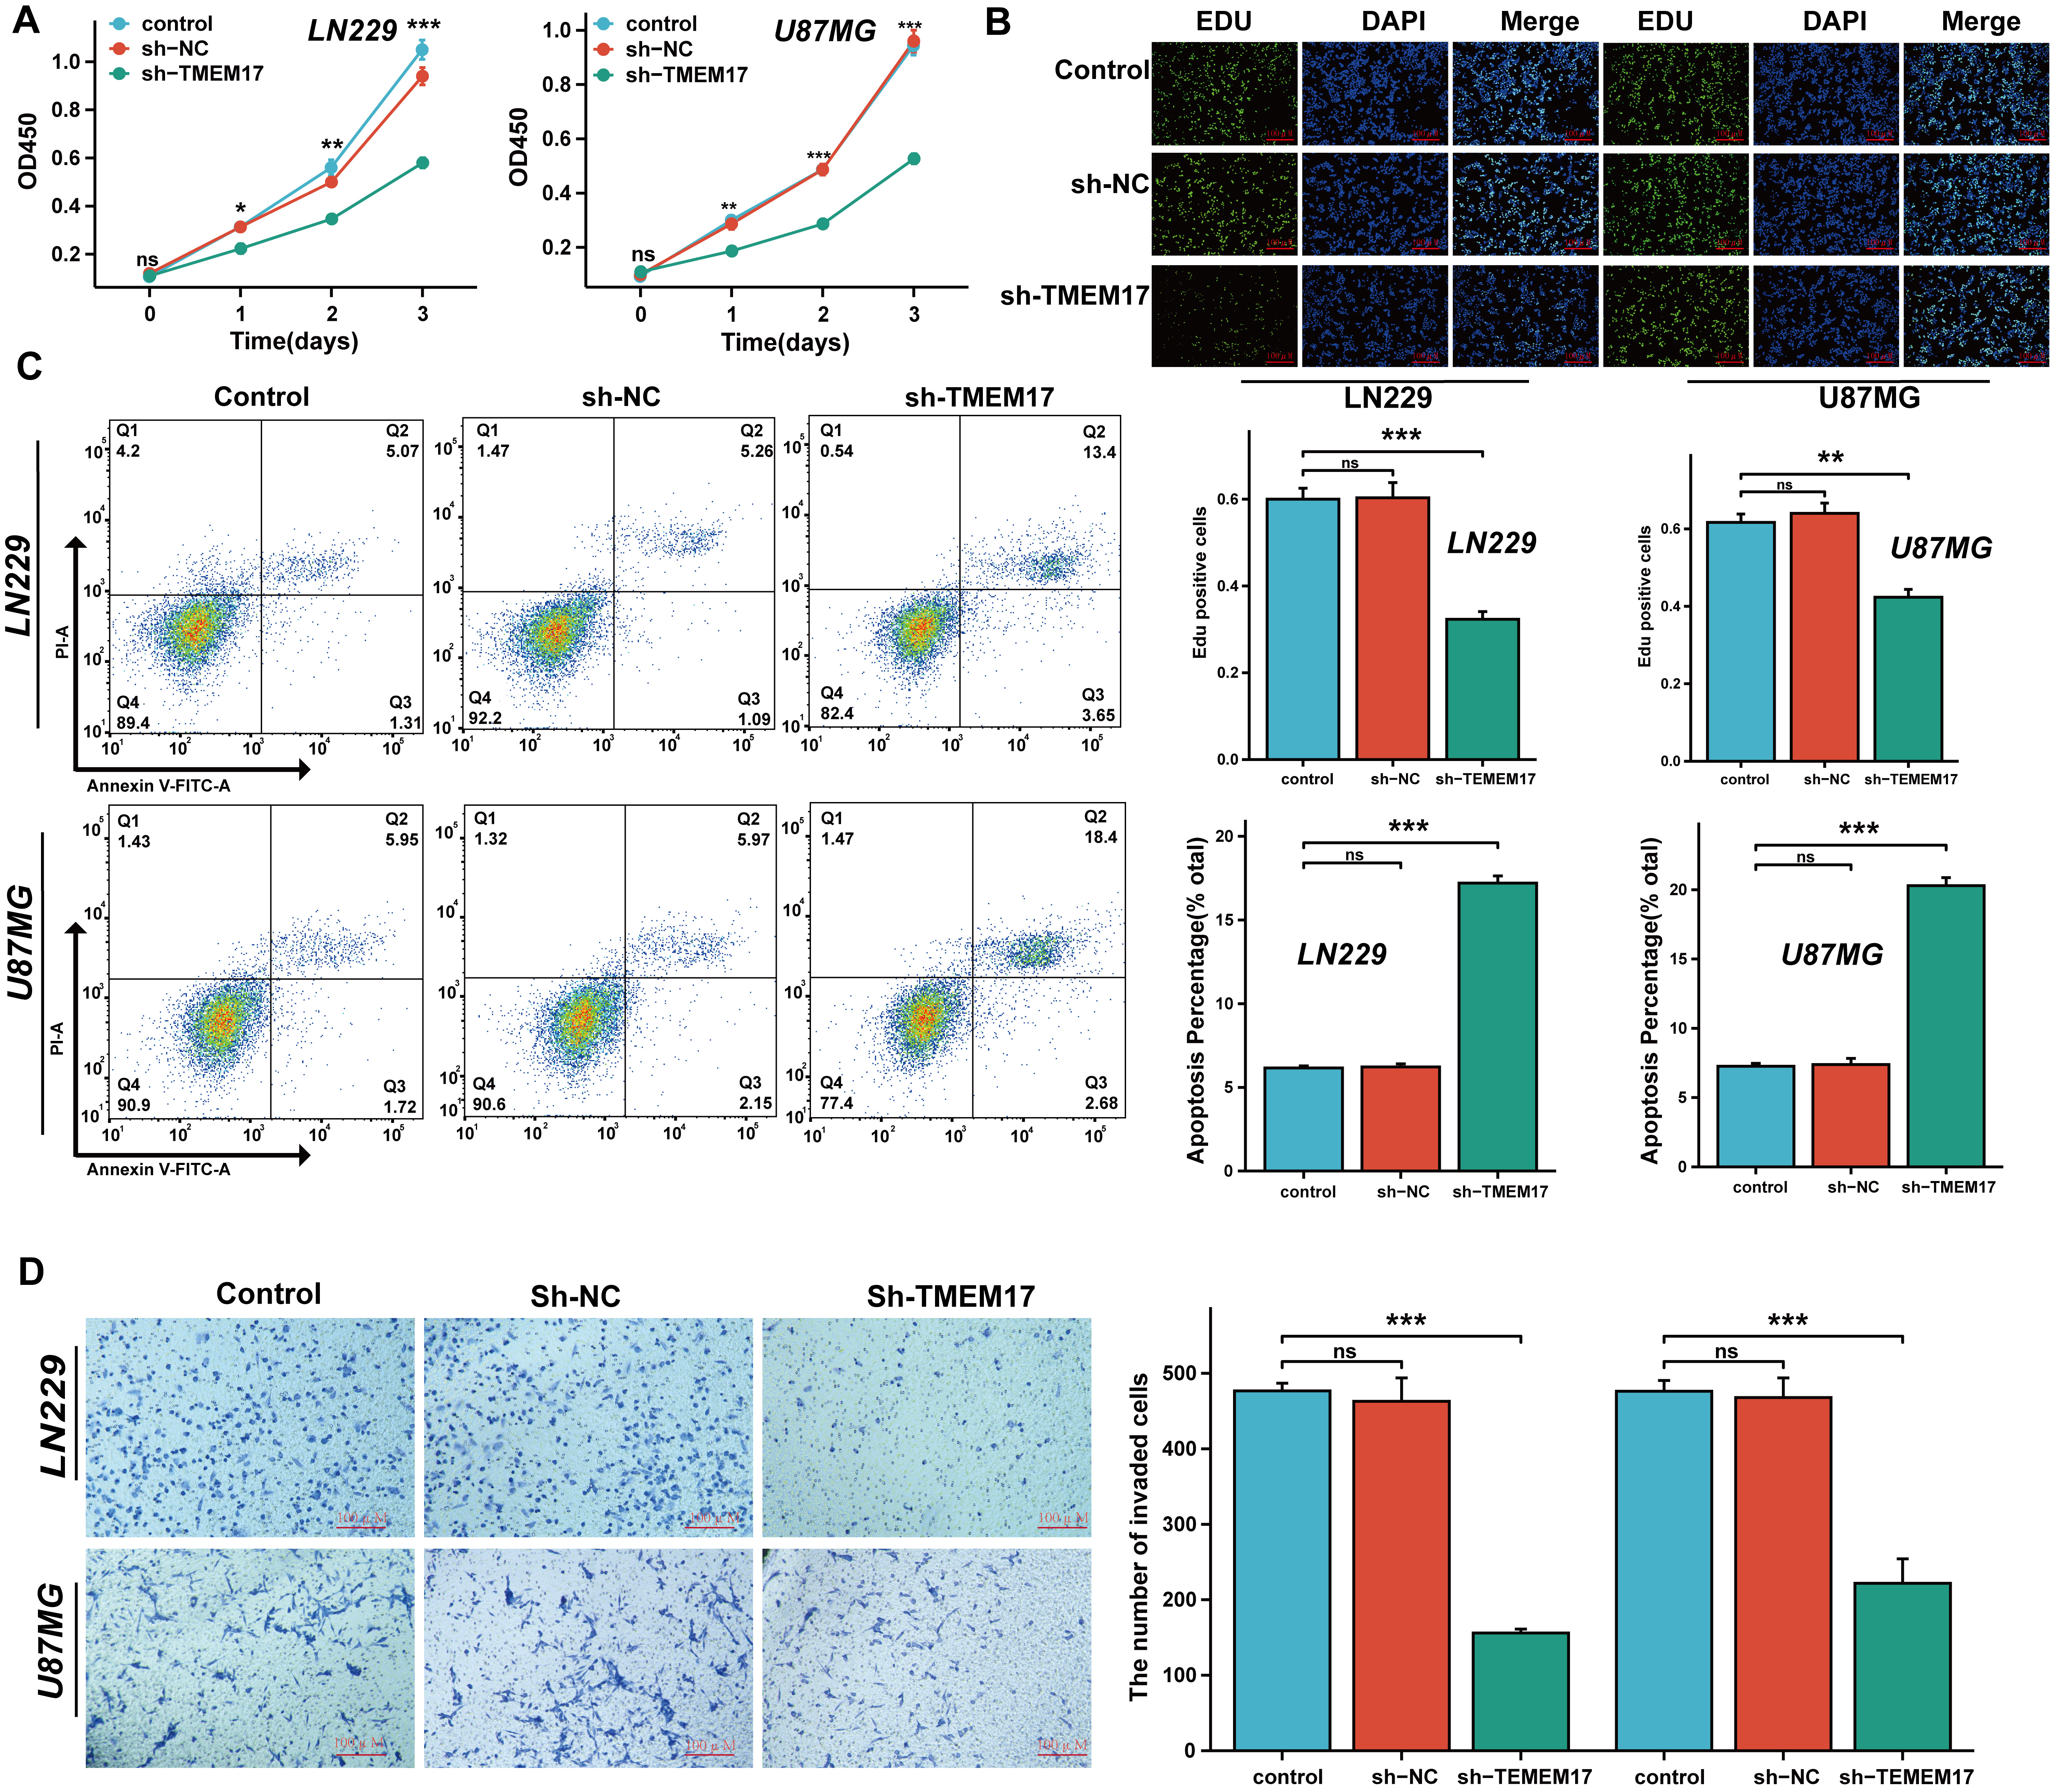 Fig. 5.
TMEM17 promotes proliferation in GBM cells. (A,B) Cell
proliferation was evaluated using the Cell Counting Kit-8 (CCK-8) assay (A) and
5-ethynyl-2
To further explore the mechanisms responsible for the upregulation of TMEM17 expression, we conducted computational analysis using the hTFtarget, Cistrome, Jaspar, and ENCODE databases to identify potential upstream transcription factors implicated in TMEM17 upregulation in GBM (Fig. 6A). This analysis showed that GATA-binding factor 2 (GATA2) and YY1 were the likely transcription factors influencing TMEM17. Notably, YY1 was found to be highly expressed in GBM, according to TCGA database (Fig. 6B). Experimental manipulation including knockdown and overexpression of YY1 influenced TMEM17 mRNA levels, whereas knockdown of GATA2 did not have significant effects (Supplementary Fig. 1A). Consequently, our study focused primarily on YY1. We obtained the DNA binding sequence of the YY1 transcription factor from the Jaspar database (Fig. 6C,D) and constructed a series of truncated TMEM17 promoter-luciferase constructs to determine how YY1 regulates TMEM17 transcription. The luciferase reporter assay revealed that the promoter region of the TMEM17 gene, specifically between base pairs 600 to 1200, contains a YY1 response site (Fig. 6E). Consequently, we mutated the predicted promoter sequence of TMEM17 between bases 757 to 764 and constructed both TMEM17-WT and TMEM17-Mut luciferase reporter vectors. The results demonstrated that overexpression of YY1 significantly enhanced the luciferase activity of TMEM17-WT, but had minimal impact on the activity of TMEM17-Mut (Fig. 6F,G).
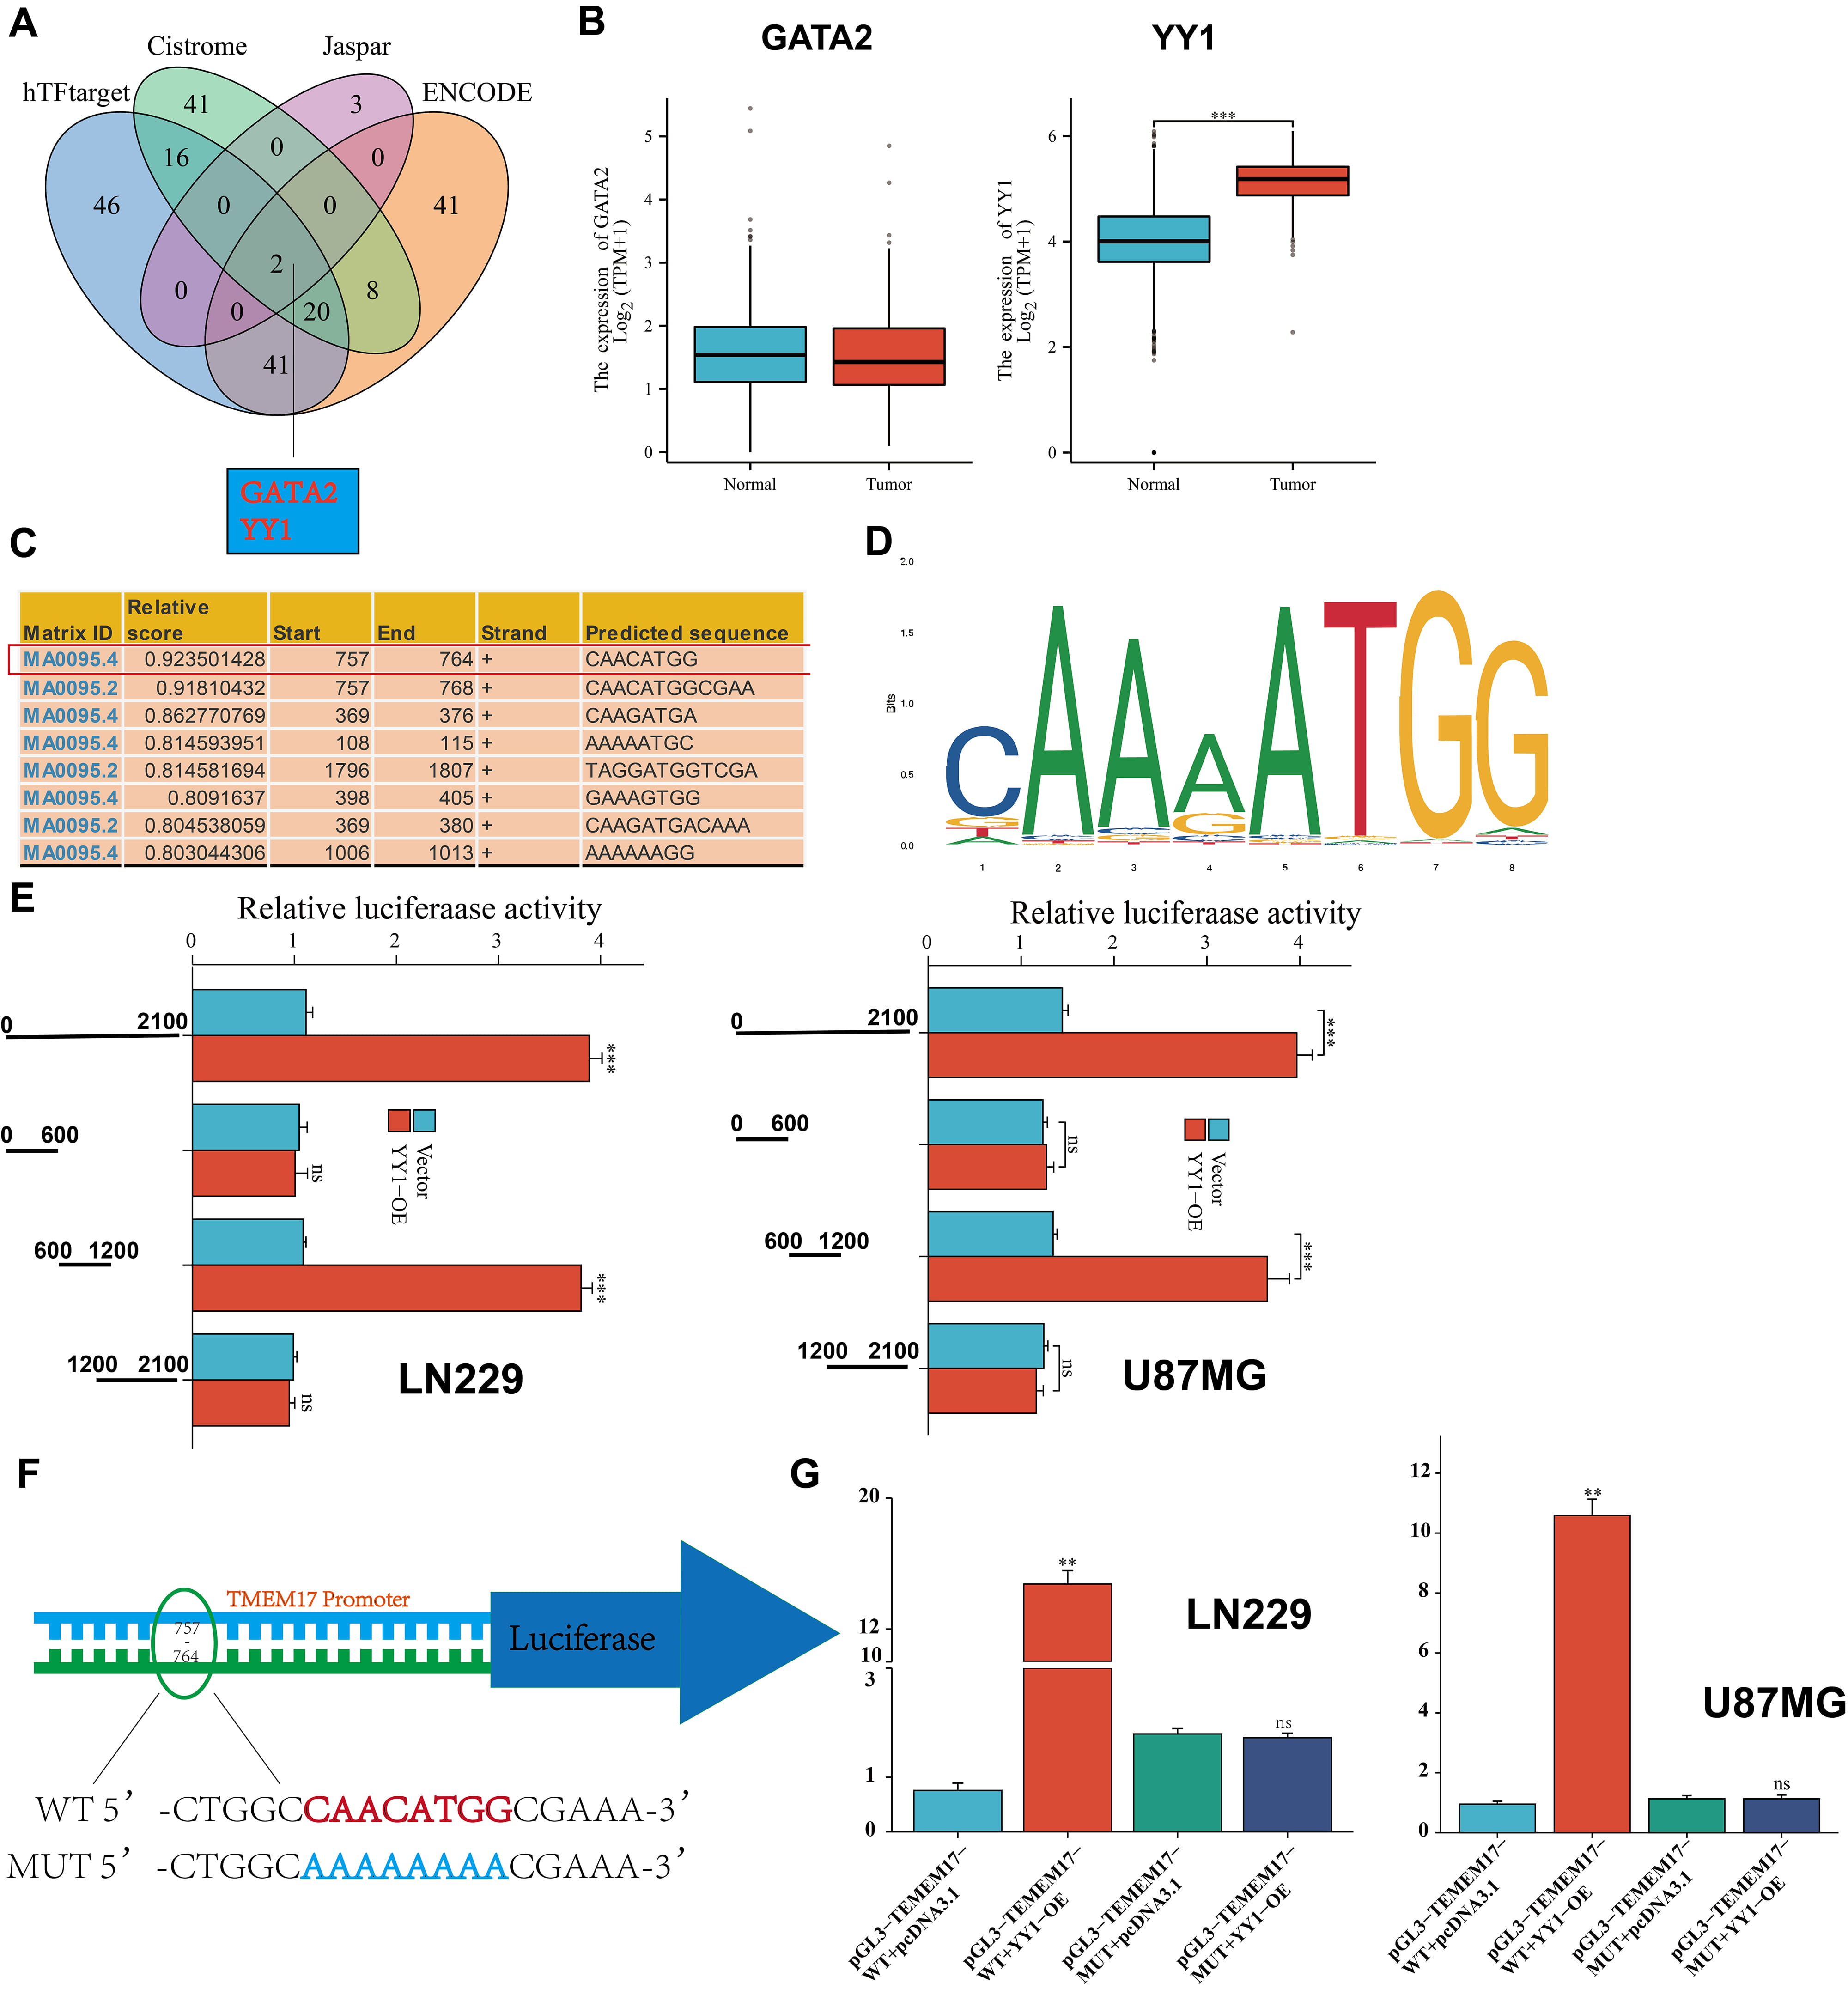 Fig. 6.
YY1 promotes the transcription of TMEM17. (A) The Venn diagram
illustrates the transcription factors identified as binding to the promoter
region of TMEM17 in the hTFtarget, Cistrome, Jaspar, and ENCODE databases. (B)
Differential expression of YY1 and GATA2 in GBM was analyzed using TCGA database.
(C,D) Based on JASPAR scores, a schematic depicts the putative CREB1 binding
motif. (E) Following transfection of cells with the TMEM17 promoter or three
truncation mutants, the activity of the luciferase was measured. (F,G)
Transfection of cells with TMEM17-WT or TMEM17-MUT promoter constructs and
measurement of luciferase activity post-transfection were performed. Statistical
significance levels are indicated by ns, no significant, **p
Our findings indicate that TMEM17 significantly enhances the proliferation of GBM cells. The phosphoinositide 3-kinase (PI3K)/AKT signaling pathway is closely related to transcriptional regulation, cell proliferation, growth, and apoptosis. Thus, we investigated whether TMEM17 affects the growth of GBM cells by modulating the PI3K/AKT pathway. Western blot analysis showed that knocking down TMEM17 substantially decreased the protein expression of phosphorylated PI3K (p-PI3K) and p-AKT (Fig. 7A). Additionally, after treating the cells with the PI3K activator 740Y-P, we found that the growth inhibitory effect of TMEM17 knockdown on GBM cells was partially reversed (Fig. 7B,C). In addition, 740Y-P also reduced apoptosis caused by TMEM17 knockdown (Fig. 8A) and increased the invasiveness of GBM cells (Fig. 8B). In summary, these research findings demonstrate that TMEM17 actively regulates the PI3K/AKT signaling pathway in GBM cells.
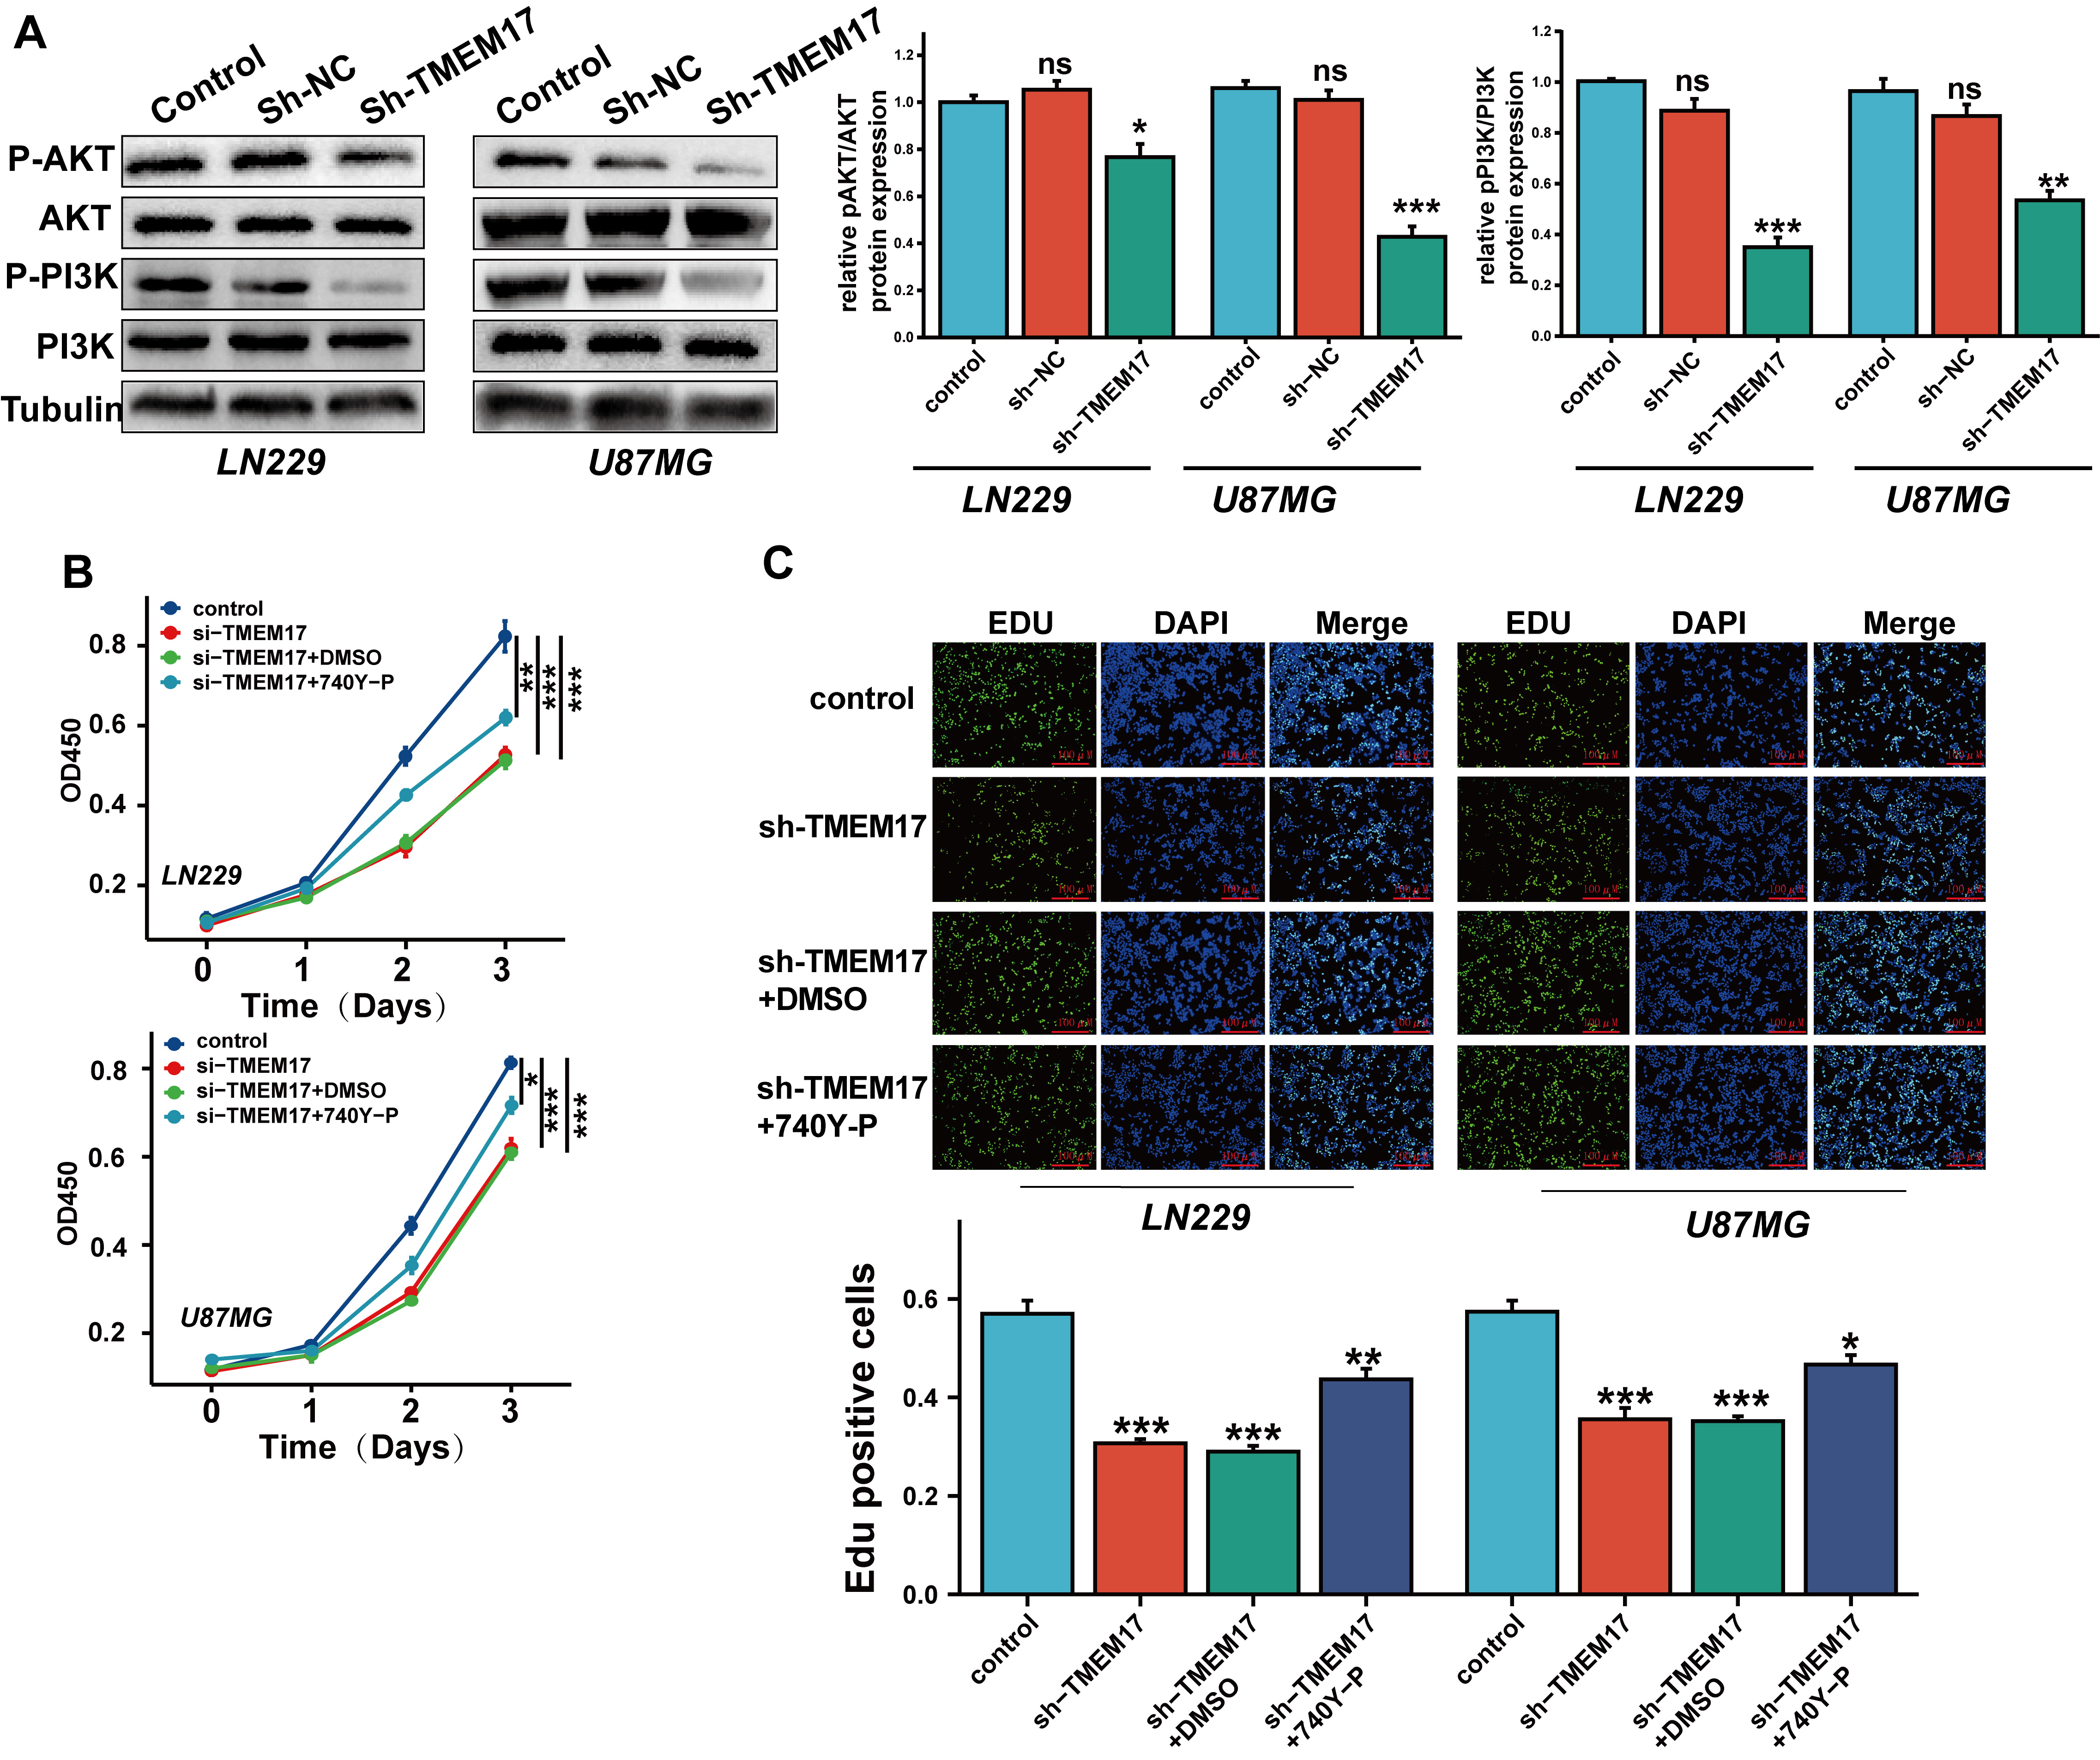 Fig. 7.
TMEM17 regulates the PI3K/AKT pathway affecting the
proliferation of GBM. (A) After stable silencing of TMEM17, Western
blot analysis was used to assess the protein expression levels of PI3K, p-PI3K,
AKT, and p-AKT in GBM cells. (B,C) The effects of the PI3K pathway activator
740Y-P on GBM cell proliferation were evaluated using the CCK-8 (B) and EdU (C)
assays, with scale bars indicating 100 µm. n = 3 independent experiments.
Statistical significance levels are indicated by ns, no significant, *p
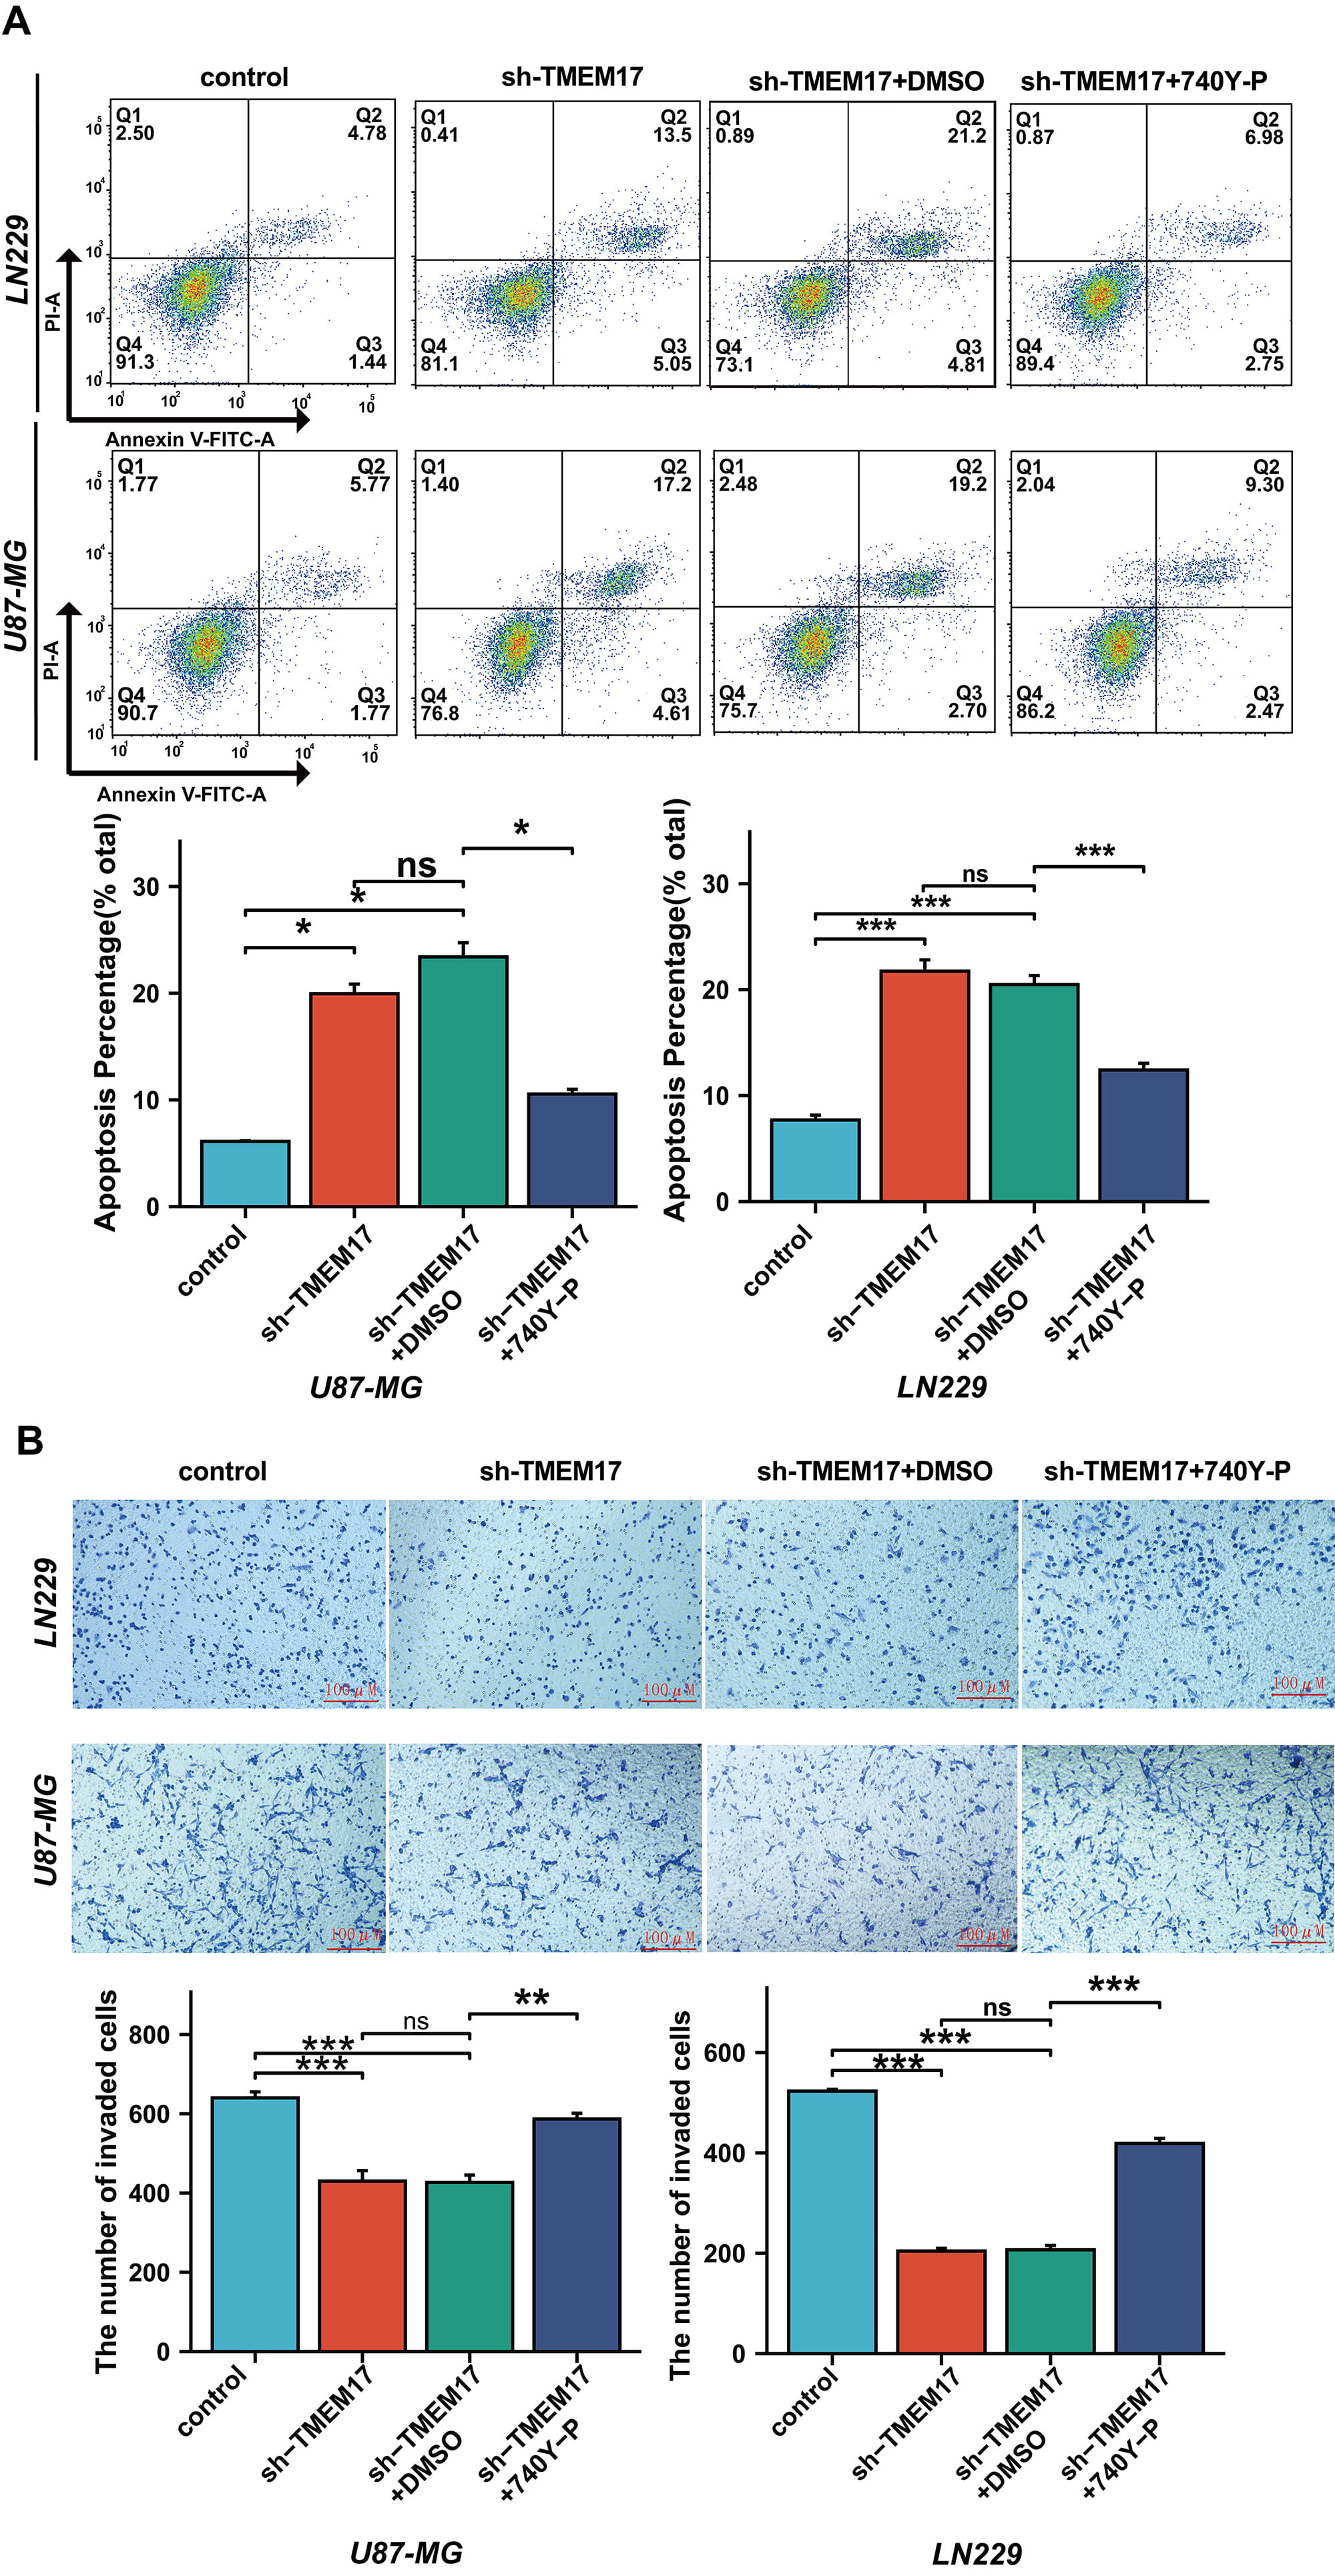 Fig. 8.
TMEM17 regulates the PI3K/AKT pathway affecting apoptosis and
migration of GBM. (A) Flow cytometry was used to assess the apoptosis of GBM
cells treated with the PI3K pathway activator 740Y-P. (B) 740Y-P restored the
decreased invasiveness of GBM cells caused by TMEM17 downregulation, with scale bars indicating 100 µm. n =
3 independent experiments. Statistical significance levels are indicated by ns,
no significant, *p
GBM is the most prevalent and aggressive type of malignant brain tumor, significantly impacting global mortality rates from central nervous system cancers [13]. Standard treatments often lead to unsatisfactory outcomes due to individual patient differences and the tumor’s high recurrence rate [14, 15]. This underscores the urgent need to identify new and effective therapeutic targets for GBM treatment.
The TMEM family is a class of proteins of highly complex composition and function, and interestingly, the role of the family members in tumors does not seem to be uniform [16, 17]. For example, TMEM176A is thought to have tumor suppressor effects, and in colorectal [18, 19] and esophageal squamous cell carcinomas, overexpression of this gene inhibits tumor cell proliferation, migration, and invasion, and induces their apoptotic process [20]. Similarly, TMEM family proteins include TMEM97 [21], TMEM25 [22], and others. Interestingly, other members of this family show proto-oncogene properties. For example, TMEM48 [23] is associated with a poorer prognosis and higher tumor grade in non-small cell lung cancer patients, and TMEM97 promotes the development of pancreatic [24] and prostate cancers [25]. There have been few studies on TMEM17, which was first formally reported as a causative gene for ciliopathy [26]. The first formal report of its correlative role with tumors was a genome-wide study in Japan in 2019 [27], which demonstrated that the TMEM17 gene is one of the susceptibility loci for prostate cancer. Subsequently, a study by Yu et al. (2021) [28] showed for the first time in colorectal cancer (CRC) that the TMEM17 gene is associated with cancer stem cells and could be an effective target for intervening in CRC recurrence and drug resistance.
Notably, our study also indicated that TMEM17 regulates the PI3K/AKT pathway through the transcription factor YY1. Zhao et al. [29] showed that TMEM17 upregulates the p-AKT, which promotes the malignant behavior of breast cancer, but it was not directly indicated in their study how the two interact. YY1 is a versatile transcription factor that is crucial in regulating the expression of genes associated with a variety of physiological processes such as development, cell proliferation, differentiation, DNA repair, and apoptosis [30, 31]. In tumors, this gene can often be activated by activating proto-oncogenes (c-myc, c-fos, human epidermal growth factor receptor 2) [32, 33]. Studies have been conducted to determine the role of YY1 in GBM. The most studied relationship has been between YY1 and the epidermal growth factor receptor pathway [34, 35]; however, the relationship between YY1 and the AKT/PI3K pathway in GBM is still a new area of research, which is worthy of more in-depth study.
Our study shows that YY1 enhances the expression of TMEM17 in GBM; promotes the proliferation, migration, and invasive process of GBM cells through the AKT/PI3K pathway; and reduces their apoptosis, which ultimately leads to the high malignancy of GBM. The malignancy of GBM cells can be effectively reduced by inhibiting TMEM17 or YY1, which is significant for the treatment of clinical GBM.
TMEM17, Transmembrane Protein 17; CCK-8, Cell Counting Kit-8; CCLE, Cancer Cell Line Encyclopedia; DSS, Disease-specific survival; GBM, Glioblastoma multiforme; GTEx, Genotype-Tissue Expression; OS, Overall survival; PFI, Progression-free interval; TCGA, The Cancer Genome Atlas.
The dataset used in this study can be found in TCGA database. If you need the relevant access to original data or other original data, please contact the corresponding author.
SW, QZ, and MH designed the study and performed initial experimental exploration and article writing. FL, CL, and DF performed the experiments, analyzed the data, and drafted the manuscript. SY contributed to the data analysis, drafted the initial manuscript, and revised the final version. All authors read and approved the final manuscript. All authors have participated sufficiently in the work and agreed to be accountable for all aspects of the work.
This study received ethical approval from The First Affiliated Hospital of Guangxi Medical University Ethics Committee (Approval No. 2023-E108-01). And informed consent has been obtained from all patients.
Not applicable.
This work was supported by the National Natural Science Foundation of China (82260554).
The authors declare no conflict of interest.
References
Publisher’s Note: IMR Press stays neutral with regard to jurisdictional claims in published maps and institutional affiliations.