


1 Ward of Gastroenterology, The Second Affiliated Hospital of Qiqihar Medical University, 161006 Qiqihar, Heilongjiang, China
2 Ward of Hematopathology, The Second Affiliated Hospital of Qiqihar Medical University, 161006 Qiqihar, Heilongjiang, China
Abstract
Objective: To explore the role and molecular mechanism of cancer-associated fibroblasts (CAFs) in the tumor microenvironment of gastric cancer (GC). Methods: The expression of CAFs in GC patients was first assessed for abundance, and survival analysis was performed. Subsequently, The Cancer Genome Atlas (TCGA) data were used for differential analysis, survival analysis, and EPIC analysis, while single-cell data (GSE183904) were downloaded for differential analysis of CAFs. Clinical data pooling, univariate and multivariate Cox analysis, and immunofluorescence were carried out on clinical GC tissue samples to explore RCN3 expression within patient CAFs. Western blot and quantitative polymerase chain reaction (qPCR) were used to detect the expression of RCN3. The relationship between RCN3, PCSK6, and STAT1 was explored by chromatin immunoprecipitation (CHIP) experiments, and the effects of the genes on macrophage polarization were detected by detecting biomarkers of biological M1/M2. Results: CAFs in GC were found to be significantly higher compared to the normal group. Revealing the results of TCGA differential analysis, it was observed that GC exhibited a substantial upregulation in the expression levels of RCN3. The clinical statistics indicate a positive correlation between an elevated level of RCN3 expression and the T-stage classification of tumor size. In addition, RCN3 was found to have a significant impact on the overall survival of patients with gastric cancer, acting as an independent prognostic indicator. Analysis of single-cell data showed high expression of PCSK6 in macrophages, and immunofluorescence staining of samples from GC patients showed increased expression of PCSK6 on the cell membranes of macrophages in GC tissues. The subsequent cellular experiments confirmed RCN3 protein can regulate the expression of PCSK6, and PCSK6 regulates macrophage polarization through STAT1. Conclusions: CAFs regulate macrophage polarization through the RCN3/PCSK6/STAT1 pathway in GC.
Keywords
- gastric cancer
- cancer-associated fibroblasts
- macrophage polarization
- RCN3
Global cancer incidence and mortality are rapidly increasing, and malignant tumors have become an important cause of serious health hazards and public health problems. Currently, gastric cancer (GC) has become the second most common cause of tumor death in China due to early asymptomatic [1]. Over 80% of the individuals receive a diagnosis at an advanced stage, with a survival rate of less than 10% after five years and an average overall survival duration of under one year [2]. The incidence and mortality rates of GC are the 5th and 4th highest in the world, with more than 1 million new patients and 700,000 deaths each year [3, 4, 5]. Therefore, exploring the pathogenesis of GC and elucidating its mechanism of action can provide an important theoretical basis for the treatment of GC.
It has been found that tumor microenvironment (TME) occupies an important
position in tumor development. TME is conducive to the biological behaviors of
cancer cells, including a variety of cells as well as extracellular components
surrounding tumor cells [6, 7, 8, 9, 10]. Cancer-associated fibroblasts (CAFs) play a
crucial role in the TME and have direct implications for tumor growth, invasion,
metastasis, and therapeutic response [11, 12, 13]. CAFs promote the proliferation of
GC cells through the secretion of a variety of growth factors as well as
cytokines, such as HGF, VEGF, TGF-
In this study, to provide new ideas for the clinical treatment of GC, we investigated the way CAFs in GC regulate macrophages in the microenvironment and their molecular mechanisms. CellChat analysis revealed that CAFs have stronger interactions with macrophages in GC compared with normal tissues. The active molecules targeting macrophages in CAFs were screened by bioinformatics analysis, and the mode of action of CAFs on macrophage polarization was further verified by clinical samples and in vitro cellular experiments.
Cancer-related histologic data were collected through the TCGA (The Cancer Genome Atlas) data portal (https://cancergenome.nih.gov). Relevant clinical information and RNA-seq data from the TCGA database were obtained for analysis in this study.
Single-cell RNA sequencing data were obtained from the GEO database (Gene Expression Omnibus, https://www.ncbi.nlm.nih.gov/geo/) for the GSE183904 cohort information (containing 10 normals and 23 tumors). Downstream analysis of single-cell RNA sequencing (scRNA-seq) was performed according to the standard process of Seurat (https://github.com/satijalab/seurat). Each sample was evaluated for genes/features that were present in at least three cells, with consideration given to cells exhibiting a range of 500 or more features but not exceeding 6000 features. Cells exhibiting mitochondrial RNA percentages exceeding 20 were excluded from the analysis. The integration of 33 single-cell sequencing samples was performed using Harmony. Run Principal Component Analysis (RunPCA) is employed to conduct linear data dimensionality reduction and identify the primary 30 principal components. Employ FindNeibors (ndims = 1:30) to compute the distance among samples and utilize Run t-distributed Stochastic Neighbor Embedding (RunTSNE) (ndims = 1:30) to execute nonlinear dimensionality reduction on the samples. Cellular markers were obtained from the article attachment (https://aacrjournals.org/cancerdiscovery/article/12/3/670/681898/Single-Cell-Atlas-of-Lineage-States-Tumor).
The survival curves of S level versus tumor patients and RCN3 level versus GC
patients were plotted according to the clinical data of GC patients. The analysis
of survival was conducted utilizing the Kaplan–Meier method. p
The CellChat R package (https://github.com/sqjin/CellChat) was employed to visualize networks of interactions between cells. The Seurat object with annotations was transformed into a CellChat entity. Receptors or ligands that exhibited increased expression in a specific cell type were detected using the identify Over ExpressedGenes function, and subsequently, gene expression data was integrated into the protein interaction network using the projectData function. The identification of ligand-receptor interactions was conducted by screening for cases where either the ligand or the receptor exhibited overexpression, utilizing the OverExpressedInteractions function. The probability value of each interaction was computed by CellChat, and the significance of the interaction was determined. The probability value calculation not only factored in the expression matrix but also incorporated prior knowledge of the interaction.
RPMI 1640 medium (11875119), fetal bovine serum (10099-141) were purchased from
Gibco (Grand Island, CA, USA). CD68 (ab303565) antibody, CD206 (ab64693)
antibody, iNOS (ab178945) antibody,
Human gastric mucosal epithelial cells GES-1 and human monocytic leukemia THP-1
were purchased from ATCC. GES-1 was cultured in RPMI 1640 (10% fetal bovine
serum (FBS), 1% double antibody) complete medium at 37 °C, 5%
CO
In this study, we collected 40 peripheral blood samples from patients with locally advanced or metastatic gastric cancer undergoing immunotherapy at the Second Affiliated Hospital of Qiqihar Medical University, as well as formalin-fixed and paraffin-embedded sections of the primary foci of tissues from 40 patients with gastric cancer. The general information, clinical characteristics, imaging and follow-up data were obtained from the patients. This study was approved by the Hospital Ethics Committee of the Second Affiliated Hospital of Qiqihar Medical University ([2021]1215-4), and all patients signed an informed consent form. The study was performed with reference to the outline of the Declaration of Helsinki.
Reagents were employed as per the kit instructions to extract total RNA from
cell/tissue samples. Next, complementary DNA (cDNA) was synthesized from RNA
using the BioScript All-in-One cDNA Synthesis SuperMix (Bimake, Houston, TX,
USA). RT-PCR analysis was conducted by employing FastStart Universal SYBR Green
Master Mix (manufactured by Roche, located in Mannheim, Germany) and CFX96 TM
Real-time PCR System (developed by Bio-Rad, headquartered in Hercules, CA, USA)
for the purpose of RT-PCR analysis. The relative levels of gene expression were
determined using the 2–(
| Gene | Forward primer, 5 |
Reverse primer, 5 |
| RCN3 | TGTGGCGACCATCAGTTCTG | GTCGTACTGGAAGTTCCCGTG |
| GAPDH | TCGACAGTCAGCCGCATCT | CTAGCCTCCCGGGTTTCTCT |
Tissue/cell contents were obtained through RIPA cell lysate, and total protein
was collected by centrifugation. Protein concentration was quantified according
to the bicinchoninic acid (BCA) assay. Sodium dodecyl sulfate-polyacrylamide gel electrophoresis (SDS-PAGE) electrophoresis was performed.
The proteins that were separated underwent transfer onto a PVDF membrane
(ISEQ00010, Millipore, Bedford, MA, USA) utilizing a transfer device. The PVDF
membrane was incubated for 1 hour with 5% skimmed milk, followed by washing with tris buffered saline (TBS)
. The primary antibody (CD68 antibody (1:2000), CD206 antibody (1:2000), iNOS
antibody (1:2000),
A diluted standard solution of 50 µL was introduced into the reaction wells, followed by the addition of 50 µL each of the sample and biotin-labeled antibody for testing purposes. The template was covered and incubated at 37 °C for 1 hour. After the liquid was extracted from the wells, a washing solution was introduced into each well and agitated for a duration of 30 seconds, with this process being repeated three times. The wells were then supplemented with 80 µL of affinity streptavidin-HRP and incubated for 30 min at 37 °C. Subsequently, a total volume of 50 µL of substrate A and B was added to each well, followed by an additional incubation at 37 °C for 10 min while avoiding exposure to light. After removing the plate, 50 µL of termination solution was swiftly added, and the optical density (OD) value of each well was measured subsequent to the addition of the termination solution.
RCN3-specific short hairpin RNA (shRNA) (Cat#TRCN0000029495; target sequence: GACAGAAACAAAGATGGCTAT) and non-target control shRNA (Cat# SHC016-1EA) lentiviral plasmids were purchased from Millipore igma (Burlington, MA, USA). The transfer of plasmids into HEK293T cells was facilitated using TurboFect Transfection Reagent (Thermo Scientific, Waltham, MA, USA). The supernatants were harvested 48 hours and 72 hours after transfection, followed by lentivirus concentration using the Lenti-X Concentrator (Takara Bio, San Jose, CA, USA). The GSCs were transfected with lentiviral particles containing RCN3-shRNA to establish stable expression of shRNAs. Subsequently, puromycin (1 µg/mL) or inoculin (5 µg/mL) was used for screening and selecting stable clones. Recombinant lentiviral particles were employed to produce control cells by expressing shRNAs that do not target any specific genes. To prevent the potential ascription of artifacts to a particular clone, we utilized a combination of diverse clones. Lentiviral particles were produced in 293T cells by utilizing the lentiviral shuttle vector FUGW, which contained either human RCN3 (NM_020650.3) or an empty vector. After 24 h of infection, the cells were subjected to further experiments. Human RCN3 siRNA sequence was: RNA oligo sequences 21nt guide UUCAGCAAUCACGAUGUCCCG; 21nt passenger GGACAUCGUGAUUGCUGAAAC.
The cells were subjected to formaldehyde treatment, followed by cell collection for sonication and fragmentation. Antibodies targeting specific proteins were then added, which not only bound to the target protein-DNA complexes but also interacted with each other. Subsequently, Protein A was introduced to form complexes with the antibody-target protein-DNA interactions, resulting in precipitation. The precipitated complexes underwent washing to eliminate any non-specific binding, followed by elution and acquisition of enriched target protein-DNA complexes. Subsequently, de-crosslinking and purification processes were conducted on the enriched DNA fragments for PCR analysis.
The cells or tissue sections were fixed with polymethanol, followed by three
washes with PBS for 5 minutes each time. Subsequently, the tissue or cell
sections were incubated in 2% BSA for 30 minutes and then washed twice with PBS.
The sample was incubated with primary antibodies, including RCN3 antibody
(1:2000) and
The collagenase digestion method was used to culture gastric CAFs and gastric NFs. The tissue blocks were digested with DMEM medium containing 0.2% type IV collagenase and 0.1% type II collagenase at 37 °C for 3 hours. Subsequently, the mixture was filtered through sterile filters with a mesh size of 200, followed by centrifugation at a speed of 1000 rpm/min for 5 minutes. The supernatant was discarded, and the sediment was resuspended in PBS before undergoing two additional rounds of centrifugation. The cells were subsequently resuspended in culture medium supplemented with 10% FBS and transferred to culture dishes after a 24-hour incubation period, the medium was changed once every 1 day.
The cumulative survival rates were determined using Kaplan–Meier survival
curves. Statistical analysis of the data was performed using GraphPad Prism9
software (Dotmatics, Boston, MA, USA). The data were presented as mean
First, we downloaded the TCGA dataset for EPIC analysis, which showed that the
proportion of CAFs was significantly upregulated in GC (p
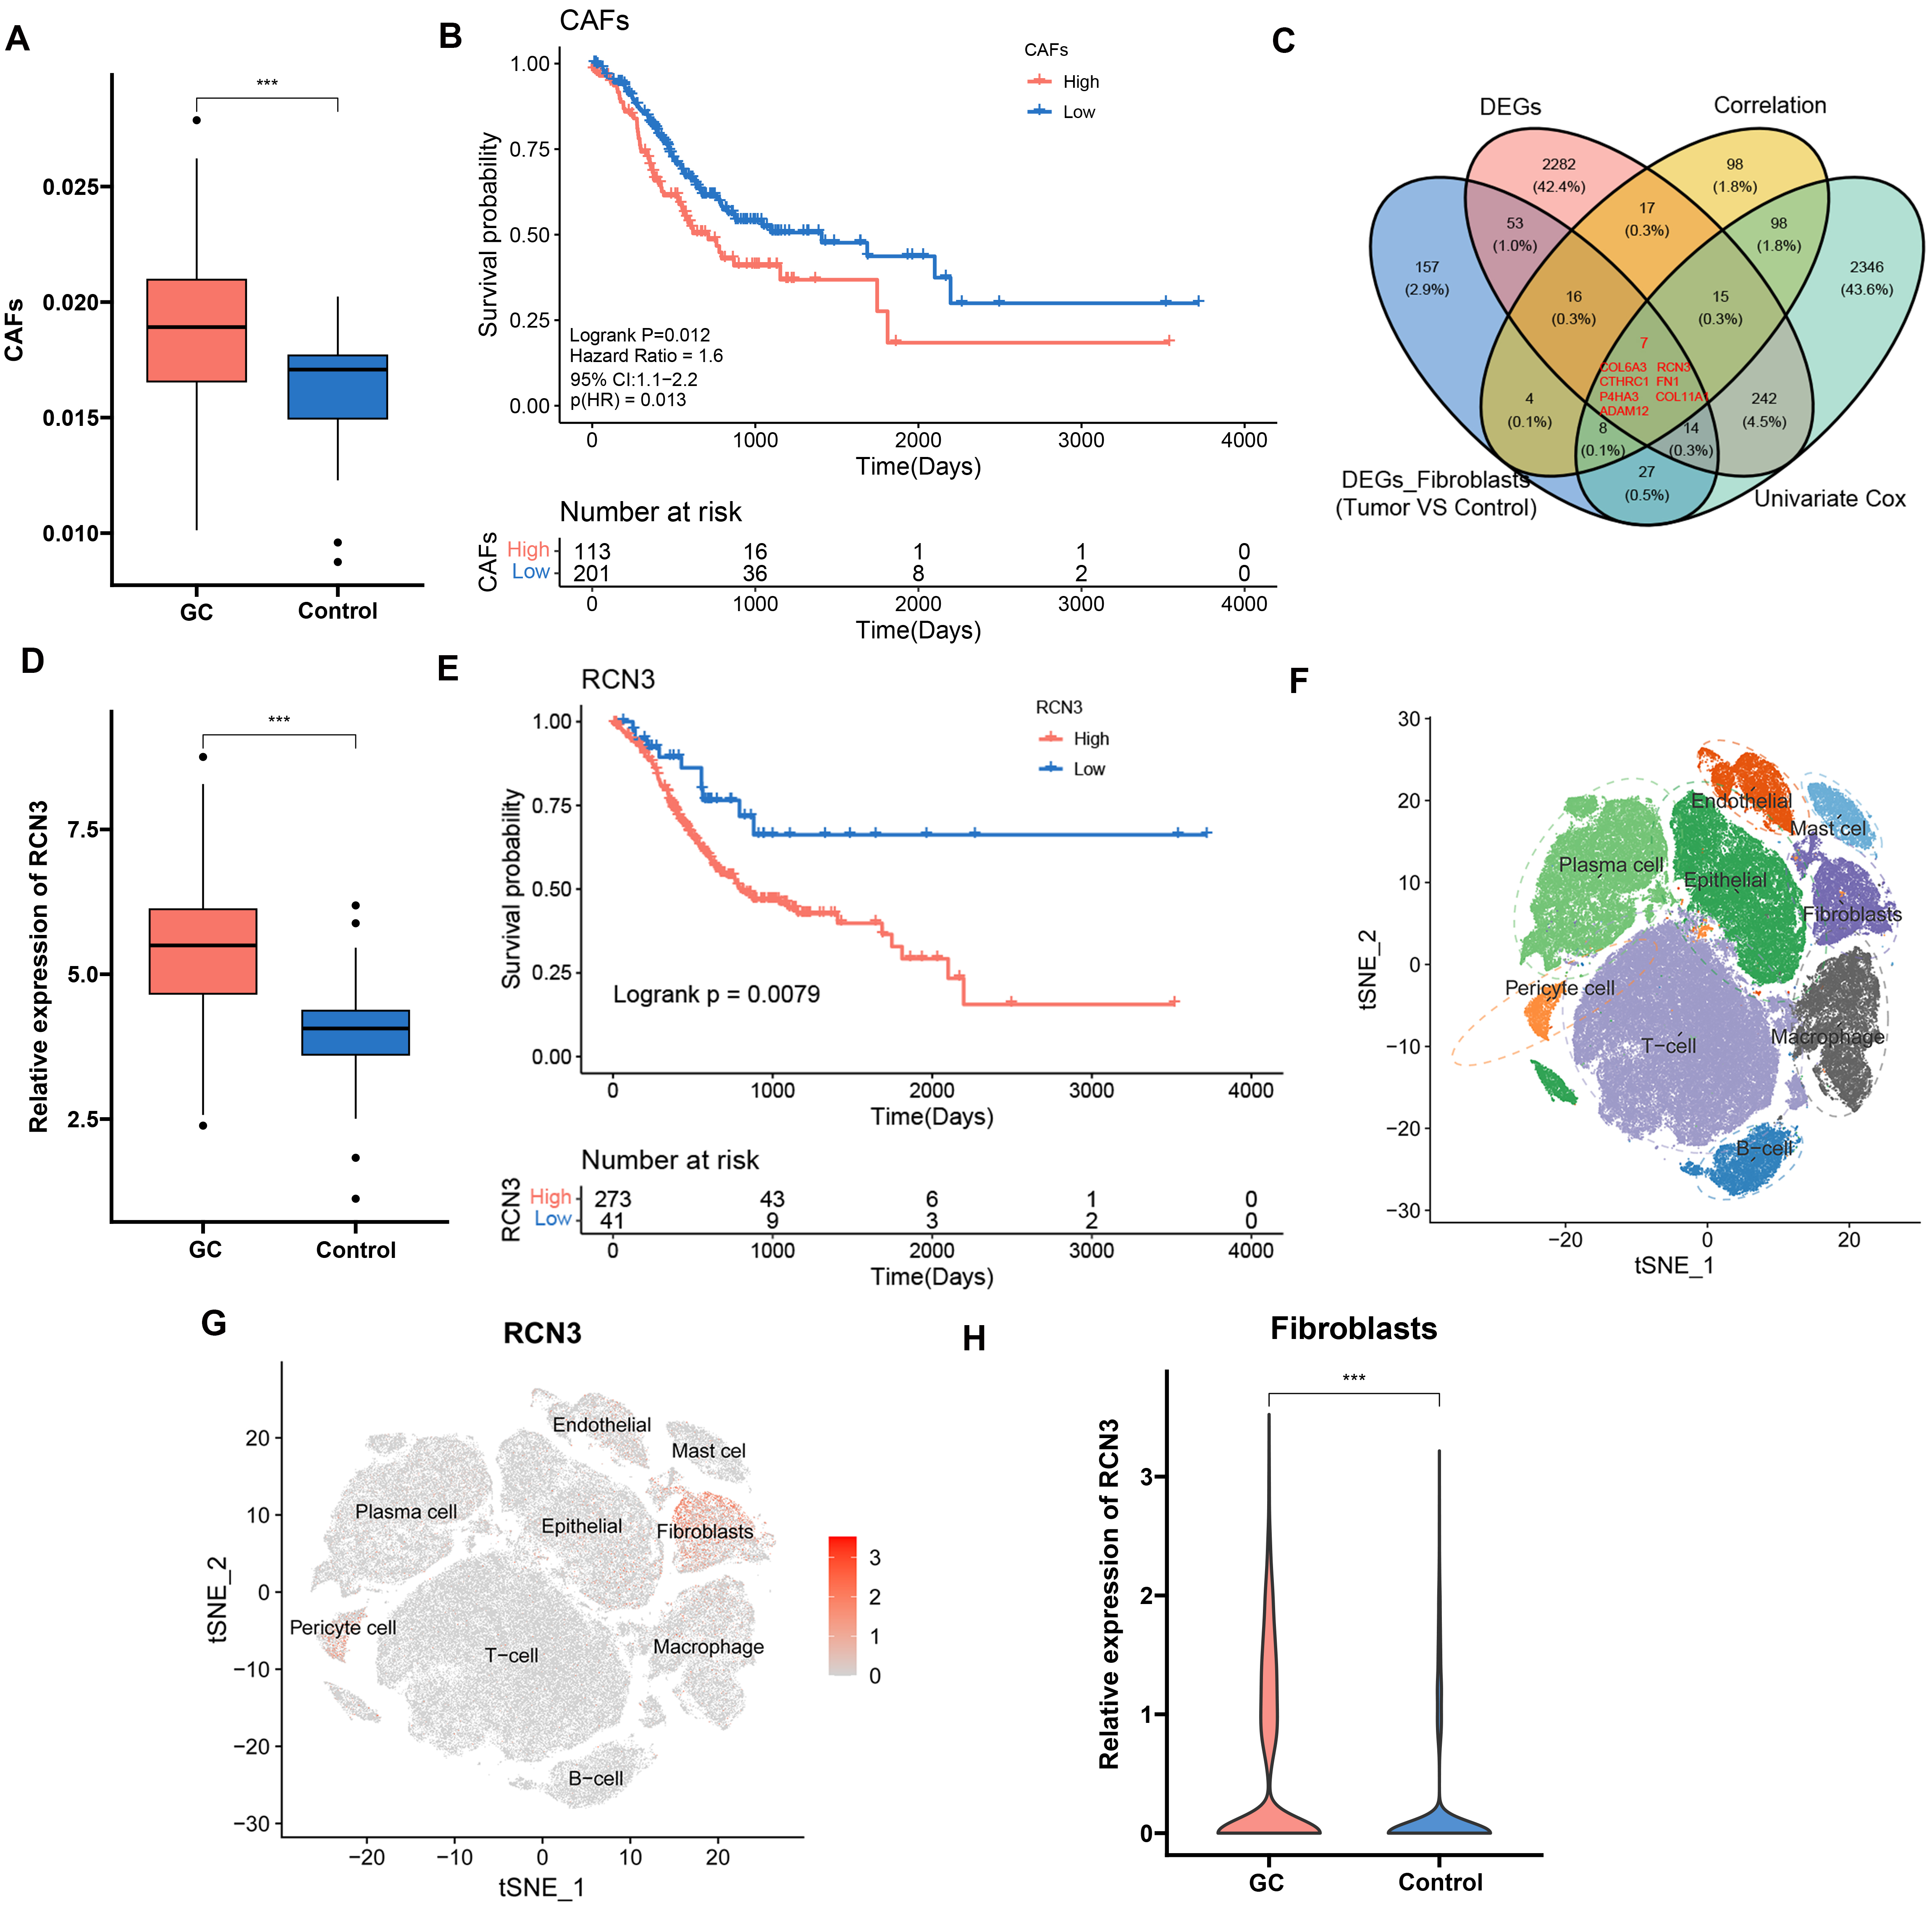 Fig. 1.
Gastric cancer (GC) dataset analysis. (A) EPIC analysis of cancer-associated fibroblast (CAF) level. (B)
Survival probability curves of CAF levels versus tumor patients. (C) Venn plots
of Differential gene coanalysis. (D) Relative expression of RCN3. (E)
Survival probability curves of RCN3 levels versus GC patients. (F) Uniform Manifold Approximation and Projection (UMAP)
plot. (G) Distribution of RCN3 in various types of cells. (H)
RCN3 expression in tumor cells and normal cells (Containing 10 normals
and 23 tumors), ***p
The results of single-cell clustering analysis and Uniform Manifold Approximation and Projection (UMAP) were categorized into
nine clusters (Fig. 1F), in which RCN3 was significantly expressed in
CAFs of GC (Fig. 1G). RCN3 was demonstrated in Fig. 1H, where
RCN3 was significantly highly expressed in tumor cells compared with
normal cells (t = 26.568, p-value
Analyzing the association of RCN3 with clinicopathological features, we found
that high expression of RCN3 was associated with T-staging of tumor size
(p
| Characteristic | RCN3 | p-value | |||
| High (N = 157) | Low (N = 157) | ||||
| Age | 0.708 | 0.400 | |||
| 48 (31%) | 55 (35%) | ||||
| 109 (69%) | 102 (65%) | ||||
| Gender | 0.219 | 0.640 | |||
| female | 56 (36%) | 60 (38%) | |||
| male | 101 (64%) | 97 (62%) | |||
| Grade | 0.795 | 0.851 | |||
| G1 | 4 (2.5%) | 3 (1.9%) | |||
| G2 | 49 (31%) | 56 (36%) | |||
| G3 | 100 (64%) | 94 (60%) | |||
| GX | 4 (2.5%) | 4 (2.5%) | |||
| T | 15.403 | 0.002 | |||
| T1 | 0 (0%) | 14 (8.9%) | |||
| T2 | 36 (23%) | 27 (17%) | |||
| T3 | 78 (50%) | 74 (47%) | |||
| T4 | 43 (27%) | 42 (27%) | |||
| M | 0.000 | 1.000 | |||
| M0 | 146 (93%) | 146 (93%) | |||
| M1 | 11 (7.0%) | 11 (7.0%) | |||
| N | 4.157 | 0.245 | |||
| N0 | 55 (35%) | 42 (27%) | |||
| N1 | 44 (28%) | 40 (25%) | |||
| N2 | 29 (18%) | 39 (25%) | |||
| N3 | 29 (18%) | 36 (23%) | |||
| Stage | 5.080 | 0.166 | |||
| Stage I | 17 (11%) | 24 (15%) | |||
| Stage II | 60 (38%) | 42 (27%) | |||
| Stage III | 64 (41%) | 73 (46%) | |||
| Stage IV | 16 (10%) | 18 (11%) | |||
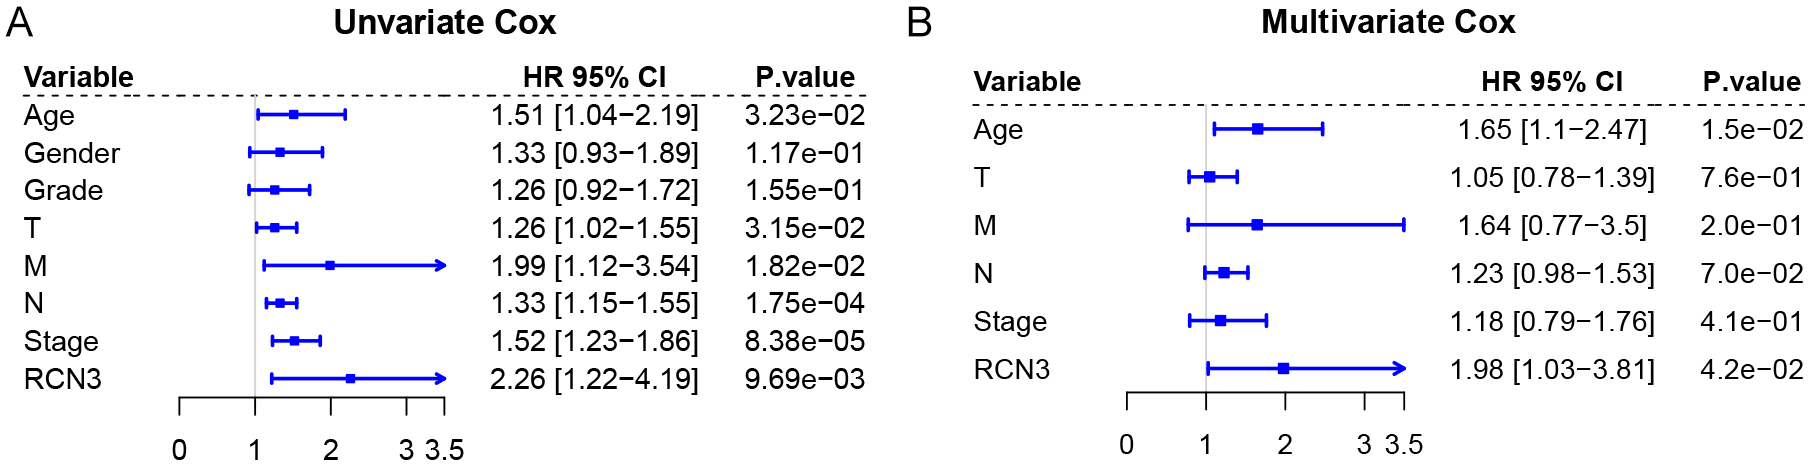 Fig. 2.
Univariate and multivariate Cox analysis of GC patients. (A) Univariate Cox analysis. (B) Multivariable Cox analysis.
To validate the results of the analysis described above, clinical GC tissue samples were collected for analysis by immunofluorescence, and the findings showed RCN3 was expressed in CAFs and was highly expressed in patients (Fig. 3A). The isolated CAFs and NFs were subjected to RCN3 expression analysis, revealing significantly elevated protein and mRNA levels of RCN3 in CAFs (Fig. 3B,C).
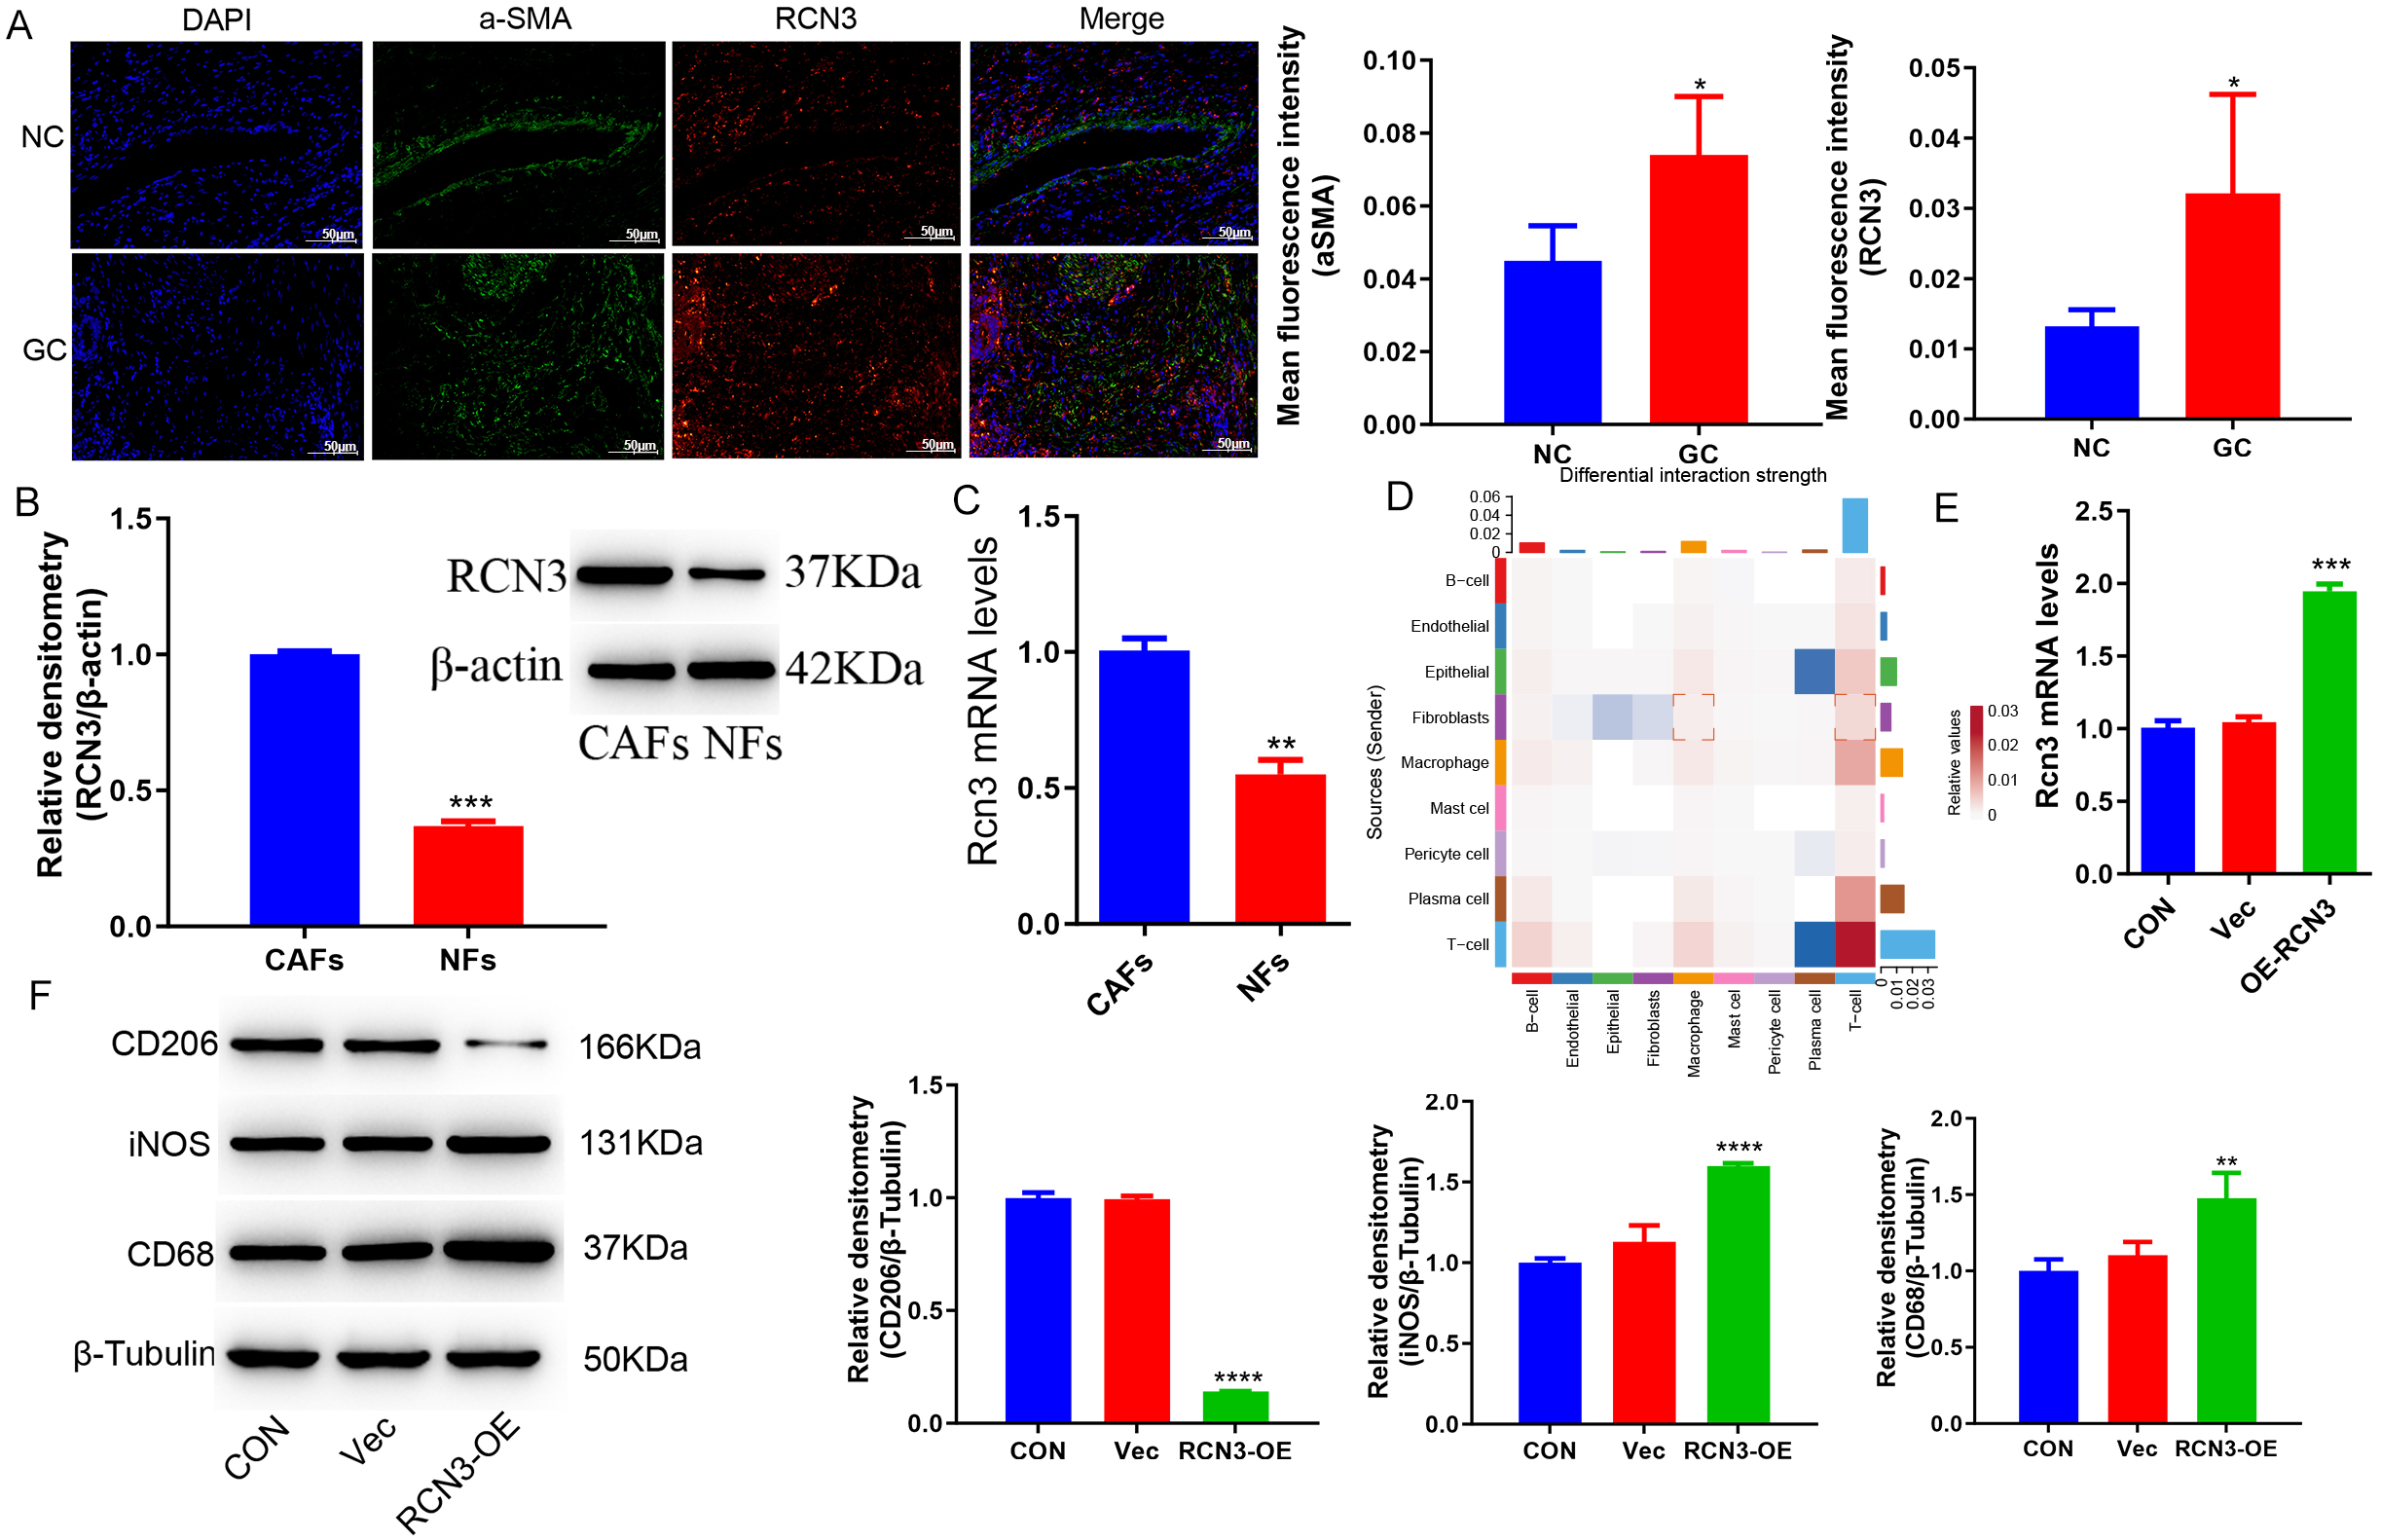 Fig. 3.
RCN 3 is highly expressed in CAFs and regulates macrophage
polarization. (A) Immunofluorescence plots of the GC clinical samples (Scale bar = 50µm). (B)
Western blot detected the protein level of RCN3 in each group. (C) Reverse Transcription-Polymerase Chain Reaction (RT-PCR)
detected the expression of RCN3 in each group. (D) CellChat interaction
analysis. (E) RT-PCR detected the expression of RCN3 in GES-1 cells. (F)
Western blot detected the protein levels of CD68, iNOS, and CD206 in macrophage
THP-1 cells. *p
Studies have shown that CAFs interact with other cells and play an important role in colorectal cancer [22]. CellChat analysis found that CAFs interacted with macrophages in an enhanced manner compared to normal tissue (Fig. 3D). We therefore co-cultured THP-1 cells, a human monocytic leukemia cell line, induced to differentiate into macrophages with phorbol ester (PMA), following overexpression of RCN3 in the GES-1 cell line. Consequently, we observed significant alterations in macrophage polarization and an enhanced M1 phenotype (Fig. 3E,F).
Previous literature revealed that RCN3 interacted with PCSK6 and regulated the polarization of macrophages [23]. In this study, single-cell analysis showed that PCSK6 is highly expressed in macrophages, while genecards results suggested that PCSK6 might be on the macrophage membrane (Fig. 4A). Then, an immunofluorescence assay was performed to test the expression of PCSK6. The results showed that PCSK6 was increased on the cell membranes of macrophages of GC tissues compared with normal tissues (Fig. 4B). To investigate whether RCN3 regulates macrophage polarisation by acting on PCSK6, PCSK6-KD THP-1 cells were constructed (Fig. 4C). The co-culture of GES-1 cells overexpressing RCN3 with PCSK6 knockdown THP-1 cells, the results found that knockdown of PCSK6 reversed the effect of overexpression of RCN3 on macrophage polarisation (Fig. 4D). To further explore the role of RCN3 with PCSK6, CHIP experiment was performed and found that the RCN3 protein can regulate the expression of PCSK6 (Fig. 4E).
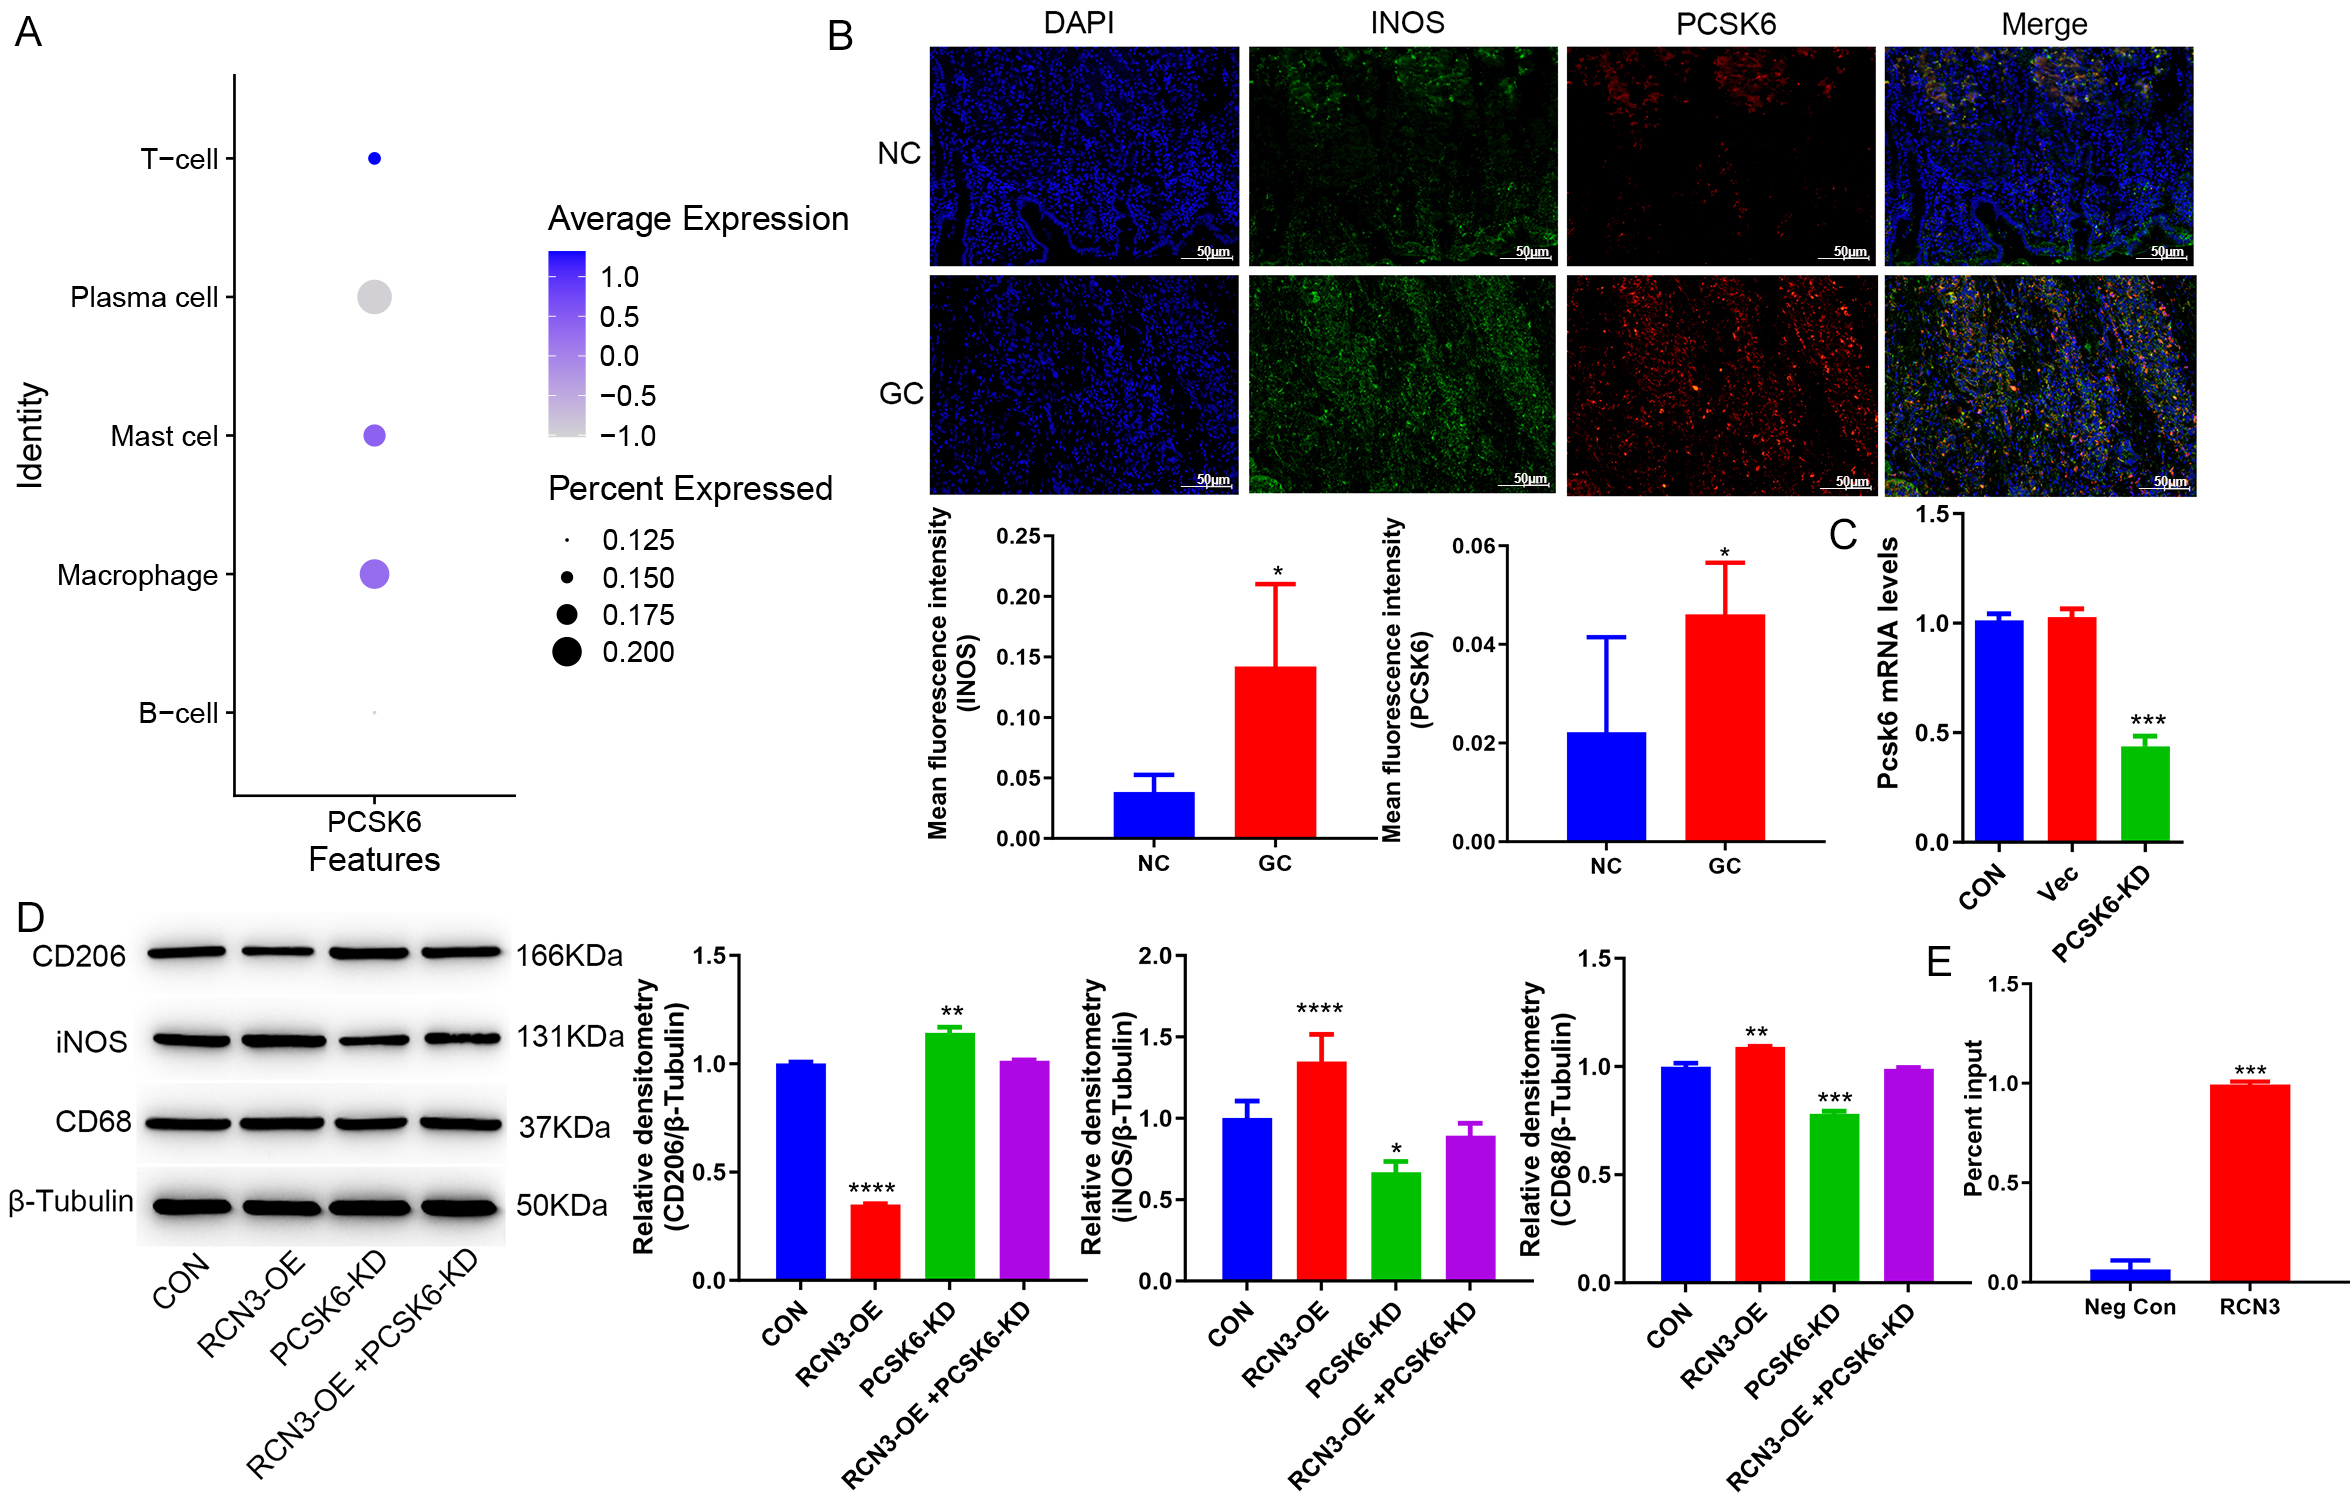 Fig. 4.
RCN 3 acts with PCSK 6 to regulate macrophage polarization. (A)
single cell analysis of PCSK6 expression. (B) Immunofluorescence graph
of the GC clinical samples (Scale bar = 50µm). (C) RT-PCR showed the expression of PCSK6 in
THP-1 cells. (D) Western blot showed the protein levels of CD68, INOS, and CD206
in macrophage THP-1 cells. (E) CHIP assay showed that RCN3 protein can regulate the expression of PCSK6. *p
To investigate how PCSK6 involved in macrophage polarisation, we collected supernatants from GES-1 cells overexpressing RCN3 and co-cultured them with THP-1 cells, which resulted in an observed increase in the phosphorylation of STAT1 (Fig. 5A). The inhibitor of STAT1 (Fludarabine), in the meantime, can reverse the macrophage polarization induced by RCN3 (Fig. 5B).
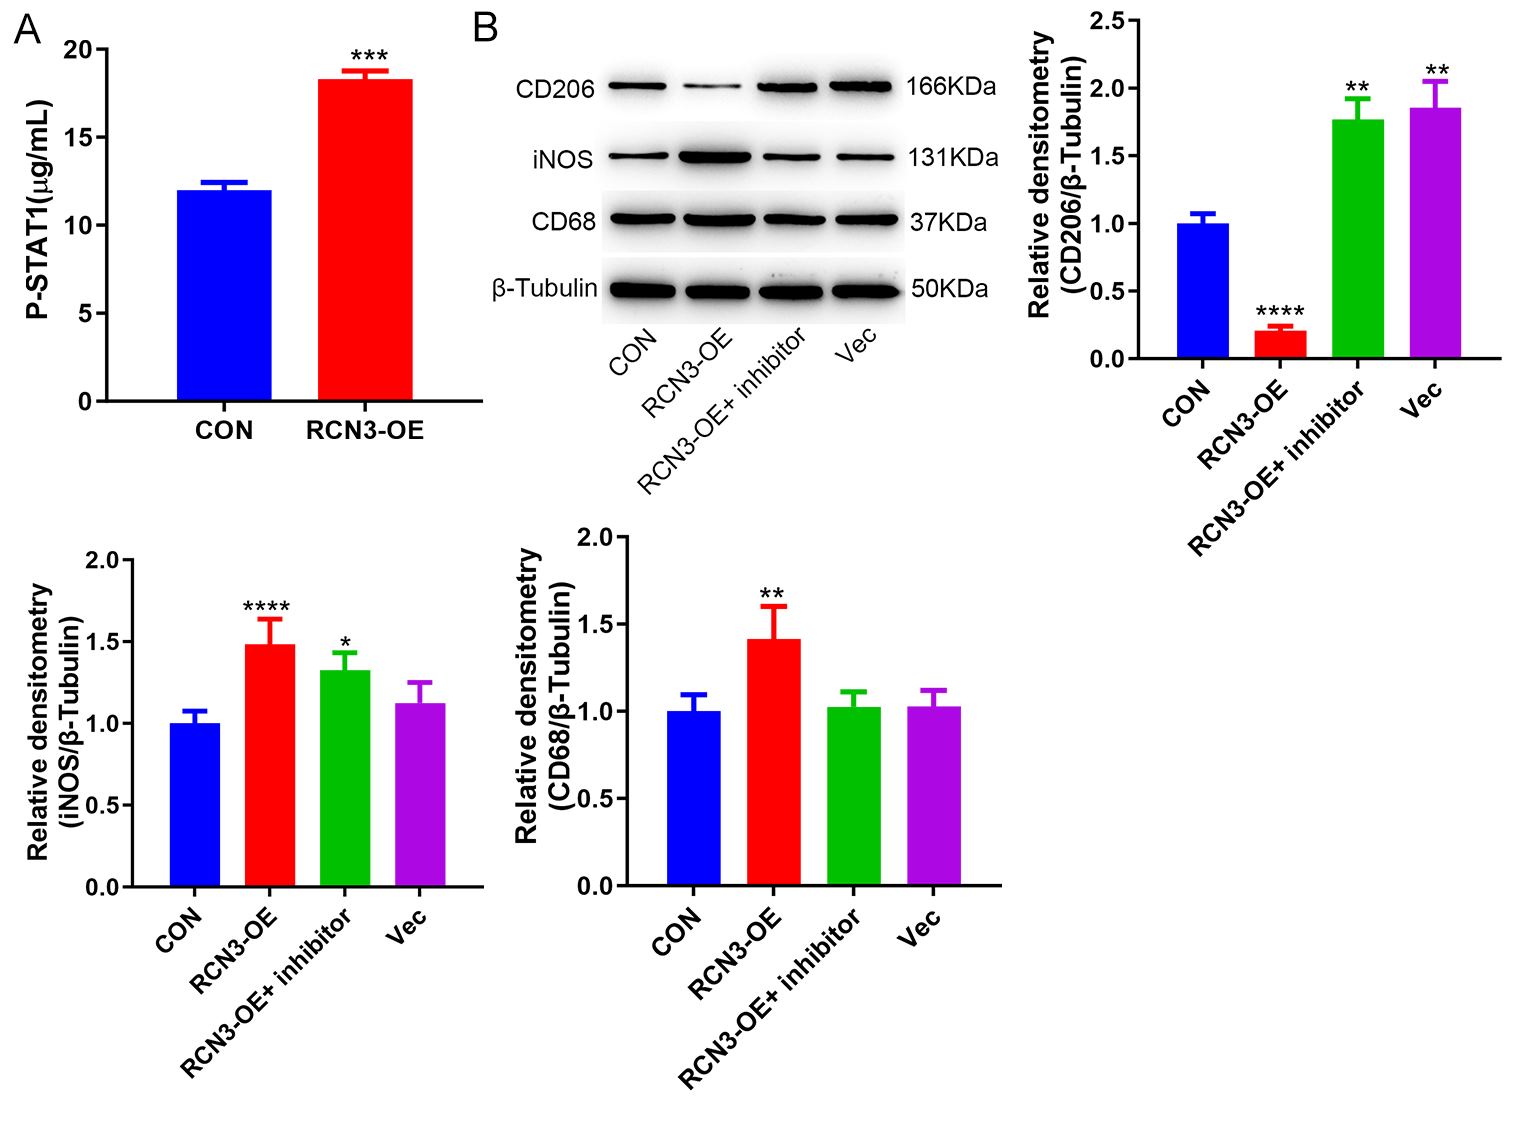 Fig. 5.
PCSK 6 regulates macrophage polarization by STAT1. (A) ELISA
assay to detect the phosphorylation level of STAT1. (B) Western blot detected the
expression of CD68, INOS, and CD206. *p
GC is among the top five most prevalent cancers worldwide and ranks third in terms of cancer-related mortality, accounting for nearly 800,000 deaths annually. Various processes, including the occurrence, development, metastasis, and treatment of GC, are intricately associated with the TME. CAFs, as a pivotal component of TME, exert a significant influence on GC progression. It is crucial to conduct research on the mechanism of CAFs in GC in order to generate novel insights and strategies for understanding and treating GC.
In this study, we elucidated the role of RCN3 in CAFs in the prognosis and regulation of the immune microenvironment of GC. This was achieved by employing TCGA data for gastric cancer, utilizing differential testing, survival analysis, EPIC analysis, as well as single-cell CellChat analysis. Moreover, through the utilization of single-cell sequencing, tissue immunofluorescence, cell co-culture, and other experimental techniques in both clinical specimens and in vitro cellular experiments, we have successfully elucidated that RCN3 expressed in CAFs can induce macrophage polarization. Additionally, we have made initial progress in exploring the underlying molecular mechanisms governing the interplay between CAFs and macrophages.
CAFs play a pivotal role in tumor immune evasion, exerting their influence
through crucial pathways, including angiogenesis, epithelial-mesenchymal
transition, cell adhesion, and migration. The functional regulation of CAFs is
known to involve several pathways, including the WNT/P-catenin [24], TGF
The contribution of CAFs to the establishment of an immunosuppressive TME is also significant. The presence of CAFs facilitates the recruitment and differentiation of monocytes into M2-type macrophages, potentially impacting the PD-1 pathway to exert immunosuppressive functions [27]. In a pancreatic cancer model, FAP-positive CAFs promote immunosuppression by secreting CXCL12, thereby enhancing STAT3-CCL2 signaling and facilitating the recruitment of myeloid-derived suppressor cells (MDSCs). Additionally, they also contribute to the generation of regulatory T cells and tumor-associated macrophages [28]. The findings of studies have confirmed that a high level of FAP expression in GC patients undergoing immunotherapy is significantly associated with an unfavorable prognosis [29]. The above findings suggest that targeting CAFs may have potential benefits in enhancing immunotherapy for GC patients. Additionally, our experimental results demonstrate an upregulation of PCSK6 expression on the cell membrane of macrophages in GC tissues compared to normal tissues. Furthermore, we found that RCN3 modulates macrophage polarization by interacting with PCSK6 in macrophages. The experimental findings suggest that CAFs have the ability to target macrophages within the GC tumor microenvironment, leading to alterations in macrophage polarization. Additionally, the results indicate that inhibition of STAT1 can reverse macrophage polarization induced by RCN3. These findings provide a solid theoretical foundation for immunotherapy targeting CAFs in gastric cancer.
The present study highlights RCN3 as the central component, predominantly influenced by macrophages and CAFs within the microenvironment. Through co-culturing cells and validating phenotypes, the phenomenon of macrophage polarization mediated by CAFs via RCN3 has been uncovered, ultimately impacting the proliferation and metastasis of GC cells. This provides a theoretical foundation for the treatment of GC and the development of novel pharmaceuticals. However, further exploration is warranted in this study, such as augmenting the number of animal experiments to conduct more comprehensive investigations on the role of RCN3 in CAFs on macrophages in GC. Additionally, exploring the potential of STAT1 phosphorylation inhibitors may offer innovative prospects for therapeutic drugs targeting gastric cancer.
There is currently a lack of studies investigating the role of CAFs in the pathogenesis of GC, and no research has yet provided evidence for the involvement of CAFs in regulating macrophage polarization through RCN3 in GC. This study discovered that RCN3 was significantly upregulated in GC through comprehensive bioinformatic analysis and experimental validation. Furthermore, we delved deeper into elucidating the intricate roles and molecular mechanisms of CAFs in mediating macrophage activation within GC immunometabolic disorders via the involvement of RCN3. These investigations were complemented by extensive utilization of clinical samples and cellular experiments, thereby providing robust experimental foundations for identifying novel drug targets aimed at treating GC.
The original datasets generated and/or analysed during the current study are available from correspondent author.
WZ, LY designed the manuscript. WZ provided the administrative support. LY, XZ provided the materials. CZ collected the data. WZ analyzed the data. All authors contributed to editorial changes in the manuscript. All authors read and approved the final manuscript. All authors have participated sufficiently in the work and agreed to be accountable for all aspects of the work.
This study was approved by the Hospital Ethics Committee of the Second Affiliated Hospital of Qiqihar Medical University ([2021]1215-4), and all patients signed an informed consent form. The study was performed with reference to the outline of the Declaration of Helsinki.
Not applicable.
Innovation Incentive Program of Qiqihar Science and Technology Bureau (CSFGG-2022154). Joint Guidance Project of Qiqihar City Science and Technology Program (LSFGG-2023076).
The authors declare no conflict of interest.
References
Publisher’s Note: IMR Press stays neutral with regard to jurisdictional claims in published maps and institutional affiliations.