


1 Department of Stomatology, the First Affiliated Hospital of Hunan University of Chinese Medicine, 410021 Changsha, Hunan, China
2 Science and Technology Department, Hunan University of Chinese Medicine, 410208 Changsha, Hunan, China
Abstract
Background: The importance of N6-methyladenosine (m6A) modification in tumorigenesis and progression have been highlighted. This study aimed to investigate the modification of insulin receptor substrate 1 (IRS1) by m6A and its role in oral squamous cell carcinoma (OSCC). Methods: Bioinformatics was employed to predict differential genes related to epithelial-mesenchymal transition (EMT) in OSCC. Seventeen pairs of OSCC and paracancerous tissue samples were collected. The impact of IRS1 on OSCC cell growth and EMT was evaluated. The fluctuations in IRS1 enrichment and the involvement of p53/Line-1 were investigated. Results: IRS1 was highly expressed in OSCC. IRS1 silencing decreased OSCC cell proliferation and increased apoptosis. IRS1 silencing hindered EMT by regulating related markers. IRS1 silencing upregulated p53 and downregulated Line-1 ORF1p. The p53 inhibition reversed the effects of IRS1 silencing and induced EMT in OSCC cells. Furthermore, the m6A modification of IRS1 was increased in OSCC cells. IRS1 were positively regulated by the m6A regulators methyltransferase-like 14 (METTL14) and YTH domain-containing protein 1 (YTHDC1). IRS1 bound to YTHDC1, and YTHDC1 knockdown inhibited the IRS1 nuclear export. The obesity-associated protein (FTO) negatively regulated IRS1, and FTO overexpression reversed the IRS1-induced OSCC tumor growth. Conclusions: m6A methylation-mediated IRS1 regulated EMT in OSCC through p53/Line-1. These findings provide potential therapeutic strategies for managing OSCC.
Keywords
- oral squamous cell carcinoma
- m6A
- EMT
- IRS1
- p53/Line-1
Oral squamous cell carcinoma (OSCC) is the most prevalent malignant tumor of the head and neck. It accounts for over 90% of all oral malignancies [1]. Around 377,713 cases of lip and oral cancer have been diagnosed in 2020 with mortality rates of over 40%. Its incidence is projected to increase [2, 3]. The improvements in patient prognosis and survival remain limited despite advances in the diagnosis and treatment of OSCC [4, 5]. Proliferation, invasion, and metastasis are the predominant factors of mortalities caused by OSCC [6]. Epithelial-to-mesenchymal transition (EMT) is the critical mechanism of cancer development. EMT in OSCC is responsible for local recurrence and lymph node metastasis [7]. Previous studies have revealed that restoring EMT of OSCC cells can reduce lymph node metastasis and improve the overall survival [8]. Therefore, EMT may be a promising therapeutic strategy for OSCC.
Studies have depicted that p53, as a tumor suppressor, regulates apoptosis, cell cycle arrest, senescence, and metabolic homeostasis in cancer cells [9]. Recent studies have highlighted the role of p53 in EMT. Wild type (WT) 53 inhibits EMT and maintains the epithelial cell phenotype [10]. Other studies have revealed that p53 overexpression reverses the enhanced impact of ubiquitin-conjugating enzyme E2C (UBE2C) on cancer cell proliferation and EMT [11]. Downregulation of p53 promotes EMT and tumorigenesis [12]. EMT-inducing factors bind and inhibit WT p53 [13]. Line-1 elements are the only active and autonomous retrotransposons in the human genome and contribute to cancer progression [14]. A previous study has shown that two Line-1 encoded proteins (L1ORF1p and L1ORF2p) are highly expressed in OSCC [15]. Line-1 promotes OSCC cell proliferation, migration, and invasion by mediating EMT [16]. It has been reported that p53 binds to the 5’ UTR of Line-1 and inhibits its expression [17]. However, the precise role of p53/Line-1 in tumor EMT is poorly understood.
N6-methyladenosine (m6A) is the most abundant mRNA modification in mammals and
is involved in several aspects of RNA metabolism [18]. Methyltransferase-like 3
(METTL3), METTL14 and Wilms’ tumor 1-associated protein (WTAP) are collectively
referred to as “writers”. They are the components of the methyltransferase
complex that catalyze m6A methylation. This process is reversible and the m6A
modification can be removed by demethylases (“erasers”), including
obesity-associated protein (FTO). In addition, m6A “readers” such as members of
the YT521-B homology (YTH) domain are responsible for recognizing and binding to
m6A modification sites. Dysregulated m6A modification is associated with cancer
development, including OSCC [19, 20]. The m6A gene HNRNPC induces EMT,
which promotes OSCC development [21]. METTL3 mediates m6A modification of
BMI1, which in turn accelerates OSCC cell proliferation and metastasis
[22]. The m6A reader HNRNPA2B1 induces EMT via the
Line-1/TGF-
A total of 17 OSCC patients were recruited from the First Affiliated Hospital of Hunan University of Chinese Medicine. Seventeen pairs of tumor and corresponding paracancerous tissue samples were collected. The paracancerous tissue was 2 cm away from the primary lesion. This cohort was approved by the Ethics Committee of the First Affiliated Hospital of Hunan University of Chinese Medicine (HN-LL-KY-2021-072). The study was conducted in accordance with the Declaration of Helsinki. The medical history and clinical information of the patients were collected, which included age, gender, smoking status, tumor location, and tumor node metastasis (TNM) classification (Table 1). The patients underwent curative tumor resection, cervical lymph node dissection, and free flap repair and reconstruction surgery. No complications occurred. Written informed consent was obtained from all recruited subjects.
| Variable | Cases, N (%) | |
| Total patients | 17 | |
| Gender | ||
| Male | 14 (82.4) | |
| Female | 3 (17.6) | |
| Age (years) | ||
| 14 (82.4) | ||
| 3 (17.6) | ||
| Smoking | ||
| Yes | 12 (70.6) | |
| No | 5 (29.4) | |
| Primary site | ||
| Buccal mucosa | 8 (47.0) | |
| Tongue | 9 (53.0) | |
| T classification | ||
| T1 | 3 (17.6) | |
| T2 | 10 (58.9) | |
| T3 | 3 (17.6) | |
| T4 | 1 (5.9) | |
| Lymph node metastasis | ||
| N0 | 10 (58.9) | |
| N1 | 4 (23.5) | |
| N2 | 3 (17.6) | |
| Distant metastasis | ||
| Yes | 0 (0) | |
| No | 17 (100) | |
OSCC, oral squamous cell carcinoma.
The differentially expressed genes in OSCC were downloaded from the microarray
datasets (GSE25099 and GSE30784) of the Gene Expression Omnibus (GEO) database (https://www.ncbi.nlm.nih.gov/geo/.).
Filtering conditions were set as abs(log flod change (FC))
OSCC cell lines were purchased from Abiowell (Changsha, China) which included
SCC-9 (AW-CCH135), SCC-25 (AW-CCH134), and CAL-27 (AW-CCH129). CAL-27 cells were
maintained in Dulbecco’s modified Eagle’s medium (DMEM; D5796, Sigma Aldrich, St.
Louis, MO, USA) containing 10% fetal bovine serum (FBS; 10099141, Gibco, San
Diego, CA, USA) and 1% penicillin-streptomycin (P/S; AWH0529a, Abiowell). SCC-9
cells were grown in DMEM/F12 (D8437, Sigma Aldrich) with 10% FBS, 400 ng/mL
hydrocortisone, and 1% P/S. SCC-25 cells were cultured in DMEM/F12 with 10%
FBS, 400 ng/mL hydrocortisone, 1% sodium pyruvate, and 1% P/S. Normal human
oral keratinocytes (HOK) (#2610) were obtained from ScienCell (San Diego, CA,
USA) and maintained in oral keratinocyte culture medium. All cell lines were
validated by short tandem repeat (STR) profiling and tested negative for mycoplasma. Cells were
cultured in a humidified incubator at 37 °C with 5% CO
Lipofectamine 2000 reagent (11668019, Invitrogen, Carlsbad, CA, USA) was
employed to transfect SCC-25 and CAL-27 cells with insulin receptor substrate 1
interference vector (sh-IRS1), METTL14 interference vector (sh-METTL14),
overexpressed METTL14 vector (oe-METTL14), overexpressed FTO vector (oe-FTO),
YTHDC1 interference vector (sh-YTHDC1), and corresponding negative control (NC)
reagents. The vectors were purchased from HonorGene (Changsha, China). SCC-25 and
CAL-27 cells were treated with 200 µM pifithrin-
SCC-25 and CAL-27 cells were trypsinized and seeded into 96-well plates at a
density of 5
The EDU assay kit (C10310, RiboBio, Guangzhou, China) was used to evaluate cell
proliferation. The transfected SCC-25 and CAL-27 cells were seeded in 96-well
plates at a density of 5
SCC-25 and CAL-27 cells were trypsinized and resuspended in culture medium. The
suspension containing 200 cells was seeded in a 6-well plate. Cells were grown in
an incubator (37 °C, 5% CO
Transwell chambers (3428, Corning lnc., Corning, NY, USA) were used to evaluate
cell migration. Briefly, 500 µL DMEM with 10% FBS was added to the bottom
chamber. The culture chamber was inoculated with 2
SCC-25 and CAL-27 cells were trypsinized after transfection. The cells were washed with PBS and resuspended in binding buffer. Annexin V-APC and propidium iodide (KGA1030, KeyGen BioTECH, Nanjing, China) were added sequentially and incubated for 10 min in the dark at room temperature. The extent of apoptosis was determined by flow cytometry (A00-1-1102, Beckman, Brea, CA, USA).
E-cadherin and
Four-week-old male nude mice were purchased from Hunan SJA Laboratory Animal
Co., Ltd (Changsha, China). After one week of adaptation, 2
Total protein was extracted from cell lysates or tumor tissue by radioimmunoprecipitation assay (RIPA, AWB0136, Abiowell). Protein was quantified using bicinchoninic acid (BCA) kit (AWB0104, Abiowell). Total proteins were separated by sodium dodecyl-sulfate polyacrylamide gel electrophoresis (SDS-PAGE) and transferred to nitrocellulose membranes. The membranes were blocked in 5% skimmed milk powder and incubated with primary antibodies at 4 °C overnight. They were washed with Tris-buffered saline (TBST) and incubated with secondary antibodies for 90 min. Finally, the membranes were exposed to ECL Plus (AWB0005, Abiowell), and protein bands were observed in a gel imaging system (ChemiScope6100, CLiNX, Shanghai, China). Information on the antibodies is given in Table 2. Raw data for western blotting can be found in the Supplementary Material.
| Indicator | Dilution | Origin | Catalog | Manufacturer |
| IRS1 | 1:1000 | Rabbit | 17509-1-AP | Proteintech |
| Line-1 ORF1p | 1:1000 | Rabbit | ab216324 | Abcam |
| p53 | 1:20,000 | Rabbit | 10442-1-AP | Proteintech |
| Vimentin | 1:2000 | Rabbit | ab92547 | Abcam |
| Snail1 | 1:1000 | Rabbit | 13099-1-AP | Proteintech |
| Snail2 | 1:2000 | Rabbit | 12129-1-AP | Proteintech |
| METTL14 | 1:2000 | Rabbit | 26158-1-AP | Proteintech |
| FTO | 1:10,000 | Rabbit | ab126605 | Abcam |
| Claudin-1 | 1:1000 | Rabbit | ab15098 | Abcam |
| ZO-1 | 1:1000 | Rabbit | ab96587 | Abcam |
| 1:5000 | Mouse | 66009-1-Ig | Proteintech | |
| HRP goat anti-mouse IgG | 1:5000 | Mouse | SA00001-1 | Proteintech |
| HRP goat anti-rabbit IgG | 1:6000 | Rabbit | SA00001-2 | Proteintech |
IRS1, insulin receptor substrate 1; Line-1 ORF1p, open reading frame 1 protein from long interspersed nuclear element 1; METTL14, methyltransferase-like 14; FTO, obesity-associated protein; ZO-1, zonula occludens-1.
Total RNA was extracted from cell lysates using TRIzol (15596026, Thermo,
Waltham, MA, USA) and reverse transcribed using HiFiScript cDNA
synthesis kit (CW2569, ConWin, Taizhou, China). The qRT-PCR was performed using
the UltraSYBR Mixture Kit (CW2601, ConWin). Relative IRS1 enrichment after
normalization with
The RIP assay kit (17-700, Merck, Billerica, MA, USA) was used according to the manufacturer’ guidelines. RIP lysis buffer was used to lyse SCC-25 and CAL-27 cells. Lysates were incubated with YTHDC1 (14392-1-AP, Proteintech) and IgG antibodies at 4 °C overnight, followed by incubation with Protein A/G magnetic beads. The precipitated RNA was extracted with Trizol reagent and subjected to qRT-PCR for determination of IRS1 enrichment caused by each antibody.
MeRIP-qPCR was used to quantify m6A-modified IRS1. The cleaved RNA fragments were incubated overnight at 4 °C with m6A antibody (ab286164, Abcam, Cambridge, UK) or IgG antibody, followed by incubation with Protein A/G magnetic beads. RNA was extracted from the beads and the IRS1 enrichment was determined by qRT-PCR.
The subcellular localization of IRS1 was detected by FISH kit by according to the instructions (C10910, RiboBio, Guangzhou, China). SCC-25 and CAL-27 cells were fixed with 4% polyformaldehyde and permeabilized with 0.3% Triton X-100. They were hybridized with IRS1 probe overnight in the dark at 4 °C. The nuclei were stained with DAPI. IRS1 localization was observed by fluorescence microscopy (BA210E, Motic, Xiamen, China).
IHC was used to determine the expression of IRS1 and ki67 in tissues. Briefly,
sections were thermochemically repaired, and 1% periodate was added to eliminate
the endogenous peroxidase activity. After washing, the sections were incubated
overnight at 4 °C with IRS1 (1:200, 17509-1-AP, Proteintech) or Ki67 (1:400,
ab16667, Abcam). They were incubated with HRP goat anti-mouse IgG (1:100,
AWS0003, Abiowell). The nuclei were stained with hematoxylin. The sections were
incubated in alcohol and xylene. Finally, images (100
All results were expressed as mean
The differentially expressed genes in OSCC from two databases (GSE25099 and GSE30784) were screened and analyzed. The analysis revealed that large number of genes were differentially expressed in OSCC tissues, as shown by volcano plots and heat maps (Fig. 1A,B). EMT-related genes [23] were identified to predict the common targets of EMT and OSCC. Venn diagram showed 96 common EMT-related genes (Fig. 1C and Table 3). The EMT-related gene IRS1 was upregulated in OSCC tissues (Table 3). Previous studies demonstrated the role of IRS1 in EMT [25, 26, 27]. IRS1 was prioritized as a target because it negatively regulates p53 expression in endothelial cells and neurons [28]. The tumor suppressor p53 regulates the EMT process by modulating several intercellular cascades [29]. IHC staining was performed on the collected clinical samples to detect IRS1 expression. IRS1 expression was higher in OSCC tissues compared to paracancerous tissues (Fig. 2). These results indicated the involvement of IRS1 in the pathogenesis of OSCC.
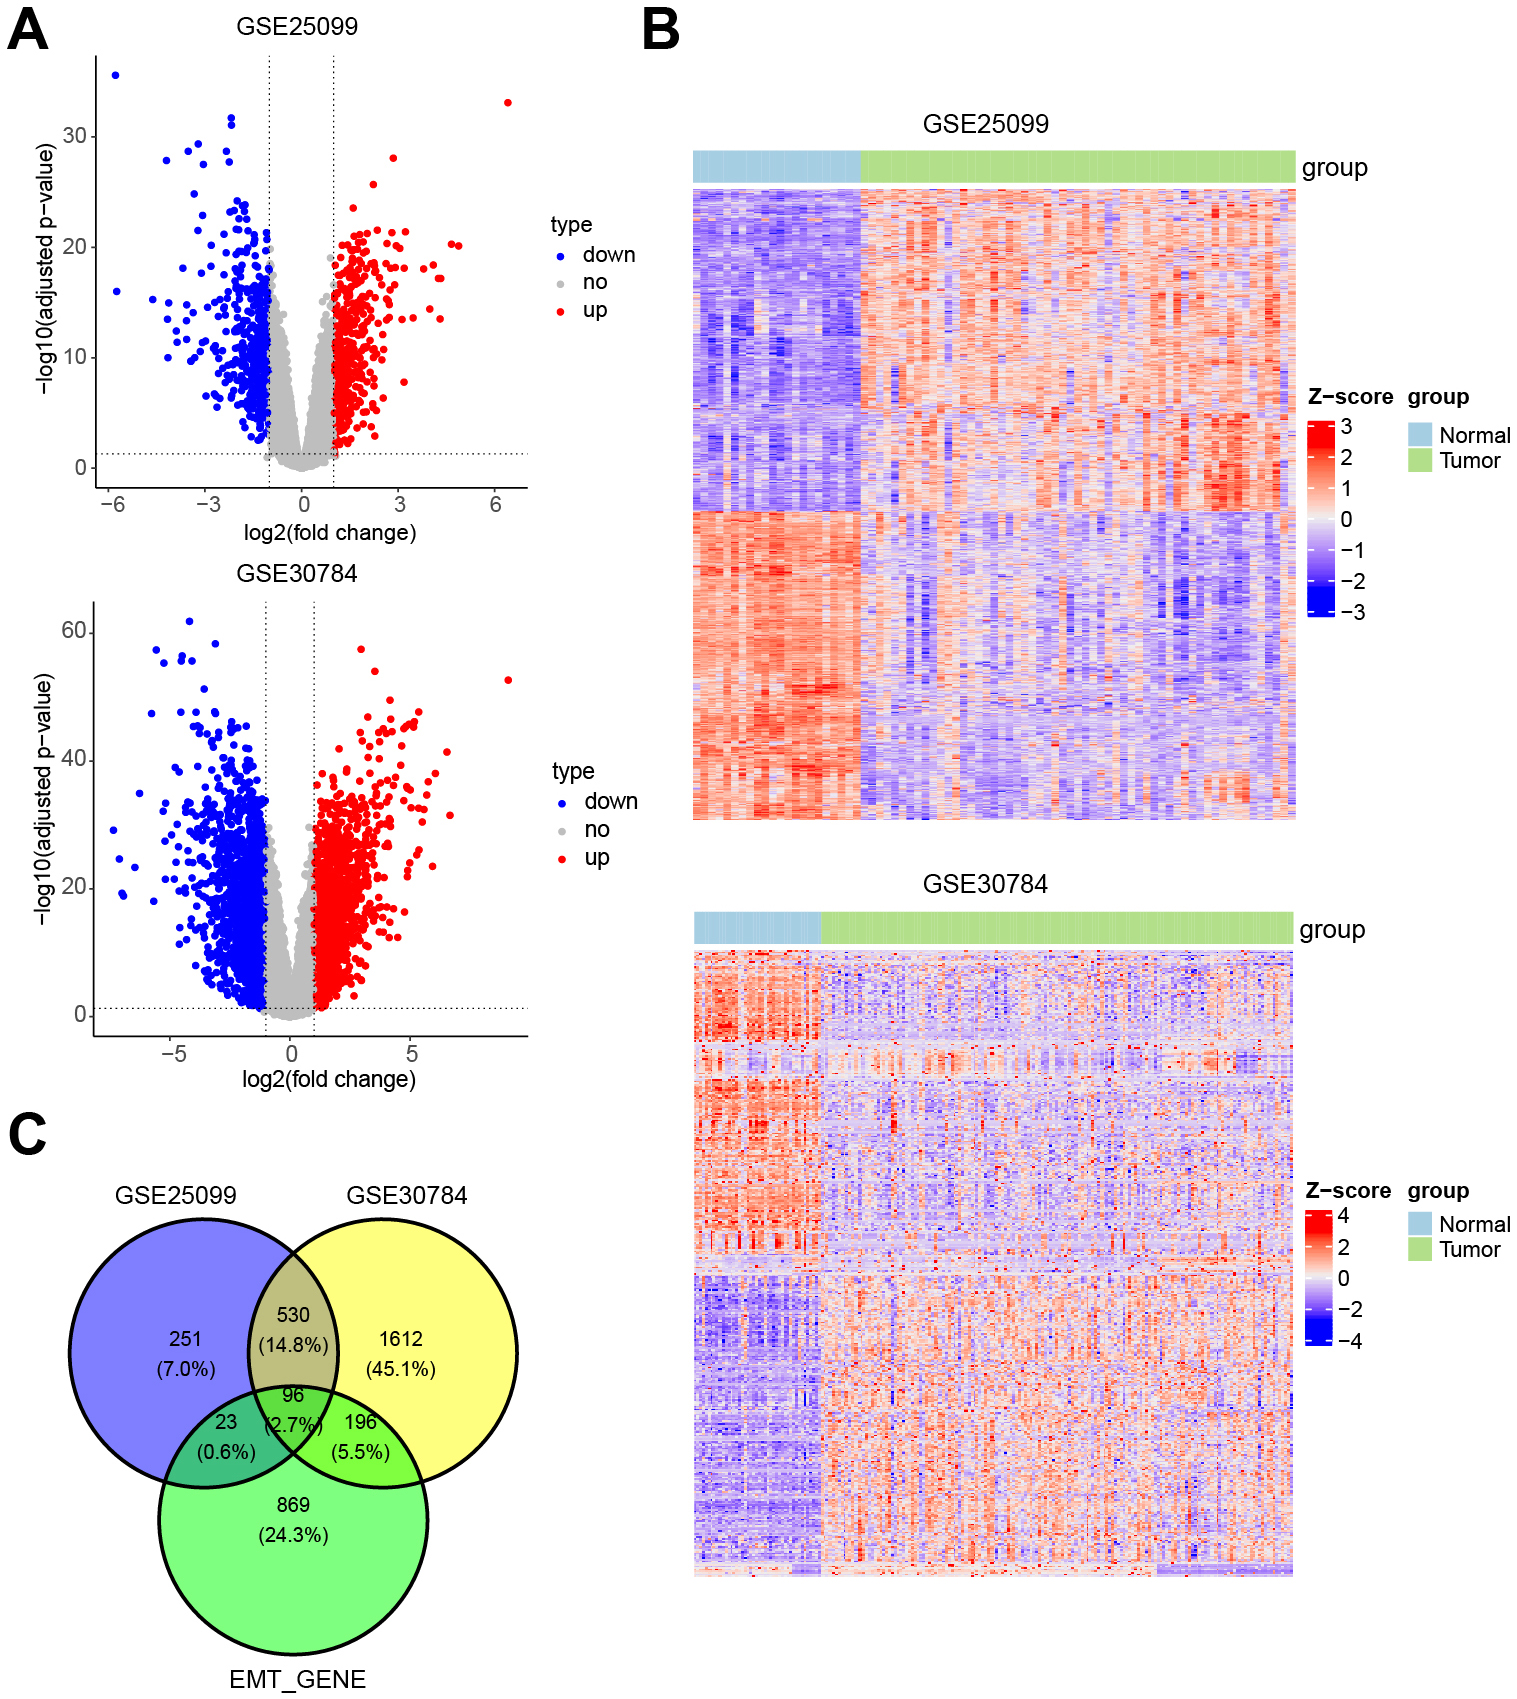 Fig. 1.
The intersection of epithelial-mesenchymal transition (EMT)-related genes and differentially expressed genes in oral squamous cell carcinoma (OSCC). (A) Volcano plot and (B) heat map showing differentially expressed genes (GSE25099 and GSE30784) in OSCC. (C) Venn diagram showing the intersection of EMT-related and differentially expressed genes in OSCC.
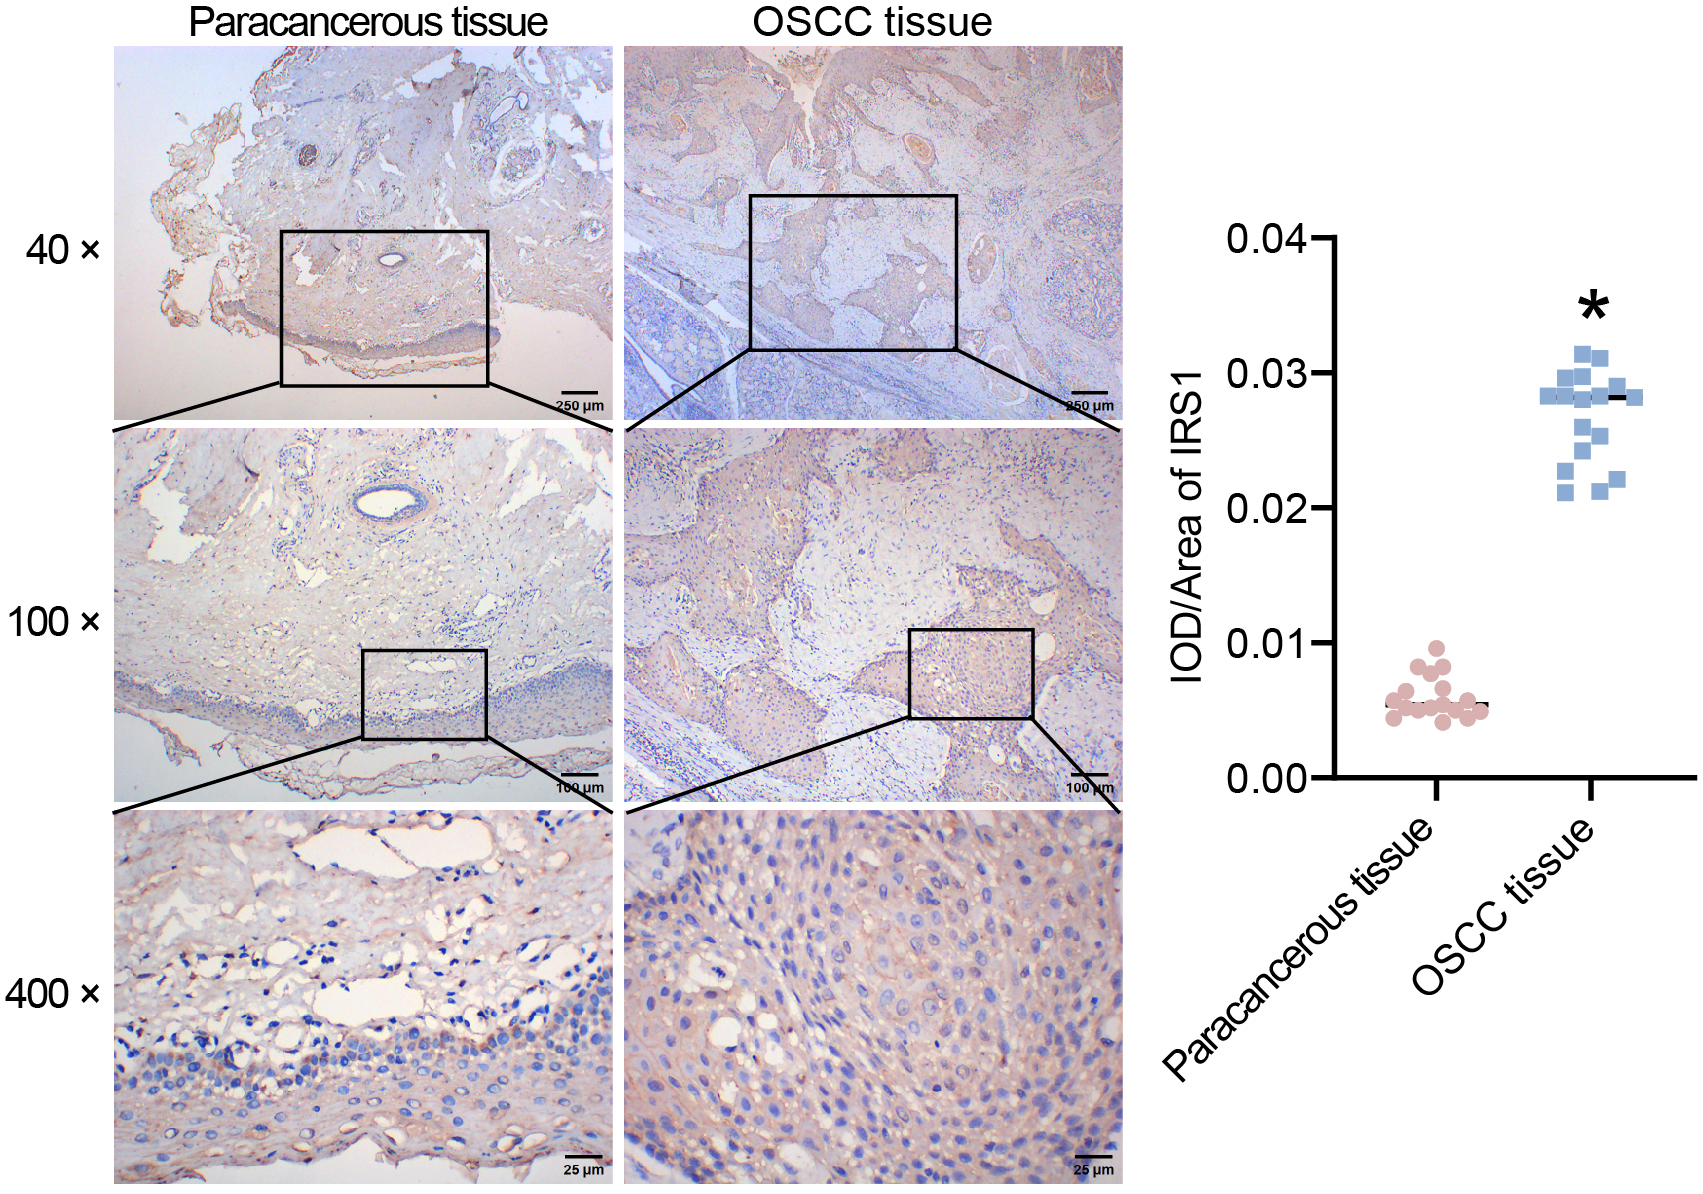 Fig. 2.
Identification of insulin receptor substrate 1 (IRS1) expression
in 17 pairs of OSCC and corresponding paracancerous tissue samples by
immunohistochemistry (IHC) staining. Scale bar, 250 µm (up), 100 µm
(middle), and 25 µm (down). *p
| Gene name | LogFC | p-value |
| Up-regulated genes in OSCC | ||
| PDPN | 1.683 | 7.21 |
| LAMC2 | 3.054 | 4.21 |
| MAD2L2 | 1.185 | 2.14 |
| PTGS2 | 1.445 | 1.4 |
| LTBP1 | 1.408 | 4.02 |
| MTHFD2 | 1.013 | 5.63 |
| CCL20 | 2.216 | 7.25 |
| IL1B | 1.697 | 3.63 |
| CXCR4 | 1.084 | 1.08 |
| STAT1 | 2.040 | 1.2 |
| FN1 | 2.253 | 5.4 |
| IRS1 | 1.181 | 3.04 |
| SKIL | 1.267 | 1.37 |
| ECT2 | 1.264 | 1.95 |
| PFN2 | 2.303 | 8.67 |
| EIF5A2 | 1.839 | 6.86 |
| S100P | 0.430 | 4.91 |
| CXCL8 | 4.326 | 5.05 |
| CXCL13 | 1.185 | 0.002952 |
| SPP1 | 3.467 | 4.53 |
| CXCL9 | 3.986 | 6.15 |
| FST | 2.914 | 3.72 |
| F2RL2 | 1.441 | 5.11 |
| CD14 | 1.874 | 3.51 |
| HAVCR2 | 1.089 | 3.14 |
| FSCN1 | 1.548 | 3.27 |
| IL6 | 1.075 | 4.96 |
| CDK14 | 1.411 | 8.85 |
| SERPINE1 | 2.642 | 6.1 |
| MET | 1.424 | 1.67 |
| PTPRZ1 | 2.287 | 4.47 |
| LYN | 1.405 | 2.08 |
| SNAI2 | 1.178 | 2.55 |
| PAG1 | 1.217 | 1.18 |
| HAS2 | 1.032 | 0.020639 |
| CD274 | 2.161 | 4.26 |
| TNC | 2.275 | 1.19 |
| DKK1 | 1.880 | 1.29 |
| ADAM12 | 1.996 | 4.55 |
| MICAL2 | 1.593 | 1.1 |
| MMP7 | 2.250 | 5.29 |
| MMP1 | 6.411 | 1.82 |
| MMP3 | 4.882 | 2.45 |
| MMP13 | 3.185 | 1.23 |
| ETS1 | 1.058 | 2.19 |
| FOXM1 | 1.106 | 1.44 |
| PTHLH | 2.492 | 2.16 |
| ITGA5 | 1.445 | 9.5 |
| POSTN | 2.011 | 1.23 |
| MMP14 | 1.033 | 1.06 |
| GREM1 | 2.335 | 1.85 |
| AQP9 | 1.393 | 3.55 |
| CSPG4 | 1.010 | 4.03 |
| CCL18 | 2.213 | 1.81 |
| ITGA3 | 1.634 | 2.72 |
| ITGB4 | 1.067 | 2.82 |
| CCL5 | 1.139 | 1.17 |
| KRT17 | 1.868 | 8.7 |
| MMD | 1.637 | 1.97 |
| LAMA1 | 1.058 | 1.93 |
| PLAUR | 1.745 | 3.64 |
| MMP9 | 1.898 | 5.62 |
| TGM2 | 1.296 | 7.99 |
| MMP11 | 1.147 | 1.38 |
| LGALS1 | 1.667 | 2.93 |
| TIMP1 | 1.527 | 1.35 |
| MSN | 1.218 | 3.65 |
| ISG15 | 1.147 | 2.28 |
| Down-regulated genes in OSCC | ||
| TGFBR3 | –1.960 | 7.6 |
| CXCR2 | –1.989 | 6.73 |
| KAT2B | –1.376 | 9.42 |
| SCIN | –1.938 | 1.9 |
| PTN | –2.031 | 3.78 |
| AQP3 | –1.419 | 2 |
| ALAD | –1.011 | 7.66 |
| CAMK1D | –1.169 | 1.54 |
| PDCD4 | –1.375 | 4.05 |
| PARD3 | –1.005 | 4.69 |
| CXCL12 | –1.606 | 3.41 |
| NUCB2 | –1.260 | 6.11 |
| P2RY2 | –1.118 | 4.06 |
| ELF5 | –1.977 | 1.41 |
| SCEL | –2.446 | 4.96 |
| TYRO3 | –1.161 | 5.91 |
| MAPK3 | –1.214 | 9.36 |
| ERBB2 | –1.217 | 4.86 |
| PITPNM3 | –1.051 | 3.76 |
| CLDN7 | –1.832 | 1.18 |
| KRT19 | –1.290 | 2.32 |
| CEACAM5 | –1.983 | 2.49 |
| CEACAM1 | –1.299 | 9.25 |
| LYPD3 | –1.116 | 2.25 |
| BMP7 | –1.895 | 6.87 |
| KLF8 | –1.137 | 1.82 |
| CD24 | –1.607 | 2.64 |
| Unclear in OSCC | ||
| HPGD | –0.04135 | 0.860842 |
The abundance of IRS1 was increased in SCC-9, SCC-25 and CAL-27 cells compared to HOK cells (Fig. 3A). The increase in IRS1 was more pronounced in SCC-25 and CAL-27 cells, which were selected for further study.
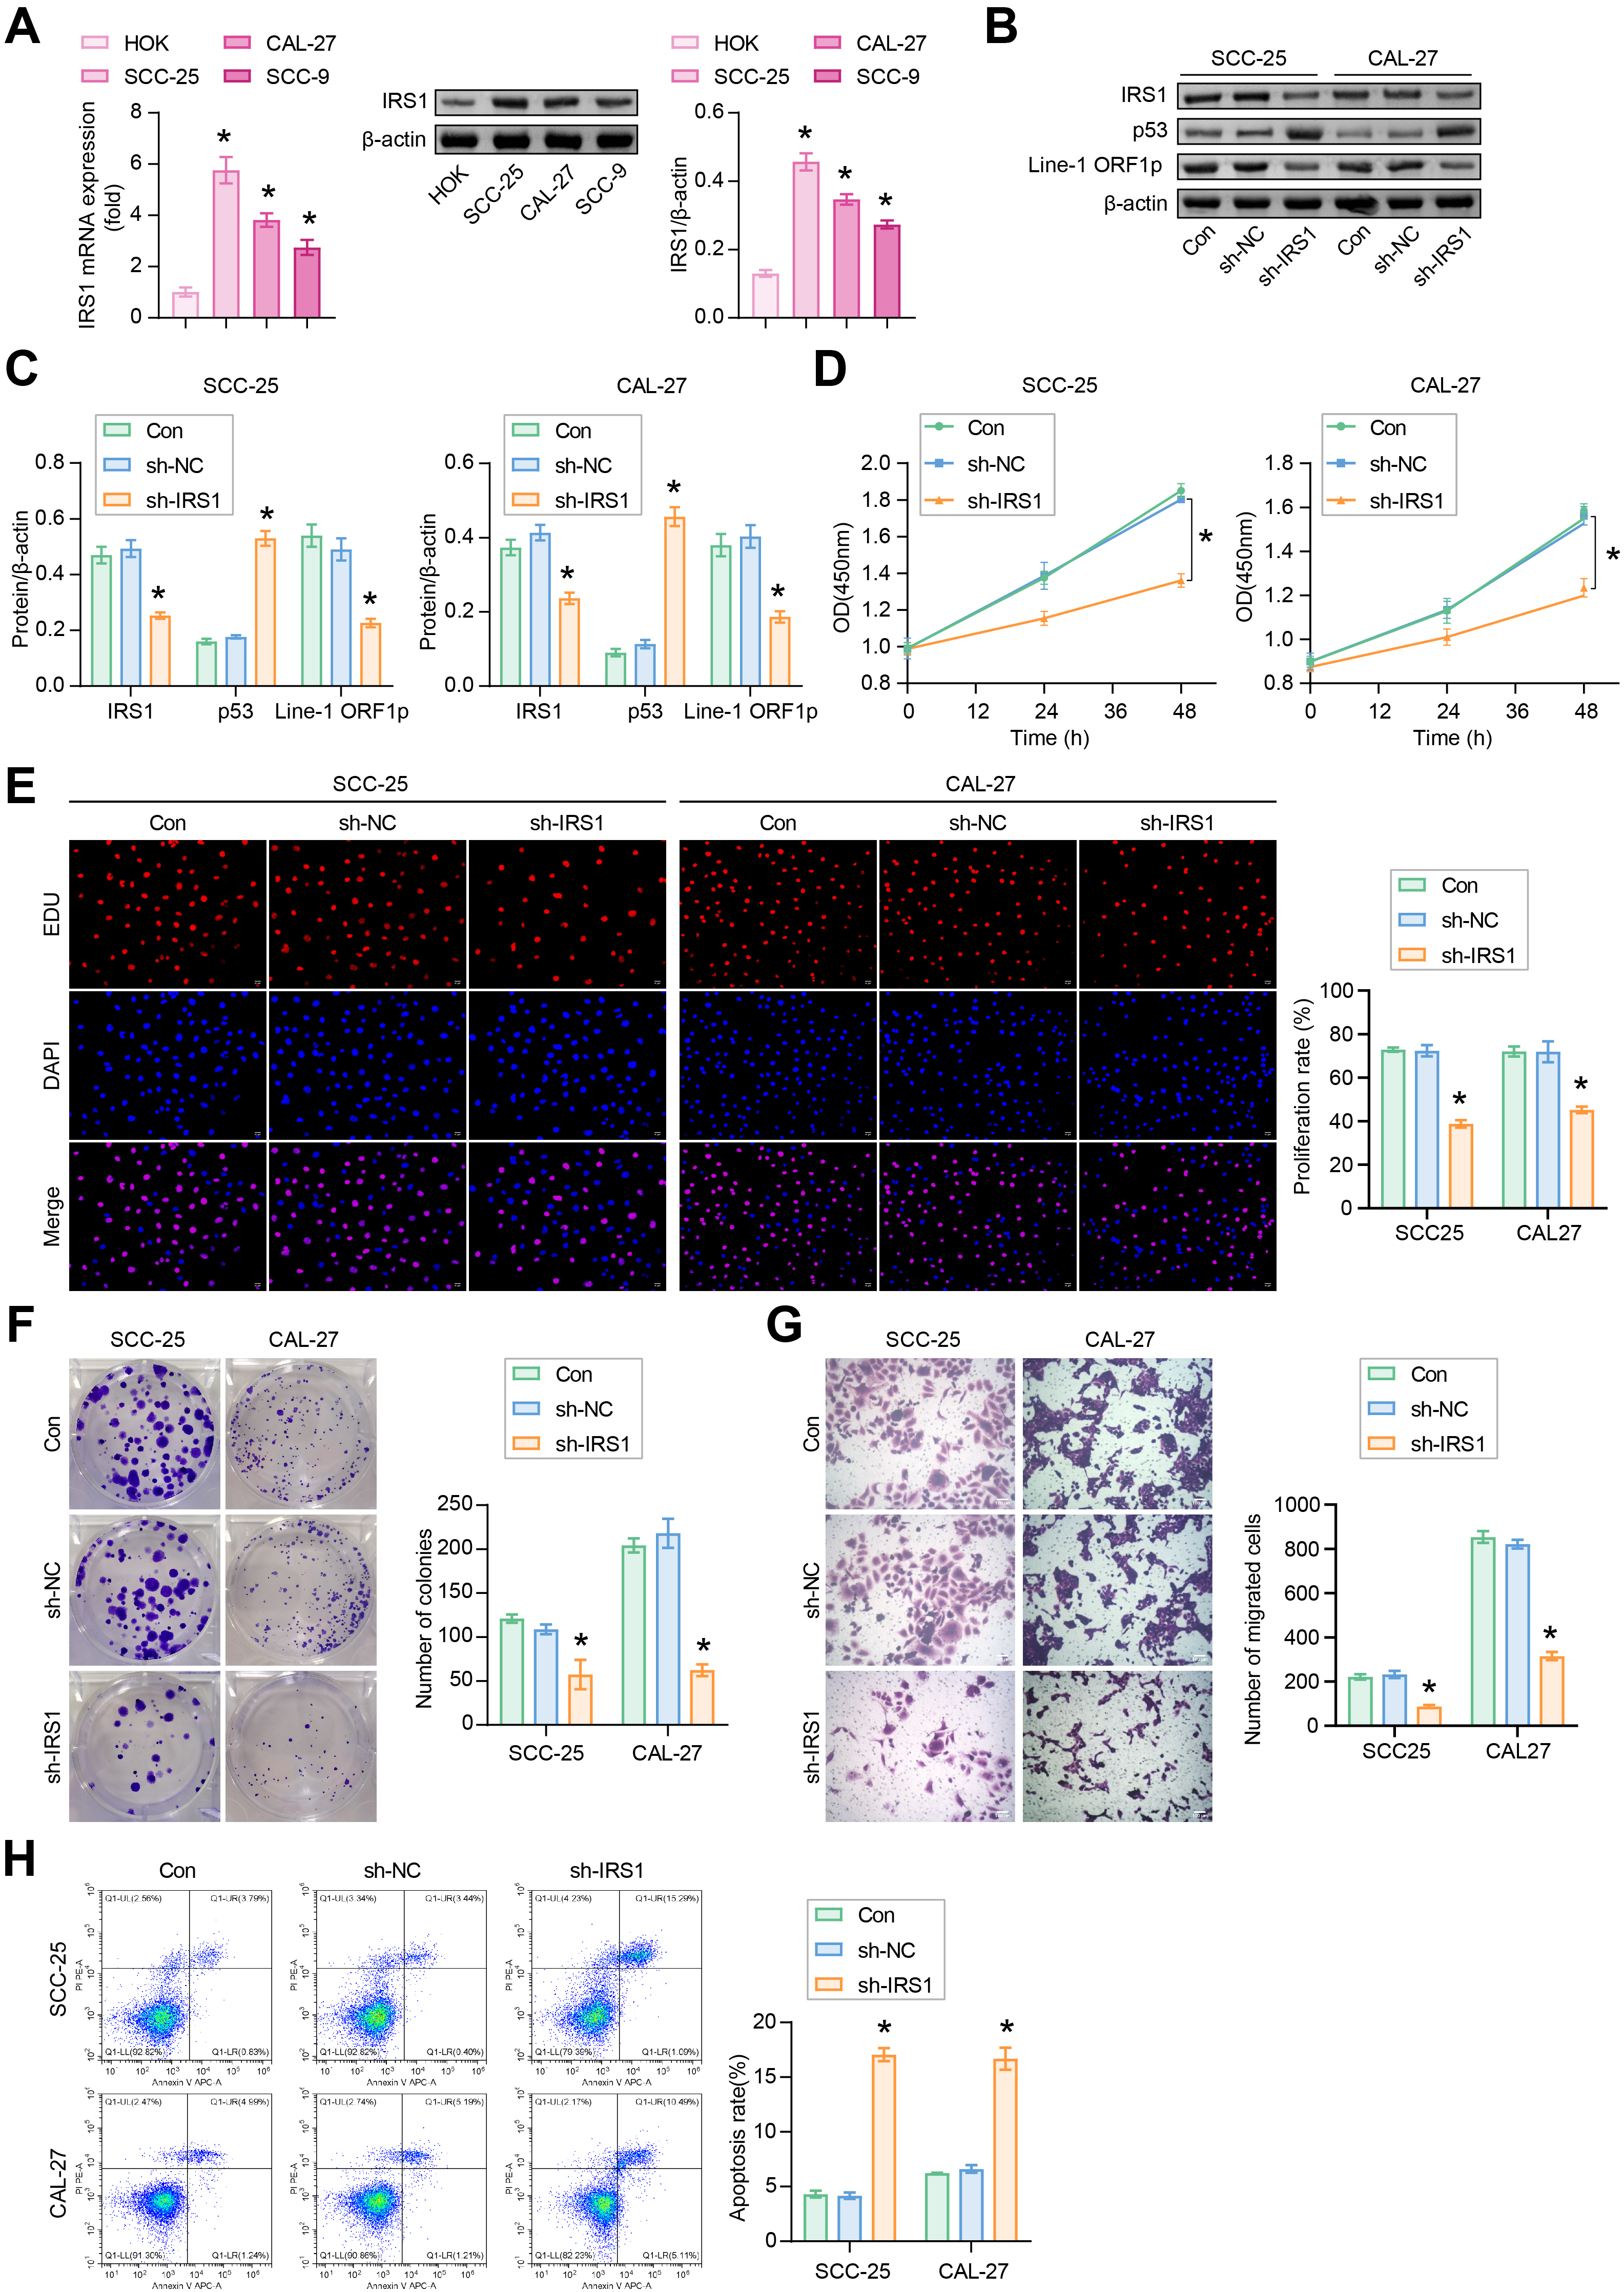 Fig. 3.
IRS1 regulates the proliferation and apoptosis of SCC-25 and
CAL-27 cells. (A) The mRNA level and protein expression of IRS1 were determined
by quantitative real-time PCR (qRT-PCR) and western blotting, respectively.
*p
SCC-25 and CAL-27 cells were transfected with sh-IRS1 to evaluate the role of IRS1. Analysis revealed that sh-IRS1 inhibited the protein abundance of IRS1 and Line-1 ORF1p and promoted the accumulation of p53 compared to the negative control interference vector (sh-NC) group (Fig. 3B,C). CCK8 depicted that the proliferative ability of cells in the sh-IRS1 group was reduced compared to the sh-NC group (Fig. 3D). EDU staining demonstrated that IRS1 silencing inhibited the proliferation of OSCC cells (Fig. 3E). Compared to the sh-NC group, sh-IRS1 reduced the number of cloned and migrated OSCC cells (Fig. 3F,G). The apoptosis rates of SCC-25 and CAL-27 cells were increased in the sh-IRS1 group (Fig. 3H). These findings indicated that IRS1 silencing regulated the p53/Line-1 signaling pathway, inhibited OSCC cell proliferation and migration, and promoted apoptosis.
Activation of the EMT program resulted in the transformation of epithelial cells
expressing high levels of epithelial cell markers into mesenchymal cells
expressing mesenchymal cell markers [30]. Compared with the sh-NC group, sh-IRS1
promoted the protein expression of epithelial cell markers (Claudin-1 and ZO-1)
in SCC-25 and CAL-27 cells. The expression of mesenchymal cell markers (Vimentin,
Snail1 and Snail2/Slug) was suppressed by sh-IRS1 (Fig. 4A). IF detection showed
that the fluorescence intensity of epithelial cell marker E-cadherin was
increased in the sh-IRS1 group. The fluorescence intensity of mesenchymal cell
marker
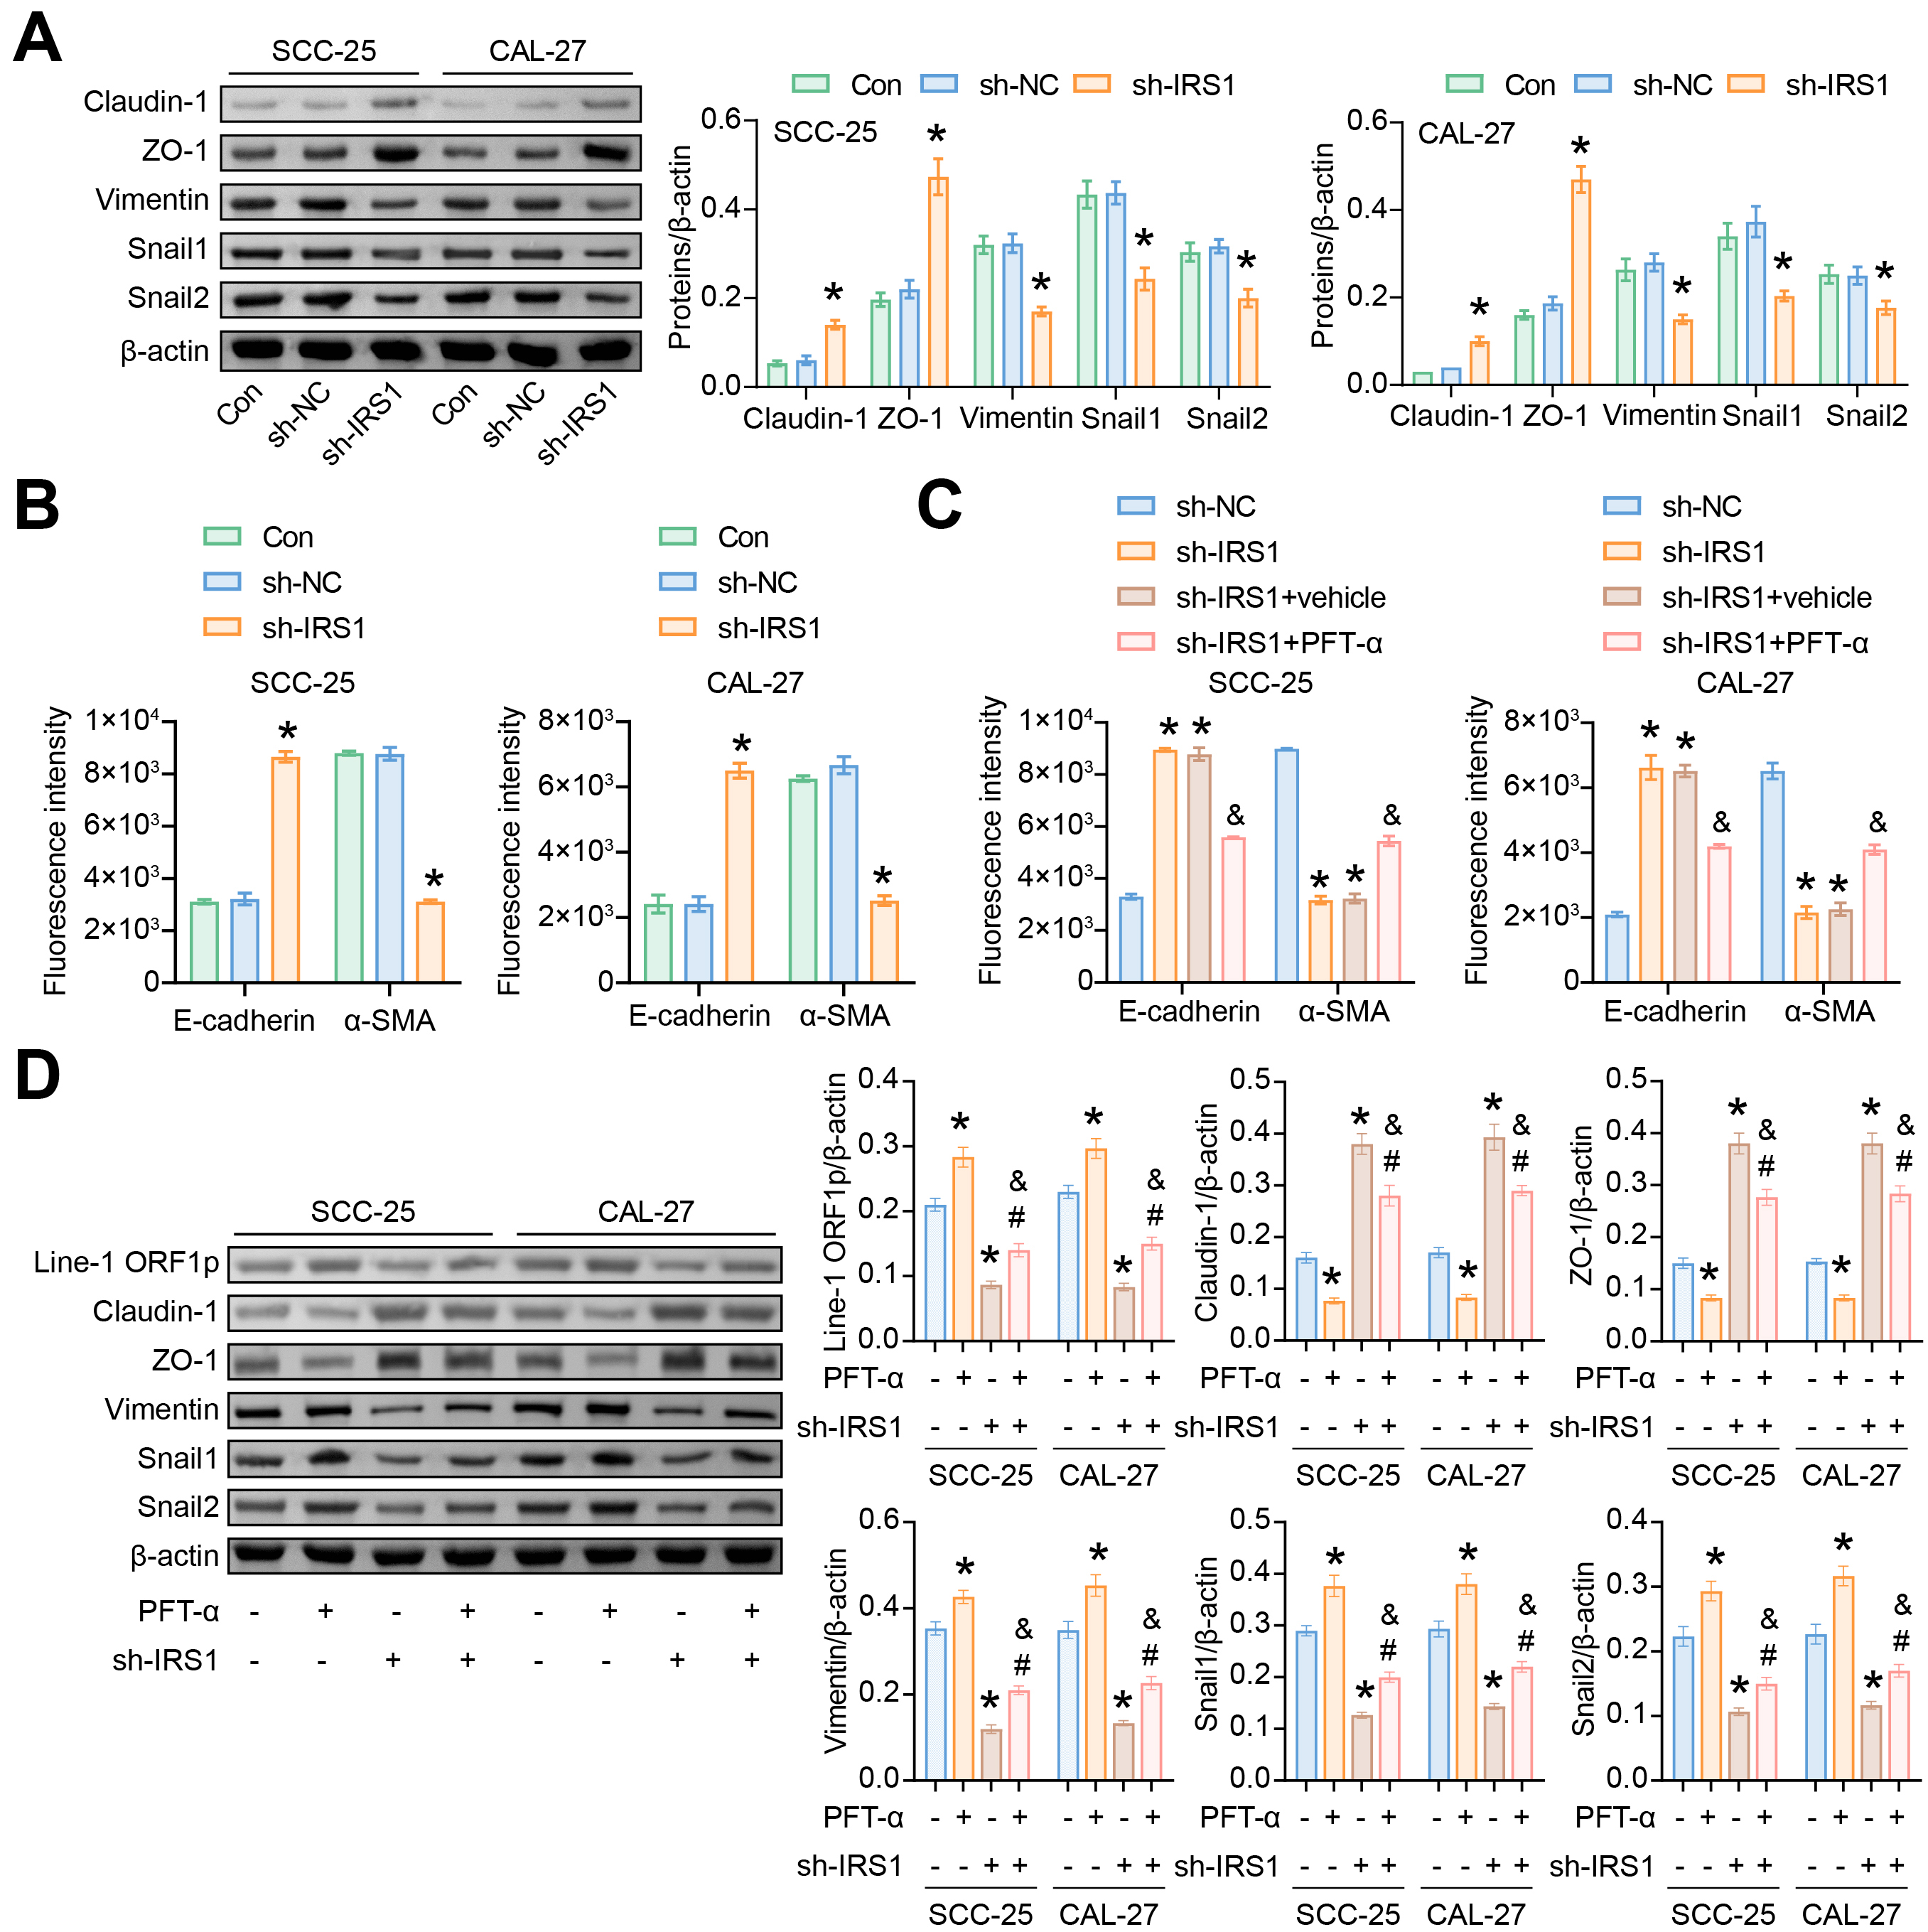 Fig. 4.
IRS1 regulates the EMT program in SCC-25 and CAL-27 cells. (A)
Western blotting analysis of Claudin-1, ZO-1, Vimentin, Snail1 and Snail2/Slug
protein abundance. *p
The p53 inhibitor PFT-
METTL14 has a role in tumorigenesis by mediating the m6A modifications [31]. Compared to the sh-NC group, the expressions of METTL14 and IRS1 were reduced in SCC-25 and CAL-27 cells after transfection with sh-METTL14. Transfection with oe-METTL14 increased the expression of METTL14 and IRS1 in SCC-25 and CAL-27 cells (Fig. 5A). The m6A modification was involved in IRS1-mediated EMT induction in OSCC cells. The m6A modification levels of IRS1 were identified in SCC-25 and CAL-27 cells by MeRIP-qPCR assay. SCC-25 and CAL-27 cells exhibited increased m6A modification levels of IRS1 compared to HOK cells (Fig. 5B). Compared with the sh-NC group, sh-METTL14 downregulated the m6A modification levels of IRS1. Compared with the oe-NC group, oe-METTL14 upregulated the m6A levels of IRS1 (Fig. 5C). FTO is an important demethylase. SCC-25 and CAL-27 cells after transfection with oe-FTO exhibited increased FTO expression and decreased IRS1 expression (Fig. 5D). These results indicated that METTL14 and FTO regulated the IRS1 mRNA stability in SCC-25 and CAL-27 cells.
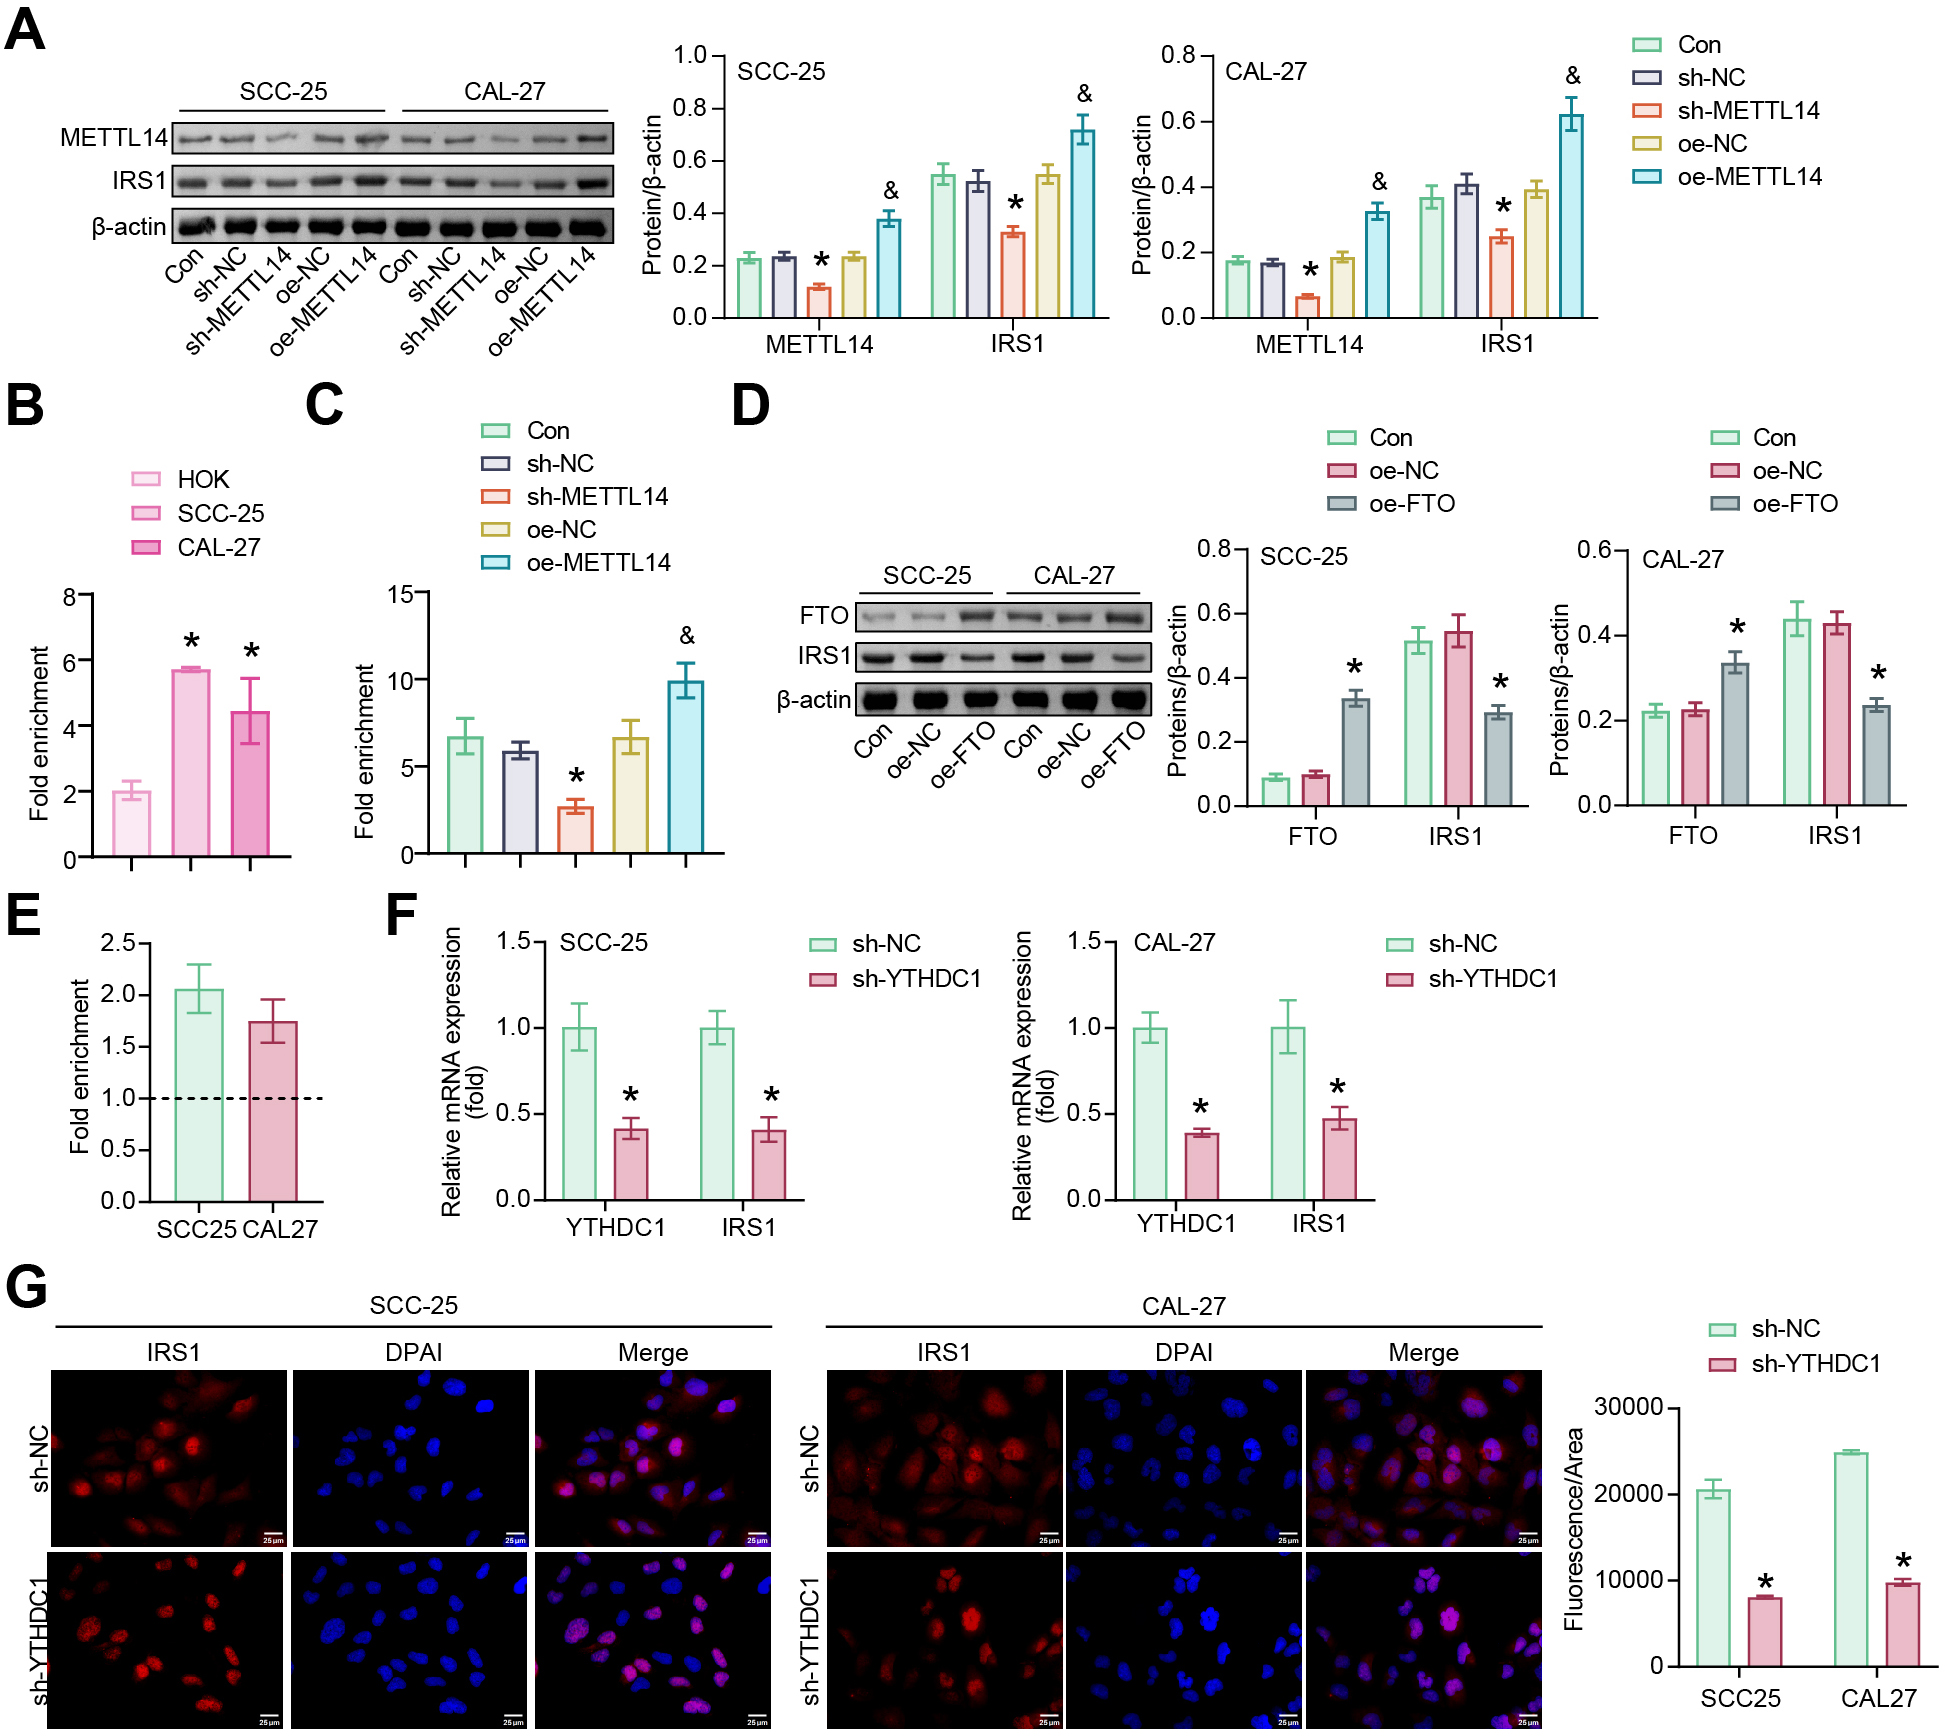 Fig. 5.
METTL14 and FTO mediate IRS1 N6-methyladenosine (m6A)
modifications in SCC-25 and CAL-27 cells. (A) Western blotting for METTL14 and
IRS1 protein abundance. *p
The m6A readers were screened against IRS1 mRNA. The highest ranked m6A reader by catRAPID was YTHDC1 (ranking = 0.967792), suggesting that YTHDC1 might mediate IRS1 mRNA expression in an m6A-dependent manner. RIP assays revealed significant enrichment of IRS1 in the YTHDC1 antibody bound complex of SCC-25 and CAL-27 cells (Fig. 5E), indicating the interaction between YTHDC1 and IRS1. The sh-YTHDC1 restricted the mRNA levels of YTHDC1 and IRS1 (Fig. 5F). FISH analysis revealed that IRS1 was localized to the nucleus rather than the cytoplasm, and IRS1 expression was reduced in SCC-25 and CAL-27 cells transfected with sh-YTHDC1 (Fig. 5G). These data supported a role for YTHDC1 in promoting nuclear export of m6A-modified IRS1.
The nude mice received CAL-27 cell suspension transfected with overexpression plasmids to verify the role of IRS1 in vivo. Compared with the oe-NC+oe-NC group, transfection with oe-IRS1 increased the size and weight of OSCC xenograft tumors. Transfection with oe-FTO resulted in limited tumor growth compared to the oe-NC+oe-IRS1 group (Fig. 6A–C). Compared to the oe-NC+oe-NC group, oe-IRS1 increased the expression of IRS1 and Ki67. In contrast to the oe-NC+oe-IRS1 group, oe-FTO inhibited the expression of IRS1 and Ki67 (Fig. 6D and Supplementary Fig. 1C). In addition, the oe-NC+oe-IRS1 group showed decreased p53 expression and increased Line-1 ORF1p expression. Compared to the oe-NC+oe-IRS1 group, the oe-IRS1+oe-FTO group had increased p53 levels and decreased Line-1 ORF1p levels (Fig. 6E). Compared with the oe-NC+oe-NC group, oe-IRS1 inhibited the expression of Claudin-1 and ZO-1 and promoted the expression of Vimentin, Snail1, and Snail2. However, oe-FTO treatment reversed the expression of these proteins compared to the oe-IRS1+oe-NC group (Fig. 6F). These results indicated that IRS1 demethylation inhibited the xenograft tumor growth, at least in part, through the p53/Line-1 pathway.
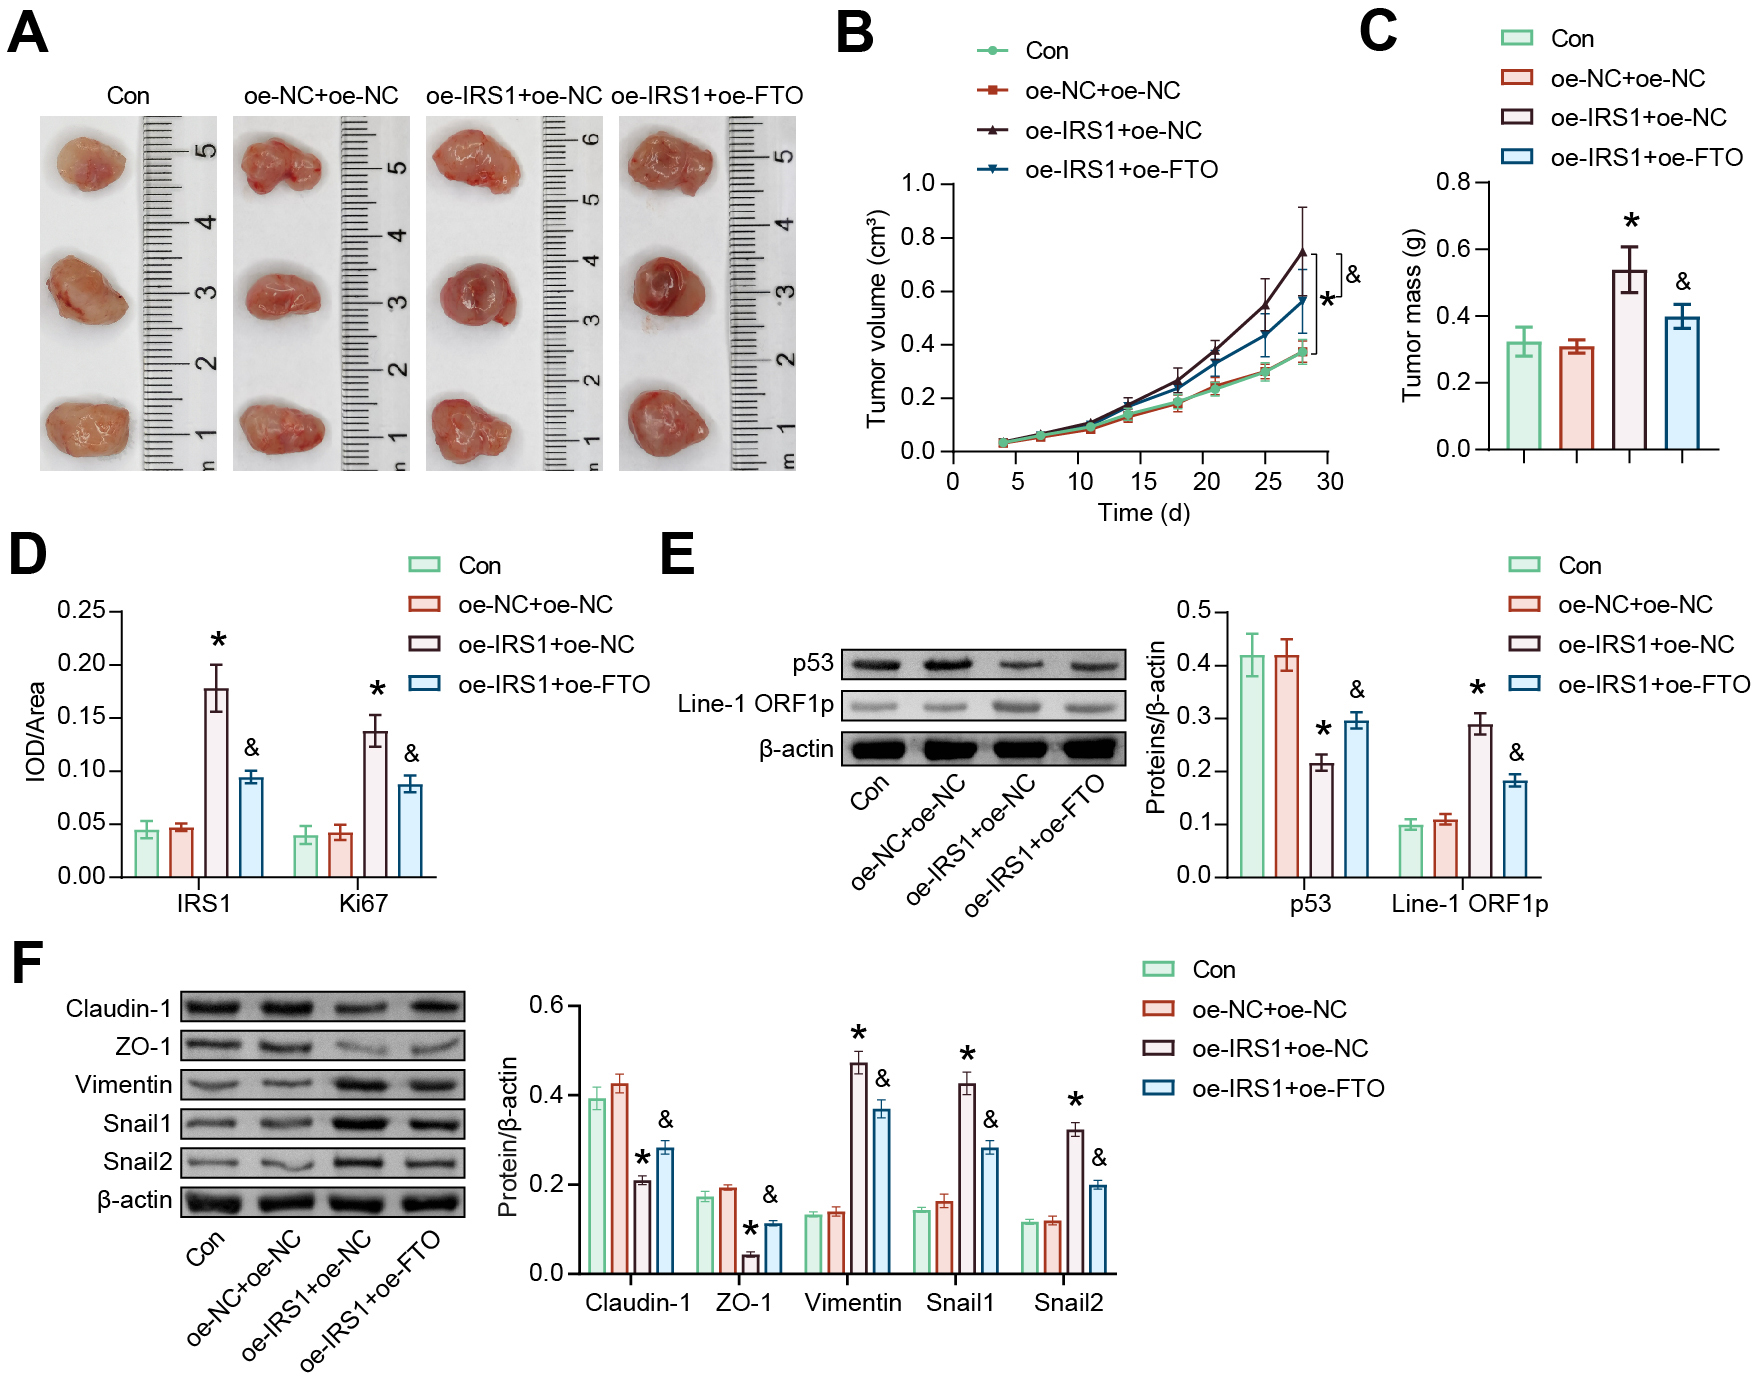 Fig. 6.
m6A methylation-mediated IRS1 regulates OSCC tumor growth. (A)
Representative tumor images. (B) Tumor growth was recorded during modeling. (C)
Tumors in each group were weighed on day 28. (D) Immunohistochemistry (IHC) was performed to determine
the expression of IRS1 and Ki67 in tumors. (E) Protein abundance of p53 and
Line-1 ORF1p in tumors. (F) Protein levels of Claudin-1, ZO-1, Vimentin, Snail,
and Snail2 in tumors. *p
EMT describes the process by which epithelial cells lose their cell acuity and
cell-cell adhesion and transform into dynamic mesenchymal cells. They are
critical for embryonic development and wound healing [32]. EMT also supports
primary tumor formation and metastasis. Patients with OSCC suffer from high
recurrence and mortality due to cancer cell invasion and metastasis [33]. In this
study, EMT-related differentially expressed genes were screened from the OSCC
samples, and IRS1 was identified as a potential target for OSCC treatment. IRS1
is involved in the Wnt-mediated EMT process and affects the progression of lung
adenocarcinoma cells [34]. Inhibition of IRS1 activates ERK2, which controls the
metastasis of breast cancer cells [26]. The data in this study showed that IRS1
expression was increased in OSCC clinical samples and OSCC cells (SCC-25, SCC-9,
CAL-27). IRS1 silencing reduced proliferation and colony formation and promoted
apoptosis in SCC-25 and CAL-27 cells. IRS1 overexpression promoted the xenograft
tumor growth. The EMT program is executed by a group of EMT-activated
transcription factors (EMT-TFs), including Snail1 and Snail2/Slug [35]. These
EMT-TFs repress epithelial markers such as E-cadherin, ZO-1, and Claudin-1 by
binding to E-box sequences. These transcription factors stimulate the
accumulation of mesenchymal markers, including Vimentin, FN, and N-cadherin. In
this study, it was observed that IRS1 silencing suppressed the expression of
Snail1, Snail2, Vimentin, and
m6A is essential for the various stages of mRNA metabolism and is regulated by m6A methyltransferases, demethylases, and readers. The m6A modification is involved in proliferation, invasion and metastasis of various tumors [36]. Therefore, the EMT process of OSCC from the perspective of m6A modification was investigated to provide experimental evidence for OSCC treatment. The role of m6A modification in OSCC has been gradually elucidated. METTL14, as the core molecules of the methyltransferase complex, has an effect on the stability of gene mRNA for specific biological processes in an m6A-dependent manner [37, 38]. METTL14 was upregulated in OSCC tissues and cells. It promotes OSCC cell proliferation by inducing the m6A modification of MALAT1 [39]. FTO, which is a demethylase, has high levels in OSCC. Low levels of FTO increase autophagic flux and inhibit OSCC cell proliferation and tumor growth [40, 41]. In this study, low levels of METTL14 restricted IRS1 expression and reduced m6A modification of IRS1 in SCC-25 and CAL-27 cells. METTL14 overexpression had the opposite effect. FTO overexpression downregulated IRS1 expression in SCC-25 and CAL-27 cells. FTO overexpression in xenograft model reversed the tumor growth-promoting effect of IRS1 and protected mice from OSCC. METTL14 and FTO had identified the dynamic and reversible regulation of IRS1 m6A modification. m6A modification also regulates the nuclear export of mRNA [42]. YTHDC1 is the only nuclear-localized m6A-binding protein that affects the RNA function [43]. In this study, YTHDC1 knockdown was found to inhibit the nuclear export of IRS1 in SCC-25 and CAL-27 cells. YTHDC1 knockdown also resulted in decreased IRS1 mRNA levels, indicating that nuclear retention of IRS1 decreased IRS1 mRNA expression. These results suggested that METTL14/FTO/YTHDC1 regulated the IRS1 m6A modification in OSCC cells and determined OSCC cell fate.
IRS1 silencing promoted p53 expression and inhibited Line-1 ORF1p expression in OSCC. Studies have shown that p53 is critical for tumor cell metastasis [44]. The p53 has a conserved binding site in the Line-1 element, and p53 and Line-1 are antagonistic to each other [45]. In the present study, p53 inhibition reversed the mesenchymal-epithelial transition induced by IRS1 silencing in SCC-25 and CAL-27 cells. These results demonstrated that IRS1 induced tumor metastasis through the p53/Line-1 pathway. Furthermore, it was observed that FTO overexpression reversed the regulation of p53/Line-1 by IRS1 in xenograft model. It was suggested that low m6A modification of IRS1 activated the p53/Line-1 pathway. The main function of m6A is to control retrotransposons, such as Line-1, to control genome stability. m6A acts directly on Line-1 and affects the expression and function of Line-1 RNA [46]. Recent reports highlight the methylation status of Line-1 as a target for cancer diagnosis/prognosis [47]. The evidence suggests that Line-1 can be used to indicate the prognosis of OSCC, and the abnormal methylation status of Line-1 is closely associated with TP53 mutations and leads to changes in OSCC gene expression [48]. However, further studies would explore the exact relationship between m6A methylation-IRS1-p53/Line-1-OSCC. More clinical samples need to be collected to explore the comprehensive role of IRS1. Field cancerization in the oral cavity is a significant factor contributing to the development of second primary tumors and recurrence [49]. Advanced OSCC often indicates extensive field cancerization [50]. However, it remains to be determined in future research whether genetic and epigenetic alterations are present in histologically normal appearing paracancerous tissue.
For the first time, this study demonstrates the role of m6A modification in the EMT process of OSCC mediated by the METTL14/FTO/IRS1 axis. The role of m6A modification of IRS1 mRNA in OSCC development is also demonstrated. METTL14/FTO/YTHDC1 mediates IRS1 m6A modification and increases IRS1 mRNA stability, which promotes proliferation and metastasis of OSCC cells. This process is mediated, at least in part, through the p53/Line-1 signaling pathway. These findings broaden the understanding of m6A modifications in OSCC pathogenesis and help to identify novel diagnostic/therapeutic targets.
All data included in this study are available upon request by contact with the first author or corresponding author.
YX and JT designed the research study. YX, XZ, QL, ZW, QZ, XL performed the research. JT provided help and advice on Bioinformatics analysis. YX, XZ analyzed the data. YX wrote the manuscript. All authors contributed to editorial changes in the manuscript. All authors read and approved the final manuscript. All authors have participated sufficiently in the work and agreed to be accountable for all aspects of the work.
All animal experiments were carried out in accordance with the Guidelines laid down by the National Institute of Health (NIH) in the USA regarding the care and use of animals for experimental procedures and in accordance with local laws and regulations. It was approved by the First Affiliated Hospital of Hunan University of Chinese Medicine (HN-LL-GZR-2022-34). Experiments involved with human samples were approved by the First Affiliated Hospital of Hunan University of Chinese Medicine (HN-LL-KY-2021-072). It was established, according to the ethical guidelines of the Helsinki Declaration and written informed consent was obtained from individual or guardian participants.
Not applicable.
The work was funded by National Natural Science Foundation of China (82374530), 2022 “Disciplinary Reveal System” project of Hunan University of Chinese Medicine (22JBZ046), Scientific Research Project of Hunan Provincial Education Department (21B0398) and the Natural Science Foundation of Hunan Province, China (2021JJ70109).
The authors declare no conflict of interest.
References
Publisher’s Note: IMR Press stays neutral with regard to jurisdictional claims in published maps and institutional affiliations.