


 , Elena I. Dyachenko 1
1 Biochemistry Research Laboratory, Omsk State Pedagogical University, 644099 Omsk, Russia
Abstract
Saliva is a promising biological fluid for the diagnosis and monitoring of diseases, including breast cancer. To study the composition of saliva, a complex of “omics” technologies is used: genomics, transcriptomics, proteomics, metabolomics and microbiomics. In this review, we systematized all known “omics” in their application to saliva analysis in breast cancer in order to understand how complete the picture is provided by the combination of different areas of research and to identify missing links. It has been shown that studies of saliva in breast cancer are chaotic and unsystematic. Inconsistency of sample sizes and high heterogeneity of breast cancer were identified. The main tasks that need to be solved for the complete and harmonious development of salivaomics in a new direction—“salivaonkoomics” are formulated. Thus, it is necessary to systematize and unify the study of biomarkers within each area of “omics”, including sample size and its homogeneity, a list of methods and approaches, a list of biomarkers, reproducibility of results, and the ability to transfer results to other samples. It is important to expand the number of components of “omics” by adding new methods (for example, spectralomics, etc.), as well as studying the relationships between different “omics” technologies (interactomics). All this together will allow the study of saliva not only in breast cancer but also in many other pathologies to a qualitatively new level.
Keywords
- saliva
- biomarkers
- breast cancer
- salivaomics
- salivaoncoomics
- diagnosis
- prognosis
Saliva is a complex biologically active fluid containing secreted hormones, enzymes, metabolites, cytokines, and antibodies that act as mediators of the functions of saliva [1]. The anatomical proximity of blood vessels to the salivary glands allows saliva to be considered an informative source for displaying changes occurring throughout the body due to the fact that metabolites are exchanged between the circulatory system and saliva. In recent decades, it has been discovered that saliva can be used for medical purposes [2, 3]. Saliva is a promising tool for diagnosing and monitoring diseases [4, 5], as well as for determining treatment strategies [6]. Saliva has great potential for diagnosing a wide range of diseases, including cancer [7, 8, 9].
One of the key advantages of saliva diagnostics in detecting cancer is its non-invasiveness, as saliva collection is a simple and painless process that does not require any special equipment or experience. Saliva collection can be easily performed in a clinical setting or even at home, making it convenient for patients [10]. Saliva diagnosis also offers the advantage of early detection [11]. Saliva-based tests can detect cancer at an earlier stage when it may be more treatable, potentially saving lives and reducing the need for aggressive treatment options [12].
According to GLOBOCAN 2020, the most common form of oncology among the female population is breast cancer (24.5% of all malignant tumors), and mortality from this pathology continues to remain in the first place (15.5% of deaths from malignant tumors) [13, 14]. Breast cancer is a heterogeneous disease and combines five molecular biological subtypes depending on the expression of Human epidermal growth factor receptor 2 (HER2), estrogen (ER), and progesterone (PR) receptors and the Ki-67 proliferative activity index, namely: luminal A (HER2–, ER+, PR+, Ki-67 low), luminal B HER2-negative (HER2–, ER+, PR+, Ki-67 high), luminal B HER2-positive (HER2+, ER+, PR+), non-luminal (HER2+, ER–, PR–) and triple-negative cancer (HER2–, ER–, PR–). Due to the high prevalence of breast cancer, it remains relevant to search for biomarkers that can indicate the presence of a breast tumor at an early stage, preferably even before the lesion becomes visible on a mammogram [15]. This is especially true for young women, for whom mammography screening is less effective due to lower sensitivity (25 to 59%) [16, 17].
Salivary biomarkers in breast cancer have been assessed in several studies [18, 19]. Lau and Wong [20] suggested a common embryonic origin of salivary and mammary gland tissue, which may explain the origin of salivary biomarkers in breast cancer. The authors suggest that biomarker production in breast tissue is similar to biomarker production in the salivary gland, and therefore, common biomarkers are observed and detected in malignancies of both tissues [20]. In addition, from an immunohistological point of view, there are several similarities between mammary and salivary gland tissues [21, 22]. Both tissues have HER2/neu receptors on their epithelial cells, which are overexpressed in malignant cases. In addition, epithelial cells of both the mammary gland and salivary gland tissues have receptors for estrogen, progesterone, and androgens, the overexpression of which is observed in patients with breast cancer [23].
Currently, a new direction of saliva research has emerged – salivaomics, which can be defined as an integrative study of saliva, its components, and functions using “omics” technologies [24]. Traditionally, salivaomics includes the study of several components: genome, transcriptome, proteome, metabolome, and microbiome. In this review, we systematized all known “omics” in their application to saliva analysis in breast cancer in order to understand how complete the picture is provided by the combination of different areas of research and to identify missing links.
Genomics studies the biochemical characteristics of DNA, genes, and their methylation modifications. The salivary genome and epigenome can be analyzed using a diverse array of biomolecular techniques, including array methylation, polymerase chain reaction (PCR), and quantitative PCR-based genotyping (qPCR) [25]. Recently, a new approach has attracted special attention in the field of oncology, namely liquid biopsy in the diagnosis and monitoring of cancer. The advantage of this approach is that it is non-invasive and easy to use. The essence of liquid biopsy is the isolation and study of circulating tumor cells, circulating tumor DNA, tumor extracellular vesicles, etc. [26, 27].
Saliva contains extracellular DNA, with 70% coming from the host and 30% from the oral microbiota [28]. The stability of salivary DNA has been confirmed and its relatively high quality has been demonstrated [29], making salivary DNA a useful target for biomarker development [4].
Saliva is comparable to blood in DNA quality, although overall DNA yield from saliva was lower (0.2–52 µg) than from blood (58–577 µg). It is a non-invasive collection method that allows large-scale genetic testing for breast cancer screening [30]. Poehls et al. [30] confirmed identical BRCA1 and BRCA2 mutations in DNA from saliva and blood from the same individual in 67 women using Oragene DNA [31]. It was shown that salivary DNA was sufficient for mutation detection and high-throughput genotyping. The choice of saliva over blood for genotyping based on the survey results was due precisely to the non-invasive nature of collecting biomaterial [31].
Meghnani et al. [32] also confirmed the usefulness of saliva for identifying germline mutations in the BRCA1/2 genes using next-generation sequencing (NGS). The authors showed that sequencing performance was comparable for saliva and blood, with an average agreement of 98%.
Another study proposed the NGS-based Breast cancer gene (BRCA) plus test to detect mutations in six high-risk genes (BRCA1, BRCA2, PTEN, TP53, CDH1, and STK11), which is based on a customized PCR-based targeted enrichment design and bioinformatics pipeline coupled with comparative genomic hybridization (aCGH) [33].
Transcriptomics is the study of RNAs, including coding messenger RNAs (mRNAs) and non-coding RNAs such as microRNAs (miRNAs) and long non-coding RNAs (lncRNAs). Biologically, microRNAs have been identified in twelve body fluids, including saliva [34]. Many sources of circulating microRNA, including tumor cells, immune cells, and blood cells [35], can ensure its presence in the circulatory system in various forms, in particular, packaged in microvesicles or exosomes, in association with protein complexes, etc. [36].
The main method for identifying salivary transcriptomic biomarkers is microarray technology, which can be validated using microarray profiling and RNA sequencing [37]. Wong [38] discovered the presence and utility of salivary mRNA for breast cancer detection [38, 39, 40]. Studies have also been conducted to evaluate salivary miRNAs as potential biomarkers for breast cancer detection [41]. We summarized the results of the main studies of mRNA and miRNA in saliva (Table 1, Ref. [42, 43, 44, 45]). Thus, only four studies provide results on the use of mRNA in the diagnosis of breast cancer [42, 43, 44, 45].
| № | Author, year | Study groups | RNA | Accuracy |
| 1 | Zhang L. et al., 2010 [42] | BC – 30, HC – 63 | CSTA |
Sensitivity – 83% |
| Specificity – 97% | ||||
| 2 | Bentata M. et al., 2020 [43] | BC – 31, HC – 36 | HNRNPA2B1 |
NA |
| 3 | Koopaie M. et al., 2021 [44] | BC – 41, HC – 39 | miRNA-21 |
Sensitivity – 100% |
| Specificity – 100% | ||||
| 4 | Koopaie M. et al., 2022 [45] | BC – 43, HC – 43 | KCNJ3 |
Sensitivity – 76.7% |
| Specificity – 94.6% |
Note. BC, breast cancer; HC, healthy control;
Zhang et al. [42] identified eight mRNAs in saliva using quantitative reverse transcription-polymerase chain reaction (RT-qPCR). According to this study, eight mRNAs have acceptable potential for the diagnosis of breast cancer with a sensitivity of 83% and specificity of 97%.
Bentata et al. [43] conducted the detection of salivary extracellular RNA. RNA was sequenced from the saliva of ten women, and 1254 transcripts were enriched for genes with pre-mRNA alternative splicing annotation. The level of splicing factors was found to be unique for each woman but similar for the same woman at different time points. The authors showed that the combination of mRNA levels of seven splicing factors differed between breast cancer patients and healthy controls (p = 0.005).
Koopaie et al. [44] showed that the expression level of salivary miR-21 was significantly increased in breast cancer. The high diagnostic value of this biomarker is confirmed by 100% sensitivity and 100% specificity, according to the Receiver operating characteristic (ROC) analysis. The mitogen-activated protein kinase (MAPK) signaling pathway has been proposed as a potential pathway involved in the development of breast cancer. The same authors were the first to evaluate the level of Potassium inwardly rectifying channel subfamily J member 3 (KCNJ3) mRNA expression in the saliva of breast cancer patients compared to healthy controls [45]. The results showed a significant increase in KCNJ3 mRNA expression in saliva samples from breast cancer patients compared to healthy controls. Due to the relatively high sensitivity (76.70%), patients can be easily identified as healthy individuals, and the high specificity (94.59%) minimizes false-positive results.
It is known that human saliva contains a large number of different proteins that perform various biological functions [46]. The method for studying protein profiles is called proteomics. A total of 2340 proteins have been identified in saliva [47].
The main studies on proteomic biomarkers of breast cancer in saliva are systematized in Table 2 (Ref. [23, 42, 48, 49, 50, 51, 52, 53, 54, 55, 56, 57, 58, 59, 60, 61, 62]).
| № | Author, year | Study groups | Proteins | Accuracy |
| 1 | Jenzano et al., 1986 [48] | BC – 7, HC – 16 | Kallikrein |
NA |
| 2 | Navarro et al., 1997 [49] | BC – 74, HC – 33 | Epidermal growth factor (EGF) |
NA |
| 3 | Streckfus et al., 2000 [50] | BC – 12, BBL – 8, HC – 15 | CA15-3 |
NA |
| 4 | Streckfus et al., 2000 [51] | BC – 30, BBL – 41, HC – 57 | c-erbB-2 |
Sensitivity – 87% |
| Specificity – 65% | ||||
| 5 | Brooks et al., 2008 [52] | BC – 49, HC – 49 | VEGF |
AUC (VEGF) = 0.80 |
| AUC (EGF) = 0.77 | ||||
| AUC (CEA) = 0.65 | ||||
| AUC (VEGF+EGF) = 0.84 | ||||
| 6 | Streckfus et al., 2009 [53] | BC – 20, HC – 10 | 174 proteins | NA |
| 7 | Zhang et al., 2010 [42] | BC – 30, HC – 63 | Carbonic anhydrase VI (CA6) |
NA |
| 8 | Arif et al., 2015 [54] | NA | ATP6AP1 |
NA |
| 9 | Wood and Streckfus, 2015 [55] | BC – 16, HC – 16 | Lung resistance protein (LRP): 110 kDa |
110 kDa: sensitivity – 75%, specificity – 63%; 85 kDa: sensitivity – 94%, specificity – 89%; 75 kDa: sensitivity – 88%, specificity – 95%. |
| 10 | Streckfus and Bigler, 2016 [23] | BC – 70, HC – 10 | 142 up-regulated and 91 down-regulated proteins | NA |
| 11 | Laidi et al., 2016 [56] | BC – 29, HC – 31 | IgG anti-HER2 |
NA |
| 12 | Giri et al., 2019 [57] | BC – 24, HC – 20 | coronin‐1A |
NA |
| 13 | Farahani et al., 2020 [58] | BC – 30, HC – 30 | CA15-3 |
AUC (CA15-3) = 0.828 (0.762–0.910) |
| AUC (CEA) = 0.644 (0.636–0.801) | ||||
| AUC (estradiol) = 0.868 (0.739–0.927) | ||||
| AUC (vaspin) = 0.655 (0.623–0.803) | ||||
| AUC (obestatin) = 0.755 (0.732–0.817) | ||||
| 14 | López-Jornet et al., 2021 [59] | BC – 91, HC – 60 | СА125 |
AUC (CA125) = 0.686 (0.566–0.806) |
| AUC (sFas) = 0.676 (0.553–0.800) | ||||
| 15 | Giri et al., 2022 [60] | BC – 20, HC –20 | lipocalin-1 |
Sensitivity – 80% |
| 5 peptides (GLST |
Specificity – 95% | |||
| 16 | Bel’skaya et al., 2023 [61] | BC – 48, BBL – 40, HC – 32 | CA15-3 |
NA |
| 17 | Sinha et al., 2023 [62] | BC – 15, BBL – 13, HC – 60 | 591 proteins | NA |
| ANXA1 |
Note. BC, breast cancer; HC, healthy control;
Jenzano et al. [48] found increased salivary kallikrein concentrations in patients with breast and gastrointestinal cancer compared to healthy controls.
Salivary epidermal growth factor (EGF) concentrations were higher in patients
with active breast cancer (p = 0.0003) and breast cancer patients during
follow-up (p = 0.07) than in healthy women. The highest salivary EGF
values were among the subgroups with local recurrence [49]. No correlation was
found between plasma and salivary EGF values. Pink et al. [63] found
elevated levels of tumor marker carbohydrate antigen 15-3 (CA15-3) and epidermal
growth factor receptor (EGFR) in the saliva of breast cancer patients. Assad
et al. [64] showed a moderate association between serum and salivary
CA15-3 in breast cancer patients (r = 0.56; p
Some proteins in the saliva of cancer patients are more informative for detecting breast cancer, for example, the salivary protein c-erbB-2 [65, 66]. Sensitivity and specificity were 87% and 65%, respectively, with a cut-off point of 100 U/mL [65]. The presence of c-erbB-2 in saliva can be explained by several hypothetical mechanisms [65]. First, it is likely that c-erbB-2 enters saliva from serum through cell membranes via passive diffusion. Secondly, active transport is possible. The authors suggested that c-erbB-2 may be secreted into saliva due to a localized regulatory function in the oral cavity [67]. Thus, in breast cancer, there is an excess of protein resulting from the rapid growth of a malignant neoplasm, which, in turn, causes a humoral reaction in the salivary glands, increasing the concentration of c-erbB-2 in saliva.
Cui et al. [68] found that the levels of vascular endothelial growth factor (VEGF), epidermal growth factor (EGF), and carcinoembryonic antigen (CEA) in the saliva of breast cancer patients were significantly increased. Research studies have assessed the potential use of salivary proteins such as c-erbB-2, VEGF, EGF, and CEA in the initial detection and/or subsequent screening of recurrent breast cancer [52, 66, 69]. VEGF and EGF are two salivary biomarkers that have been shown by Enzyme-linked immunosorbent assay (ELISA) to have the highest sensitivity and selectivity among multiple biomarkers [52].
Increased levels of CA15-3 and c-erB-2 in saliva were also found, which were
positively correlated with the serum of breast cancer patients [70]. Liang
et al. [71] proposed a novel surface plasmon resonance (SPR) system to
directly measure CA15-3 in human saliva. Wan et al. [72] developed
commercially available disposable strips, similar to commonly used glucose
detection strips, to detect breast cancer using biomarkers HER2 and CA15-3. The
detection limits of these two biomarkers are as low as 1 fg/mL,
which is much lower than that of conventional enzyme immunoassays in the range of
1
More recently, it has been proposed that salivary HER2 levels be used to detect
HER2 types of breast cancer [73]. However, de Abreu Pereira et al. [74]
found significant variations in HER2 levels; for example, in the control group,
two patients had much higher amounts of HER2 in saliva than in the HER2-positive
group. After three years of follow-up, neither of these two subjects showed
evidence of breast cancer. Laidi et al. [56, 75] also showed no
significant difference in clinical characteristics depending on the positive and
negative HER2 status (p
Laidi et al. [56, 75] found that autoantibodies against epidermal growth factor receptor 2 (HER2) and human mucin-1 (MUC1) could be a useful screening tool for breast cancer [76]. Autoantibodies against HER2, MUC1, and ATP6AP1 have also been detected in the saliva of patients with breast cancer [54, 56]. Antibodies to ATP6AP1 enter the saliva from the blood [77] since most of the IgG immunoglobulins in saliva are released from the serum mainly through the gingival crevices, and only some are produced locally [78]. It has been shown that ATP6AP1 may contribute to the early detection of breast cancer [54].
López-Jornet et al. [59] suggested that CA125 could be a potential salivary diagnostic biomarker with acceptable sensitivity and specificity. The mean salivary CA125 concentration was 102.1 pg/mL in the control group and 267.6 pg/mL in the breast cancer group (p = 0.005). The concentration of soluble Fas (sFas), in turn, was 84.1 pg/mL and 145.9 pg/mL, respectively (p = 0.008).
Wood and Streckfus [55] analyzed lung resistance protein (LRP) concentrations in the saliva of patients with stage I breast cancer. The results showed that the patients’ saliva had significantly higher levels of LRP compared to healthy controls.
Farahani et al. [58] showed that salivary concentrations of estradiol
and obestatin were significantly higher in breast cancer patients than in healthy
women (p
Streckfus et al. [53] analyzed three pooled (n = 10 subjects/pooled
sample) stimulated saliva samples, including healthy controls, stage IIa breast
cancer (T
Zhang et al. [42] identified 10 proteins with increased levels of expression and four proteins with decreased levels of expression. Carbonic anhydrase VI (CA6) and psoriasin levels between cancer and control samples showed significant differences. However, only for CA6 were the differences significant when independently verified by protein immunoblotting.
Sinha et al. [62] identified 591 and 371 proteins in saliva and serum samples from the same individuals, respectively. The authors identified several salivary proteins associated with breast cancer that have not previously been reported in the literature (Table 2). These proteins can subsequently be used for early detection of breast cancer [62].
Giri et al. [57] quantified the dysregulation of salivary proteins, namely coronin-1A, cofilin, and translation-controlled tumor protein (TPT-1), associated with organotropism in mixed subtypes of breast cancer. Three proteins have been confidently identified: lipocalin-1, plastin-2, and SMR-3B, which can be used as potential markers of triple-negative breast cancer (TNBC) [60]. A panel of five peptide signatures with salivary Peptides GLSTESILIPR (GLST), VYALPEDLVEVNPK (VYAL), MINLSVPDTIDER (MINL), GPYPPGPLAPPQPFGPGFVPPPPPPPYGPGR (GPYP), and IPPPPPAPYGPGIF PPPPPQP (IPPP) performed best in differentiating aggressive TNBC from healthy controls with a sensitivity of 80% and specificity of 95% [60].
In the field of biomedical applications, integration of the field of vibrational spectroscopic analysis with bioinformatics analysis has been recognized as the key to realizing its true potential [79]. This direction is called Spectralomics [80]. Summarized data for the application of Spectralomics to saliva are given in Table 3 (Ref. [81, 82, 83, 84, 85]).
| № | Author, year | Study groups | Absorbtion Bands | Accuracy |
| 1 | Feng et al., 2015 [81] | BC – 31, BBL – 33, HC – 33 | Purified saliva proteins: 621 cm |
AUC (BC vs HC) = 0.975 |
| AUC (BBL vs HC) = 0.972 | ||||
| AUC (BC vs BBL) = 0.852 | ||||
| 2 | Bel’skaya et al., 2019 [82] | BC – 50, HC – 58 | 1640/1535 cm |
NA |
| 3 | Ferreira et al., 2020 [83] | BC – 10, BBL – 10, HC – 10 | 1041 cm |
Sensitivity – 90% |
| Specificity – 80% | ||||
| 4 | Bel’skaya et al., 2021 [84] | BC – 30, BBL – 47, HC – 42 | 1458/1396 cm |
NA |
| 5 | Githaiga et al., 2021 [85] | BC – 20, HC – 23 | 612 |
Sensitivity – 73.00 |
| Specificity – 97.50 |
Note. BC, breast cancer; BBL, breast benign lesion; HC, healthy control;
Feng et al. [81] used surface-enhanced Raman spectroscopy (SERS) after membrane pre-purification of salivary proteins to detect benign and malignant breast tumors. It has been shown that both pathologies lead to several specific biomolecular changes in salivary proteins (Table 3). Using multiclass discriminant partial least squares analysis to classify the SERS spectra of salivary proteins, the diagnostic sensitivity and specificity were found to be 75.75% and 93.75% in differentiating healthy controls and breast cancer patients, respectively.
Bel’skaya et al. [82] compared the FTIR spectra of saliva from 50
patients with breast cancer and 58 healthy volunteers. It is shown that the
intensity of absorption bands 613–615, 860, 925–935, 960–970, 1070–1080,
1120–1130, 1155–1165, 1240, 1310, 1460, 1640, 1735, 2060, 3266 and 3280
cm
Ferreira et al. [83] found that in breast cancer patients, in contrast
to the benign tumor group and the control group, the intensity of the absorption
band at 1041 cm
Another group of scientists, Githaiga et al. [85] discovered ten
spectral regions in the raman spectra of saliva (Table 3). When comparing breast
cancer patients with a control group, the accuracy of the method was 93.66
The metabolome is the complete set of small-molecule metabolites of living
tissues, including metabolic intermediates such as carbohydrates, lipids, amino
acids, nucleic acids, hormones, and other signaling molecules [2]. The total
protein content in saliva was 0.14
| № | Author, year | Study groups | Metabolites | Accuracy |
| 1 | Sugimoto et al., 2010 [87] | BC – 30, HC – 87 | 215 metabolites | AUC = 0.973 |
| 173.0285 m/z (C |
||||
| 2 | Oztürk et al., 2011 [88] | BC – 15, HC – 10 | Total sialic acid (TSA) |
NA |
| 3 | Tsutsui et al., 2013 [89] | BC – 30 (primary – 8, relapse – 22), HC – 14 | Primary BC: Ac-PUT |
NA |
| Relapse BC: Ac-SPM |
||||
| 4 | Cheng et al., 2015 [90] | BC – 27, HC – 28 | Leu |
AUC = 0.916 (0.834–0.998) |
| SFAA index: Proline, Threonine, Histidine | ||||
| 5 | Gornitsky et al., 2016 [91] | BC – 134, HC – 226 | 8-oxo-7-hydrodeoxyguanosine |
NA |
| 6 | Takayama et al., 2016 [92] | BC – 191 (before operation – 111, after operation – 80), HC – 61 | Before operation: SPM |
R2 = 0.88 (BC vs. HC) |
| AUC = 0.858 (0.804–0.912) (Before vs. After operation) | ||||
| After operation: N8-Ac-SPD | ||||
| 7 | Zhong et al., 2016 [93] | BC – 30, HC – 25 | Glycerol phospholipids (LysoPC (18:2) |
AUC (MG (0:0/14:0/0:0)) = 0.929 (0.844–1.000) |
| 8 | Bel’skaya and Sarf, 2018 [94] | BC – 21, BBL – 29, HC – 26 | Oxalic acid |
NA |
| 9 | Cavaco et al., 2018 [95] | Portuguese dataset (BC – 36, HC – 16), Indian dataset (BC – 30, HC – 24) | Portuguese dataset: 3-methyl-pentanoic acid |
Portuguese dataset: R2 = 0.833 |
| Indian dataset: R2 = 0.876 | ||||
| Indian dataset: acetic |
||||
| 10 | Liu et al., 2018 [96] | BC – 128, BBL – 65, HC – 66 | BC vs. HC: DBA ( |
AUC (BC vs. HC) = 0.755 |
| AUC (BC vs. BBL) = 0.802 | ||||
| BC vs. BBL: UEA-I |
||||
| 11 | Streckfus et al., 2018 [97] | BC – 36, HC – 20 | IL-1 |
NA |
| 12 | Hernández-Arteaga et al., 2019 [98] | BC – 35, HC – 129 | Sialic Acid |
Sensitivity – 80% |
| Specificity – 93% | ||||
| 13 | Murata et al., 2019 [99] | ВС – 101, DCIS – 23, НС – 42 | Spermine |
AUC = 0.919 (0.838–0.961) |
| 14 | Sawczuk et al., 2019 [100] | ВС – 29 (9 |
Advanced oxidation protein products (AOPP) |
NA |
| 15 | Xavier Assad et al., 2020 [101] | BC – 23, HC – 35 | Glycerophospholipids: PG14:2 |
AUC (PG14:2) = 0.7329 (0.5962–0.8697) |
| AUC (H-Phe-Phe-Gln-Trp-OH) = 0.7478 (0.6113–0.8844) | ||||
| Oligopeptides: H-Phe-Phe-Gln-Trp-OH | ||||
| 16 | Yang et al., 2020 [102] | BC – 128, BBL – 65, HC – 66 | N/O-glycan profiles of their salivary glycoproteins isolated by the Bandeiraea simplicifolia lectin I (BS-I)-magnetic particle conjugates | NA |
| 17 | Bel’skaya et al., 2021 [103] | BC – 43, BBL – 32, HC – 39 | Arginase/NO |
Sensitivity – 81.1% |
| Specificity – 81.0% | ||||
| 18 | Ragusa et al., 2021 [104] | BC – 38, HC – 34 | Fucose |
AUC = 0.98 (0.91–1.00) |
| 19 | Yang et al., 2021 [105] | BC + BBL – 75, HC – 66 | 3 N-glycans peaks (m/z 2459.8799, 2507.9139, 2954.0547), 2 N-glycans peaks (m/z 1957.7265, 2794.0427), 2 N-glycans peaks (m/z 1866.6608, 2240.8056) recognized by PHA-E+L that existed only in BB, BC-I, and BC-II, respectively | NA |
| 20 | Bel’skaya et al., 2022 [106] | BC – 75, BBL – 87, HC – 20 | Copper |
NA |
| 21 | Bel’skaya et al., 2022 [107] | BC – 487, HC – 298 | Protein |
Sensitivity – 84.5% |
| Specificity – 75.0% | ||||
| 22 | Bel’skaya and Sarf, 2022 [108] | BC – 355 | Alkaline phosphatase (ALP) |
NA |
| (DC) |
||||
| 23 | Bel’skaya et al., 2022 [109] | BC – 113, HC – 111 | TNF- |
NA |
| 24 | Swaathi R. et al., 2023 [110] | BC – 32, HC – 8 | Total Antioxidant Capacity |
NA |
Note. BC, breast cancer; AUC, Area Under the Curve; Ac-PUT, N1-acetylated putrescine; Ac-SPD, N1-acetylated spermidine; Ac-SPM, N1-acetylated spermine; DAc-SPD, N,N-diacetyl- spermidine; DAc-SPM, N,N-diacety-spermine; SFAA, S fimbrial protein subunit A; N1-Ac-SPD, N1-Acetylspermidine; CAD, Cadaverine; PUT, Putrescine; LysoPC, Lysophosphatidylcholine; PS, Phosphatidylserine; LysoPE, 2-linoleoyl-sn-glycero-3-phosphoethanolamine; MG, Monoradylglycerols; DBA, Dolichos biflorus agglutinin; PNA, Peanut agglutinin; PHA-E + L, Phaseolus vulgaris erythroagglutinating-4 and leukoagglutinating-4 lectins; UEA-I, Ulex europaeus agglutinin I; BPL, Bauhinia purpurea lectin; MAL-I, Maackia amurensis lectin I; ECA, Erythrinacristagalli; BS-I, Bandeiraeasimplicifolia; EGF, Epidermal growth factor; DCIS, Ductal carcinoma in situ; DHAP, Dihydroxyacetone phosphate; GABA, γ-Aminobutyric acid; PG14, Phosphoglyceride 14; PA32, Phosphatidic acid 32; PS28, Phosphoserine 28; PI31, Proteasomal Inhibitor of 31kD; BRCA1, Breast cancer gene 1; NO, Nitric oxide; BB, breast benign; BBL, breast benign lesion; HC, healthy control;
Salivary metabolites play an increasingly important role in the discovery of salivary biomarkers in breast cancer diagnosis and can guide future research [111].
Tsutsui et al. [89] identified 11 polyamines, including their N-acetylated forms, in the saliva of patients with primary and recurrent breast cancer and healthy controls. Levels of several polyamines have been shown to be increased in breast cancer patients; levels of three polyamines were significantly higher only in relapsed patients (Table 4). According to Takayama et al. [92], concentrations of a number of polyamines were higher in cancer patients than in healthy people. However, in healthy controls, Ornithine (ORN) and Putrescine (PUT) concentrations were high. Among the identified 12 polyamines, several polyamines (i.e., CAD, SPM, SPD, Ac-SPM, N1-Ac-SPD, and N8-Ac-SPD) had strong effects on the disease. The authors proposed a simple equation of one order, based on which more than 80% of patients were diagnosed with breast cancer. In addition, the risk of cancer recurrence can be estimated using the ratio N8-Ac-SPD/(N1-Ac-SPD + N8-Ac-SPD).
Murata et al. [99] investigated potential salivary metabolites for discrimination of patients with invasive breast carcinoma (IC), patients with ductal carcinoma in situ (DCIS), and healthy controls based on multiple logistic regression and ADTree-based machine learning methods. The authors identified 31 distinct metabolites for IC (Table 4). Only N1-acetylspermine differed between the DCIS and IC groups, whereas spermine discriminated IC from healthy controls. Spermine and ribulose 5-phosphate distinguished IC from healthy controls with 79% accuracy. The authors showed for the first time that the metabolomic profile depends on the molecular biological subtype of breast cancer. A significant difference was demonstrated in such metabolites as adaverine, 5-amiovalerate, gamma-butyrobetaine, 2-hydroxy-4-methylpentanoate, and Ala-Ala in the luminal A-like and B-like subtypes. A significant difference in N-acetylneuramine was shown only between luminal A-like and TNBC.
Xavier Assad et al. [101] found a crucial increase in the levels of 31 metabolites among patients with breast cancer, which included seven oligopeptides and six glycerophospholipids (Table 4). The authors showed that the content of tri-peptide and PG14:2 was increased before treatment, whereas after treatment, if effective, this was not observed. Zhong et al. [93] analyzed 18 significantly different salivary metabolites in breast cancer and showed that lysophosphatidylcholine (18:1), lysophosphatidylcholine (22:6), and monoacylglycerol (0:0/14:0/0:0) had the greatest predictive power. Ragusa et al. [104] found overexpression of salivary fucose and mannose, as well as decreased expression of galactosamine and glucosamine in breast cancer.
Bel’skaya and Sarf [94] showed that in breast cancer, the concentration of lactic, acetic, and propionic acids increases, and the concentration of oxalic and formic acids decreases, while in fibroadenomas, the concentration of oxalic acid decreases and formic acid increases compared to healthy controls.
Cavaco et al. [95] analyzed salivary volatile compounds for breast cancer in two different geographical regions in Portugal (Madeira Island) and India (Pune) (Table 4). The authors concluded that it is important to consider the specific cohort of data before generalizing it to other populations.
Bel’skaya et al. [107] showed that salivary concentrations of total
protein, urea, uric acid,
Sialic acids are the terminal fragments of carbohydrate chains. They are a biologically significant essential component for the functioning of glycoconjugates. Thus, it has been reliably shown that an increased level of sialylation is specific for breast cancer. These results are consistent with another study conducted by Oztürk et al. [88], where a high concentration of sialic acids was also found, with a simultaneous decrease in the level of total protein in patients with breast cancer compared to the control group. Using Surface-Enhanced Raman scattering (SERS), Hernández-Arteaga et al. [98] found that the level of sialic acids in the saliva of breast cancer patients is increased compared to benign tumors. The SERS test showed sensitivity and specificity of 80% and 93%, respectively; it is especially important that the method does not require chemical treatment of the saliva sample; it is very sensitive, fast, and inexpensive. The cut-off value for sialic acid levels (12.5 mg/dL) to differentiate between benign and cancerous tumors was established based on ROC curve analysis.
Liu et al. [96] found nine lectins (Table 4) that revealed significant changes in salivary glycopatterns between healthy controls, non-malignant breast pathologies, and breast cancer (stage I–II) using lectin microarrays, lectin assay-blotting, and statistical analysis.
Bel’skaya et al. [103] suggested using the Arginase/NO ratio. The
arginase: NO ratio was 0.22 for healthy controls, 0.98 for non-malignant breast
pathologies (p = 0.0040), and 1.48 for breast cancer (p
It was found that the concentration of salivary copper in breast cancer is 49.3% higher than in non-malignant diseases of the mammary glands and 60.4% higher than in healthy controls [108]. The copper content in saliva increases with increasing stage by 3.5 times, as well as with HER2-positive breast status (+51.9%). Copper content in saliva less than 1.14 mg/L is a prognostically unfavorable sign, while the relative risk of death from breast cancer more than doubles.
The oral cavity is populated by a huge number of microorganisms and is second only to the intestinal microbiota in this diversity [112]. Microorganisms can live in different parts of the oral cavity, such as the oral cavity, the gums, the tongue, and so on. The composition and activity of these media can vary greatly depending on pH, gene mutations, and interactions between bacteria [113]. Moreover, the composition of the microbiome in individual environments may differ slightly from each other. The oral microbiota is mainly dominated by the following bacteria: Firmicutes, Proteobacteria, Bacteroidetes, Actinobacteria, and Fusobacteria.
The participation of the oral microbiota in the pathogenesis of tumors can be considered from the point of view of three possible mechanisms [114]. Firstly, chronic inflammation, which occurs during dysbiosis of the oral microbiota, promotes the production of inflammatory mediators and induces cell proliferation, mutations, activation of oncogenes, and angiogenesis [115]. Thus, streptococci are involved in the formation of reactive oxygen species, which damage nucleic acids, proteins, and lipids, thereby causing apoptosis and tissue damage [116]. Secondly, the influence of dysbiosis on metabolic pathways may contribute to tumorigenesis [117]. Thirdly, the production of some oncogenic substances (for example, acetaldehyde) induces malignant transformation of cells during oral dysbiosis [118].
The oral microbiome has been suggested to play an important, albeit partial, role in the ontogenesis of breast cancer [119]. According to a number of authors, there is an increased risk of developing breast cancer in the presence of periodontal disease [120, 121]. A meta-analysis of 11 studies showed that the risk of breast cancer in this case increases by 1.22 times [122]. There are common pathogenic factors for periodontal disease and breast cancer, such as microorganisms and inflammation, which may influence the onset and progression of the disease [123]. This issue is being studied quite actively; in particular, differences in the microbial communities of the oral cavity in breast cancer and healthy controls have been identified, and the important role of menopause and menstrual status and the risk of breast cancer have been shown [124].
The results of different authors on the relationship between the oral microbiome and breast cancer are contradictory. Thus, Wang et al. [125] observed no significant differences in alpha diversity, beta diversity, or relative taxon abundance between breast cancer patients (n = 55) and non-cancer patients (n = 21). Nearing et al. [119] found that the relative abundance of the genus Rumminococcaecae UCG-014 was significantly decreased in breast cancer. The authors identified four more bacterial amplicon sequence variants (ASV), one of which belonged to the genus Rumminococcaecae UCG-014. For the remaining three ASVs, two of which were assigned to the genus Capnocytophaga and one to the genus Bergeyella, an increase in abundance was observed in breast cancer. These results are consistent with Wang et al. [125], who also showed no changes in the overall composition of the oral microbiome in breast cancer. However, Wu et al. [126] revealed differences in microbial diversity in breast cancer, in particular showing a decrease in the abundance of Porphyromonas and Fusobacterium. These significant discrepancies in results may be due to the fact that the studies were conducted in different populations, whereas geographical differences and their impact on the composition of the oral microbiome should be taken into account [127].
Feng et al. [128] showed that 31 species of bacteria on the tongue and 36 species of bacteria in saliva were statistically significantly associated with breast cancer. It has been shown that seven genera are common to both the tongue and saliva: Aggregatibacter, Fusobacterium, Streptococcus, Saccharimonadaceae TM7x, Prevotella, Oribacterium and Solobacterium [128]. At the same time, Aggregatibacter, Campylobacter, Fusobacterium, Streptococcus, TM7x promote breast cancer, while Prevotella inhibits.
Numerous studies reveal various aspects of the interaction between oral microbiota and breast cancer [129]. Periodontal diseases caused by specific bacteria, such as Porphyromonas, Tannerella, Treponema, Fusobacterium, etc., contribute to an increased risk of breast cancer [130, 131]. It is interesting to note that oral pathogens, such as Fusobacterium, have also been found in breast cancer tumor tissues. These bacteria probably enter the breast tissue through the bloodstream, potentially causing inflammation and carcinogenic processes [132]. Fusobacterium is able to colonize malignant breast tumors by attaching to N-acetylgalactosamine (GalNAc) receptors. It has been proven that Fusobacterium nucleatum can bind to Fap2 in a dependent manner in breast cancer tissue, inhibit the accumulation of tumor-infiltrating T cells, and promote tumor growth and metastasis, which can be compensated by antibiotic treatment [133]. Normally, there are elevated levels of lactococci and streptococci in the oral cavity, suggesting that these bacteria may have anti-cancer properties [134]. Another study found that the relative abundance of streptococci was higher in healthy patients, and there was a negative correlation between breast cancer stage and bacterial load in tumor tissue.
In another study, Feng et al. [135] showed that the microbiome composition of the oral cavity is associated with the molecular biological subtype of breast cancer. Thus, Bacteroidetes and Firmicutes in saliva samples were associated with Luminal A and Luminal B breast cancer, while HER2 and Triple-negative types showed higher levels of Proteobacteria [135]. Streptococcus and Neisseria were least represented in TNBC, whereas the HER2 subtype showed a higher abundance of Porphyromonas. Saliva samples show associations of Luminal B with both Proteobacteria and Bacteroidetes, as well as between TNBC and Actinobacteria. This suggests that the microbial matrix of saliva may provide specific information about certain subtypes of breast cancer.
Klymiuk et al. [136] analyzed saliva samples before the start of treatment, after four to six cycles of chemotherapy, and one year after the start of treatment. The phylum with the highest relative abundance were Firmicutes (59/69/54%), Bacteroidota (15/15/18%), Actinobacteriota (8/8/10%), Proteobacteria (10/7/10%), Fusobacteriota (4/4/5%) and Spirochaetota (1/2/1%). The most numerous genera include Streptococcus, Prevotella, and Veillonella. The authors found a significant increase in the relative abundance of potentially pathogenic taxa, such as Escherichia/Shigella, indicating the development of oral dysbiosis during chemotherapy treatment.
In this review, we summarized the results of the analysis of breast cancer biomarkers in saliva in the main areas of “omics” technologies, which allows us to identify a new independent direction within salivaomics - “salivoonkoomics” (Fig. 1). Within the framework of this direction, only those key changes in the composition of saliva are considered that directly relate to the pathology being studied, in our case, breast cancer.
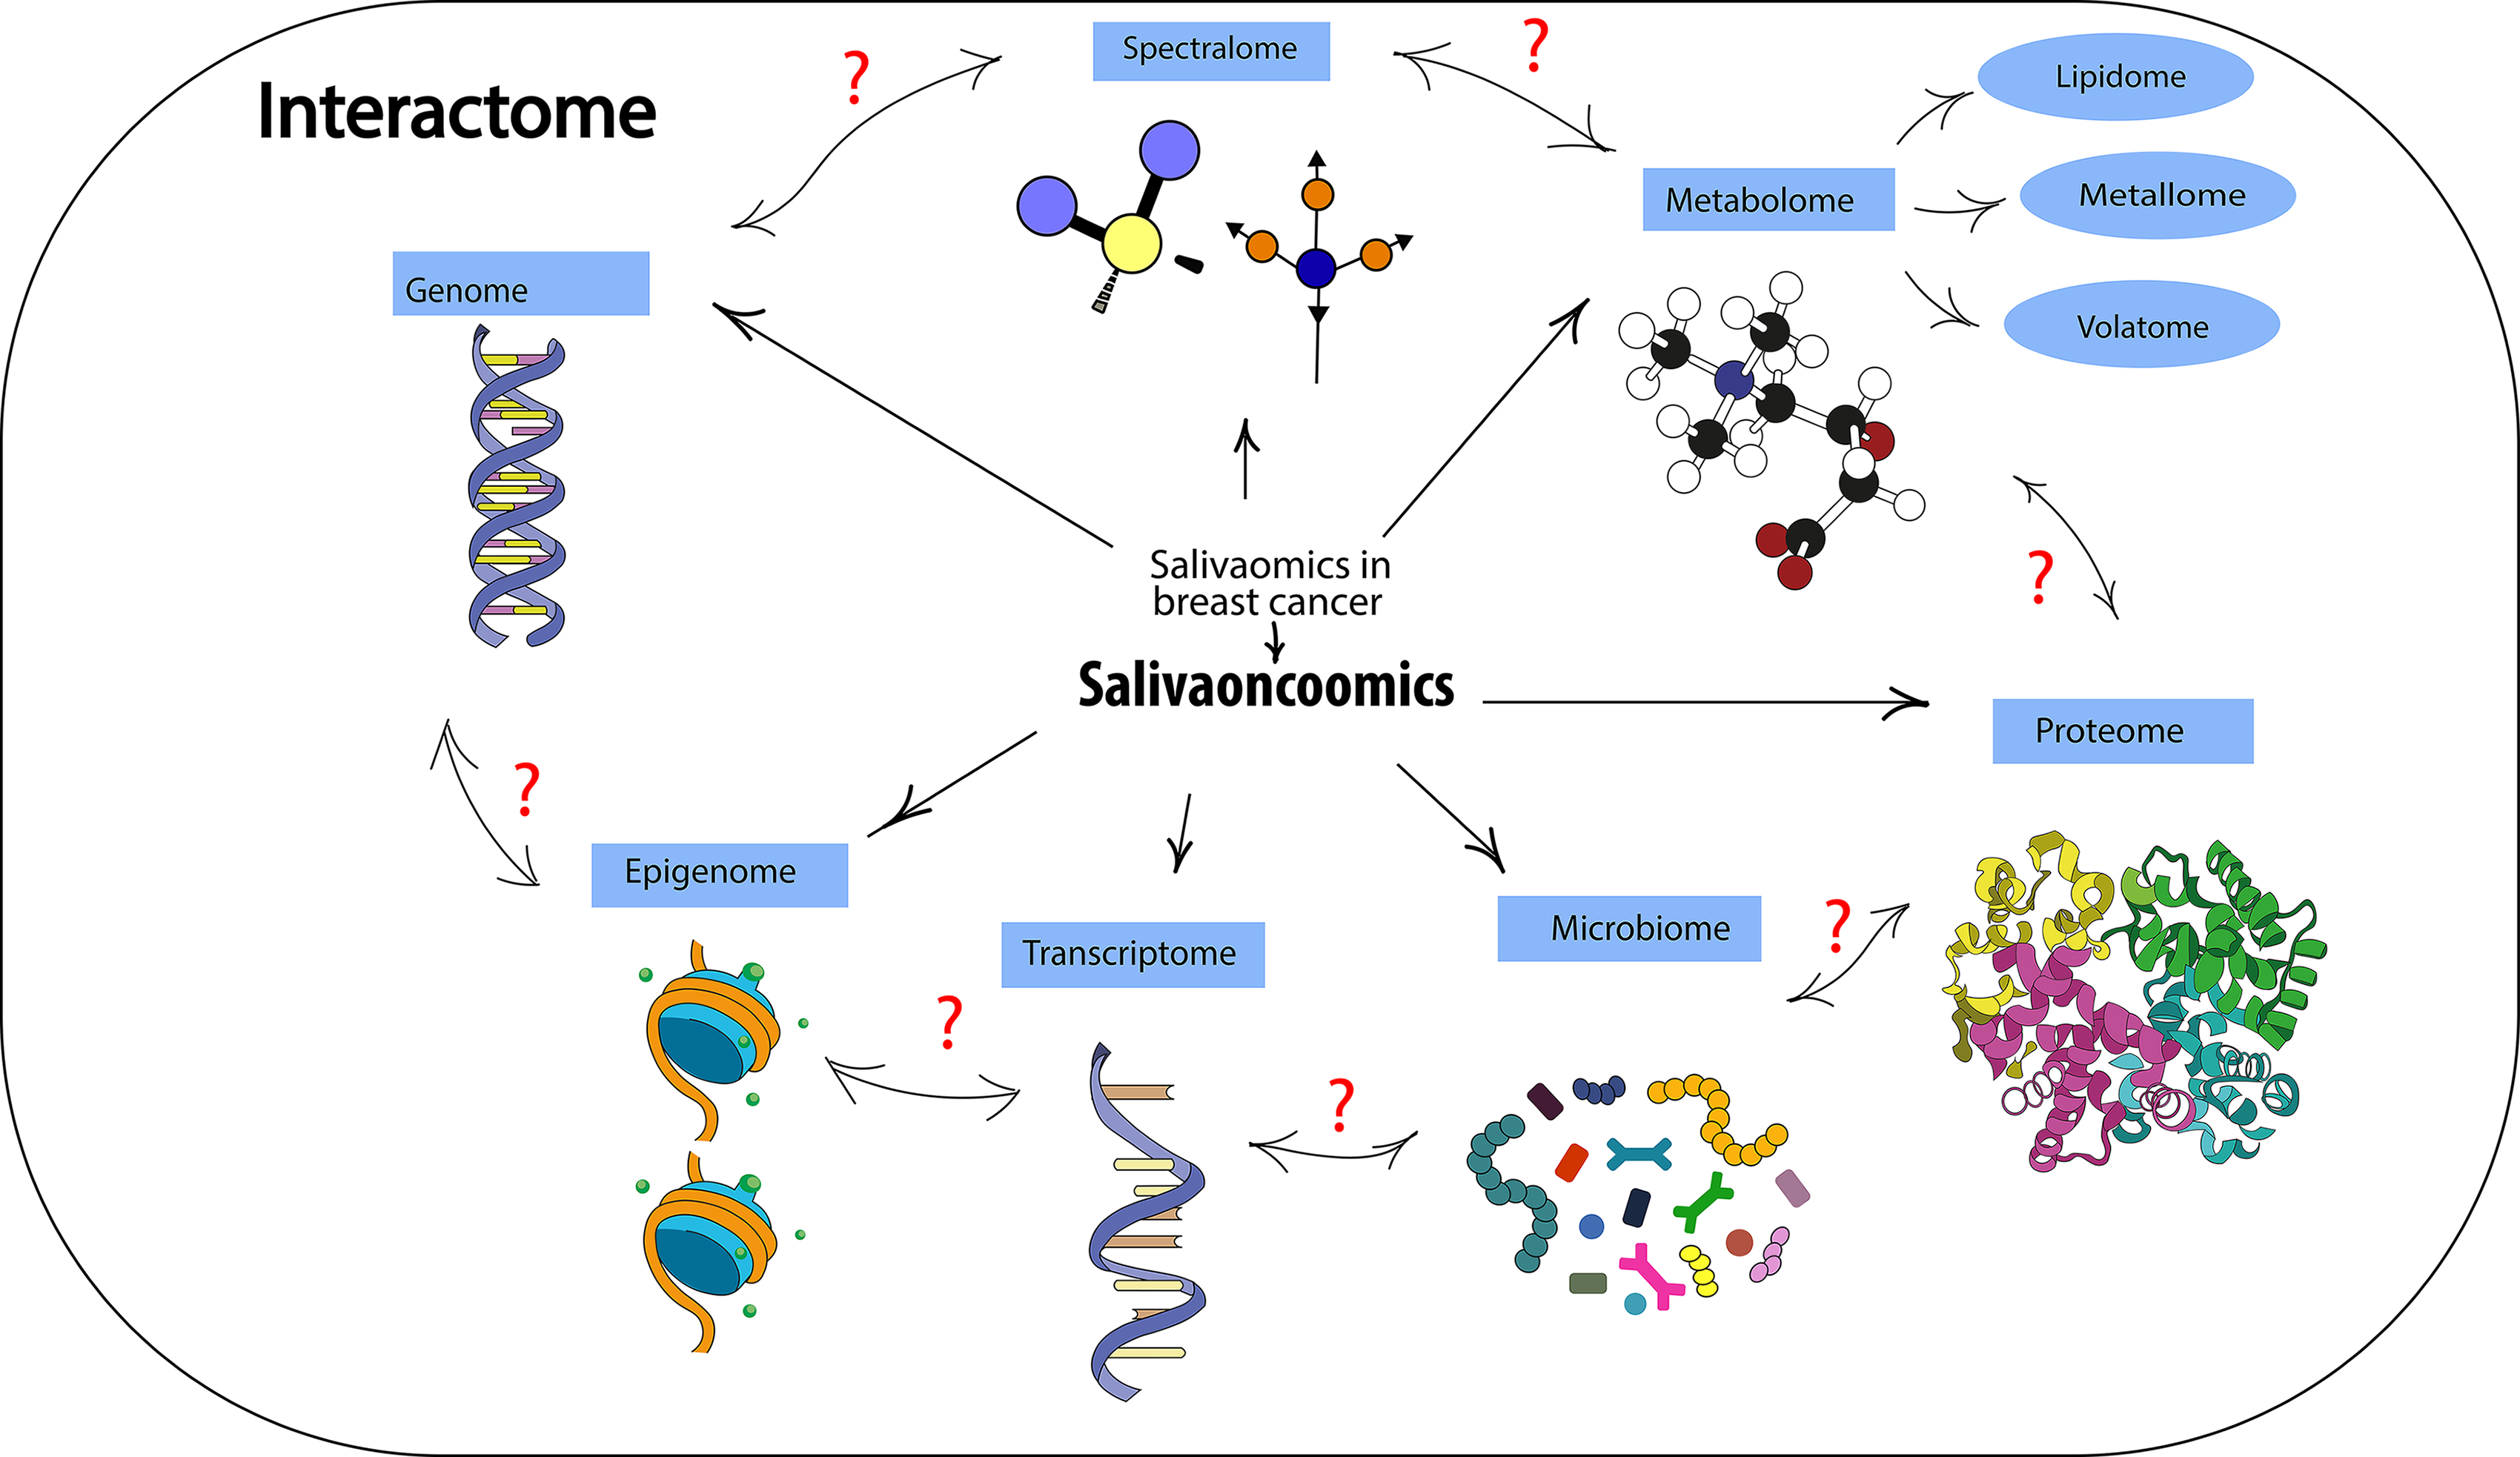 Fig. 1.
Basic structural elements of salivaonkoomics.
It has been shown that the metabolome and proteome of saliva are the most studied, while there are currently no studies on epigenomic markers of saliva in breast cancer. It is interesting to note that even within the same field of “omics”, data from different authors differ significantly both in the set of biomarkers and in the nature of changes in their concentration. At the same time, the authors often do not provide any justification for the choice of these particular metabolites but only state the fact of changes in their content in breast cancer. There are practically no studies, with rare exceptions [42], in which one author would consider biomarkers included in different “omics”.
In addition, the small sample sizes in most studies are noteworthy. Thus, for metabolomics, in 15 of the 24 analyzed studies, the number of patients in the breast cancer group did not exceed 50 people, and in none of the studies did it reach 500 people (Table 4). Breast cancer is a heterogeneous disease, and a number of studies have shown that differences in the composition of saliva significantly depend on the molecular biological subtype of the tumor, as well as age, menopausal status, and a number of other factors [97, 107, 108, 109]. In this regard, data on the same indicator can vary significantly depending on the sample structure. Most studies do not provide data on sample characteristics at all. All this significantly reduces the possibility of comparing results obtained by different authors. There is a need to verify data when applying them to a specific sample.
Currently, data comparisons are limited to diagnostic performance obtained for different biomarkers [137]. For example, a systematic review and meta-analysis were conducted to examine the diagnostic value of breast cancer detection using salivary biomarkers. The authors selected 14 clinical trials with 8639 adult women—of which 4149 had been diagnosed with breast cancer, and 4490 were controls. Comparisons were made using the following types of biomarkers: proteomic, transcriptomic, and metabolomic. The above salivary biomarkers were detected using ELISA, PCR, liquid chromatography, or electrophoresis. It was found that the specificity and sensitivity of detecting salivary biomarkers in patients with breast cancer were 72.7% and 71.7%, respectively. Compared with controls, patients with breast cancer were approximately 6 times more likely to have a positive result. The best specificity and sensitivity rates were recorded using ELISA and PCR methods (79% and 73.5%, respectively). The authors conclude that saliva can be used as a convenient biomaterial for effective breast cancer screening.
We have identified a new direction within the framework of salivaomics, which should be given attention—spectralomics (Fig. 1). In our opinion, the fairly broad field of metabolomics can be divided into a number of narrower areas: metallomics, lipidomics, volatomics, etc. (Fig. 1). However, this will have potential significance only if methodological approaches to obtaining, analyzing and interpreting data are unified within one subsection. In the published results, in our opinion, more attention should be paid to the methodological features of the study to indicate technical details and nuances that would allow us to obtain comparable data.
Attention should be paid to the currently underdeveloped field of epigenomics with an emphasis on DNA methylation and histone modification since epigenetic changes are critical for the development and progression of cancers, including breast cancer.
Another obvious limitation of the use of “omics” technologies is the lack of studying the relationships between individual areas. Therefore, in our opinion, a necessary component of salivaonkoomics is the interaction of saliva. The interactome is a map of biologically significant molecular interactions [138]. The classification of molecular interactions in its simplest form is based on the nature of the interacting molecules, for example, protein-protein interactions [139]. The interactome also includes protein-DNA interactions or gene regulatory networks, which include transcription factors, chromatin regulatory proteins, and target genes. Any metabolic network can be viewed through the lens of molecular interactions involving enzymes that physically bind their substrates. It is now obvious that all types of molecular interactions are also interconnected. For example, protein interaction interactomes contain many enzymes, which in turn form biochemical networks. Similarly, gene regulatory networks overlap significantly with protein interaction networks and signaling networks. For example, within the framework of this review, we would like to understand which DNA and mRNA are involved in the coding and translation of oncoproteins identified during proteome analysis, etc. Overall, interactomes are useful tools for characterizing biological processes at a global level and for generating new hypotheses that can be further tested experimentally and applied, for example, in drug discovery.
An example is the results of a study in which Pearson correlation analysis on 79 breast tumor biopsies showed that mutations in intermodular hub genes were more often associated with cancer phenotype than mutations in intramodular hub genes [140]. Hubs with significant differences in the Pearson correlation coefficient between patients with favorable and unfavorable treatment outcomes were studied. BRCA1 expression was shown to be highly correlated with the expression of its interactome partners in surviving patients but did not correlate with their expression in tumors of fatal patients. Of the BRCA1 co-expression partners, high correlations with favorable outcomes were observed for MRE11 and BRCA2. These proteins are members of the super-complex (BRCA1-associated genome surveillance complex, or BASC) [141]. This complex includes tumor suppressors and proteins of the DNA repair system. The results of the analysis showed that BASC disorganization through loss of coordinated co-expression of components directly correlates with poor outcomes in breast cancer.
To more fully understand the diagnostic and prognostic capabilities of saliva in breast cancer, it is necessary to develop salivaoncoomics in several directions: (1) systematization and unification of the study of biomarkers within each area of “omics”, including sample size, sample homogeneity, list of methods and approaches, list of biomarkers, reproducibility of results, the ability to broadcast results to other samples; (2) expanding the number of “omics” components by adding new methods (for example, spectrolomics, etc.); (3) studying the relationships between different “omics” technologies (interactomics). All this together will allow the study of saliva not only in breast cancer but also in many other pathologies to a qualitatively new level.
LVB designed the research study. LVB and EID performed the research. Both authors contributed to editorial changes in the manuscript. Both authors read and approved the final manuscript. Both authors have participated sufficiently in the work and agreed to be accountable for all aspects of the work.
Not applicable.
Not applicable.
This research was funded by Russian Science Foundation, grant number 23-15-00188, https://rscf.ru/project/23-15-00188/.
The authors declare no conflict of interest.
References
Publisher’s Note: IMR Press stays neutral with regard to jurisdictional claims in published maps and institutional affiliations.