


1 Department of Ophthalmology, Minhang Hospital, Fudan University, 201100 Shanghai, China
2 Department of Ophthalmology, Xinshijie Zhongxing Eye Hospital, 200050 Shanghai, China
3 Endoscopy Center, Minhang Hospital, Fudan University, 201100 Shanghai, China
4 Department of Ophthalmology, Changhai Hospital Affiliated to Navy Medical University, 200433 Shanghai, China
Abstract
Background: Retinal pigment epithelial (RPE) cells have a
pivotal function in preserving the equilibrium of the retina and moderating the
immunological interaction between the choroid and the retina. This study
primarily focuses on delineating the protective effect offered by Kaempferol
(Kae) against RPE cell damage. Methods: Bioinformatics analysis was
performed on the GSE30719 dataset to identify hub genes associated with RPE.
Subsequently, we analyzed the impact of Kae on RPE apoptosis, cell viability, and
inflammatory response through cell experiments, and explored the interaction
between hub genes and Kae. Results: Based on the GSE30719 dataset, nine
hub genes (ISG15, IFIT1, IFIT3, STAT1,
OASL, RSAD2, IRF7, MX2, and MX1)
were identified, all of which were highly expressed in the GSE30719 case group.
Kae could boost the proliferative activity of RPE cells caused by
lipopolysaccharide (LPS), as well as reduce apoptosis and the generation of
inflammatory factors (tumor necrosis factor receptor (TNFR), interleukin-1beta
(IL-1
Keywords
- retinal pigment epithelium
- kaempferol
- STAT1
- IRF7
- ubiquitination
A specialized group of cells, known as Retinal pigment epithelial (RPE) cells, are strategically situated in the retina’s outermost layer [1]. These cells play an indispensable role in the upkeep and operational efficiency of photoreceptors-the vision-enabling, light-sensitive cells [2]. The blood-retinal barrier, which prevents harmful substances from entering the retina, is maintained by the RPE, a single layer of pigmented cells that performs a variety of vital tasks [3, 4]. These include the transport of nutrients, the phagocytosis of shed photoreceptor outer segments, and waste products, and the transport of nutrients [5]. Various retinal degenerative diseases including Stargardt disease, retinitis pigmentosa, and age-related macular degeneration are associated with the dysfunction or depletion of RPE cells [6, 7]. Such conditions can culminate in severe visual impairment or even total loss of sight [8]. Therefore, research on RPE cells is crucial for understanding the pathogenesis of these diseases and developing effective therapeutic strategies.
As a naturally occurring flavonoid, Kaempferol (Kae) has attracted significant attention within the scientific community [9]. This is attributed to its broad spectrum of biological effects encompassing not only anti-cancer properties, and anti-inflammatory capabilities, but also antioxidant [10, 11]. In relation to RPE cells, Kaempferol has surfaced as a prospective compound in preempting and addressing the deterioration associated with retinal disorders, exemplified by retinitis pigmentosa and age-related macular degeneration [12, 13]. Kaempferol protects RPE cells, according to recent study, by altering a number of signaling pathways related to inflammation, apoptotic cell death and others [13]. The study showed that the tissue factor-targeting peptide (TF-TP) inhibited lipopolysaccharide (LPS)-induced proliferation of ARPE-19 cells and maintained RPE tight junctions by inhibiting TF and increasing ZO-1 expression [14]. Furthermore, Kaempferol was shown to promote the survival and function of RPE cells under different stress conditions, which may be crucial for delaying or reversing the progression of retinal degenerative diseases [15]. The investigation of Kae’s impact on RPE cells represents an area of active research, with the potential to reveal novel therapeutic targets and strategies for the management of retinal disorders.
The goal of this research is to investigate the role of Kae in regulating RPE cell activities, including LPS-induced proliferation, apoptosis, and inflammatory cytokine release. First, we used bioinformatics approaches to identify hub genes that are directly associated to RPE cells in public databases. Following that, the effect of Kae on RPE cell damage was explored in vitro using a variety of cell studies. The findings of this research will bring new ideas for prospective treatment techniques for RPE injury and inflammation in ocular illnesses.
We searched the GEO with the keyword “RPE cells”, “West Nile Virus (WNV)”, and identified the GSE30719 dataset. Based on the “WGCNA” package (version 4.1.0) of the R software (version 4.1.0, https://www.r-project.org/), we constructed a gene co-expression network for all genes in the GSE30719 dataset, and determined the optimal soft threshold to make the network conform to a scale-free topology. Then, the dissimilarity coefficient of various nodes was determined in accordance with the adjacency function the gene network formed, and a hierarchical clustering tree was created to obtain gene modules of different colors. Subsequently, the correlation between the gene modules and the GSE30719 data sample station was calculated, and a heat map was drawn to screen out the key module.
The GSE30719 dataset (https://www.ncbi.nlm.nih.gov/geo/query/acc.cgi?acc=GSE30719) includes 10 samples, of which four uninfected RPE cell samples were regarded as the control group, and 4 RPE cells infected with immunopathogenic West Nile virus (WNV) as the case group. Through the GEO2R tool in the GEO database, the up- and down-regulated DEGs in these samples were screened with the standards of fold change (FC) above 1.5 or below 0.67, with a p-value less than 0.05.
We applied the “ggvenn” package (version 0.1.9) of R software to draw the Venn
diagram of brown module and GSE30719-DEGs to identify the intersection genes.
Following this, we employed the ‘Cluster Profiler’ package (version 4.0.1) to
perform enrichment analysis, utilizing both the Kyoto Encyclopedia of Genes and
Genomes (KEGG) pathways and Gene Ontology (GO) terms. This analysis was conducted
on the identified genes with the goal of illuminating their biological
attributes. When p
Subsequently, we inputted the sequence data of the intersecting genes into the Search Tool for the Retrieval of Interacting Genes (STRING) database. To illustrate the interconnections among these genes, we used Cytoscape software (version 3.8.1, http://www.cytoscape.org/) to construct a visual representation of the protein-protein interaction (PPI) network. Cytohubba is a plugin for Cytoscape that ranks nodes according to their properties in the network, including 11 topological algorithms. Herein, we construct two sub-networks based on the Degree and Maximal Clique Centrality (MCC) algorithms, respectively, and the top 15 genes by each algorithm were displayed. The hub genes were demonstrated through Venn diagram based on the “ggvenn” package.
The “ggplot2” package (version 3.3.3) of the R software was employed to detect the expressions
of nine hub genes in the two groups of the GSE30719 dataset to evaluate whether
the gene expression was affected by WNV infection. Subsequently, we delved deeper
into the biological attributes of these genes. The KEGG pathway enrichment
analysis via Gene Set Enrichment Analysis (GSEA) was performed on these nine
genes, and the top four enriched pathways with p
Kae, a flavonoid compound, has the molecular formula C
We cultured RPE cells in DMEM, complemented with 10% FBS and 1%
penicillin-streptomycin, maintaining the environment at 37 °C with 5%
CO
Cells were first exposed to LPS at a concentration of 5 µg/mL for a period of 6 hours to initiate inflammation. This was followed by a 24 hours pre-treatment phase with a range of Kae concentrations (0, 5, 10, 25, or 50 µmol/L). Subsequent to pre-treatment, cells were introduced to the Cell Counting Kit-8 (CCK-8) reagent. Optical density (OD) measurements were carried out at a wavelength of 450 nm via a microplate reader (BioTek, Shanghai, China).
Flow cytometry was used to assess RPE cell apoptosis. Cells were pre-treated with Kaempferol (0, 5, or 10 µmol/L) for 24 hours after being treated with LPS (5 µg/mL) for 6 hours. Flow cytometry was used to evaluate cells labeled with Annexin V-FITC and propidium iodide (PI).
RPE cells were collected and lysed with RIPA buffer after treatment. A bicinchoninic acid (BCA) assay was used to quantify protein concentrations. Sodium dodecyl-sulfate polyacrylamide gel electrophoresis (SDS-PAGE) was used to separate equal quantities of protein, which was then transferred to polyvinylidene difluoride (PVDF) membranes. After blocking with 5% skimmed milk, the membranes were treated with primary antibodies against apoptotic proteins (cleaved caspase-3 and Bcl-2), STAT1, and IRF7, followed by secondary antibodies conjugated to horseradish peroxidase. Enhanced chemiluminescence (ECL) reagents were used to view protein bands. The intensity was measured using ImageJ software (version 1.53s, LOCI, University of Wisconsin, Madison, WI, USA).
We utilized TRIzol reagent for total RNA extraction from RPE cells, which was
subsequently subjected to reverse transcription using PrimeScript RT kit (TaKaRa, Dalian, China). To
quantify these expressions, we leveraged an Applied Biosystems 7500 Fast Real
Time PCR System (Thermo Fisher Scientific, Waltham, MA, USA) with SYBR Green
Master Mix for qRT-PCR. Primers for amplification of IL-1
The ELISA kits supplied by Abcam, Cambridge, UK, were employed to quantify the secretion of cytokines IL-1, IL-6 and IL-12 in RPE cell culture supernatant. Cells underwent treatment with 5 µg/mL LPS for 6 hours and received pre-treatment with Kae at concentrations of 0 or 10 µmol/L for 24 hours period. Subsequent to this, the culture medium was gathered, centrifuged at 1000 rpm for 10 minutes to eliminate cell remnants, and diluted in a 1:2 ratio with the diluent included in the kit. Following the manufacturer’s protocol, the assay was performed, and absorbance was gauged at 450 nm using a Bio-Rad microplate reader, Hercules, CA, USA.
In this study, we utilized the HitPredict database (http://www.hitpredict.org/), an integrative bioinformatics platform that predicts PPI based on experimental evidence and a confidence score system. The database offers a comprehensive collection of PPI derived from multiple sources, including high-throughput experiments and literature-curated data, to facilitate the identification of potential interactions between proteins of interest. To investigate the proteins associated with STAT1, we conducted a search using the HitPredict database to identify potential binding partners.
Co-IP was used to identify the interaction between STAT1 and IRF7. Following a pre-treatment with Kae (0 or 10 µmol/L) for 24 hours, cells were treated with LPS (5 µg/mL) for 6 hours. Protein A/G beads were used after total protein had been isolated and treated with certain primary antibodies. The immunoprecipitated proteins were analyzed by WB.
The aforementioned plasmids were collectively transfected into RPE cells using Lipofectamine 3000 following the provider’s protocols. Post-transfection (48 hours), cell collection and lysis took place. Subsequently, the cell lysate underwent a 2-hour incubation with GST beads at 4 °C, ensuring gentle rotation. After a trio of washes with buffer, proteins adhered to the beads were eluted through boiling with SDS-PAGE loading buffer. Following separation via SDS-PAGE, these proteins were transferred onto PVDF membranes. The membranes were then targeted with both anti-Myc and anti-GST antibodies, and further incubated with an HRP-linked secondary antibody. Visualization of protein bands was achieved with a chemiluminescence detection system (Perkin Elmer, Boston, MA, USA).
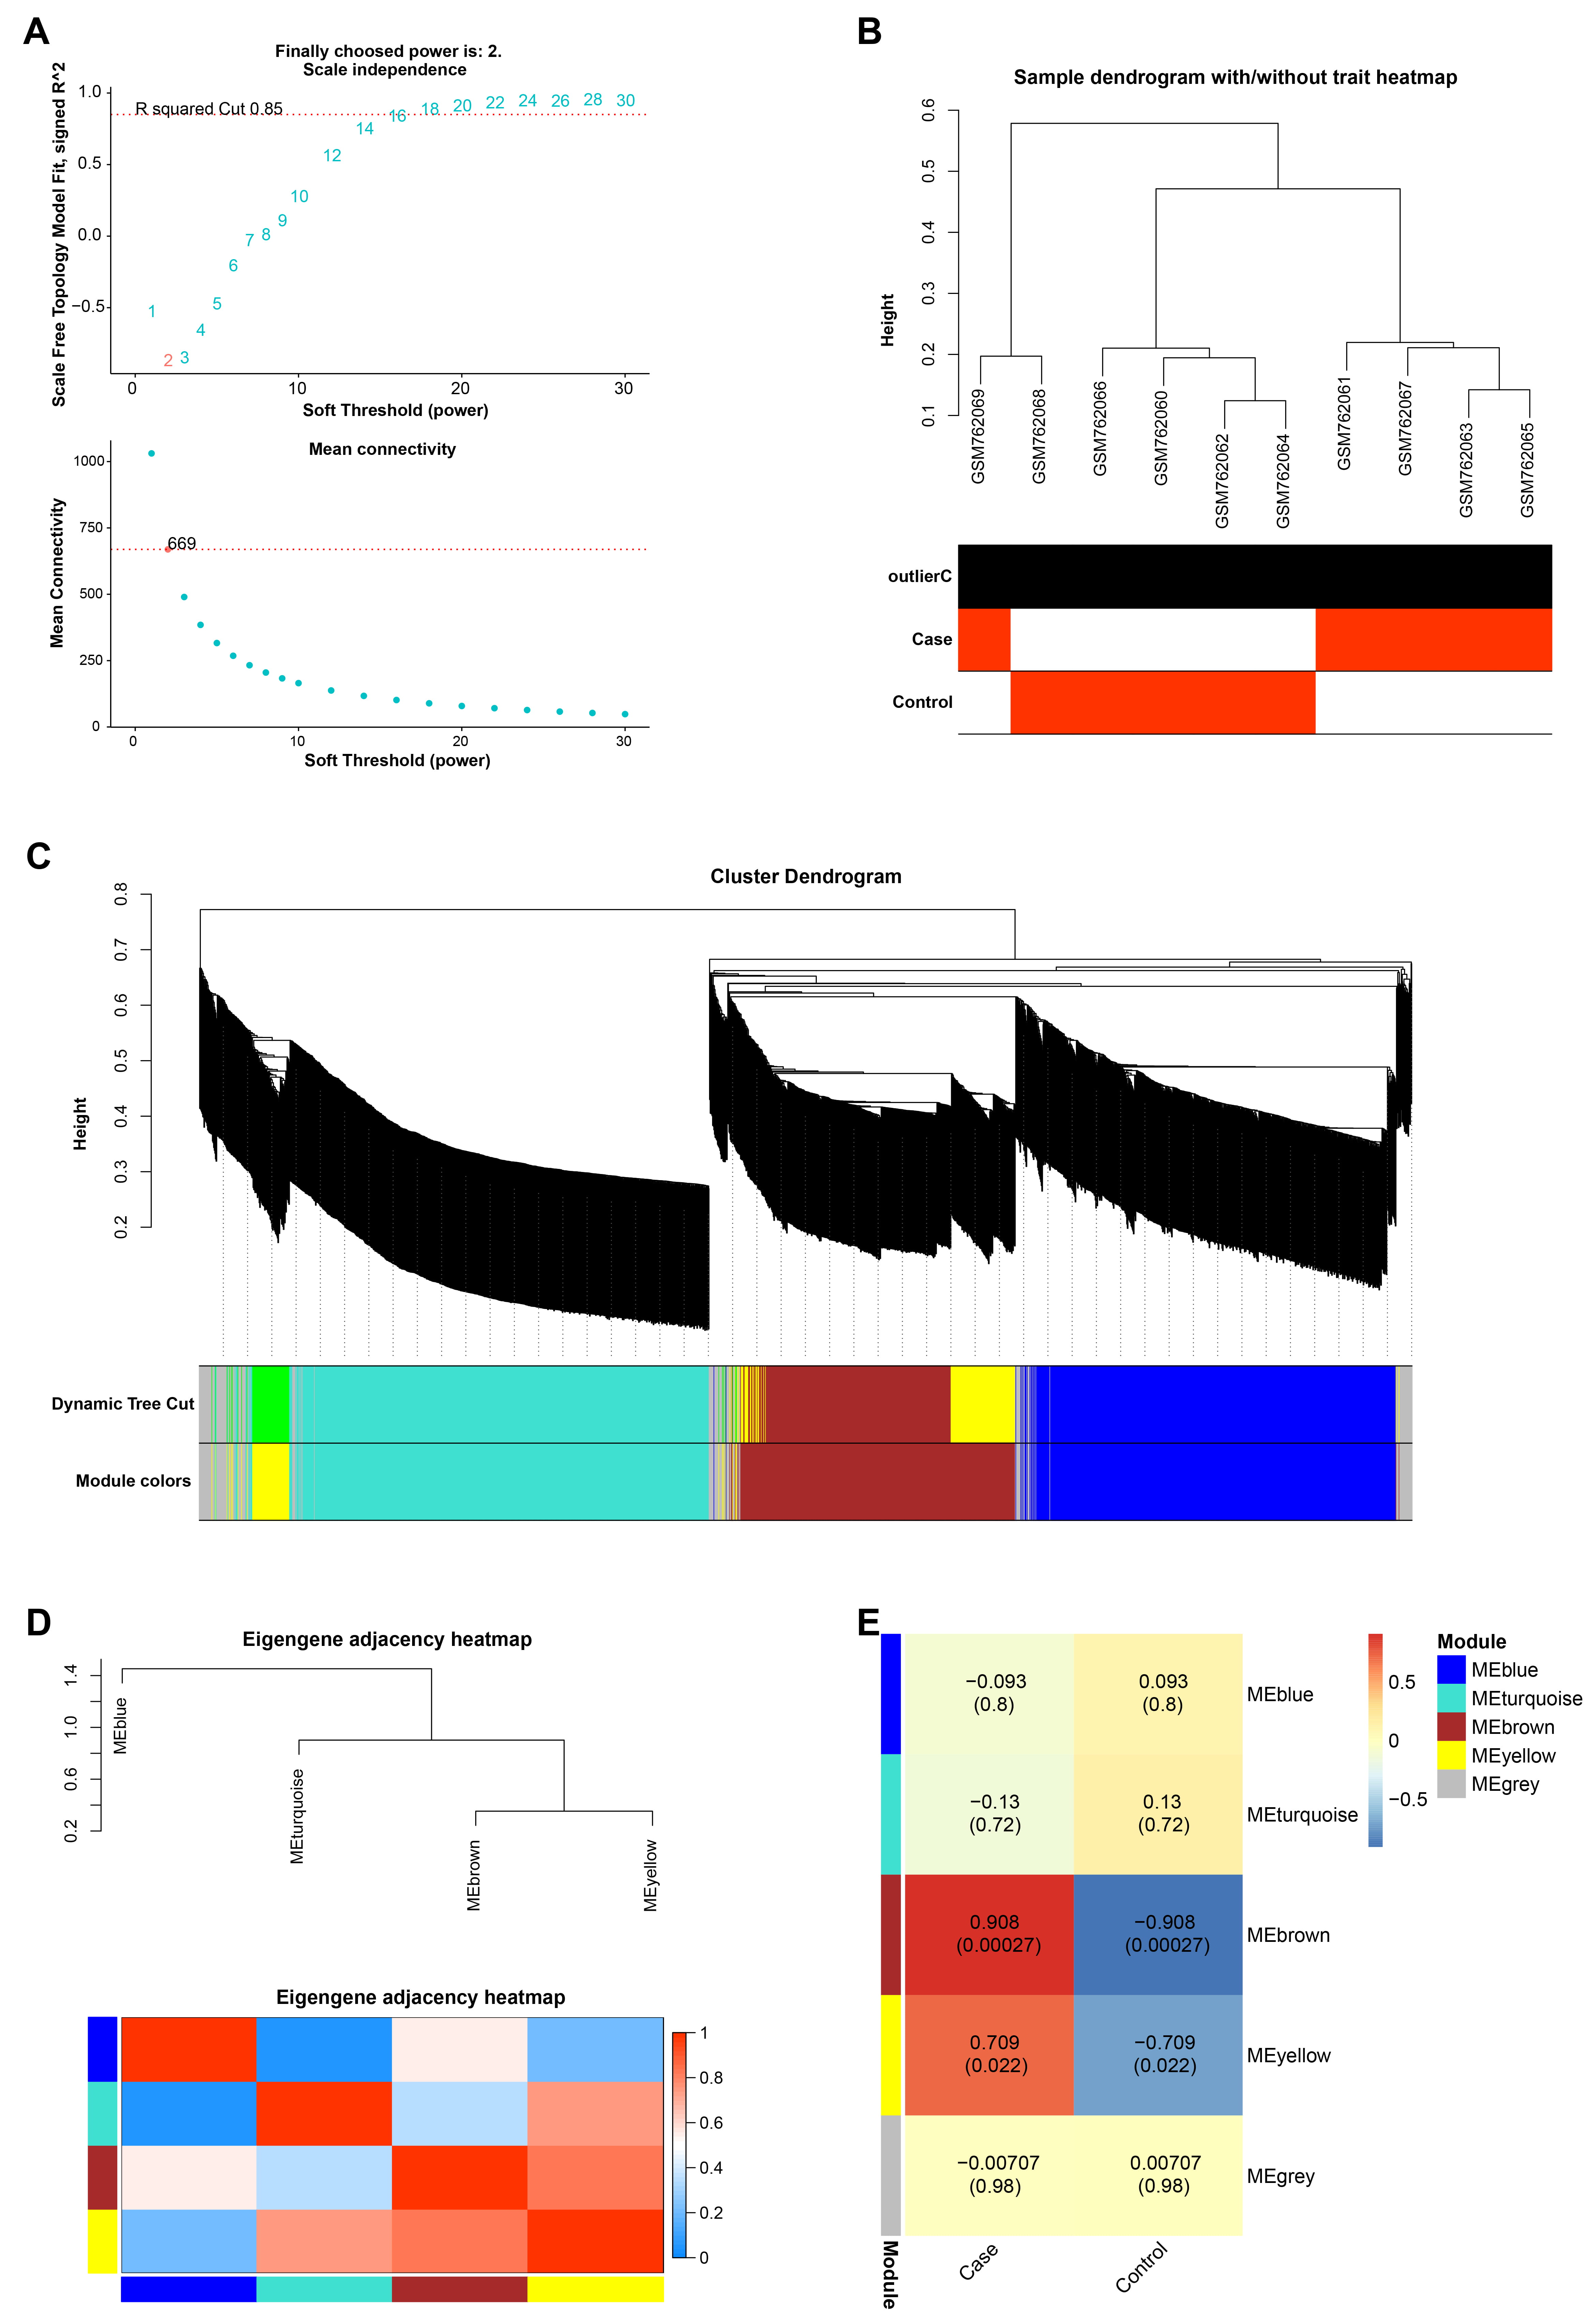
The gene co-expression network was constructed for all the genes in the GSE30719 data set by the WGCNA algorithm, and the optimal soft threshold of the network was selected as 2 (Fig. 1A,B). After that, we divided these genes into 4 modules (except the grey module), namely the blue, turquoise, brown and yellow modules, and constructed a cluster dendrogram and eigengene adjacency heatmap (Fig. 1C,D). Subsequently, by comparing the correlations between these gene modules and the control and case groups in the GSE30719 dataset, it was identified that the brown module had the strongest correlation with strict inability, with a correlation coefficient of 0.908 (Fig. 1E).
 Fig. 1.
The brown module has the strongest correlation with samples in the GSE30719 dataset. (A) The red line in the upper figure represents the subjectively selected scale-free fitting index value, 2 is the optimal soft threshold, and the lower figure is the mean connectivity of different soft thresholds. (B) Dendrogram of 10 samples in GSE30719 dataset, different branches represent different samples. (C) The Cluster Dendrogram of the gene module, the upper layer is the hierarchical clustering dendrogram of genes, and the lower layer is the gene modules of different colors. (D) The eigengene adjacency heatmap of gene modules, the different branches above represent different gene modules, and the bottom is the heatmap between gene modules. (E) Heatmap of the correlation between the gene modules and the case and the control groups in the GSE30719 dataset, the larger the correlation coefficient, the stronger the correlation between the module and the sample.
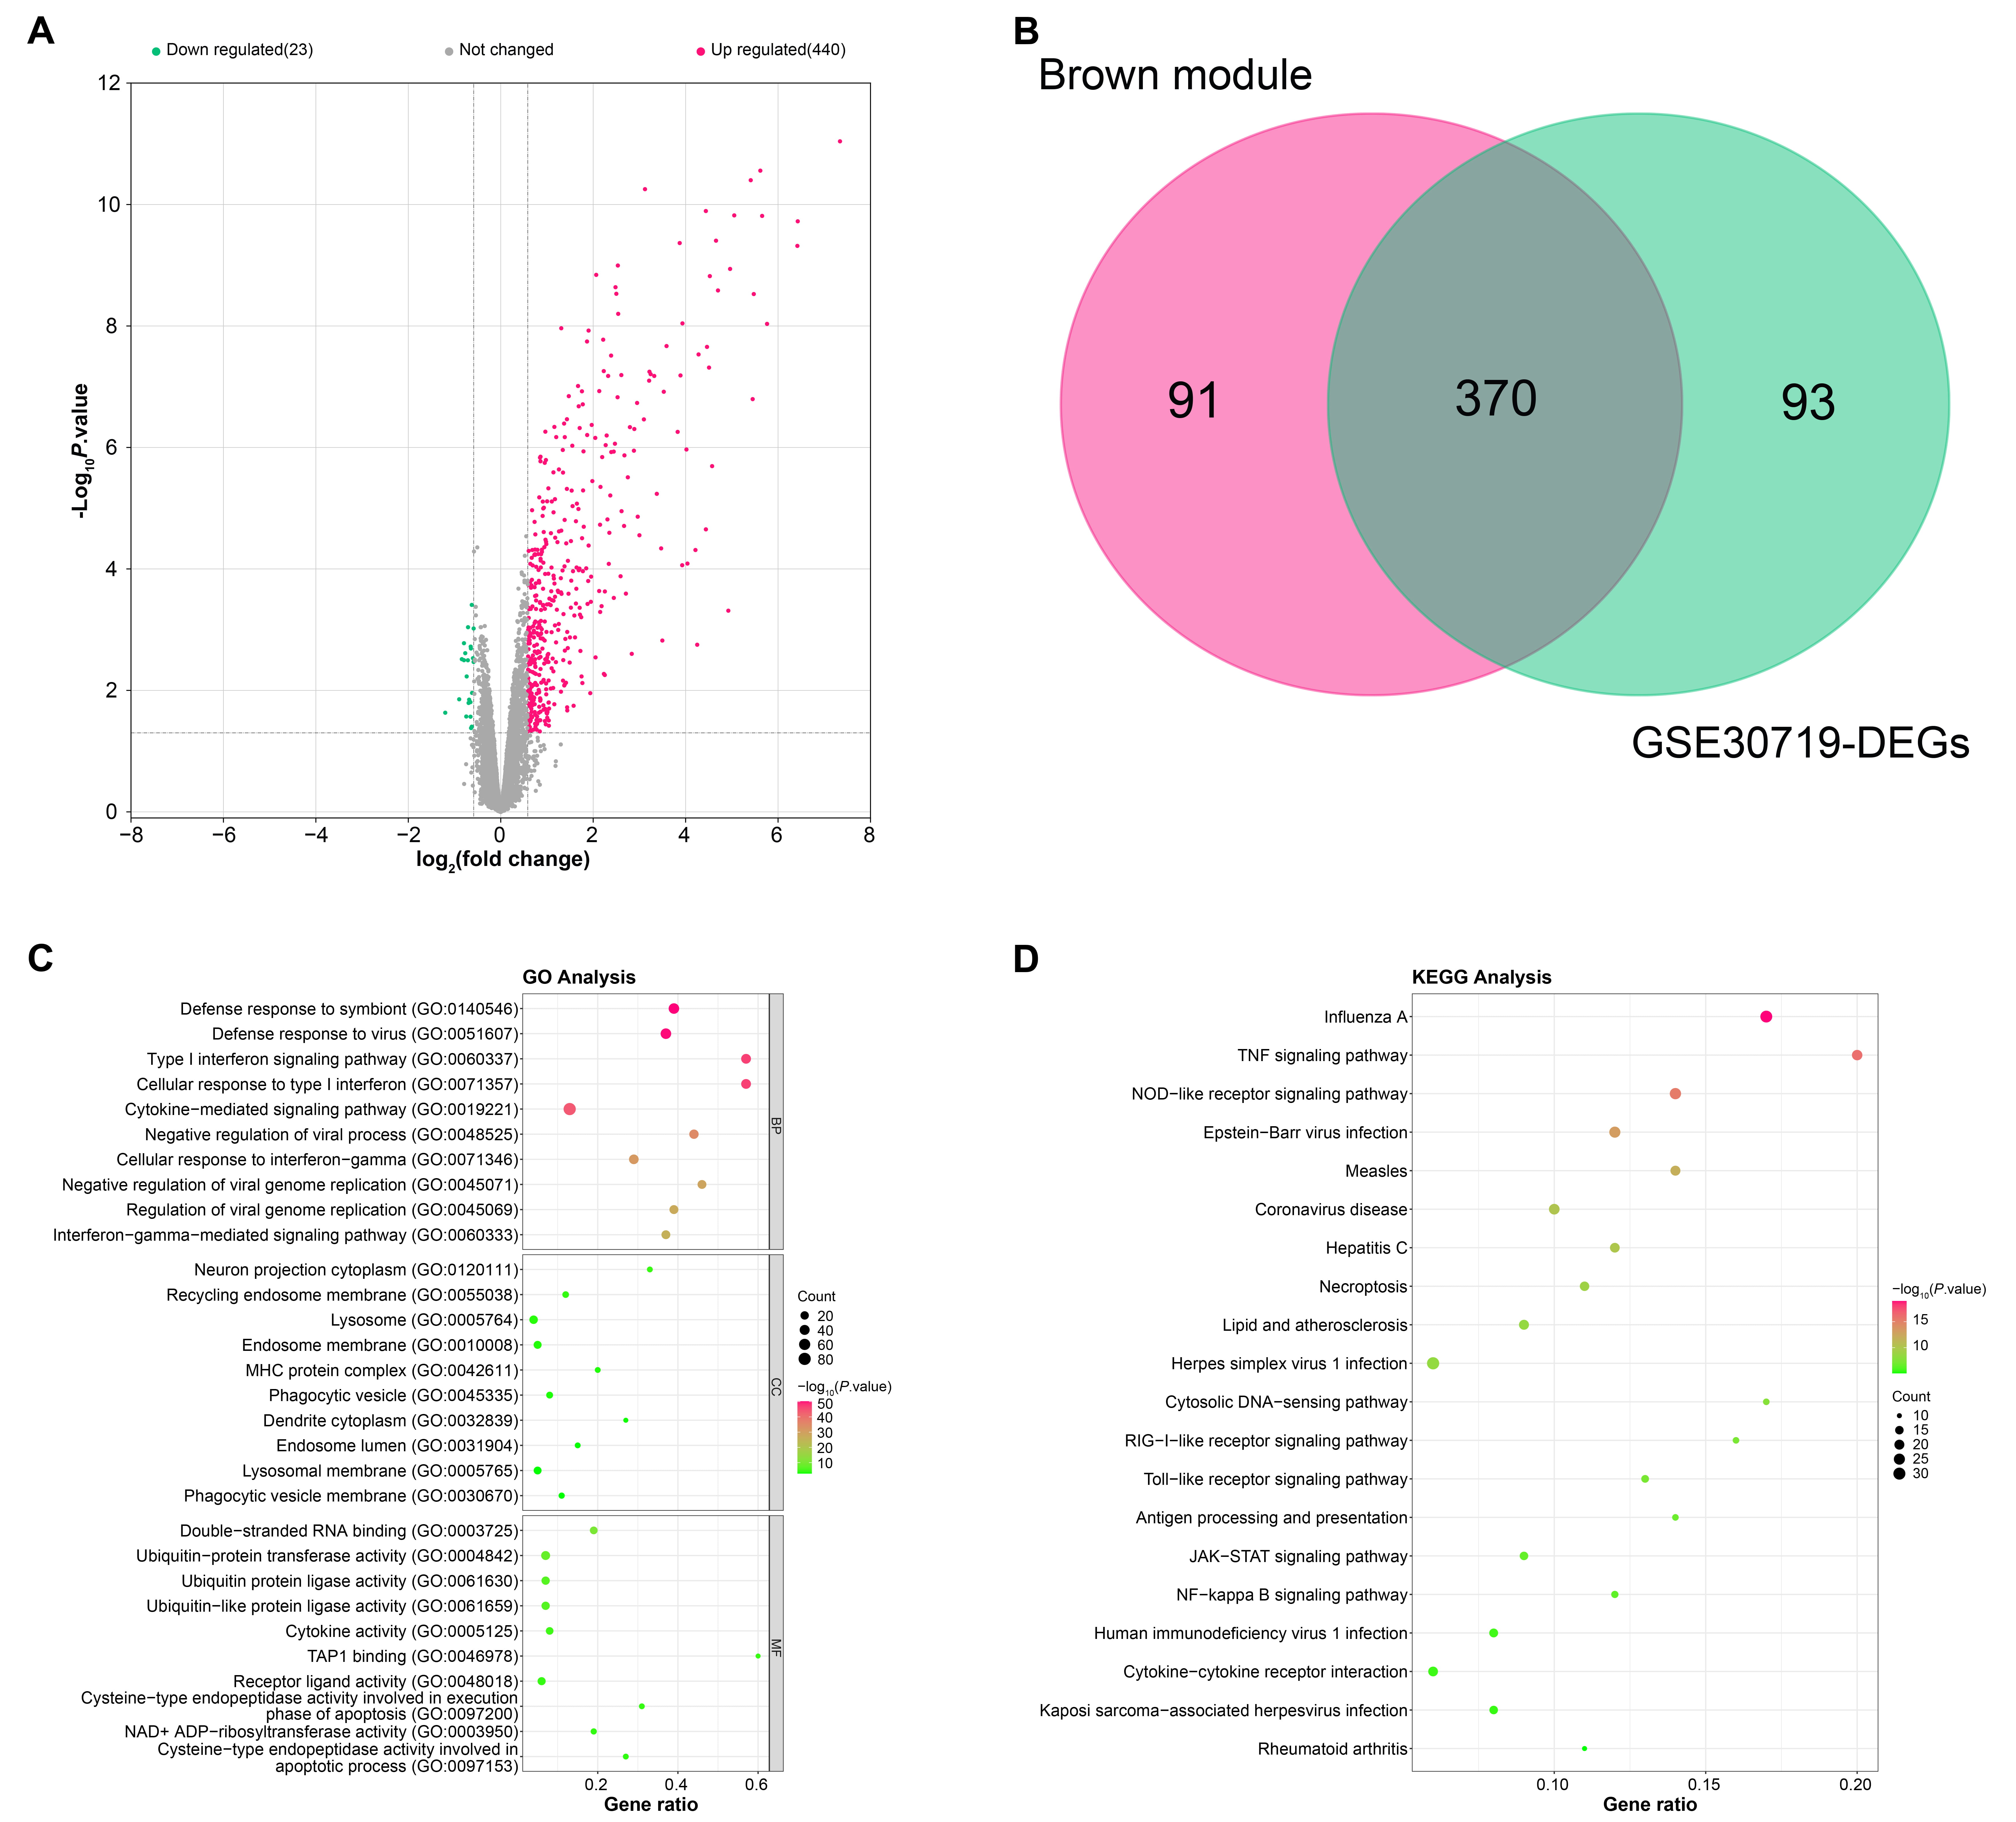
Through the GEO2R tool and screening conditions, we identified 440 up-regulated and 23 down-regulated DEGs from GSE30719, as demonstrated in the volcano plot of Fig. 2A. Based on the “ggvenn” package, we drew a Venn diagram of brown module and GSE30719-DEGs, from which 370 intersecting genes were identified (Fig. 2B). In the GO analysis on the intersecting genes, it was found that these genes were enriched in Defense response to symbiont, Cytokine-mediated signaling pathway, Defense response to virus, etc. (biological process, BP), MHC protein complex, Endosome membrane, Lysosome, Recycling endosome membrane, Neuron projection cytoplasm, etc. (Fig. 2C, cell component), Cytokine activity, Double-stranded RNA binding and so on (molecular function). Besides, these genes were related to KEGG pathways like Coronavirus disease, Measles, Influenza A (Fig. 2D).
 Fig. 2.
The intersecting genes from brown module and GSE30719-differentially expressed genes (DEGs). (A) Volcano plot of GSE30719-DEGs, the green scatter on the left represents down-regulated DEGs, and the three red dots on the right represent up-regulated DEGs. (B) The intersecting genes identified from key module and GSE30719 dataset. (C) The enriched Gene Ontology (GO) terms of intersecting genes in biological process (BP), cellular component (CC), molecular function (MF). (D) Top 10 Kyoto Encyclopedia of Genes and Genomes (KEGG) enrichment pathways of intersecting genes.
Next, the sub-networks of intersecting genes were constructed through the Degree and MCC algorithms of the Cytohubba plugin (Fig. 3A,B). Then by Venn diagram, nine hub genes related to WNV infection in RPE were identified, namely ISG15, IFIT1, IFIT3, STAT1, OASL, RSAD2, IRF7, MX2, and MX1 (Fig. 3C).
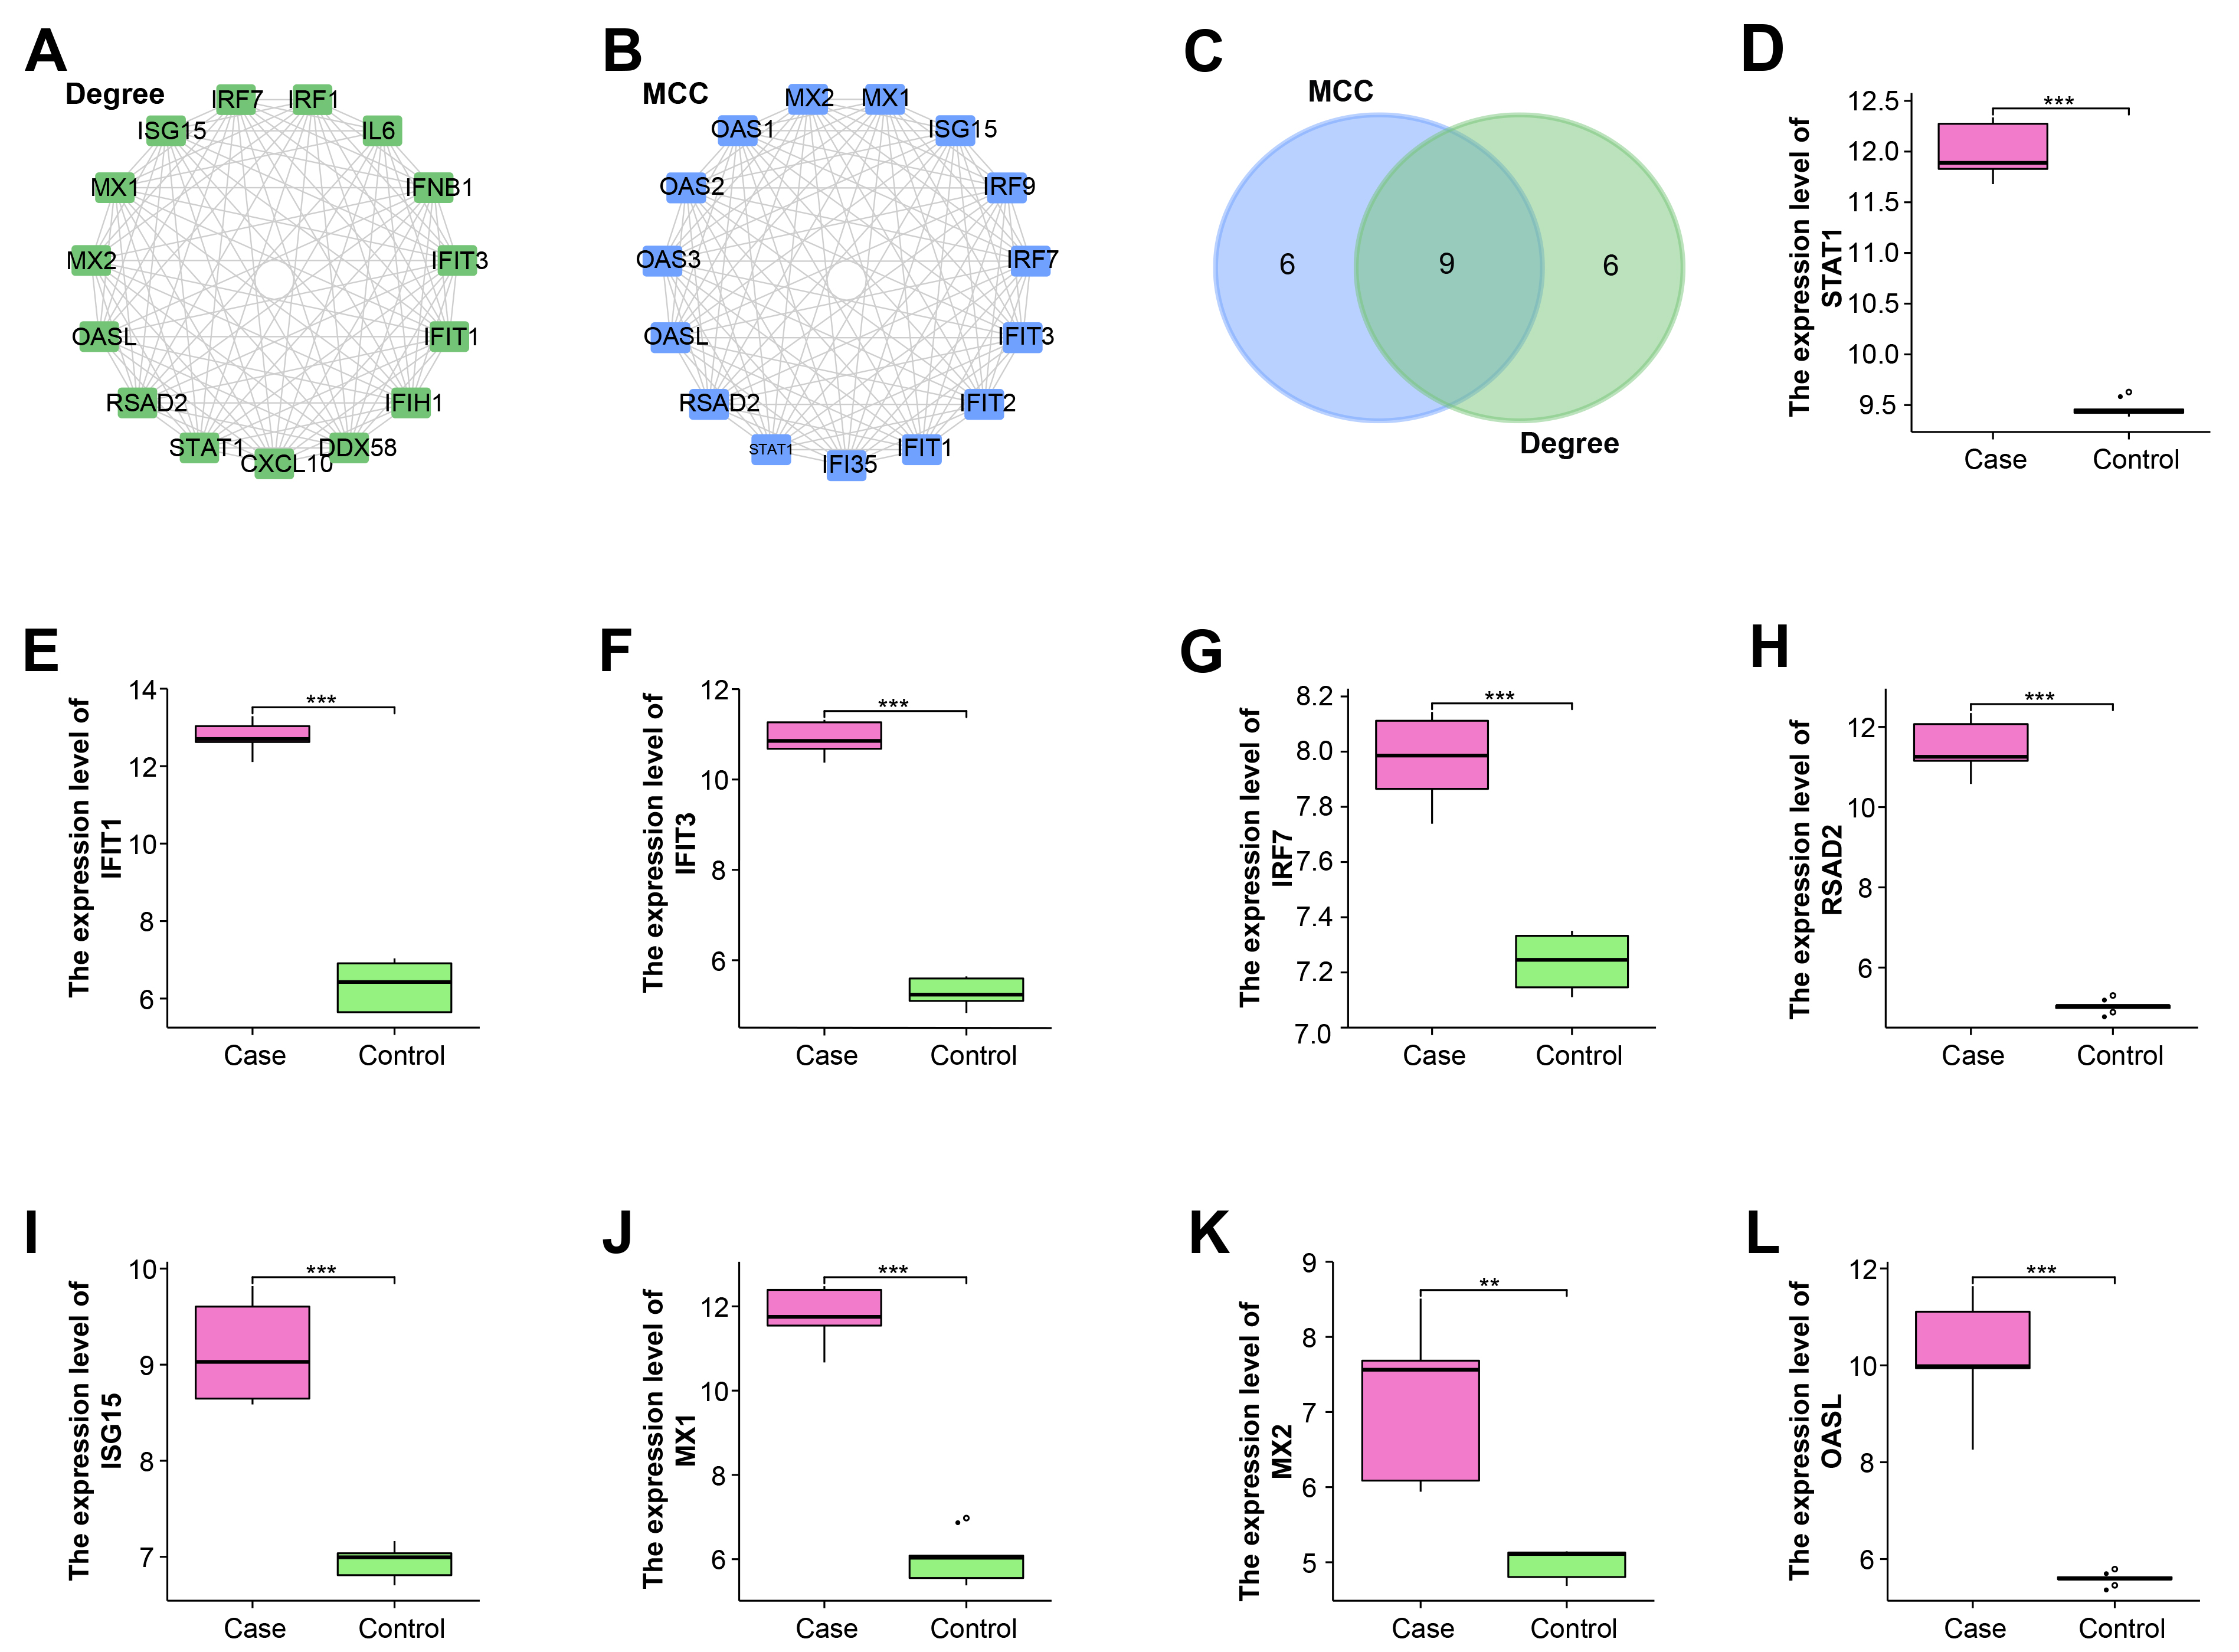 Fig. 3.
Nine hub genes are identified from protein-protein
interaction (PPI) sub-networks. (A) The sub-network of the top 15 genes
constructed by the Degree algorithm. (B) The sub-network of the top 15 genes
constructed by the Maximal Clique Centrality (MCC) algorithm. (C) Nine hub genes
identified from genes in Degree and MCC algorithms. (D–L) Hub genes are all
highly expressed in the case group of GSE30719 dataset, including (D)
STAT1. (E) IFIT1. (F) IFIT3. (G) IRF7. (H)
RSAD2. (I) ISG15. (J) MX1. (K) MX2. (L)
OASL. **p
To explore the expressions of hub genes in PRE cells, we detected the expressions of these genes in the case group and control group of the GSE30719 dataset based on the “ggplot2” package. According to the results in Fig. 3D–L, it was clearly observed that IFIT1, IFIT3, IRF7, ISG15, MX1, MX2, OASL, RSAD2, STAT1 were generally highly expressed in the case group, which indicated they were all related to WNV infection.
Through the GSEA, we performed KEGG pathway enrichment analysis on 9 hub genes, respectively (Fig. 4A–I). For instance, IFIT1 were enriched in Lysine degradation, Propionate metabolism, Butyrate metabolism and PRAR signaling pathway, and IFIT3 were related to Autoimmune thyroid disease, RIG I like receptor signaling pathway, Cytosolic DNA sensing pathway, and Glycosaminoglycan biosynthesis heparan sulfate. These signaling pathways might be involved in the molecular mechanism between these genes and WNV infection in RPE.
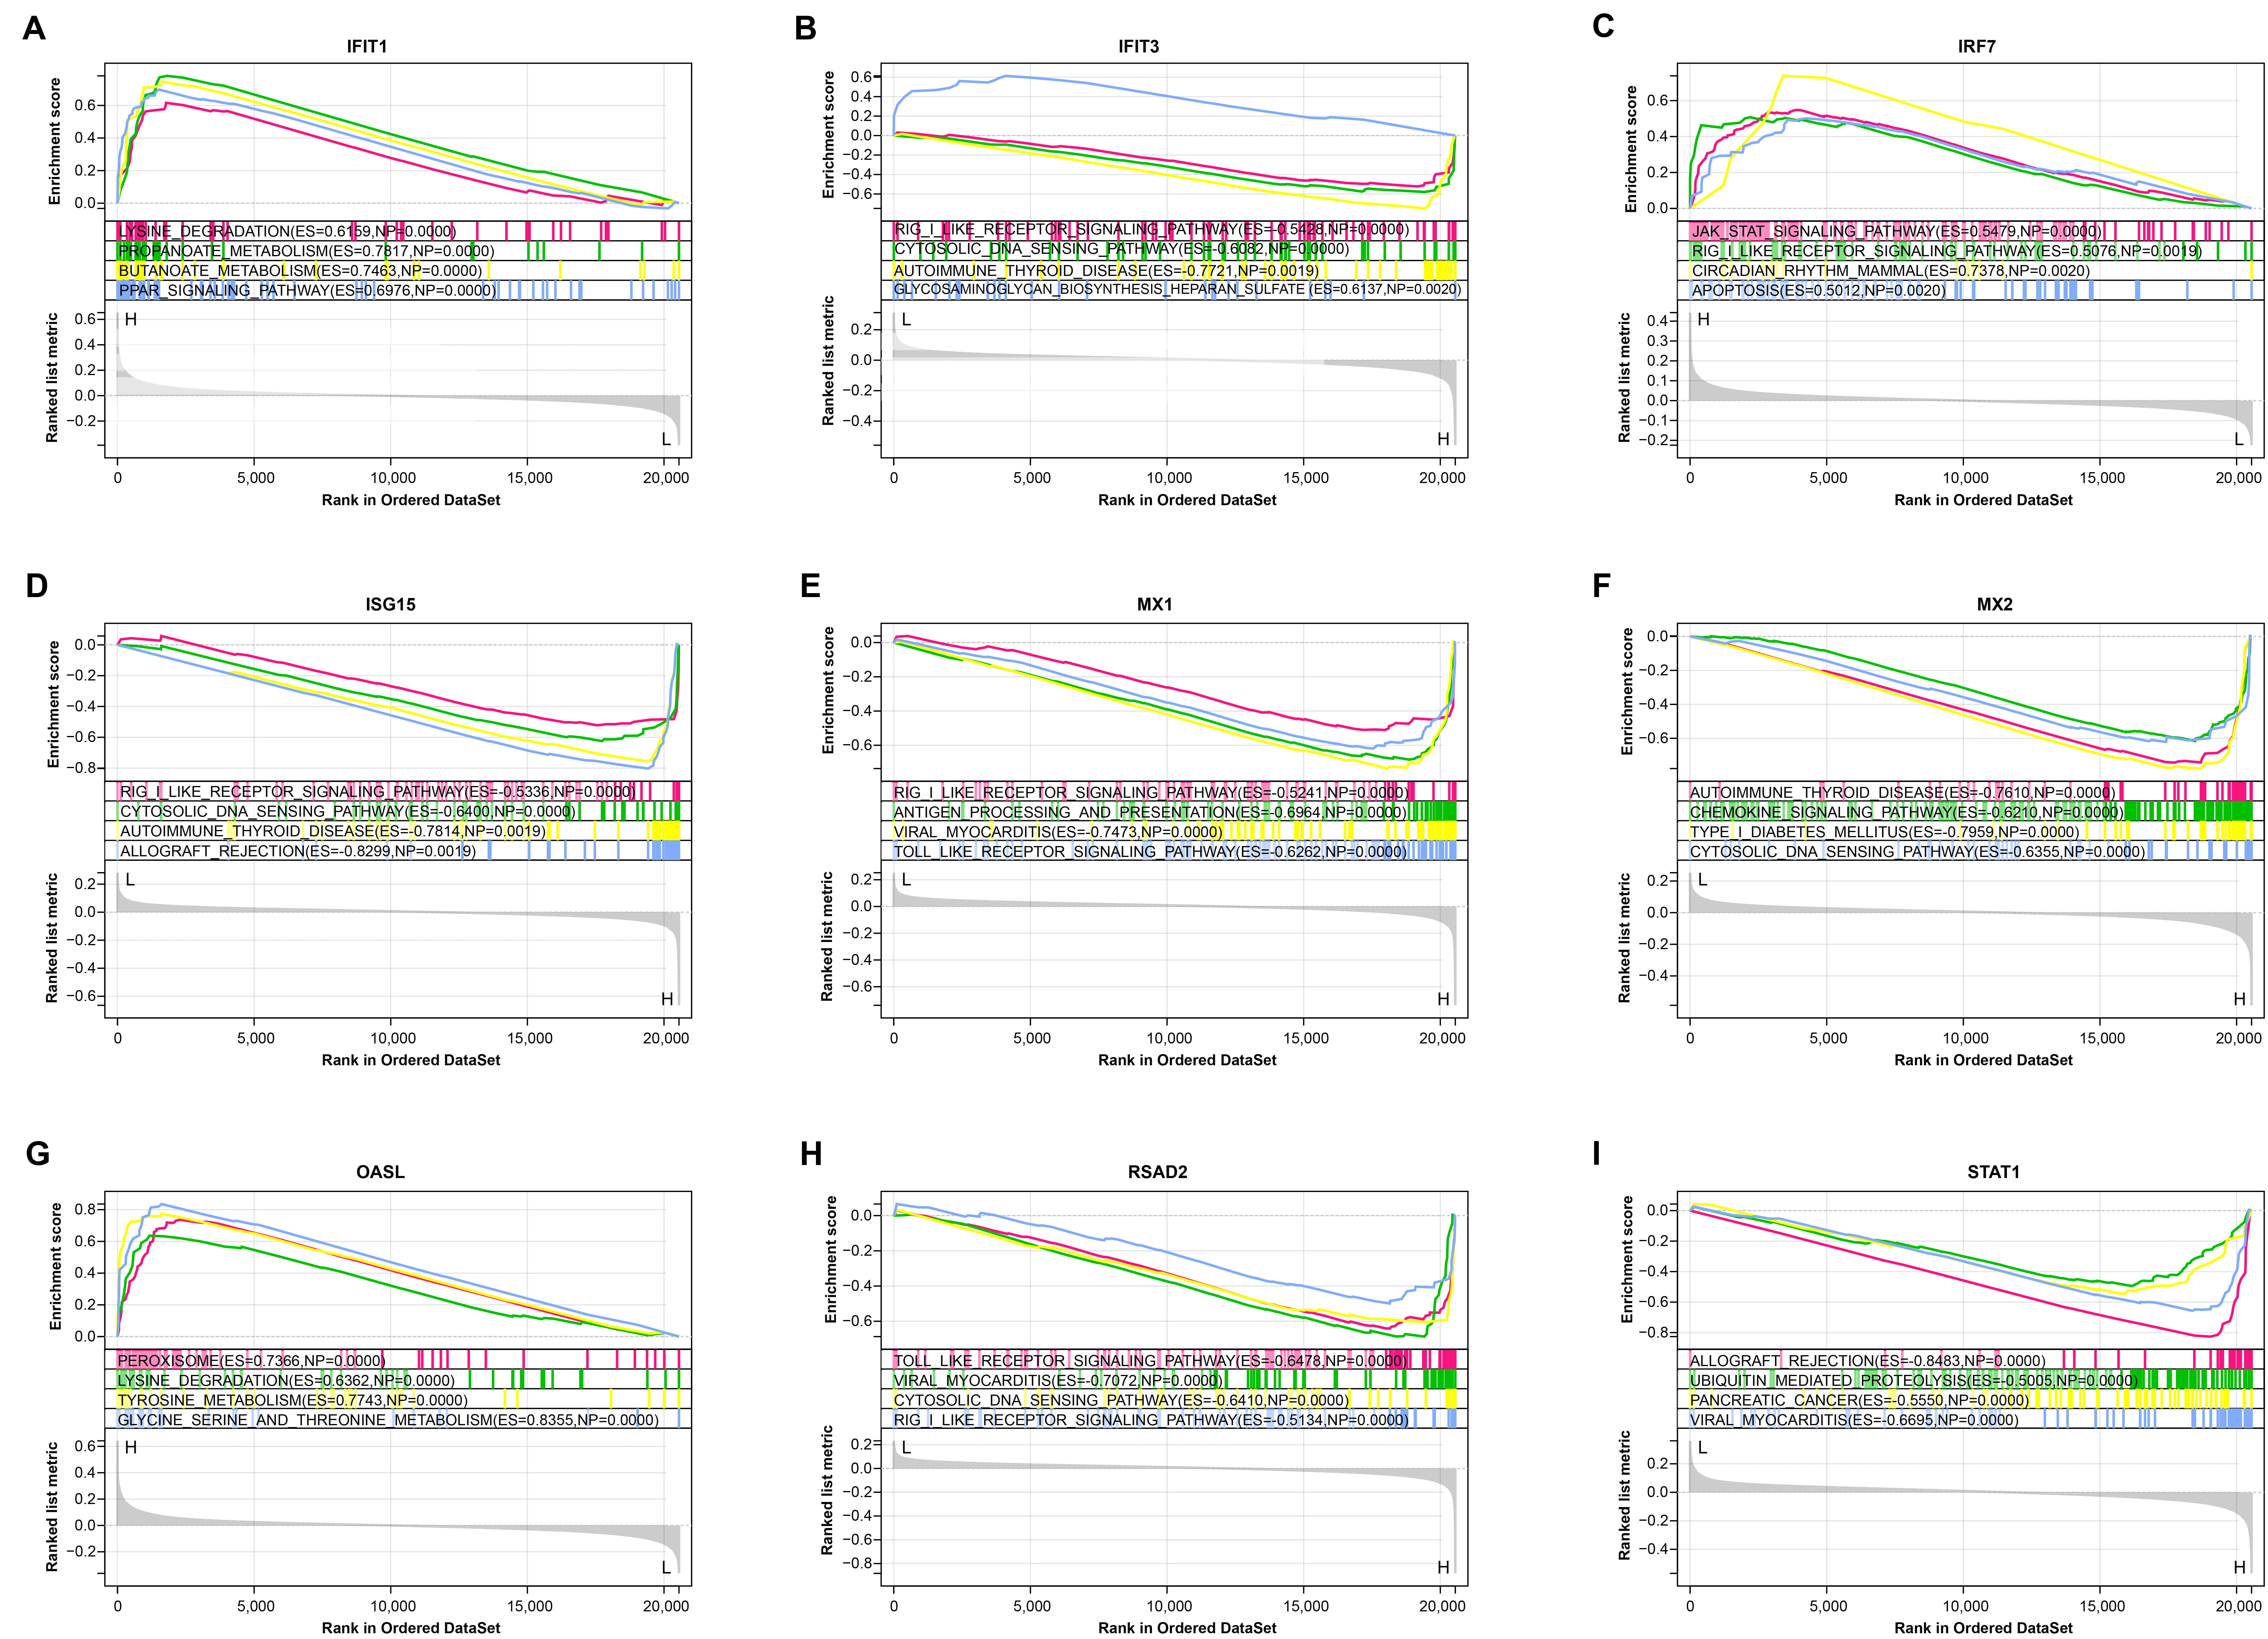 Fig. 4.
Gene set enrichment analysis (GSEA)-KEGG pathway enrichment analysis of nine hub genes. (A) IFIT1. (B) IFIT3. (C) IRF7. (D) ISG15. (E) MX1. (F) MX2. (G) OASL. (H) RSAD2. (I) STAT1.
Then, we tested the impact of Kae on RPE cells (Fig. 5A). RPE cells underwent a 6-hour exposure to LPS at a dosage of 5 µg/mL, followed by pretreatment with various concentrations of Kae (0, 5, 10, 25, and 50 µmol/L) for 24 hours. The maximum cell proliferation viability was reported at 10 µmol/L Kae in the CCK-8 assay, followed by 5 µmol/L (Fig. 5B). Flow cytometry analysis indicated a minimal apoptosis rate in cells exposed to 10 µmol/L Kae, as compared to those treated with a 5 µmol/L concentration (Fig. 5C,D). Consequently, for next tests, we chose a Kae concentration of 10 µmol/L as the ideal. Furthermore, WB results showed that the expression of pro-apoptotic protein caspase-3 was down-regulated and the expression of anti-apoptotic protein Bcl-2 was up-regulated in Kae-treated RPE cells (Fig. 5E–G). It was concluded that Kaempferol exerted a protective effect against LPS-induced RPE cell apoptosis at the optimal concentration of 10 µmol/L.
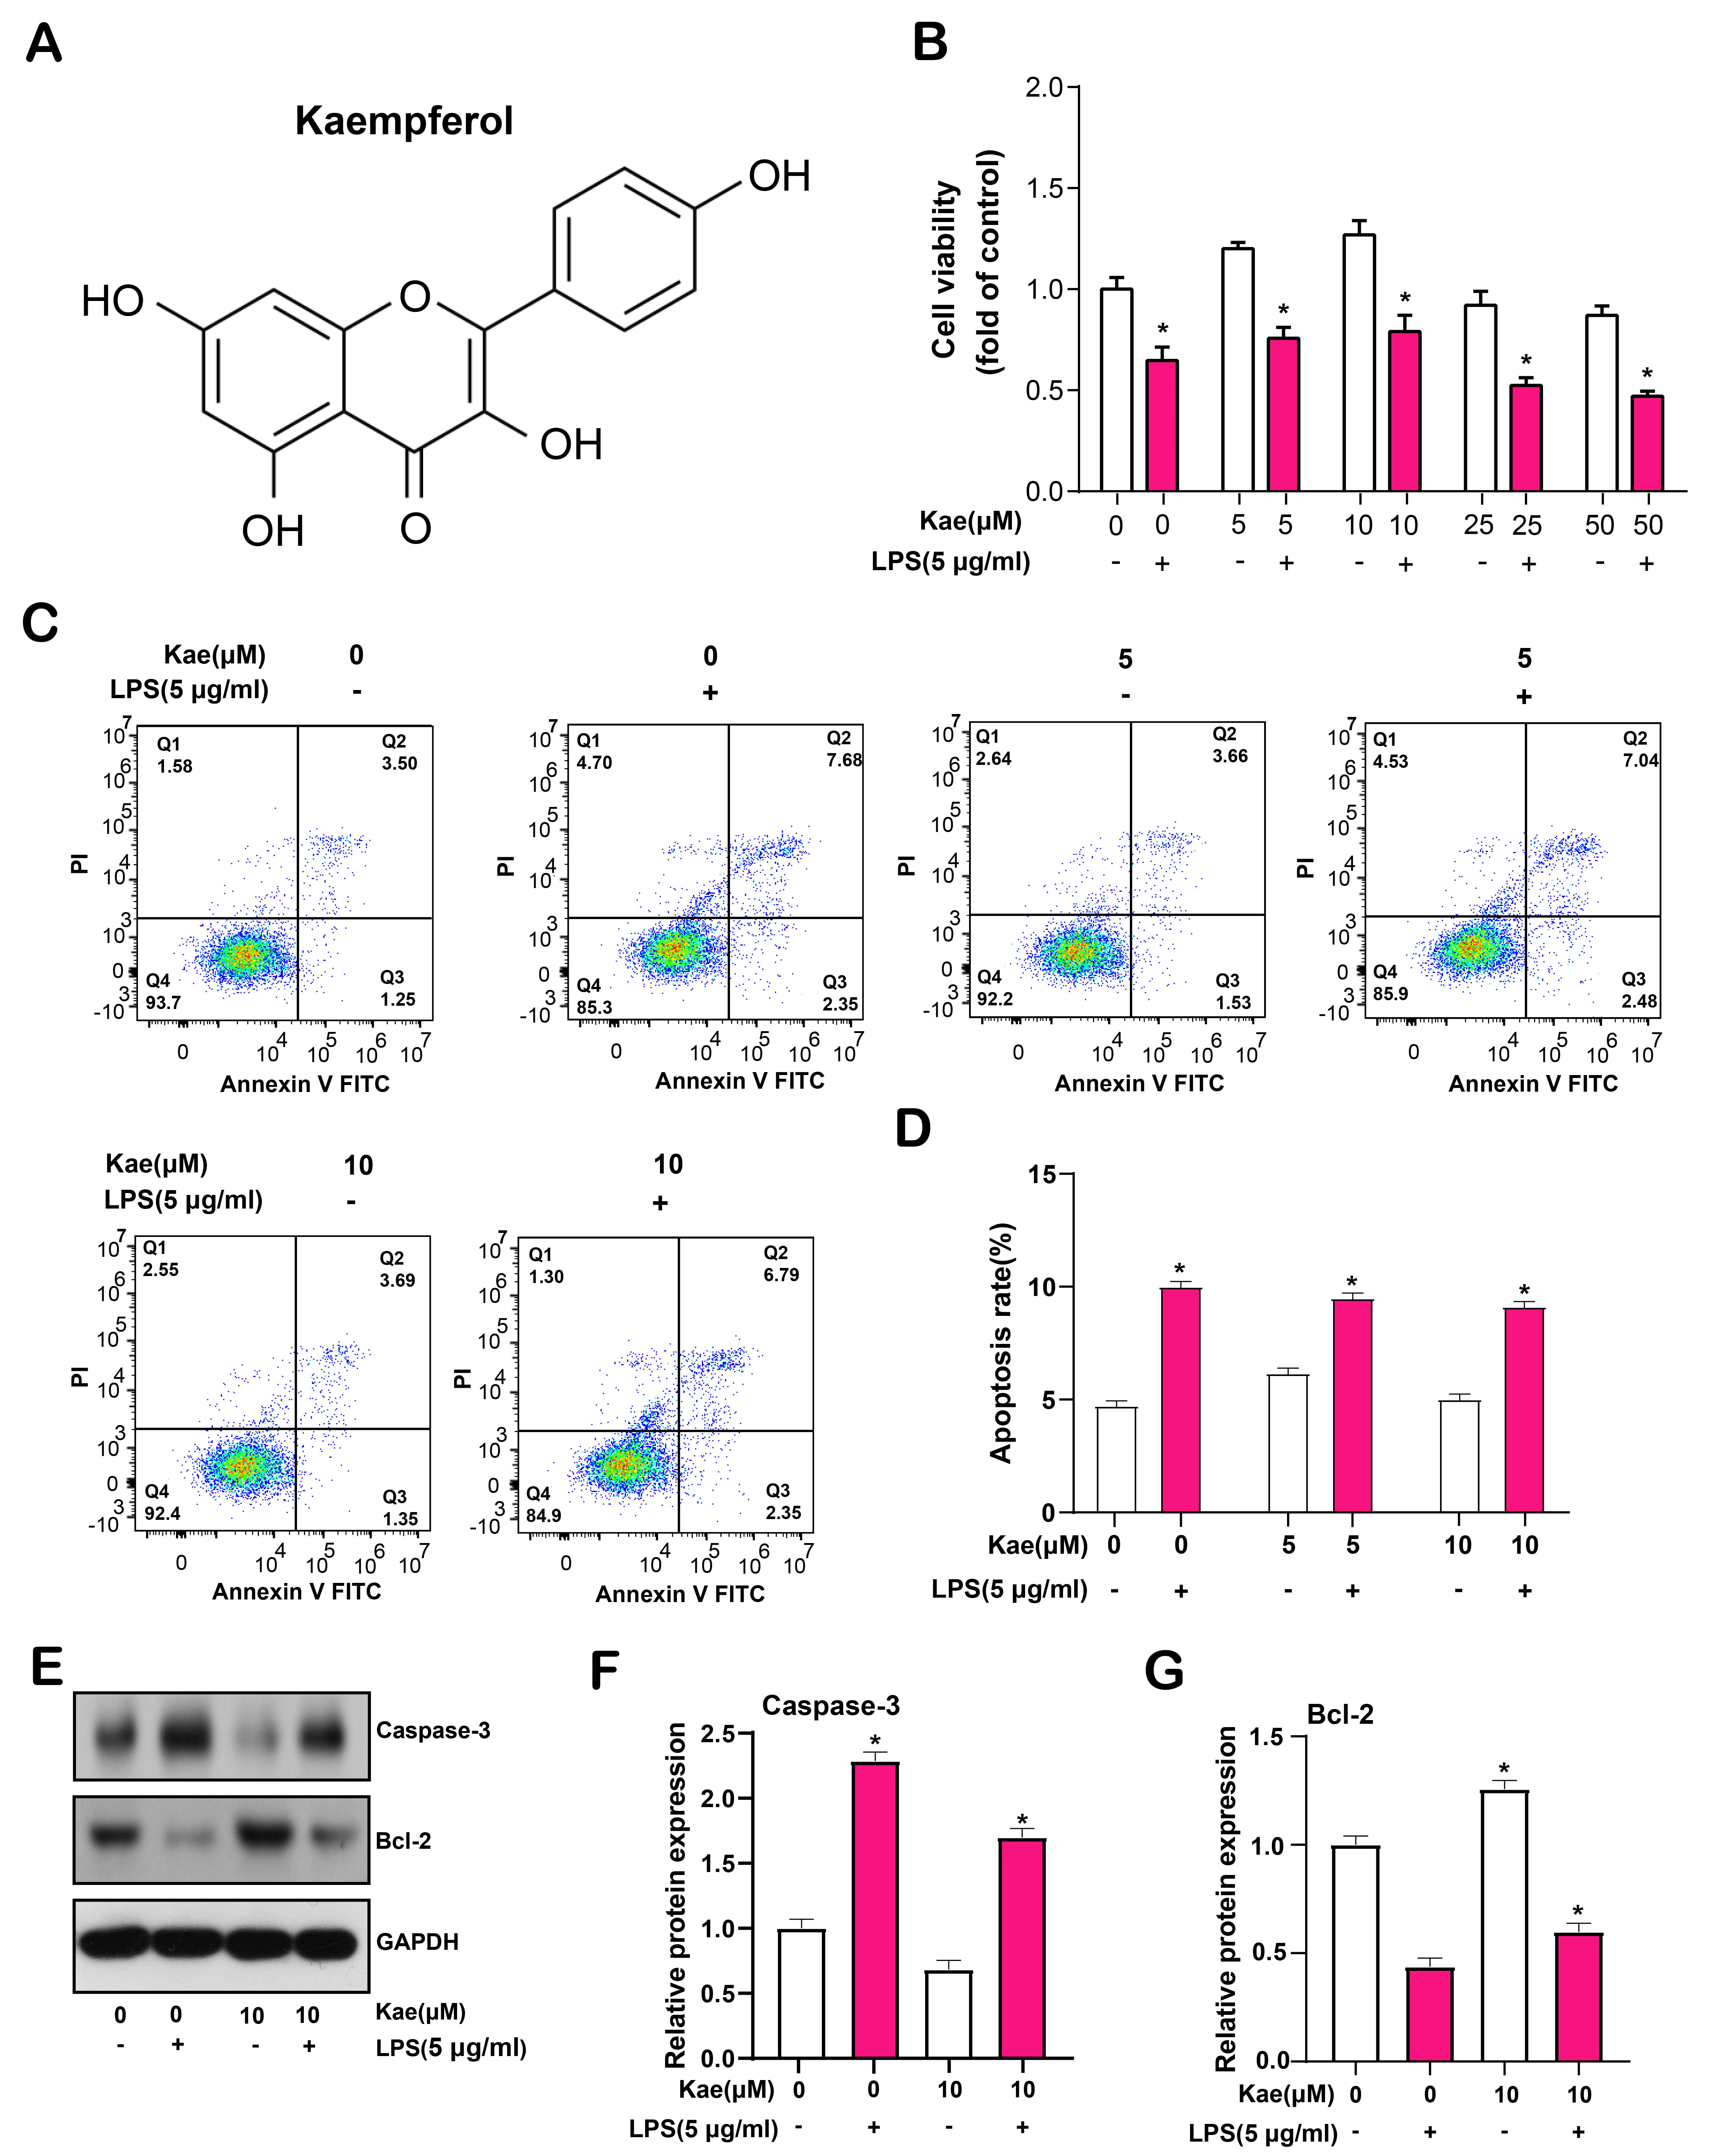 Fig. 5.
Kaempferol protects retinal pigment epithelial (RPE) cells from lipopolysaccharide
(LPS)-induced apoptosis. (A) Chemical structural formula of kaempferol. (B) Cell
Counting Kit-8 (CCK-8) was used to detect the effect of different concentrations
of Kae on the proliferation of RPE cells induced by LPS for 6 hours. (C,D) Flow
cytometry comparing the apoptosis rate of RPE cells treated with 5 µmol/L
and 10 µmol/L Kae, with the lowest apoptosis rate observed at 10
µmol/L. Quadrant Q1 represents necrotic cells (Annexin V-FITC negative,
Propidium Iodide (PI) positive), quadrant Q2 represents late apoptotic cells
(Annexin V-FITC positive, PI positive), quadrant Q3 represents early apoptotic
cells (Annexin V-FITC positive, PI negative), and quadrant Q4 represents live
cells (Annexin V-FITC negative, PI negative). (E–G) Western Blotting (WB) analysis of protein
expression levels of cleaved caspase-3 and Bcl-2 in RPE cells treated with Kae,
GAPDH as internal reference. The bar graph on the right shows the results of the
gray-scale detection of proteins. *p
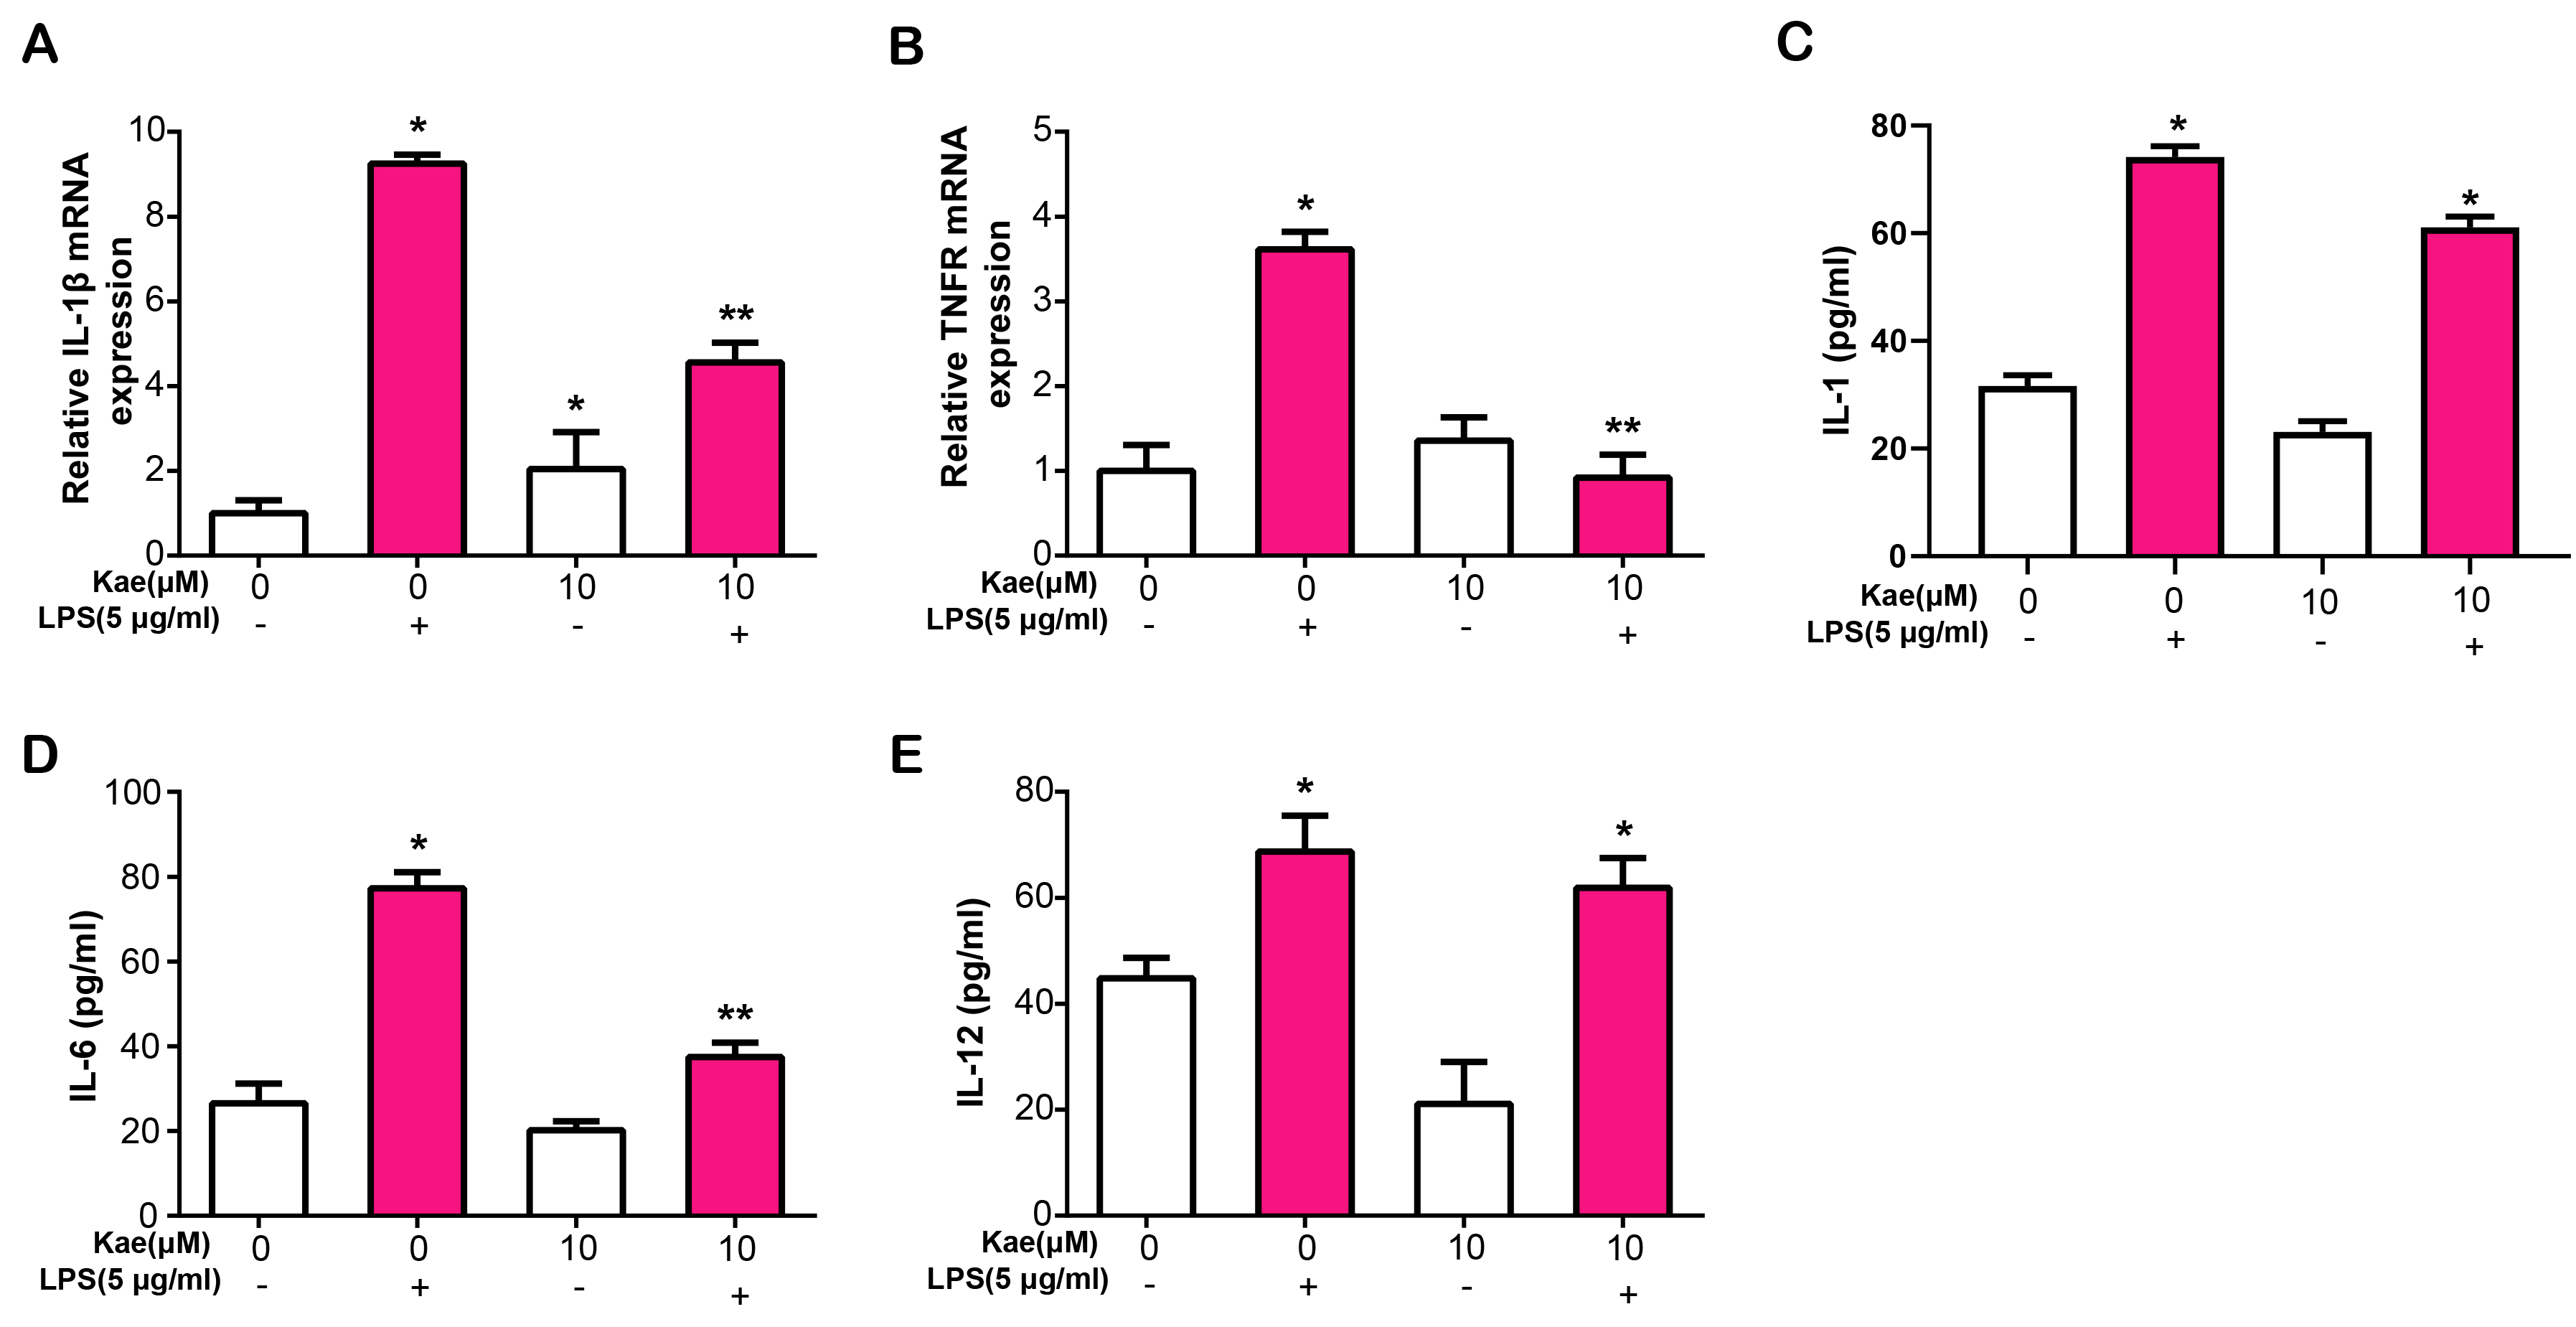
IL-1
 Fig. 6.
Kae modulates inflammatory cytokine expression and
secretion in LPS-Treated RPE cells. (A) Quantitative real-time polymerase chain
reaction (qRT-PCR) analysis of IL-1
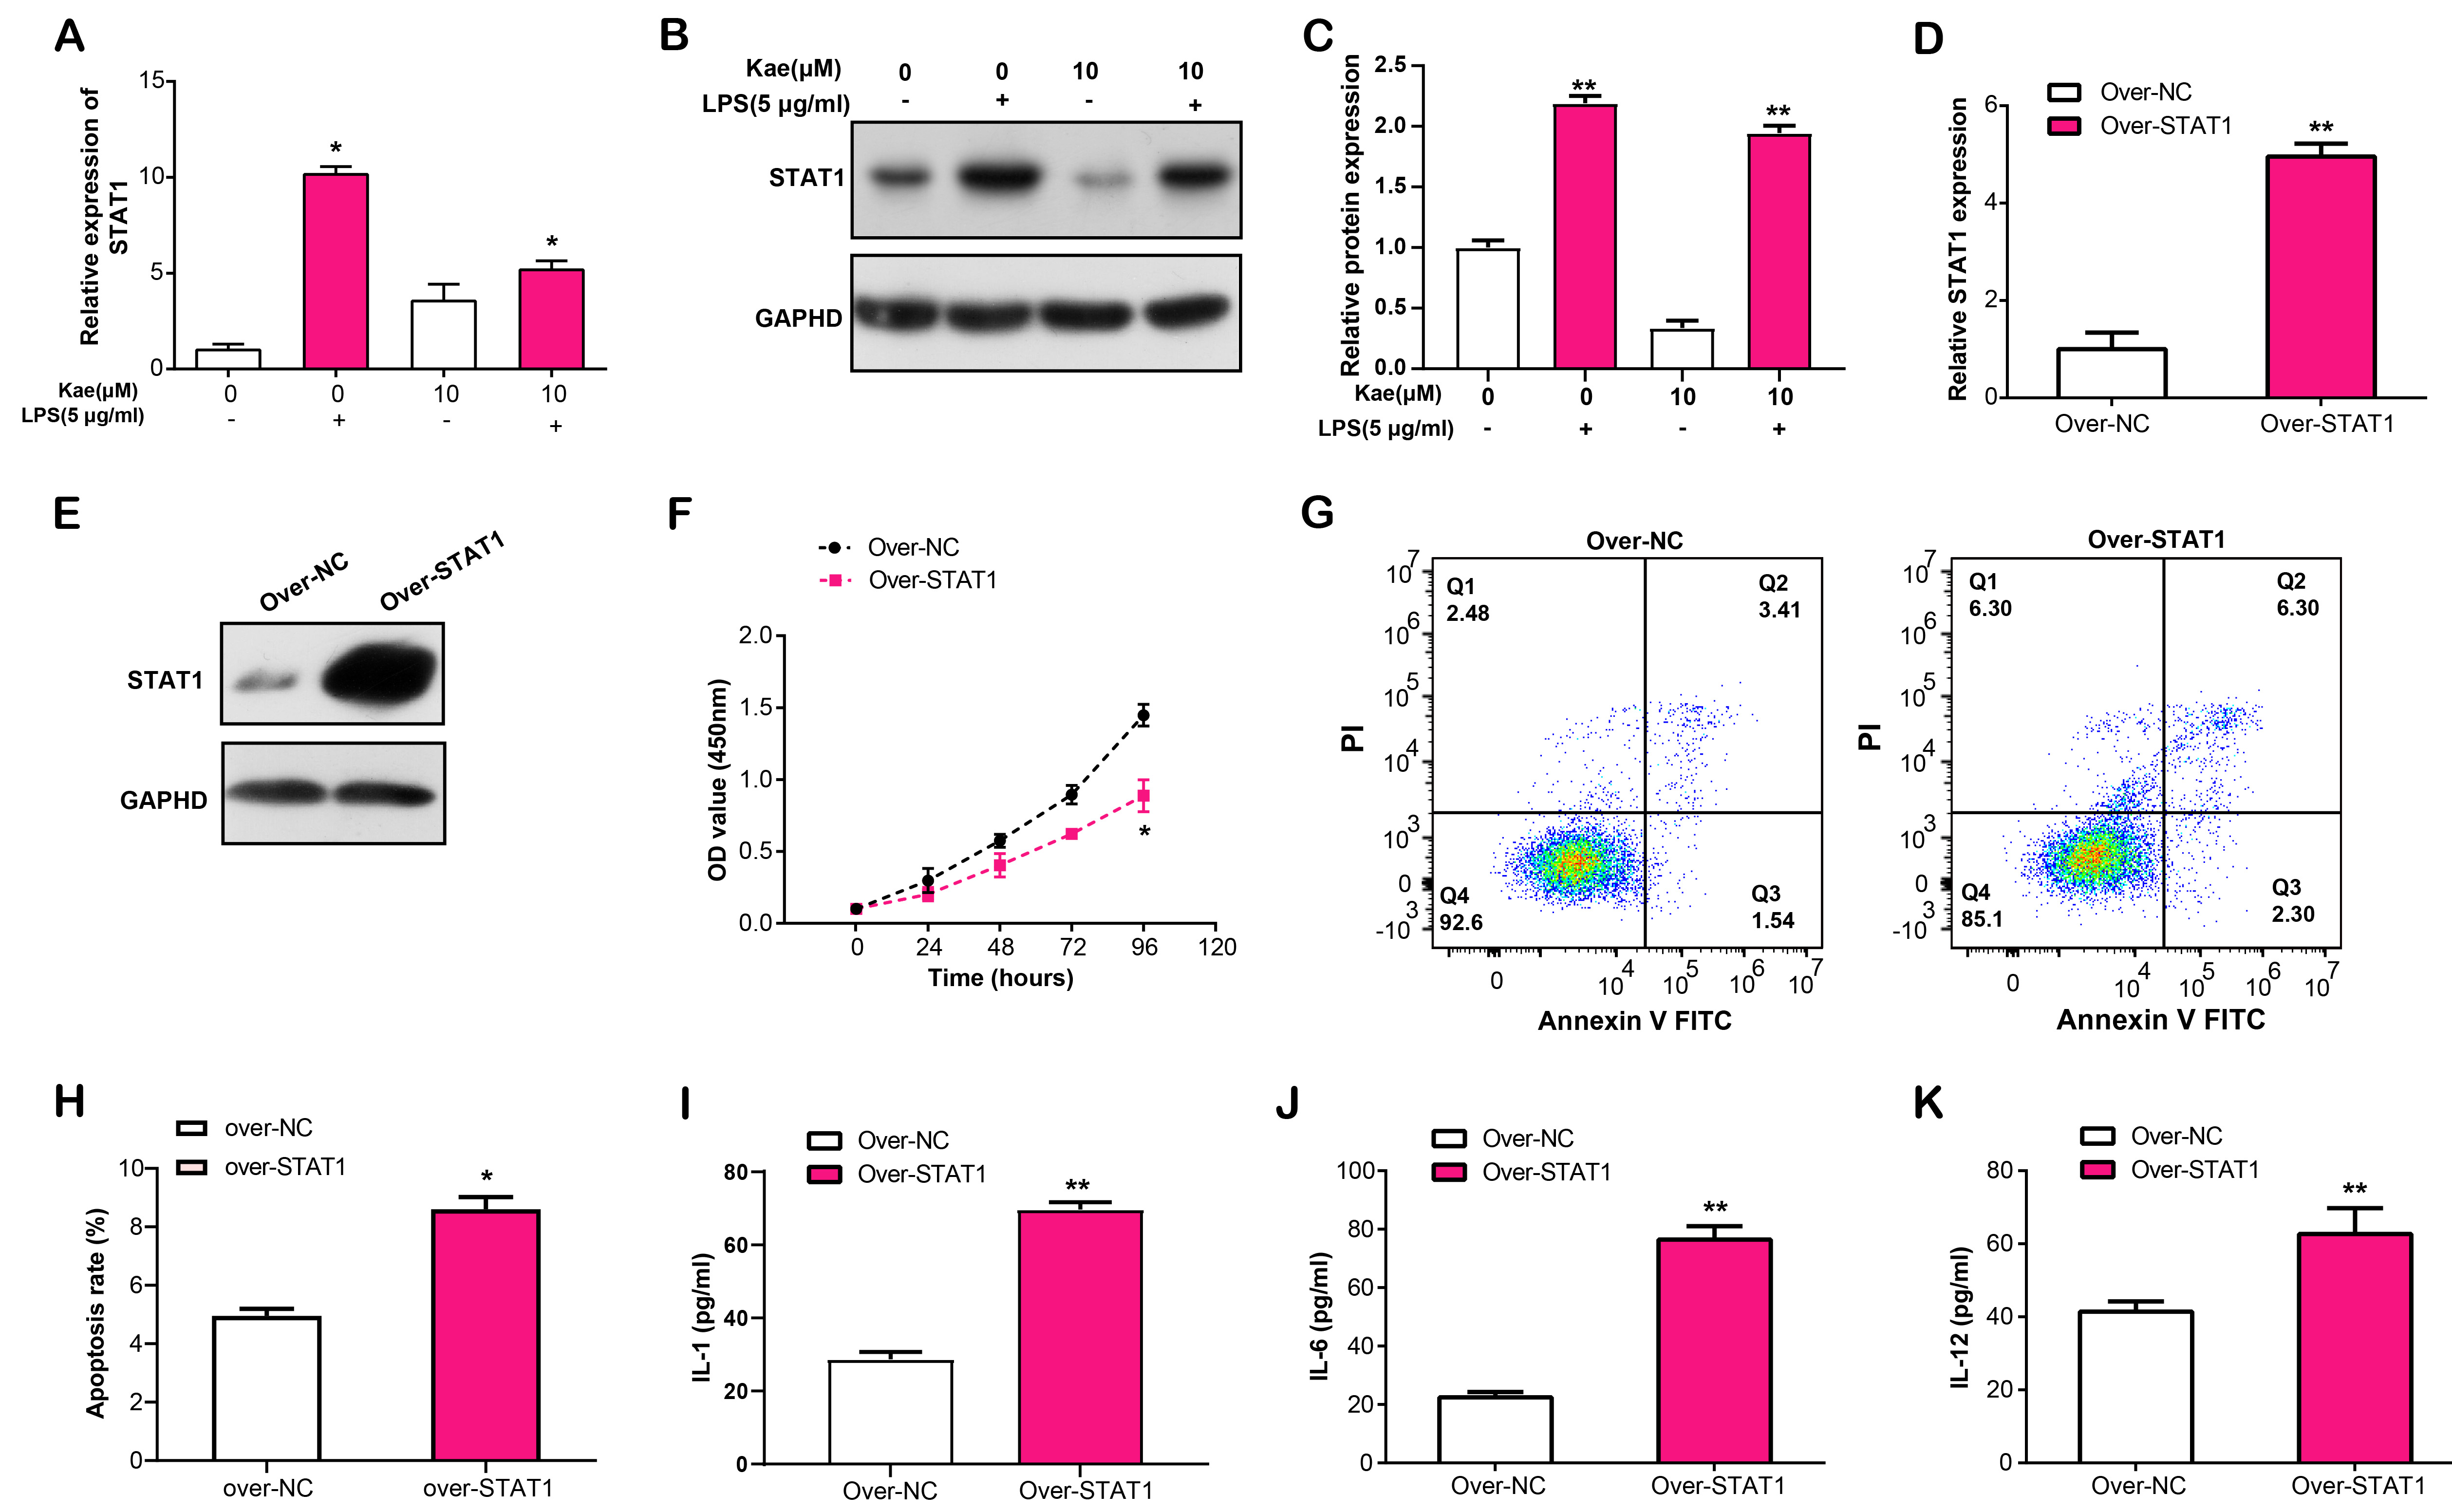
STAT1 is a transcription factor that regulates several physiological functions, such inflammation, apoptosis, and immune response [18]. This study pointed out that the identified hub gene might have an effect on the immune response and cell metabolism of RPE cell injury. In this experiment, we observed that after LPS induction of RPE cells, Kae treatment resulted in the downregulation of STAT1 mRNA expression (Fig. 7A). Further WB research revealed that LPS and Kae-treated RPE cells had lower STAT1 protein levels (Fig. 7B,C). Subsequently, we overexpressed STAT1 in RPE cells and analyzed the overexpression efficiency using qRT-PCR and WB (Fig. 7D,E). CCK-8 analysis revealed that a significant suppression in LPS-induced RPE cell proliferation with STAT1 overexpression, in comparison to the control (Fig. 7F). In contrast, flow cytometry showed that overexpression of STAT1 promoted LPS-induced apoptosis of RPE cells (Fig. 7G,H). Furthermore, ELISA analysis evaluated the effect of STAT1 overexpression on the release of IL-1, IL-6 and IL-12, three inflammatory cytokines, in LPS-stimulated RPE cells, which unveiled an enhancement in their secretion levels (Fig. 7I–K). This data suggested that STAT1 overexpression has the capacity to modulate LPS-induced RPE cell proliferation, apoptosis and inflammation-related cytokine release.
 Fig. 7.
Effects of STAT1 overexpression on the proliferation, apoptosis,
and inflammatory cytokine secretion in LPS-induced RPE cells. (A) qRT-PCR
analysis of STAT1 mRNA expression in RPE cells treated with LPS and Kae.
(B,C) WB analysis of STAT1 protein levels in RPE cells treated with LPS and Kae.
(D) qRT-PCR and (E) WB analysis of STAT1 overexpression efficiency in
RPE cells. (F) CCK-8 assay for the effect of STAT1 overexpression on
LPS-induced proliferation of RPE cells. (G,H) Flow cytometry analysis of the
effect of STAT1 overexpression on LPS-induced RPE cell apoptosis. (I–K)
ELISA analysis of IL-1, IL-6 and IL-12 secretion levels in RPE cells with STAT1
overexpression following LPS induction. *p
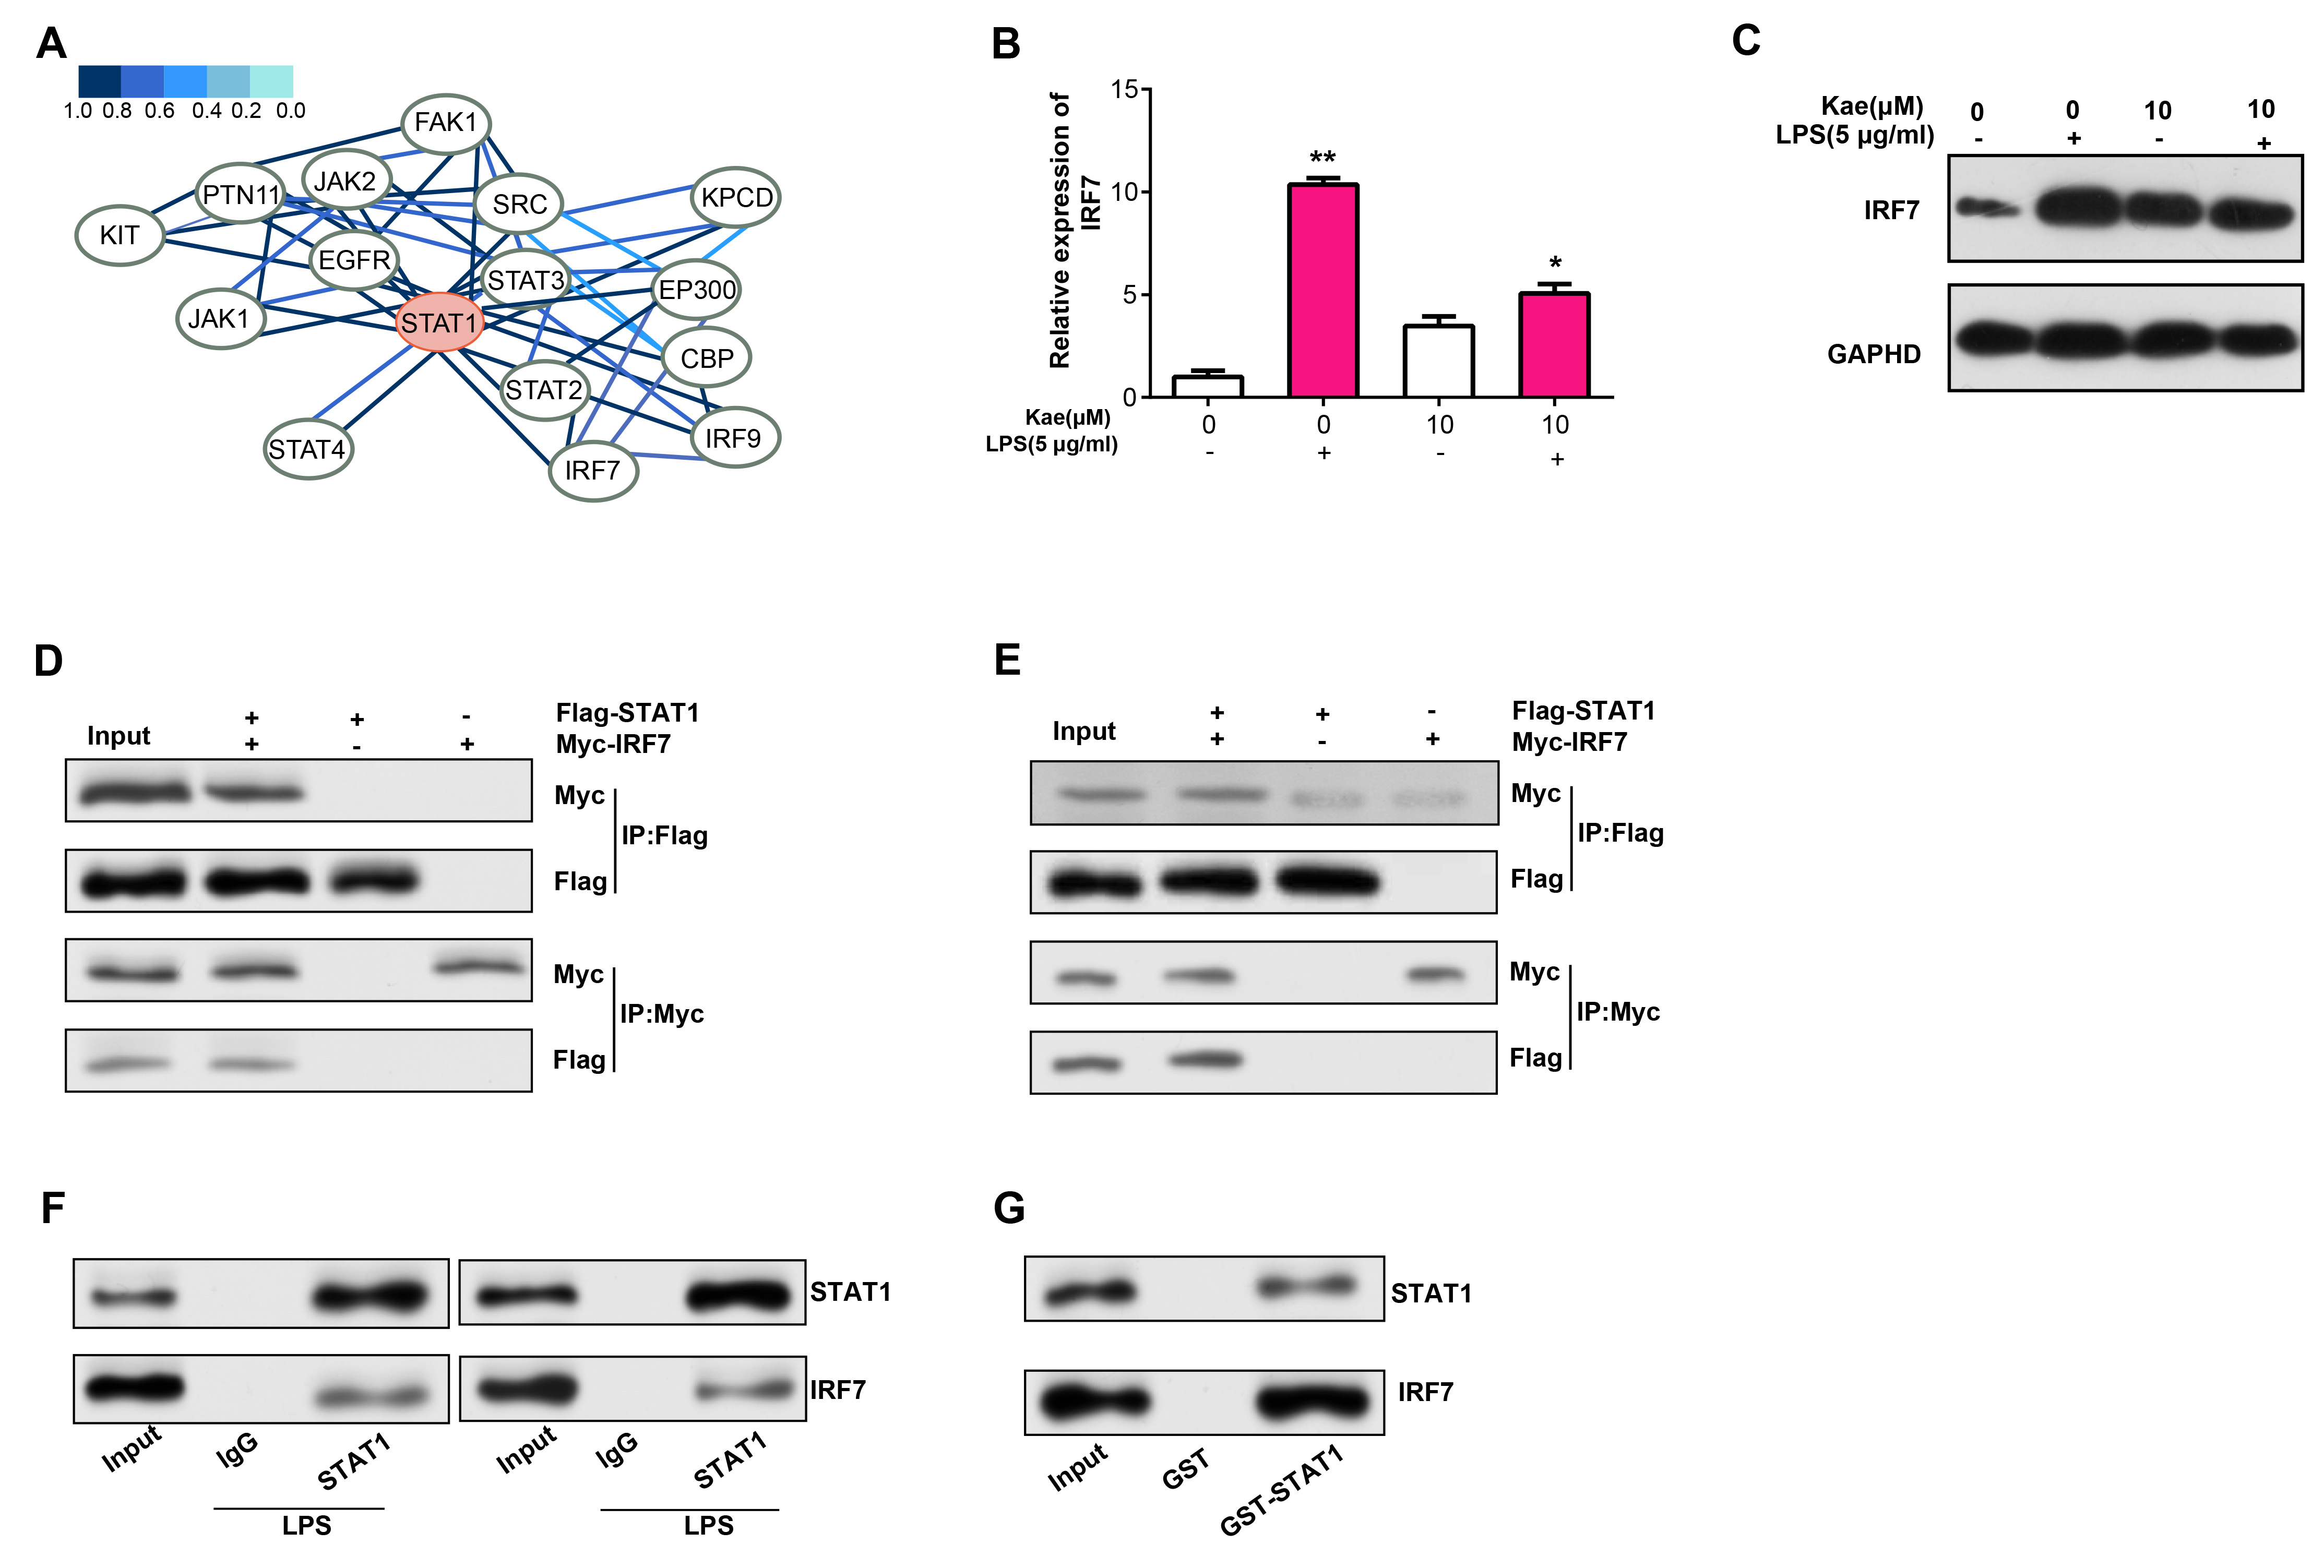
By the HitPredict database, we observed 15 proteins with potential interactions with STAT1 (Fig. 8A). IRF7, an interferon regulatory factor, not only regulates immune responses and apoptosis, but may also be involved in immune responses in RPE injury. Therefore, in this study, we selected IRF7 for further verification analysis. qRT-PCR and WB analyses detected that IRF7 mRNA and protein levels were reduced in RPE cells treated with LPS and Kae (Fig. 8B,C). The link between STAT1 and IRF7 in RPE cells was validated by both exogenous and endogenous Co-IP findings (Fig. 8D,E). Besides, the GST-pull down test findings confirmed the interaction among STAT1 as well as IRF7 in RPE cells (Fig. 8F,G).
 Fig. 8.
Interaction analysis of STAT1 and IRF7 in LPS- and
Kae-treated RPE cells. (A) PPI network depicting STAT1-interacting proteins
based on the HitPredict database. (B) qRT-PCR analysis of IRF7 mRNA
expression levels in RPE cells treated with LPS for 6 hours and pretreated with
Kae for 24 hours. (C) WB analysis of IRF7 protein expression levels in RPE cells
treated with LPS for 6 hours and pretreated with Kae for 24 hours. (D,E)
Co-immunoprecipitation (Co-IP) assay demonstrating endogenous and exogenous
interaction between STAT1 and IRF7. (F) Co-IP verifying the interaction between
STAT1 and IRF7 in RPE cells. (G) Glutathione S-Transferase (GST) pull-down assay
confirming the interaction between STAT1 and IRF7. *p
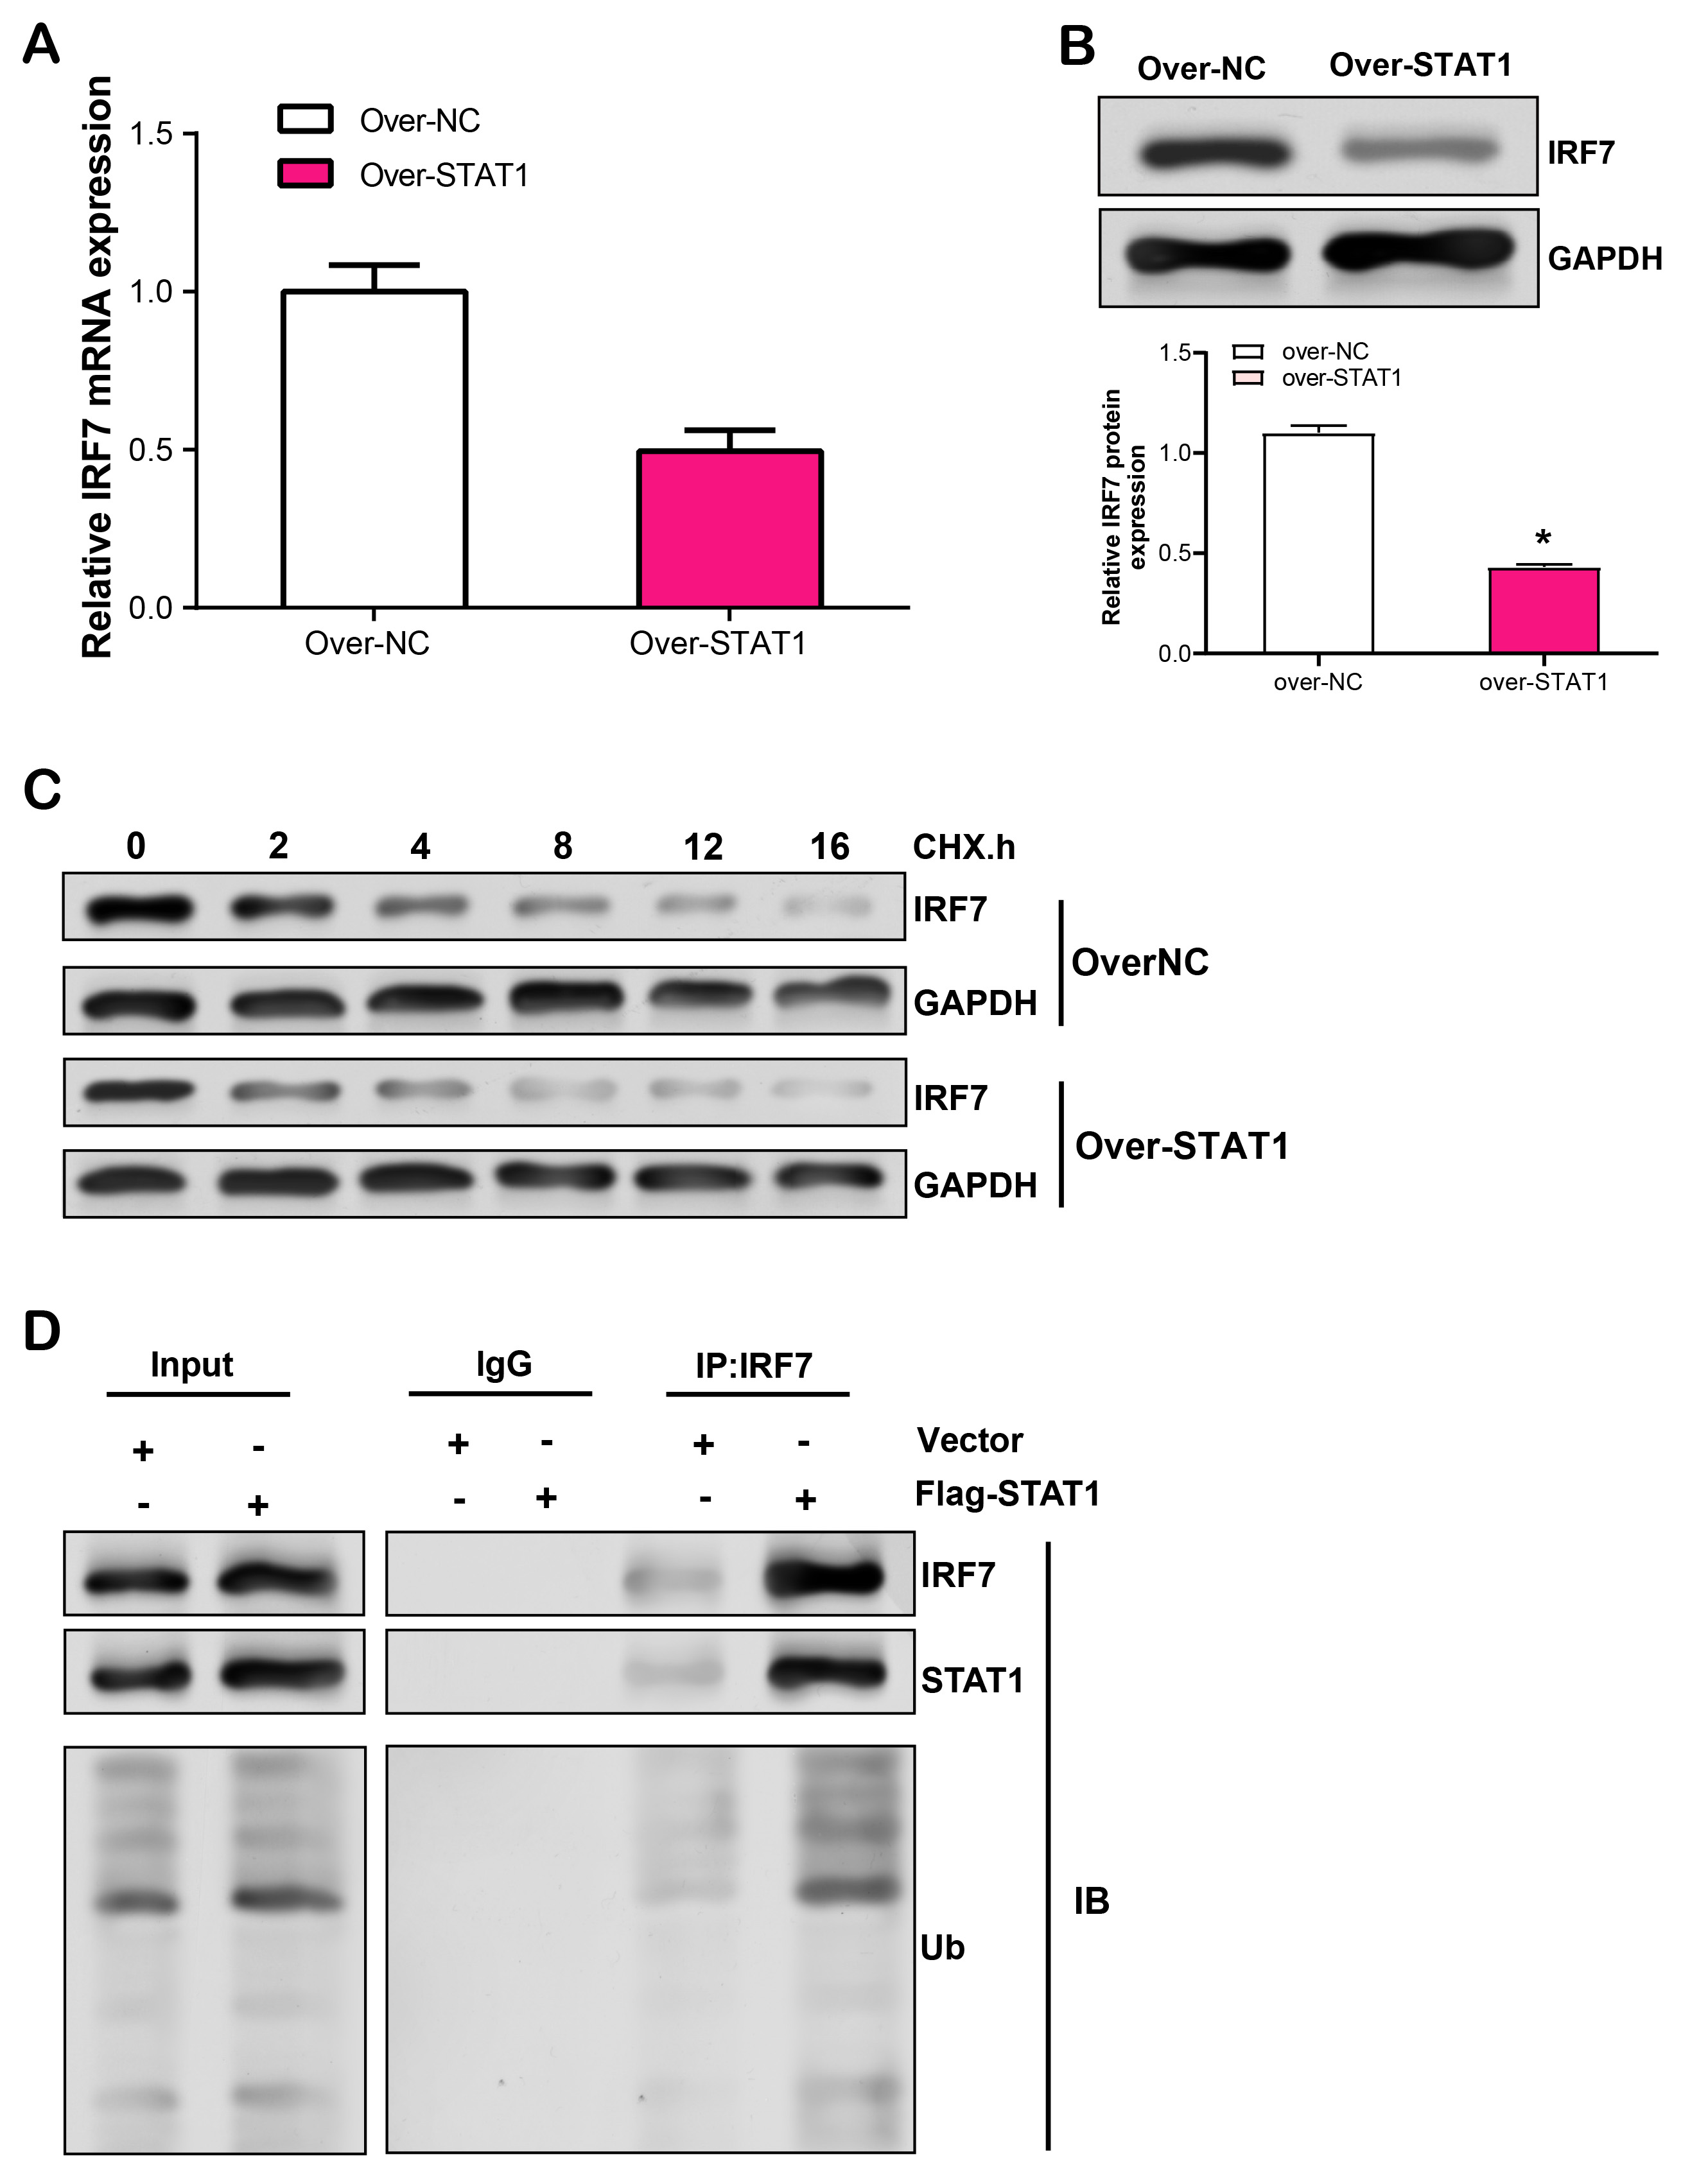
Further research was done on STAT1 and IRF7’s regulation mechanisms in RPE cells. First, we used qRT-PCR to measure the mRNA level of IRF7 in RPE cells following STAT1 overexpression and discovered that it was unaffected (Fig. 9A). However, WB analysis revealed that overexpression of STAT1 significantly upregulated IRF7 protein levels (Fig. 9B). Consequently, we postulated that the regulation of IRF7 by STAT1 at the transcriptional level was unlikely. To validate this hypothesis, we performed CHX chase analysis and MG132 treatment. In STAT1-overexpressing cells treated with CHX, the half-life of IRF7 protein was substantially shortened, indicating that STAT1 was involved in the regulation of IRF7 protein stability (Fig. 9C). Subsequently, we determined whether STAT1 induced the degradation of IRF7 by promoting its ubiquitination in RPE cells. As shown in Fig. 9D, overexpression of STAT1 significantly increased IRF7 ubiquitination levels, thereby promoting the degradation of IRF7.
 Fig. 9.
Effects of LPS-induced STAT1 overexpression in RPE cells on IRF7
mRNA expression, protein stability, and ubiquitination. (A) qRT-PCR analysis of
LPS-induced regulation of IRF7 mRNA expression level by overexpressed
STAT1 in RPE cells. (B) WB analysis of LPS-induced regulation of IRF7 protein
expression by overexpressed STATs in RPE cells. (C) WB detection of IRF7 protein
stability in LPS-induced RPE cells treated with different durations of CHX in the
control group and STAT1 overexpression group. (D) Co-IP analysis of the effect of STAT1 overexpression on
LPS-induced IRF7 ubiquitination levels in RPE cells. *p
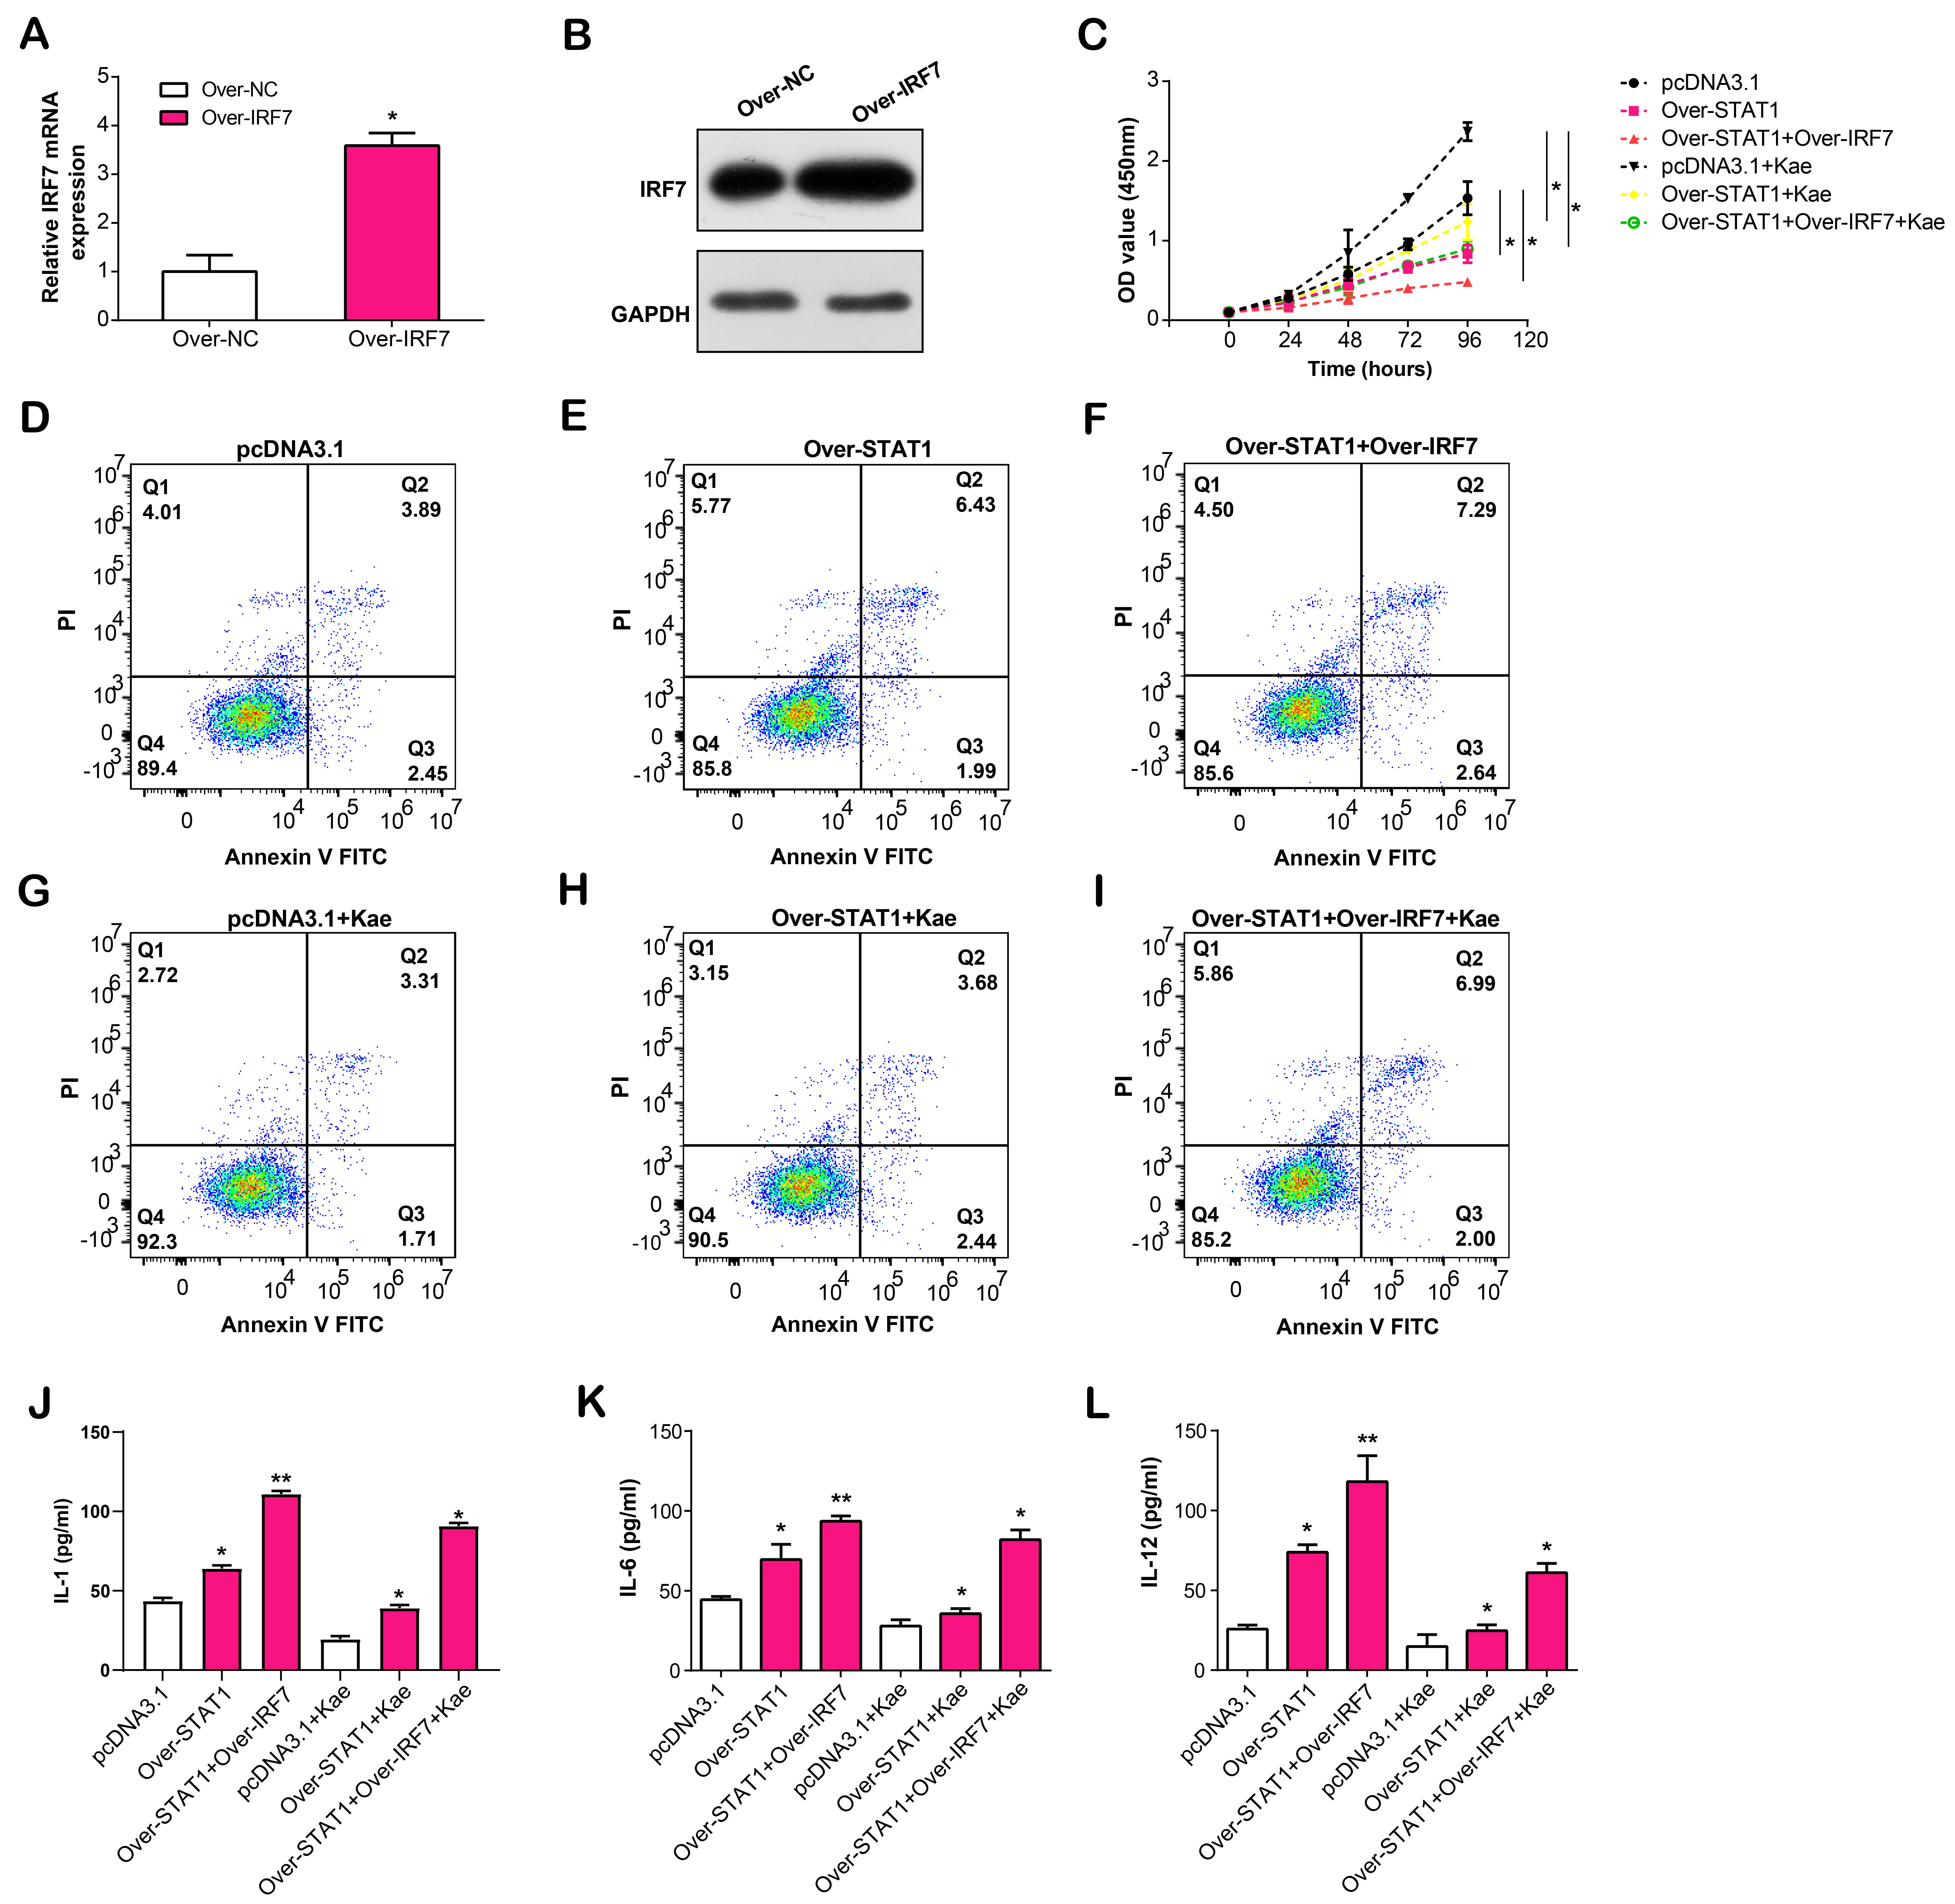
In the following experiments, we overexpressed IRF7 in LPS-induced RPE cells, confirmed by qRT-PCR and WB assays (Fig. 10A,B). To verify the regulatory effects of overexpressed STAT1 and IRF7 on LPS-induced RPE cells, we divided RPE cells into six groups, namely pcDNA3.1, over-STAT1, over-STAT1 + over-IRF7, pcDNA3.1 + Kae, over-STAT1 + Kae and over-STAT1 + over-IRF7 + Kae. CCK-8 assay revealed that RPE cells treated with Kae exhibited the highest proliferation capacity, while the simultaneous treatment of overexpressed STAT1 or IRF7 resulted in reduced proliferation capacity of RPE cells (Fig. 10C). The flow cytometry results of cell apoptosis showed the highest apoptosis rate in the over-STAT1 + over-IRF7 group, while the apoptosis rate of RPE cells decreased after Kae treatment (Fig. 10D–I). Finally, ELISA results confirmed that STAT1/IRF7 overexpression in LPS-induced RPE cells led to increased IL-1, IL-6 and IL-12 production levels in the cell culture supernatant. Following Kae therapy, IL-1/IL-6/IL-12 secretion levels were downregulated (Fig. 10J–L). Our results implied that Kae alleviates LPS-induced RPE cell injury through the STAT1/IRF7 pathway.
 Fig. 10.
Effects of STAT1/IRF7 overexpression and Kae treatment on
proliferation, apoptosis, and cytokine secretion in LPS-induced RPE cells.
(A,B) IRF7 overexpression efficiency in LPS-induced RPE cells using
qRT-PCR and WB assays. (C) CCK-8 detects the proliferation activity of
LPS-induced RPE cells after STAT1/IRF7 overexpression and Kae treatment.
(D–I) Flow cytometry detection of the regulation of apoptosis by
STAT1/IRF7 overexpression and Kae treatment in LPS-induced RPE cells.
(J–L) ELSA detection of the secretion level of IL-1, IL-6 and IL-12 in the cell
culture supernatant after STAT1/IRF7 overexpression and Kae treatment in
LPS-induced RPE cells. *p
The RPE consists of a monolayer of RPE cells that are regularly arranged and linked with the choroid by Bruch’s membrane [19]. Previous research had found RPE has a significant impact on maintaining visual function and circulation, and it can also phagocytose and reduce shed Photoreceptor Outer Segments (POS), keep visual cell renewal consistent, prevent light damage, and function as a barrier and material transport [20, 21]. Bertolotti E et al. [22] thought inherited maculopathy, age-related macular degeneration and retinitis pigmentosa were associated with impaired or loss of RPE function. Zhang D et al. [23] mentioned that atrophic changes in RPE could cause Stargardt disease, which could be prevented by c20d 3-vitamin A. In this paper, we searched for potentially hub genes and biological pathways related to RPE cell injury by GSE30719 dataset.
We constructed a gene co-expression network of all genes in the GSE30719 dataset
based on the WGCNA algorithm, and screened out the brown module with the
strongest correlation with the samples. After that, we screened the GSE30719-DEGs
dataset based on the GEO2R tool, and selected the overlapping genes combined with
genes in the key module, enriched in NOD-like receptor signaling pathway,
Influenza A, Hepatitis C, NF-kappa B signaling pathway, etc. In the study by
Michaelis M et al. [24], influenza A virus infection results in mild
conjunctivitis, often involving retinal disease, possibly inflammation of the
choriocapillaris, thus resulting in atrophy of the RPE. According to Luo S
et al. [25], the C3a-C3aR and C5a-C5aR pathways might increase the
viability and inflammatory response of RPE cells by blocking the NF-B signaling
pathway. Furthermore, the investigation of Wang K further substantiates that the
amyloid
Subsequently, we used the “ggvenn” package to perform the sub-networks of 370
intersecting genes based on the MCC and Degree algorithms, and identified 9 hub
genes from them, namely IFIT1, IFIT3, IRF7, ISG15, MX1, MX2, OASL, RSAD2, STAT1. Then, our analysis indicated a generally high expression level of these
genes in the GSE30719 dataset’s case group. The enrichment pathways of nine genes
mainly included Lysine degradation, PRAR and JAK-STAT signaling, apoptosis, and
RIG-I-like receptor signaling, among others. These genes have reportedly been
linked to retinal illnesses in earlier studies. The interferon regulatory factor
7 (IRF7), a member of the interferon-regulated transcription factor
family, participates in the transcriptional activation of cellular genes that are
susceptible to viral induction [27]. Hooks JJ et al. [28] found
that IFN-
Gram-negative bacteria’s outer membrane contains a significant amount of LPS,
that may lead to inflammation and damage to RPE cells [30]. The use of LPS to
stimulate RPE cells is a well-established model for investigating the underlying
mechanisms of ocular inflammation and degeneration [31]. In previous studies, LPS
has been shown to activate various signaling pathways, resulting in increased
production of inflammatory mediators and ultimately leading to cell apoptosis
[32]. Our research demonstrated that Kaempferol can attenuate LPS-induced RPE
cell proliferation and reduce apoptosis in RPE cells. Numerous research examining
the causes of RPE-related disorders have focused on the role of inflammatory
cytokines, including as IL-1
STAT1 is a transcription factor involved in various cellular processes, including immune responses and apoptosis [34]. It has been implicated in several ocular disorders, including uveitis and age-related macular degeneration, where dysregulated STAT1 signaling contributes to disease progression. To elucidate the role of STAT1 in LPS-induced RPE cell injury, we performed expression analysis, confirming the downregulation of STAT1 expression in LPS-induced and Kae-treated RPE cells. Overexpression of STAT1 led to increased apoptosis rates and IL-1, IL-6 and IL-12 production levels in RPE cells. These findings suggested that overexpression of STAT1 promotes LPS-induced RPE cell apoptosis and exacerbates inflammation. Our study not only highlights the importance of STAT1 in LPS-induced RPE cell injury and inflammation, but also highlights the potential of Kae as a regulator of STAT1 expression and attenuation of LPS-induced RPE cell injury. This provided valuable insights into understanding the regulatory mechanism of STAT1 in RPE cells and developing novel therapeutic strategies targeting STAT1.
To further investigate the mechanisms of STAT1 in LPS-induced RPE cell
injury, we utilized the HitPredict database to construct a PPI network for STAT1,
which identified 15 potential interacting proteins. Among these candidates, we
selected IRF7 for further analysis. IRF7 is a key transcription factor
that controls inflammatory and immunological responses [35]. Previous researches
have reported its function in various diseases, including autoimmune disease and
viral infections, where dysregulation of IRF7 signaling contributes to
pathogenesis [36]. In the article by Wu M et al. [37], IRF7
interacts with Smad3 in systemic sclerosis skin. Moreover, upregulation
of IRF7 is also associated with excessive inflammation and fibrosis
[37]. As a key regulator of systemic lupus erythematosus, IFN-
Our research showed that after LPS induction along Kae treatment, IRF7 expression was downregulated within RPE cells. STAT1 and IRF7 interacted in co-IP as well as GST pull-down tests, suggesting their potential cooperative role in modulating LPS-induced RPE cell injury. Subsequent experiments showed that, in LPS-induced RPE cells, overexpression of STAT1 did not affect the mRNA levels of IRF7 but inhibited its protein expression. Furthermore, STAT1 was found to maintain IRF7 levels through deubiquitination. Finally, using CCK-8, flow cytometry, and ELISA assays, we confirmed that Kae could inhibit LPS-induced RPE cell damage via the STAT1/IRF7 axis. These findings highlighted the functional interplay between STAT1 and IRF7 in modulating LPS-induced RPE cell injury and Kae might be used as a form of therapy for RPE-related ocular disorders.
To sum up, we investigated possible therapeutic efficacy of Kae in RPE cells using in vitro tests. Our findings demonstrated that Kae not only attenuates LPS-induced RPE cell apoptosis but also reduces inflammatory cytokine production in LPS-induced RPE cells. Combined with the bioinformatics analysis, STAT1 promotes RPE cell apoptosis and inflammation in response to LPS. Moreover, Kae appears to act in conjunction with the STAT1/IRF7 axis in modulating LPS-induced RPE cell injury. Collectively, these results shed important light on Kae’s protective effects on RPE cells and lay the foundation for further investigation into its potential applications in the treatment of RPE-related ocular diseases.
The datasets used and/or analyzed during the current study are available from the corresponding author upon reasonable request.
HZ and JJ designed the research study. HZ, YG and CL performed the research. YG and CG provided help and advice on the ELISA experiments. CL analyzed the data. All authors contributed to editorial changes in the manuscript. All authors read and approved the final manuscript. All authors have participated sufficiently in the work and agreed to be accountable for all aspects of the work.
Not applicable.
Not applicable.
This research received no external funding.
The authors declare no conflict of interest.
References
Publisher’s Note: IMR Press stays neutral with regard to jurisdictional claims in published maps and institutional affiliations.