


1 Department of Otorhinolaryngology, Head and Neck Surgery, The Affiliated Lihuili Hospital of Ningbo University, 315040 Ningbo, Zhejiang, China
2 Department of Otorhinolaryngology, Head and Neck Surgery, Ningbo NO.2 Hospital, 315010 Ningbo, Zhejiang, China
Abstract
Background: Uncontrolled cellular proliferation may result in the
progression of diseases such as cancer that promote organism death. Programmed
cell death (PCD) is an important mechanism that ensures the quality and quantity
of cells, which could be developed as a potential biomarker for disease diagnosis
and treatment. Methods: RNA-seq data and clinical information of
nasopharyngeal carcinoma (NPC) patients were downloaded from the Gene Expression
Omnibus (GEO), and 1548 PCD-related genes were collected. We used the “limma”
package to analyze differentially expressed genes (DEGs). The STRING database was
used for protein interaction analysis, and the least absolute shrinkage and selection operator (Lasso) and support vector machines
(SVMs) regression analyses were used to identify biomarkers. Then, the timeROC
package was used for classifier efficiency assessment, and the “CIBERSORT”
package was used for immune infiltration analysis. Wound healing and transwell
migration assay were performed to evaluate migration and invasion.
Results: We identified 800 DEGs between our control and NPC patient
groups, in which 59 genes appeared to be PCD-related DEGs, with their function
closely associated with NPC progression, including activation of the PI3K–Akt,
TGF-
Keywords
- programmed cell death (PCD)
- nasopharyngeal carcinoma (NPC)
- differentially expressed genes (DEGs)
- FN1
- MUC1
Nasopharyngeal carcinoma (NPC) is a relatively rare squamous cell carcinoma that arises from the epithelium of the nasopharynx and is histologically distinct from most epithelial head and neck cancers [1, 2]; it often presents as a typically undifferentiated histologic subtype associated with Epstein–Barr virus (EBV) infection. Meanwhile, NPC is distinct for its unique geographical distribution, whereby approximately 70% of newly diagnosed cases are in Southeast Asia and North Africa. Comparatively, these noted high incidence rates of 11.6 per 100,000 are rare in the United States and Western Europe (only 0.5–2 per 100,000); the International Cancer Agency reported 129,079 new cases and 72,987 deaths from NPC worldwide in 2018 [3]. Increasingly, more studies have revealed that the complex pathogenesis of NPC is influenced by diverse factors, such as gene susceptibility [4] and environmental factors (alcohol consumption and smoking) [5]. Due to their high radio- and chemo-sensitive properties, single radiotherapy or combined chemo- and radiotherapy treatments are currently the main options for patients with early-stage or locally advanced NPC [6]. The combined chemo-radiotherapy generates a satisfying 5-year survival rate (0.85–0.9) for early-stage I patients [7], but there are still 8–10% of patients suffering from tumor recurrence and metastasis after primary treatment. In addition, the World Health Organization (WHO) subdivides NPC into three characteristically histological subtypes: basaloid, non-keratinizing (undifferentiated), and keratinizing squamous cell carcinoma, which are clinically diverse in presentation and treatment response. The high recurrence rate and incompatibility of chemotherapy lead to the unsatisfactory prognosis of terminal patients [8]; thus, it is crucial and necessary to discover new therapeutic targets for improving the survival rate and life quality of NPC patients.
Programmed cell death (PCD), including apoptosis, necroptosis, autophagy,
pyroptosis, and ferroptosis formation, is characterized by a series of
morphological changes in cell structure and enzyme-dependent biochemical
processes, leading to the clearance of cells from the body with minimal tissue
damaging [9]. These processes are consistent with Glucksmann’s hypothesis that
“cell death is requisite for the organism growth and death”, and mounting
evidence shows that PCD is crucial for development and homeostasis [10]. PCD can
be triggered by DNA damage, uncontrolled cell proliferation, hypoxia, therapeutic
drugs, and hormonal release, and some diseases such as Parkinson’s, Alzheimer’s,
and spinal muscular atrophy; moreover, the loss of PCD might cause carcinogenesis
due to a failure in abiding cell cycle checkpoints, demonstrating its importance
for cell population and defense against disease [11]. Therefore, PCD may be a
necessary disease-related phenotype and has been considered an important target
in disease diagnosis and drug development for cancer in recent decades. For
example, as an antioxidant, curcumin regulates the reactive oxygen species (ROS)
levels and mediates apoptosis by upregulating p53 [12]. Meanwhile, some studies
have indicated that several types of cancer present chemoresistance due to
aberrant apoptosis [13], such as the overexpression of miRNA-34a and miR-141 in
breast cancer cells that are resistant to docetaxel through suppressing apoptosis
[14]. Furthermore, Qiao et al. [15] revealed that the choline
acetyltransferase inhibitor 2-(
In the present study, we obtained normal and nasopharyngeal carcinoma tissue samples and analyzed the differentially expressed genes (DEGs) in these groups. Subsequently, the PCD-related DEGs produced from the intersection of DEGs and PCD genes, the protein interaction network, and two machine learning algorithms (least absolute shrinkage and selection operator (Lasso) and support vector machines (SVMs)) identified FN1 and MUC1 as reliable biomarkers in NPC patients. Their expression levels could indicate the immune infiltrating state and the activation of cancer-related pathways; FN1 is also a crucial factor in mediating cell migration and invasion. Finally, we characterized potential target drugs for FN1 and MUC1, including medroxyprogesterone acetate and 8-Bromo-cAMP.
A dataset (GSE12452) for nasopharyngeal carcinoma (NPC) patients was obtained from the Gene Expression Omnibus (GEO, https://www.ncbi.nlm.nih.gov/geo/) and filtered to include 10 normal samples and 31 NPC tissue samples as the training set (GEO-NPC). Additionally, three normal and 25 NPC-related samples from the GSE13597 dataset were screened as validation sets. The “prcomp” function in the “stats” R package (version 4.3.3) was used for principal component analysis (PCA) with a 95% confidence interval, and the abnormal outlier samples were eliminated. A total of 1548 programmed cell death-related genes (PCD-RGs) were obtained from a previous article [17].
The “limma” R package (version 3.42.2, The Walter and Eliza Hall Institute of
Medical Research, Melbourne, Australia) was used to identify DEGs among the
normal and NPC groups, setting
The STRING database (https://cn.string-db.org/) was used to search for interactions between proteins; it includes direct physical interactions between proteins and indirect functional correlations between proteins. The protein–protein interaction (PPI) network analysis was performed using the STRING tool (https://cn.string-db.org/, version1 1.5, University of Zurich, Zurich, Switzerland) [19], the cytoHubba plug-in of Cytoscape was used for the key intersection gene analysis based on the maximal clique centrality (MCC), maximum neighborhood component (MNC), degree, edge percolated component (EPC), closeness and radiality algorithm.
Least absolute shrinkage and selection operator (Lasso) Cox regression is also known as Lasso regression. This shrinkage estimation method compresses unimportant feature coefficients close to zero and sets them directly to zero, thus achieving the effect of automatic selection of important features. We performed the Lasso–Cox regression analysis using the “glmnet” function (version 4.1-2, Stanford University, San Francisco, CA, USA) to reduce the number of candidate genes [20]. SVMs is a binary model that eliminates the minimum score feature through the order iteration principle; thus, it remains the most effective feature; the “e1071” R package (version 1.7-14, Department of Computer Science, University of California, Santa Cruz, CA, USA) was used for the disease characteristic gene screening and the optimum model building. Subsequently, the receiver operating characteristic (ROC) curve with the area under curve (AUC) value was used for the classification performance analysis by using the “timeROC” R package (version 0.4, University of Bordeaux, Bordeaux, France) [21].
CIBERSORT is a popular method used to calculate immune cell infiltration and provides expression data for 22 common immuno–infiltrating cells with different functions and states (https://cibersortx.stanford.edu/); the “CIBERSORT” R package (version 0.1.0) was used for the immuno–infiltration analysis [22]. Gene Set Enrichment Analysis (GSEA) is usually used to determine the degree of pathway enrichment and gene set function; we used the GSEA_4.2.22 software (version 4.2.22, https://www.gsea-msigdb.org/gsea/index.jsp) to perform the Gene Ontology (GO) and Kyoto Encyclopedia of Genes and Genomes (KEGG) analyses based on the c2.cp.kegg and c5.go gene sets.
Human nasopharyngeal epithelial cells (NP69) and nasopharyngeal carcinoma
resuscitation cells (5-8F) were obtained from the Cell Bank of Academia Sinica
(Shanghai, China). The cells were identified as short tandem repeat (STR), and
the mycoplasma detection results were negative. The cells were cultured in
RPMI-1640 medium (Gibco) containing fetal bovine serum (10%), streptomycin (0.1
g/L), and L -glutamine (2 mM) and penicillin (100 U/mL) at 37 °C and in
a 5% CO
The siRNA transfection reagent was purchased from Life Technologies (Invitrogen
Life Technologies, Inc., Grand Island, NY, USA) for FN1 and
MUC1 transient silencing and diluted using RNase-free water (MUC1 siRNA sequence: 5′-AAGGTACCATCAATGTCCACG-3′,
FN1 siRNA sequence: 5′-CCAUUUCACCUUCAGACAATT-3′, siRNA-NC sequence: 5′-CGCTTACCGATTCAGAATGG-3′). Then, it
was mixed with a transfection reagent to the required working concentration for
silenced cells based on the manufacturer’s protocol. A wound healing assay was
performed for cell migration; the 5-8F cells were inoculated into 6-well plates
with DMEM medium at 37 ℃ overnight until confluency, and then a 100 µL
pipette tip was used for a rectilinear scratch. After 24 h incubation, 4%
paraformaldehyde and 0.1% crystal violet were applied for 15 min for the
fixation and staining, and cell imaging was performed using an inverted
microscope [24]. The transwell assay was used to evaluate cell invasion; a total
of 5
NPC cells were transfected with siRNA targeting FN1 and MUC1 or a negative control. Apoptosis analysis was conducted using the Annexin V-FITC/PI Apoptosis Detection kit (Nanjing KeyGen Biotech Co., Ltd., Nanjing, China) according to the manufacturer’s instructions. Flow cytometry using FACSCalibur (BD Biosciences, Franklin Lake, NJ, USA) and FlowJo (version 10.0, BD Biosciences, Franklin Lake, NJ, USA) software was employed for cell analysis. Additionally, a PI staining kit (Nanjing KeyGen Biotech Co., Ltd.) was used for cell staining, and flow cytometry was utilized for cell cycle assessment, as previously reported [25].
Molecular docking is a method of drug design based on the characteristics of the
receptor and the interaction between the receptor and the drug molecule; the
PubChem website (https://pubchem.ncbi.nlm.nih.gov/) provided the 3D structure of
target drugs as ligands [26], the UniProt database (https://www.uniprot.org/) was
used for crystal structure (X-ray) analysis of receptor proteins: lower
Å-values, longer positions, and single chains were preferred. The PyMOL
software (version 3.0, https://www.pymol.org/) was used for the dewatering,
hydrogenation, and removal of small molecules, and the AutoDocktools (version
1.5.7, http://autodock.scripps.edu/) was used for the protein–drug molecular
docking (binding energy
The data analysis and visualization were completed using R software (version
4.1.0, https://www.r-project.org/, Columbia University Irving Medical Center, New
York, NY, USA). The Spearman’s rank method was used for the correlation analysis,
the Wilcoxon rank-sum test was used to analyze the differences between groups,
and p
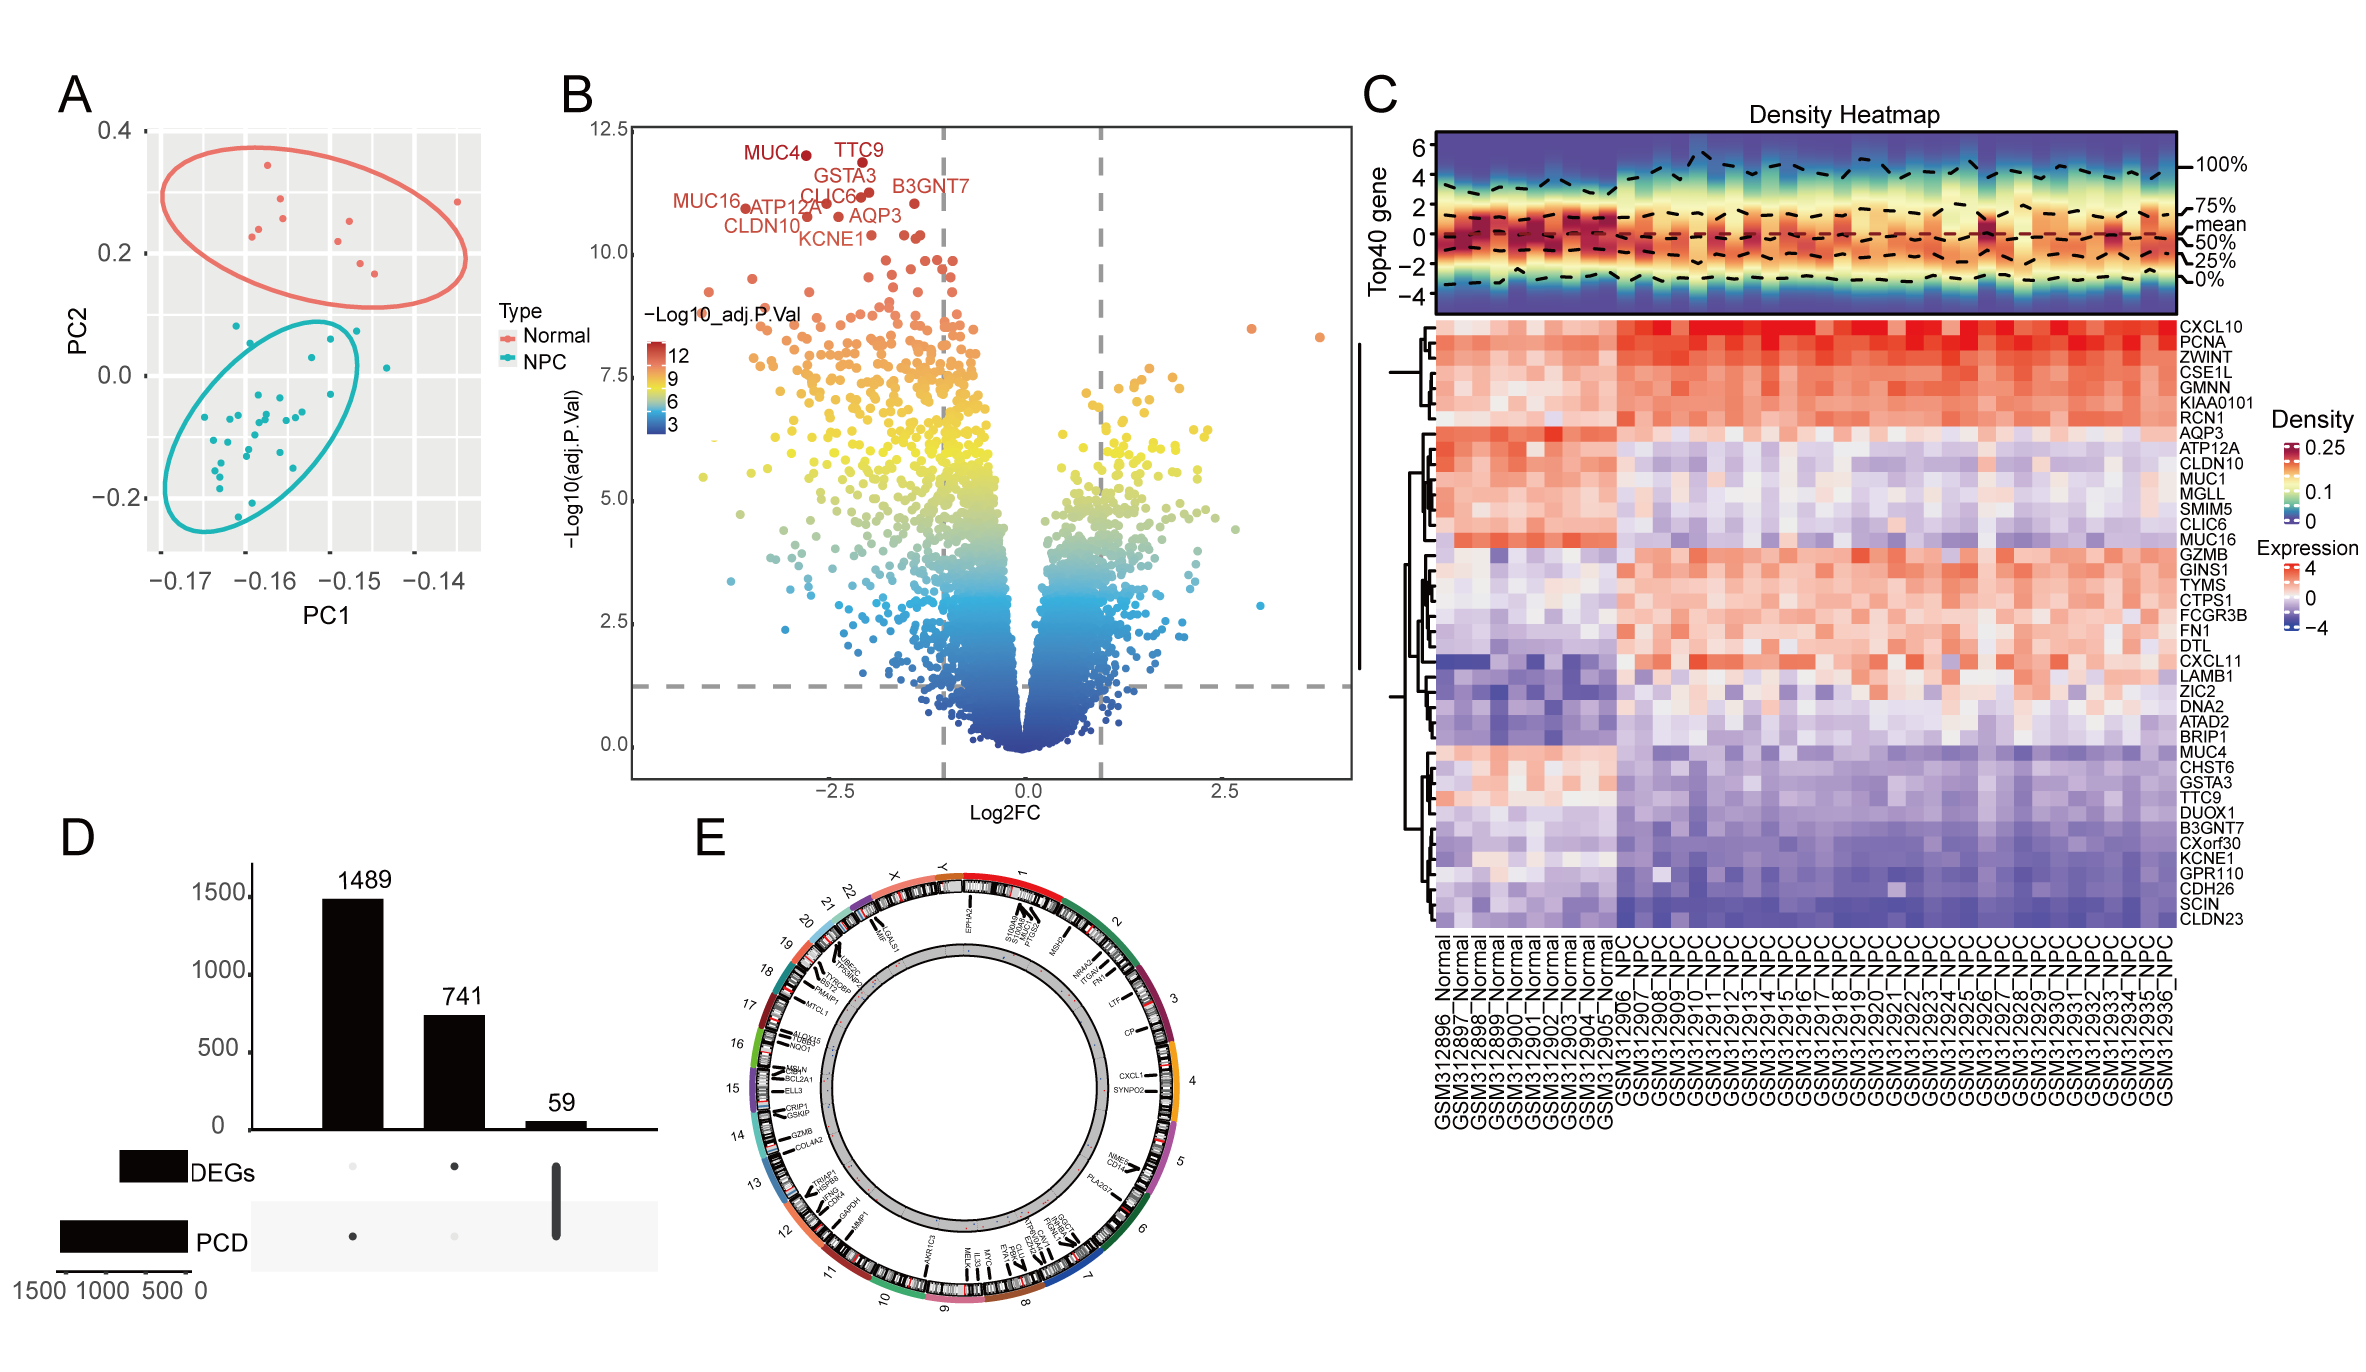
PCA was used for the outlier filtering through the variance difference and indicated no obvious outliers in our dataset (Fig. 1A). We performed a differential expression analysis between the normal and NPC samples and identified 800 DEGs, including 287 upregulated genes and 523 downregulated genes in the volcano plot (Fig. 1B). The expression of the top 20 up- and downregulated DEGs were visualized in the heatmap (Fig. 1C); the chemokines CXCL10 and CXCL11 are upregulated in the NPC samples. The intersection between the 1548 PCD-RGs and 800 DEGs generated 59 PCD-related DEGs (Fig. 1D); we analyzed the chromosomal location of these genes and found that these genes are distributed throughout chromosomes 1 to 22 (Fig. 1E).
 Fig. 1.
Identification and location of programmed cell death (PCD)-related differentially expressed genes (DEGs). (A) Principal component analysis (PCA) of the GEO-NPC cohort for outlier clearing: red dots are normal samples and the blue dots are nasopharyngeal carcinoma (NPC) samples. (B) Volcano plot of DEGs between normal and NPC samples. (C) The expression of the top 20 up- and downregulated DEGs in the heatmap. (D) The upset plot of DEGs and PCD-related genes (PCD-RGs) intersection. (E) The gene location of 59 PCD genes on chromosomes 1–22.
Subsequently, we used the STRING tool to construct a protein–protein interaction (PPI) network based on the 59 PCD-related DEGs: MYC, GAPHD, and FN1 may play a core role in this network (Supplementary Fig. 1A). Then, “cytoHubba” was used to filter the top 20 genes in each algorithm via importance; the intersection of these genes exhibited 16 key candidate genes for further analysis, including the GAPDH, FN1, IFNG, PTGS2, CXCL1, MYC, MUC1, LTF, S100A8, CAV1, CDK4, EZH2, AURKA, IL33, S100A9, and MIF (Supplementary Fig. 1B).
Lasso–Cox regression analysis of the above 16 key candidate genes was performed, and the model had the highest interpretive efficiency when lambda min. = 0.00032. Thus, six feature genes were identified: PTGS2, FN1, LTF, CAV1, MUC1, and IL33 (Fig. 2A,B). In addition, SVM-RFE analysis of 16 key candidate genes was performed, and two feature genes, FN1 and MUC1, remained in the model after recursion elimination (Fig. 2C). The intersection of the Lasso and SVM-RFE results generated two intersection genes, FN1 and MUC1 (Fig. 2D).
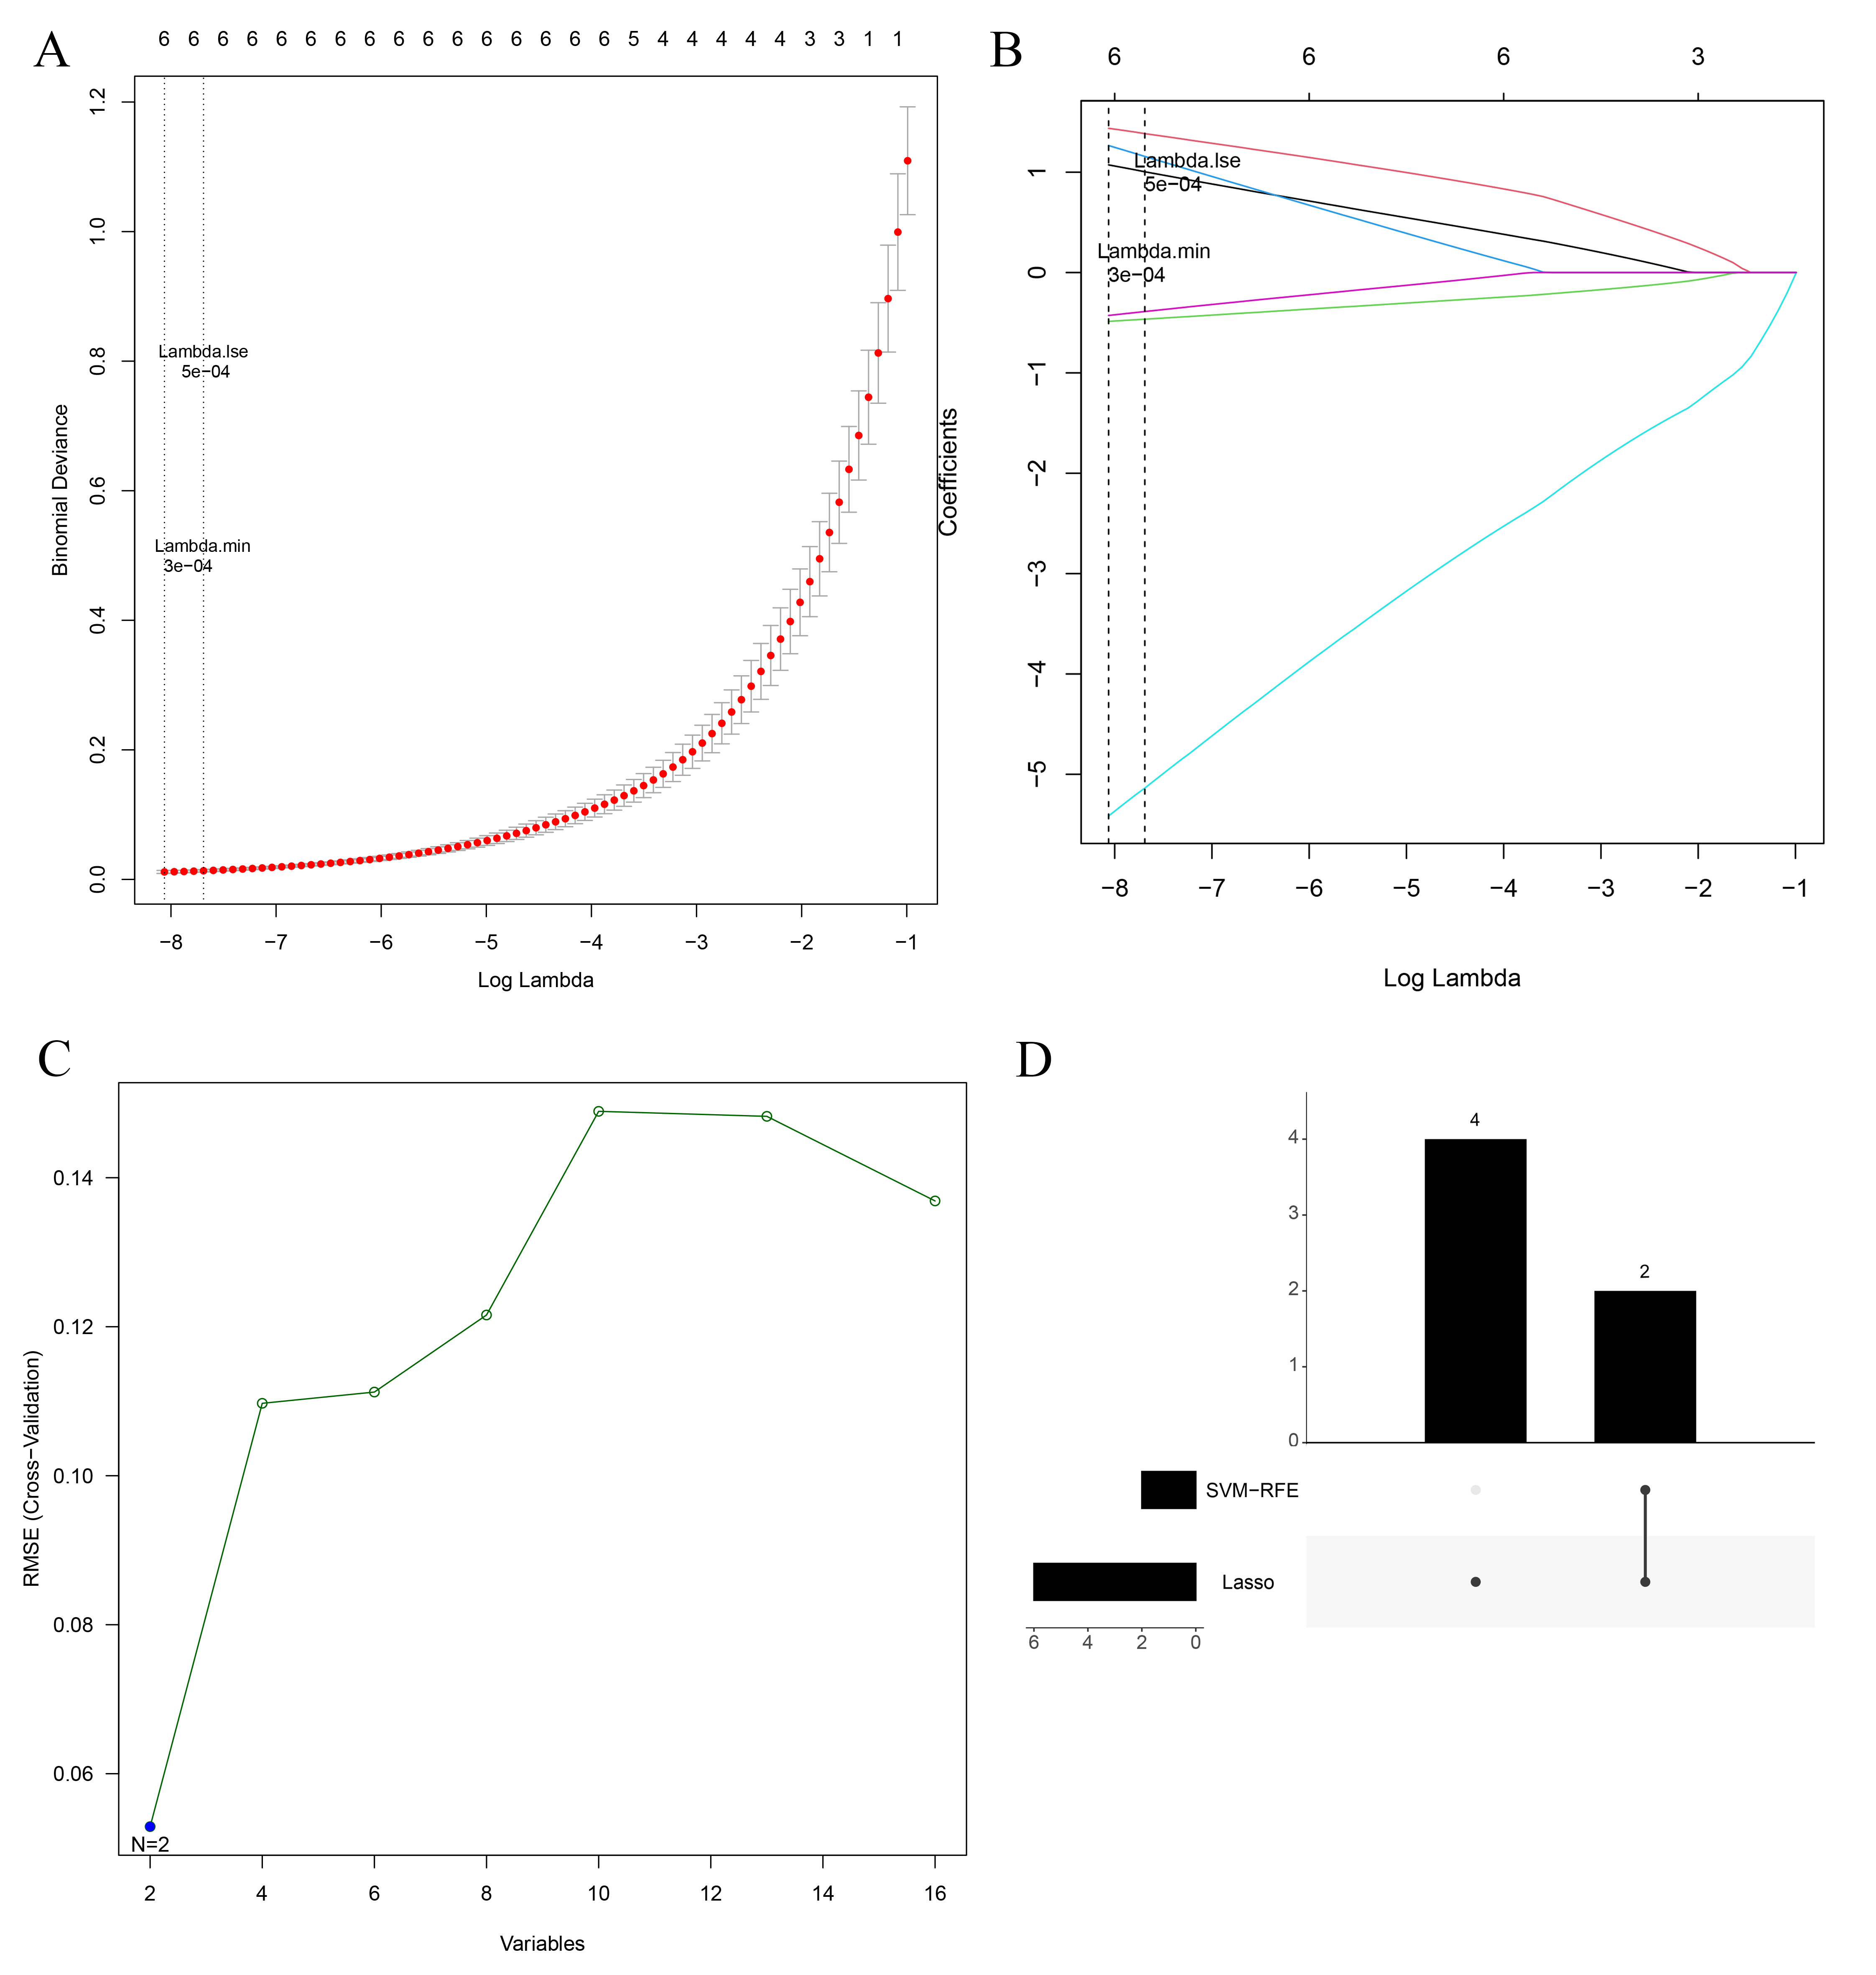 Fig. 2.
Machine learning screening for biomarkers. (A) Lasso penalty term parameter plot (the dotted line on the left is the smallest cross-validation error position with lambda min. = 0.00032). (B) Lasso regression coefficient plot (the abscissa is log(lambda), and the ordinate is the coefficient of the gene). (C) The relationship plot of SVM-RFE universal error and feature numbers. (D) The upset plot of feature gene intersection in the Lasso and SVM-RFE algorithm.
We performed the ROC analysis of FN1 and MUC1 in the training
and validation sets. The AUC values of the two genes were both more than 0.9
(Supplementary Fig. 2A), indicating that these genes have excellent
diagnostic classifier performance. Further analysis of these two gene expressions
also showed that FN1 is significantly overexpressed in the NPC group
(p
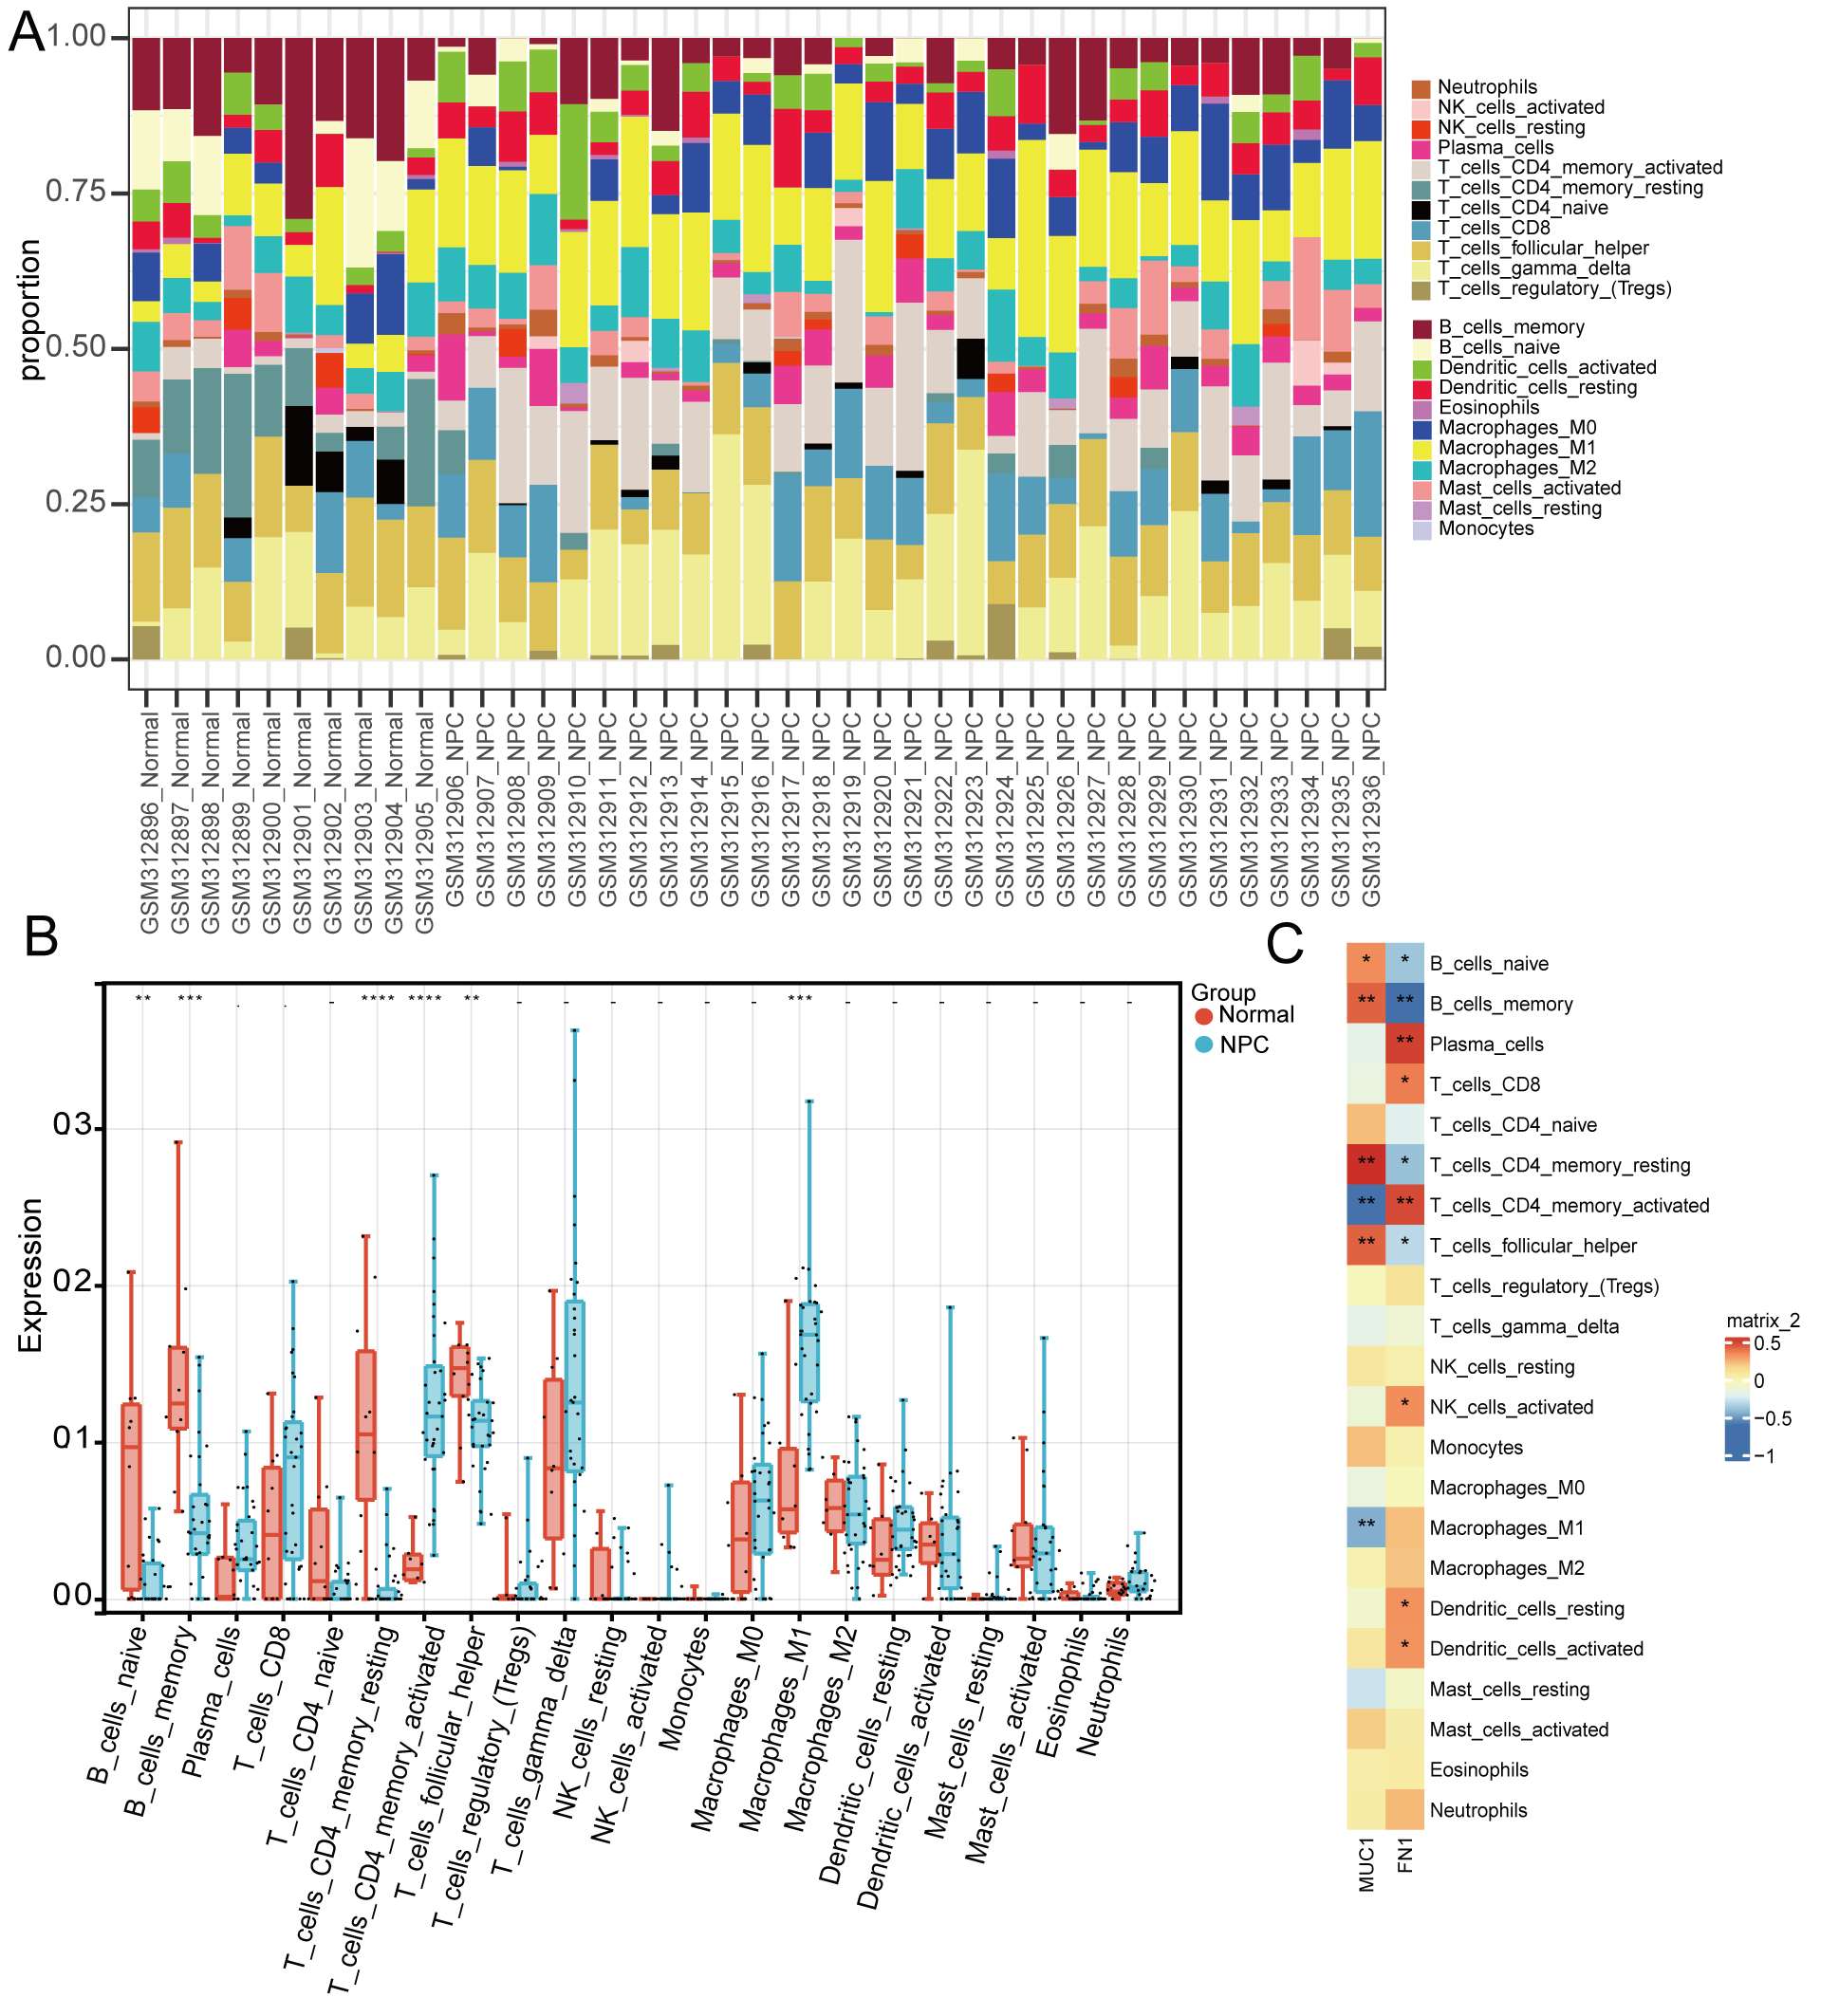
The immuno–infiltration level of 22 immune cells in the training set—the
proportion of immune cells among samples shown in (Fig. 3A)—the results of
immune infiltration in normal and NPC groups demonstrated that the naive B cells,
memory B cells, resting memory CD4
 Fig. 3.
Immuno–infiltration analysis. (A)
Immuno–infiltration accumulation plot (various colors represent different immune
cells). (B) Box plot of differences in levels of immune cell infiltration between
groups. (C) Correlation heatmap of biomarker expressions and immune cell
infiltration. (*p
NPC samples were divided into high and low biomarker expression groups to understand the differences in signaling pathways and biological function of high and low biomarker expression groups in the training set, according to the median. These pathways, including the cell cycle and DNA replication, are the significant difference enrichment pathways in the high FN1 expression group. Conversely, in the low FN1 expression group, the adaptive immune response, alpha–beta T cell activation, antigen receptor-mediated signaling pathway, and hematopoietic cell lineage were enriched (Fig. 4A). In the low MUC1 expression group, processes such as the cell cycle, DNA replication, RNA degradation, chromosome centromeric region, and chromosomal region were significantly different enrichment pathways (Fig. 4B). These pathways are all associated with programmed cell death such as apoptosis, suggesting that the level of FN1 and MUC1 expression in NPC patients is related to the cell survival and proliferation.
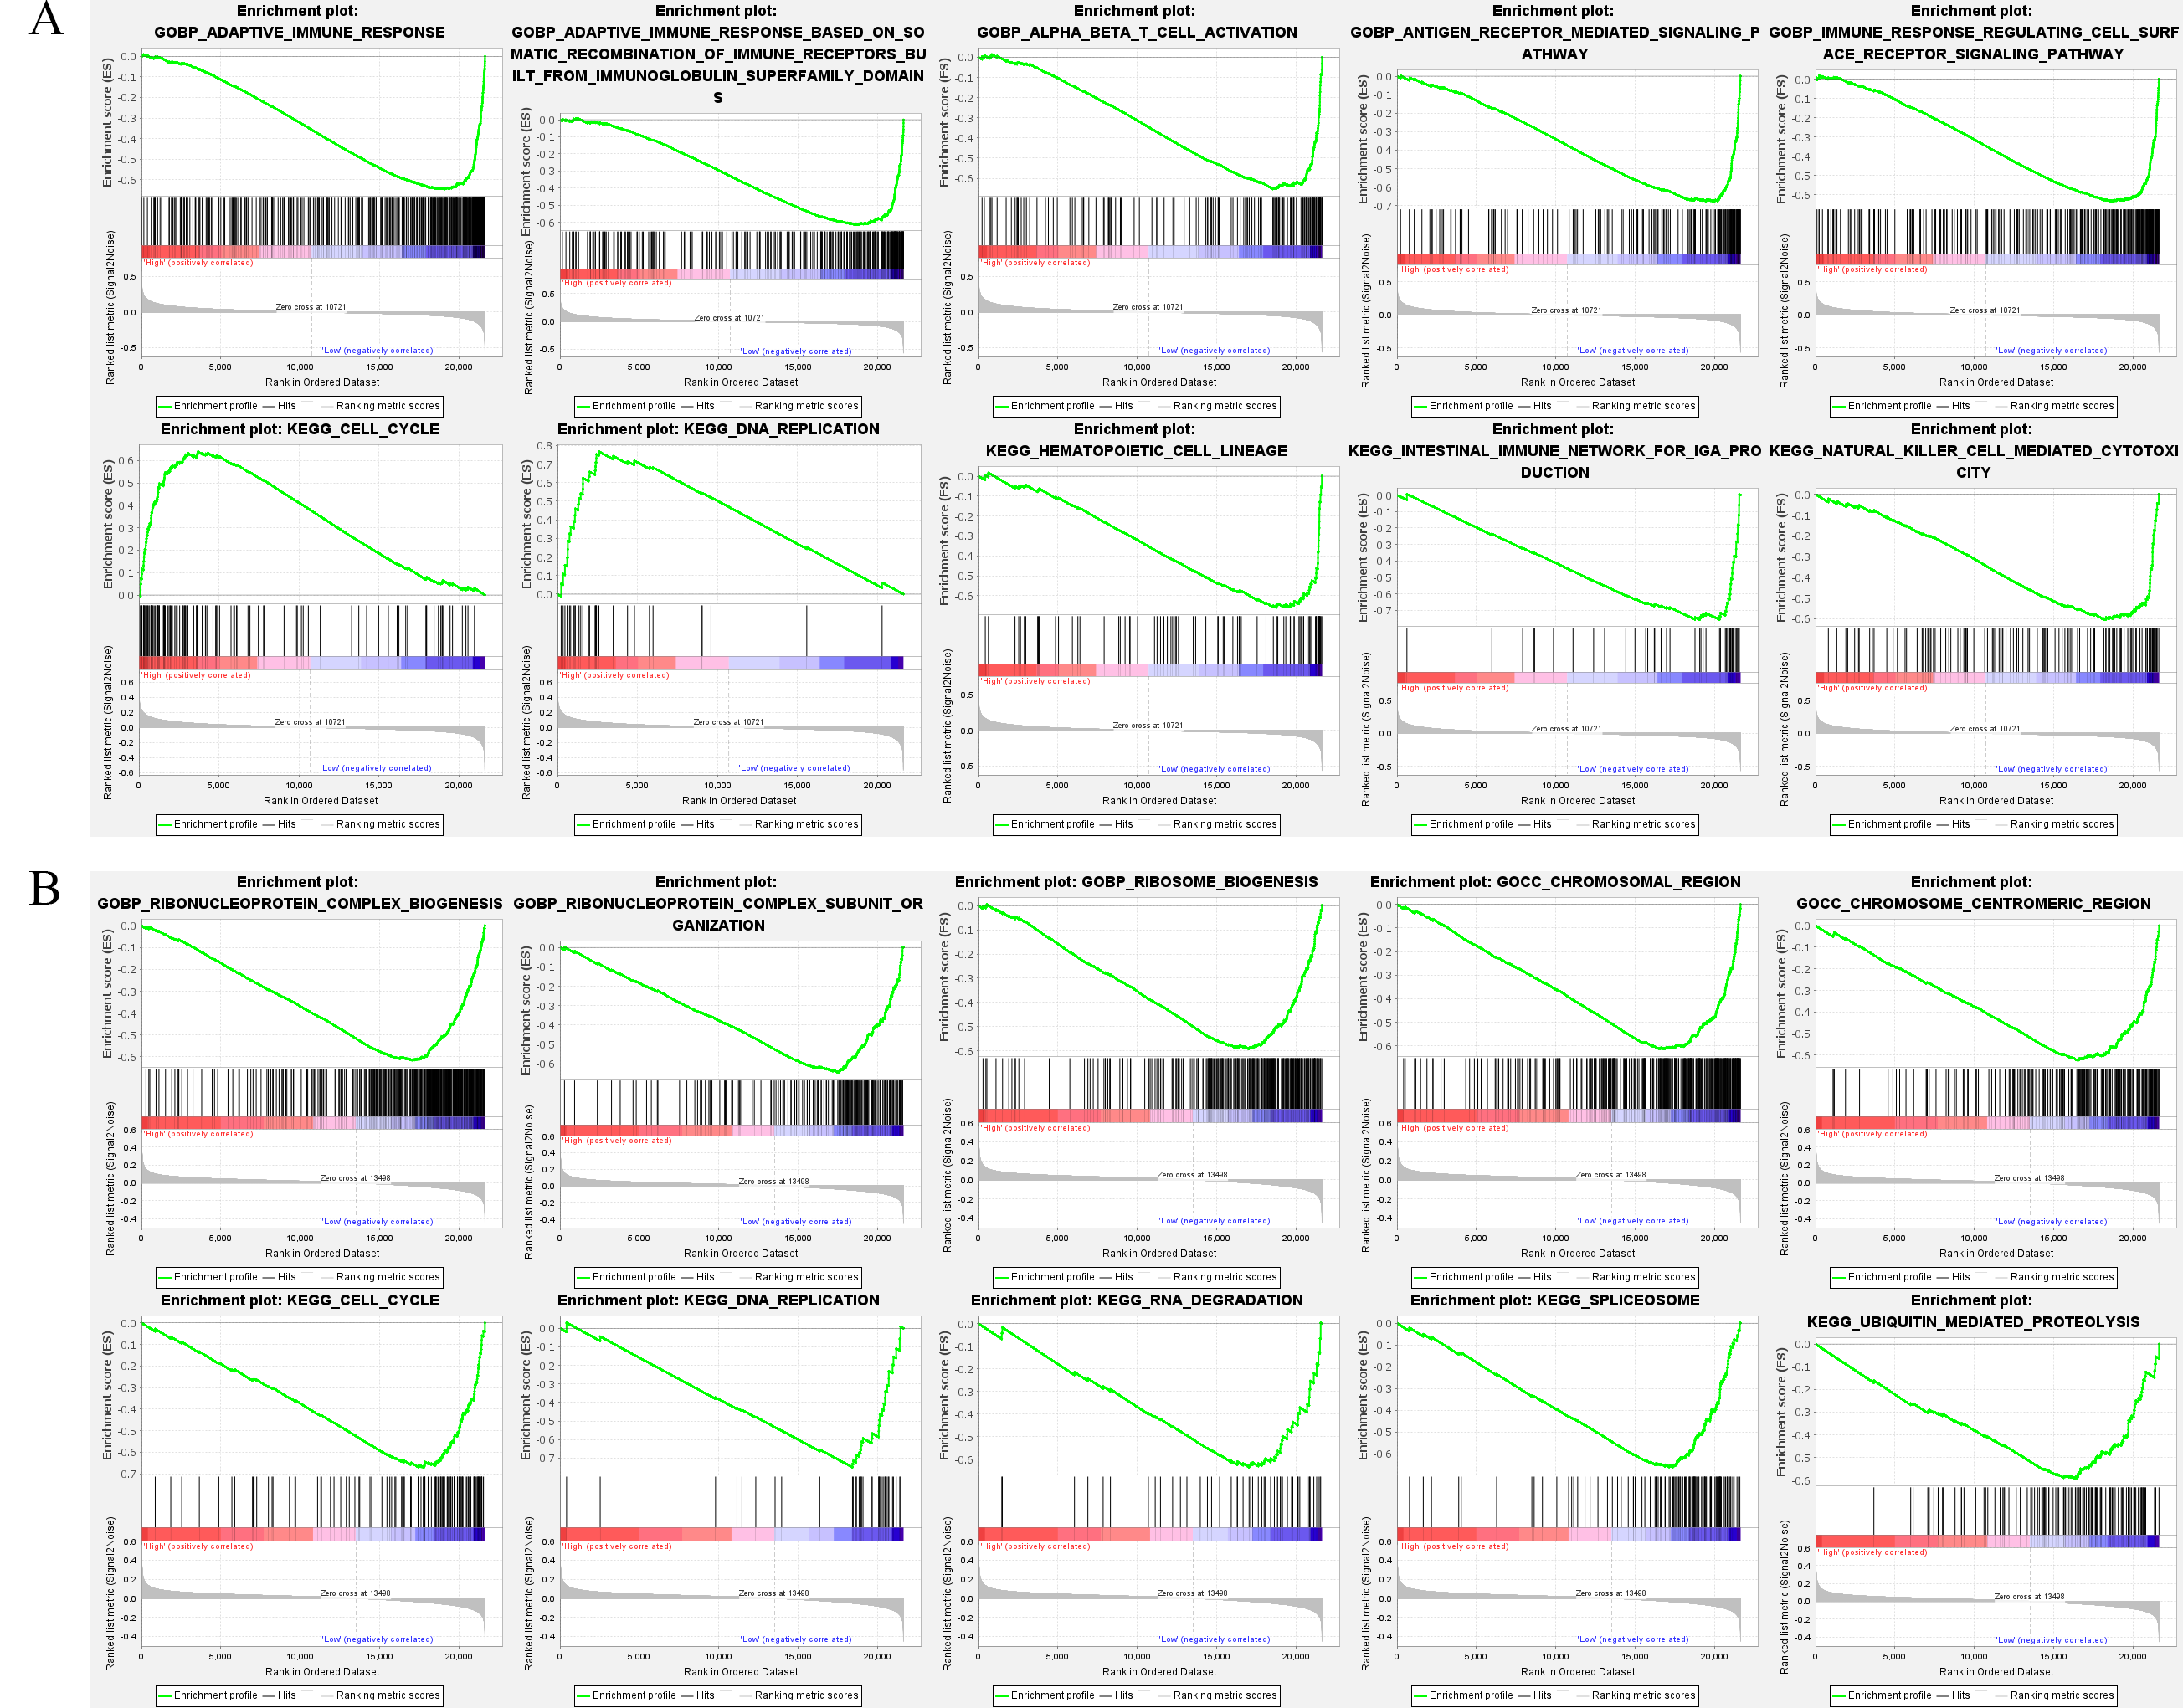 Fig. 4.
Gene Set Enrichment Analysis (GESA). (A) The GESA of the 5 top GO and KEGG enrichment pathways among the high FN1 and low FN1 expression groups (the plot includes the enrichment score, gene order, and expression levels). (B) The GESA of the 5 top GO and KEGG enrichment pathways among the high MUC1 and low MUC1 expression groups.
We detected the relative mRNA expression of FN1 and MUC1 in
NP69 epithelial cells and 5-8F NPC cells and found that their expression in
cancer cells is significantly higher (p
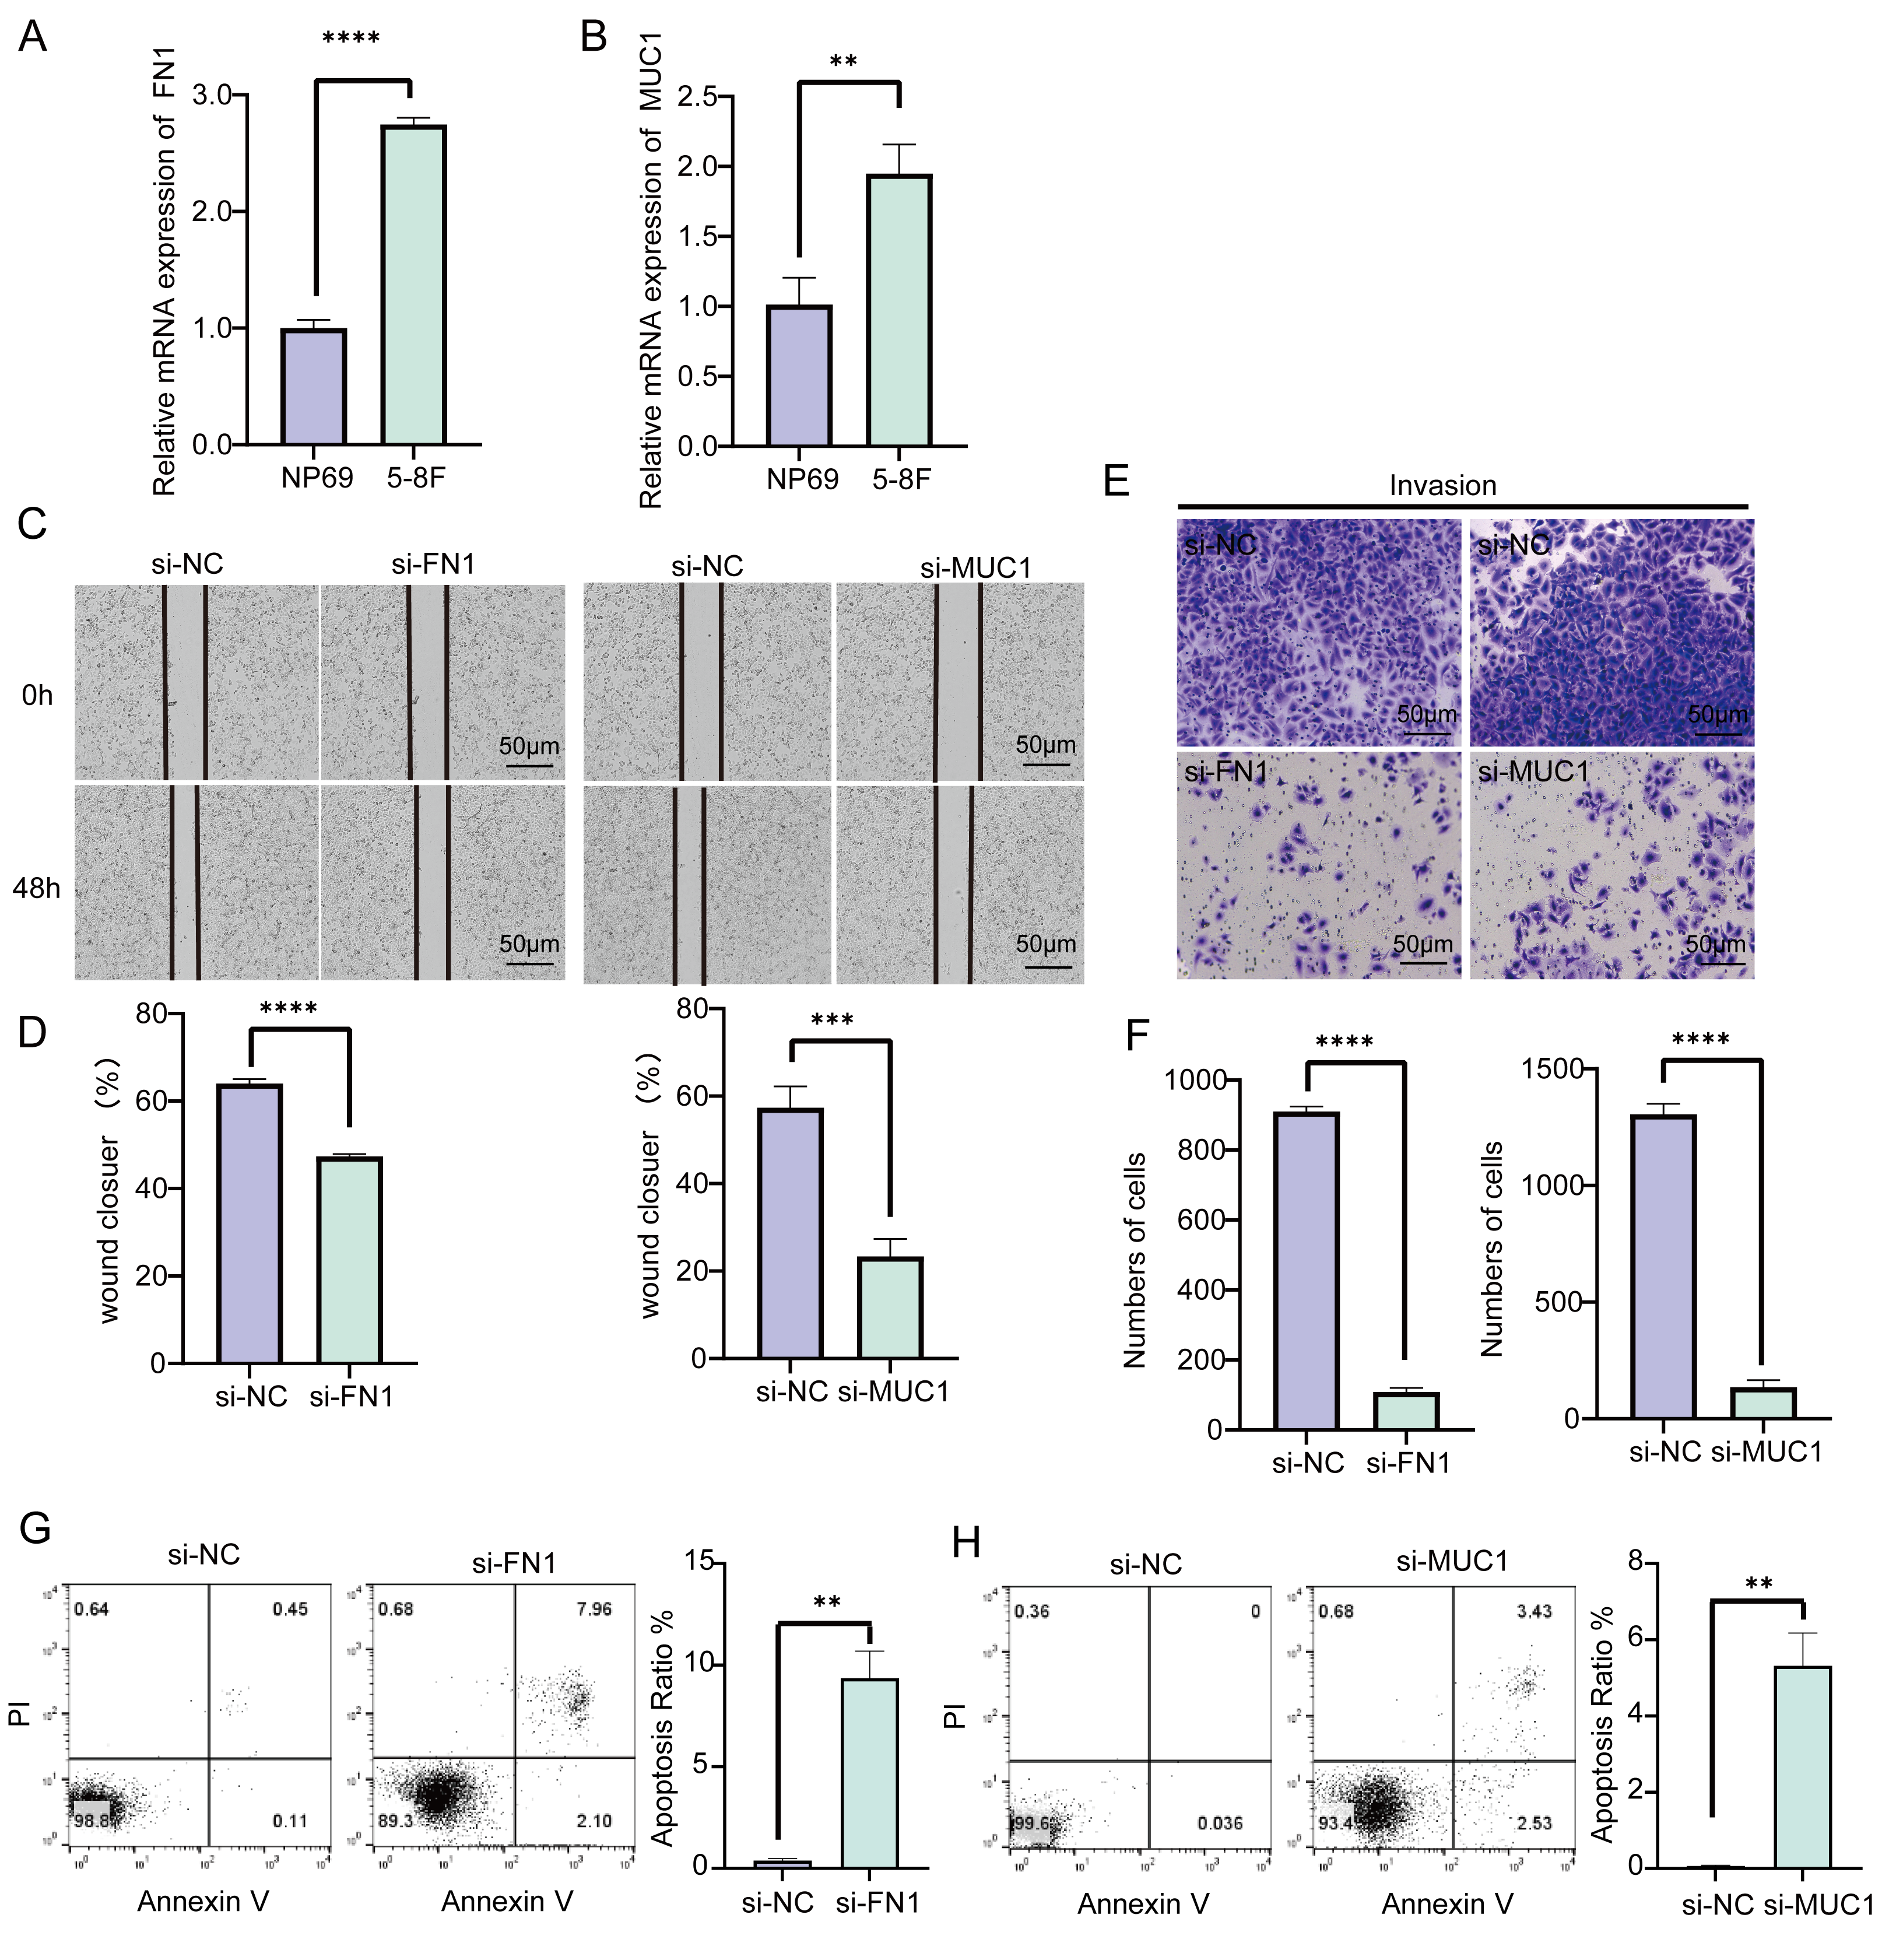 Fig. 5.
Effects of FN1 and MUC1 on NPC cell
function. (A) The expression difference of FN1 in NP69 and
5-8F cells. (B) The expression difference of MUC1 in NP69 and 5-8F
cells. (C,D) Wound healing assay to validate the effects of silencing
FN1 and MUC1 expression in 5-8F cells. (E,F) Transwell assay to
verify the effect of silencing FN1 and MUC1 expression on the
invasive ability of 5-8F cells. (G,H) Downregulation of FN1 and
MUC1 expression levels to improve apoptosis in NPC cell lines.
**p
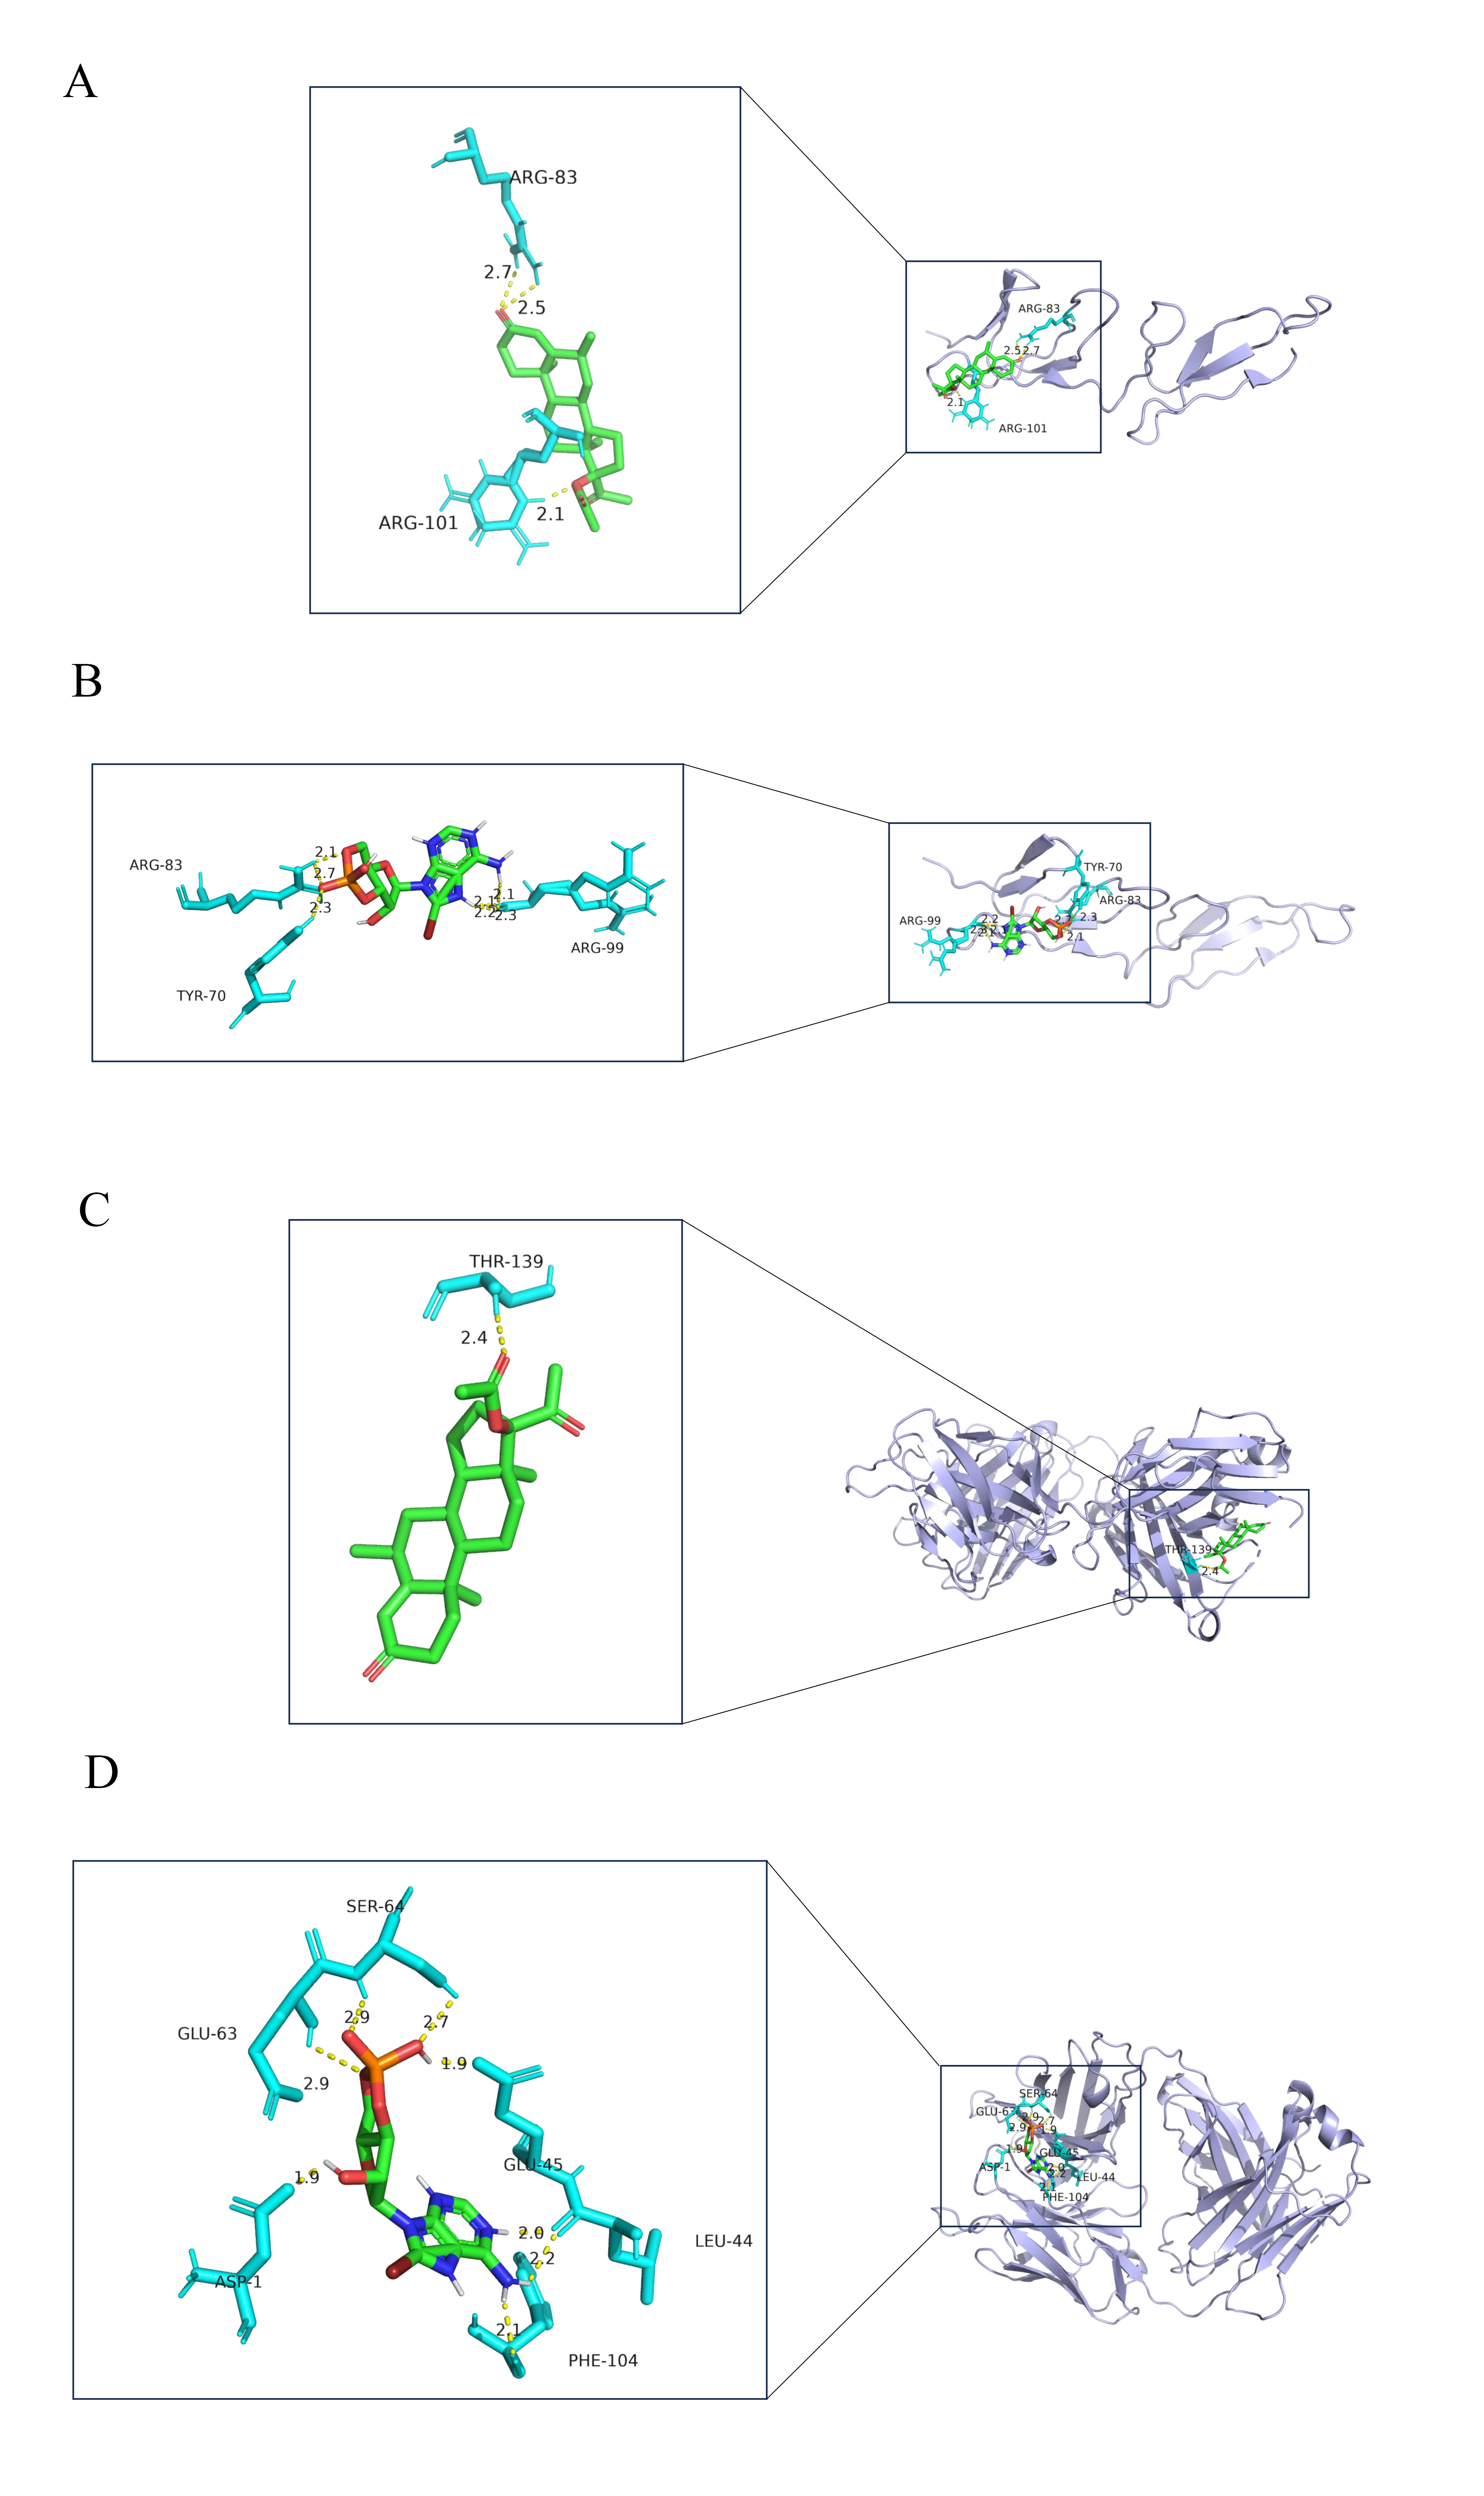
We used the DSigDB database for target drug prediction for MUC1 and FN1; these results are shown in Table 1. After that, the 3D structure of the target drug was obtained from the PubChem website: medroxyprogesterone acetate and 8-Bromo-cAMP. The crystal structure of the receptor proteins for FN1 and MUC1, including the 2CG7 number structure of FN1 and the 6KX1 number structure of MUC1, were selected for molecular docking. After dewatering and hydrogenation, the binding energy between FN1 and medroxyprogesterone acetate was –9.17 kcal/mol, the binding sites were in the amino acids of ARG-83 and ARG101, and the hydrogen bond lengths were less than 3.5 Å (Fig. 6A). In the FN1 and 8-Bromo-cAMP results, the binding energy was –7.27 kcal/mol, the binding sites were in the amino acids of TYR-70, ARG-83, and ARG-99, and the hydrogen bond lengths were less than 3.5 Å (Fig. 6B). In the MUC1 and medroxyprogesterone acetate results, the binding energy was –7.73 kcal/mol, the binding site was in the amino acids of THR-139, and the hydrogen bond lengths were less than 3.5 Å (Fig. 6C). In the MUC1 and 8-Bromo-cAMP results, the binding energy was –5.9 kcal/mol, the binding sites were in the amino acids of ASP-1, LEU-44, GLU-45, GLU-63, SER-64, and PHE-104, and hydrogen bond lengths were less than 3.5 Å (Fig. 6D); the parameters for the molecular docking are shown in Supplementary Table 2.
 Fig. 6.
Drug prediction and molecular docking. (A) The molecular docking result of FN1 and medroxyprogesterone acetate. (B) The molecular docking result of FN1 and 8-Bromo-cAMP. (C) The molecular docking result of MUC1 and medroxyprogesterone acetate. (D) The molecular docking result of MUC1 and 8-Bromo-cAMP (blue represents the receptor protein, the green molecule is the drug molecule, and the turquoise is the amino acid; in addition, the hydrogen bond between the receptor protein and the drug is a yellow dashed line and the number indicates the hydrogen bond length).
| Term | p-value | Odds ratio | Combined score | Genes |
| MG-132 | 7.44 × 10 |
39,654 | 376,958.1459 | MUC1; FN1 |
| Verteporfin | 1.37 × 10 |
39,530 | 351,502.9807 | MUC1; FN1 |
| Medroxyprogesterone acetate | 3.77 × 10 |
39,222 | 309,162.3180 | MUC1; FN1 |
| Phorbol 12-myristate 13-acetate | 5.82 × 10 |
39,034 | 290,763.9067 | MUC1; FN1 |
| 8-Bromo-cAMP | 1.06 × 10 |
38,696 | 265,005.4257 | MUC1; FN1 |
NPC is a radiosensitive epithelial malignant tumor and common epithelial tumor
in East and Southeast Asia, as well as North Africa [27]. Over 70% of the 87,000
newly diagnosed NPC cases annually are classified as an advanced disease with
local spread or lymph node metastasis. The intrinsic asymptomatic and invasive
nature of NPC constitutes a major challenge hindering the early diagnosis of this
disease and reducing the overall survival of patients [28, 29]; the outcome of
recurrence/metastasis is very poor with ~20 months median
survival time [30]. Previous research has proposed a series of genetic
aberrations and genetic factors resulting in the development of NPC, such as
chromatin modification-related mutations [31], NF-
We analyzed the DEGs in the NPC samples and found that these genes are closely
associated with the apoptotic process and intrinsic apoptotic signaling
regulation in response to the DNA damage pathway. Meanwhile, the PI3K–Akt
signaling pathway, TGF-
In addition, FN1 is overexpressed in cancer samples and positively
correlated with the infiltration of plasma cells, CD8 T cells, activated memory
CD4
This study includes three main strengths. First, we identified two effective biomarkers for diagnosing NPC based on the PCD-related phenotype, and this study provides a promising start for creating a more comprehensive predictive model with value treatment recommendations for NPC. Second, this retrospective study ensures the high repeatability of these extracted features, and the methods and design can be applied to developing biomarkers for other cancer types [27]. Finally, our study offers a novel treatment and drug targets for NPC patients. Nevertheless, there are also some limitations, such as using a nonparametric matching method in the retrospective study for the baseline characteristics balance; thus, selection bias was unavoidable and may have affected the estimates. Subsequently, a larger-scale cohort and actual experimentations are necessary for prospective trials.
In summary, we analyzed the DEGs and immune infiltration differences between
normal and NPC samples. Two reliable biomarkers, FN1 and MUC1,
with highly prognostic classification efficiency, were identified from the 59
PCD-related DEGs. FN1 expression can indicate the immune infiltrating
state of NPC samples with high plasma cells, CD8 T cells, activated memory
CD4
PCD, programmed cell death; NPC, nasopharyngeal carcinoma; GEO, Gene Expression Omnibus; DEGs, differentially expressed genes; EBV, Epstein-Barr virus; WHO, World Health Organization; PCA, Principal Component Analysis; GO, Gene Ontology; KEGG, Kyoto Encyclopedia of Genes and Genomes; PPI, protein-protein interaction; Lasso, Least Absolute Shrinkage and Selection Operator; SVM, Support Vector Machines; ROC, receiver operating characteristic; AUC, Area Under Curve; GSEA, Gene Set Enrichment Analysis; TFs, transcription factors; miRNA, microRNA; DSigDB, Drug signature database.
The datasets generated and/or analyzed during the current study are available in the [GSE12452] repository, [https://www.ncbi.nlm.nih.gov/geo/query/acc.cgi?acc=GSE12452] and [GSE13597] repository, [https://www.ncbi.nlm.nih.gov/geo/query/acc.cgi?acc=GSE13597]. And the datasets used and/or analyzed during the current study are available from the corresponding author on reasonable request.
All authors contributed to this present work: JYY & LRW designed the study. MMZ acquired the data. FFP improved the figure quality. JYY & FFP drafted the manuscript. JYY & MMZ revised the manuscript. All authors contributed to editorial changes in the manuscript. All authors read and approved the final manuscript. All authors have participated sufficiently in the work and agreed to be accountable for all aspects of the work.
Not applicable.
Not applicable.
This research received no external funding.
The authors declare no conflict of interest.
References
Publisher’s Note: IMR Press stays neutral with regard to jurisdictional claims in published maps and institutional affiliations.