


1 Department of Pathology, College of Basic Medical Sciences, China Medical University, 110122 Shenyang, Liaoning, China
2 Department of Gastroenterology, General Hospital of Northern Theater Command, 110017 Shenyang, Liaoning, China
3 Department of Orthopaedics, Huangzhong First People's Hospital, 811600 Xining, Qinghai, China
Abstract
Background: Osteosarcoma (OS) is a primary malignant bone tumor in the
pediatric and adolescent populations. Long non-coding RNAs (LncRNAs), such as
plasma-cytoma variant translocation 1 (PVT1), have emerged as significant
regulators of OS metastasis. Recent studies have indicated that activation of
signal transducer and activator of transcription 3 (STAT3) signaling, which might
be controlled by PVT1, inhibits ferroptosis to promote the malignant progression
of cancer. Therefore, the present study aimed to determine the role of PVT1 in OS
pathogenesis and investigate whether PVT1 affects OS progression by regulating
STAT3/GPX4 pathway-mediated ferroptosis. Methods: The
human OS cell line MG63 were transfected with sh-PVT1 plasmid to
inhibit PVT1 expression, with or without co-transfection with a STAT3
overexpression plasmid. The expression of PVT1 was determined by real-time
quantitative polymerase chain reaction (RT-qPCR). The proliferation, migration, invasion, and apoptosis
of MG63 cells were determined using the cell counting kit-8 (CCK8), Transwell
assay, and flow cytometry. The levels of malondialdehyde (MDA), Fe
Graphical Abstract
Keywords
- osteosarcoma
- lncRNA-PVT1
- ferroptosis
- STAT3
- GPX4
Osteosarcoma (OS) is the most common malignant bone tumor in children and adolescents [1]. The long bones of the extremities account for around 80% of OS cases, with the long metaphyseal region of the knee joint being the most frequently affected [2]. Approximately 15% of patients suffer from cancer metastases, the most common of which is lung or bone metastases that severely affect the quality of life and prognosis of OS patients [3]. Although neoadjuvant chemotherapy has increased patient survival rates, almost 40% of patients still experience tumor recurrence and metastasis, which frequently results in dismal prognosis [4]. Although the five-year survival rate has risen by nearly 70% owing to the enhanced adjuvant chemotherapy and surgical methods, the overall cure rate has not experienced notable changes [5]. Therefore, further investigation of novel approaches for managing OS is essential to improve the survival and prognosis of patients.
Long non-coding RNAs (lncRNAs) are a class of non-coding RNAs longer than 200 nt [6]. LncRNAs regulate gene expression at the transcriptional level and participates in pathophysiological processes in various diseases [7]. In recent years, an increasing number of studies have shown that lncRNAs play an important role in the progress of human malignant tumors and their prognostic outcomes [8]. Plasmacytoma variant Translocation 1 (PVT1), encoded by the PVT1 gene, is a lncRNA located on chromosomal 8q24.21 [9]. Available evidence suggests that PVT1 plays a wide range of roles in the activities of cancer cell, including apoptosis, growth, invasion, and chemical resistance [9, 10]. Studies have indicated that the deterioration of hepatocellular carcinoma, pancreatic ductal adenocarcinoma, gastric cancer and others are related to the abnormal expression of PVT1, which have confirmed its carcinogenic property [11, 12, 13]. It has been reported that PVT1 promotes OS growth and metastasis by regulating the miR-497/hexokinase 2 (HK2) pathway [14], stabilizing ERG, sponging miR-183-5p [15], and enhancing the expression of G1/S-specific cyclin D1 [16]. Furthermore, an additional investigation demonstrated PVT1 targets miR-152 to stimulate the C-MET/PI3K/AKT axis, thereby increasing the resistance of OS to chemotherapy [17]. These outcomes revealed that OS progression and chemical resistance are significantly promoted by PVT1, and targeting PVT1 might be a novel and promising approach for treating OS.
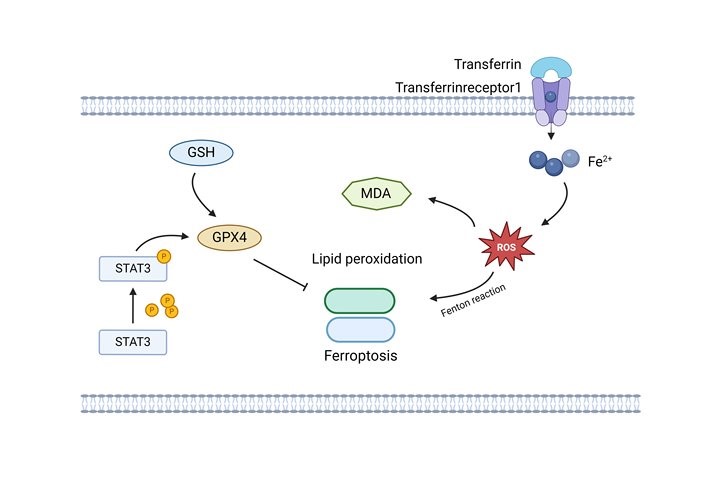
Ferroptosis is a novel type of regulatory cell death (RCD) driven by intracellular iron [18]. Abnormal iron metabolism, reactive oxygen species (ROS) production and lipid metabolism are the induction factors that trigger ferroptosis [19]. Studies indicated that the phosphorylation of signal transducer and activator of transcription 3 (STAT3) might activate SLC7A11/GPX4 signaling to reduce lipid peroxidation, and eventually ameliorated ferroptosis [20, 21]. Moreover, recent study found that PVT1 activates STAT3 in gastric cancer and promotes the proliferation of hepatoblastoma cells [22, 23]. Zhang et al. [24] found that activation of STAT3 promoted malignant progression of breast cancer and inhibited ferroptosis. These results further revealed the essential function of PVT1 and the regulatory mechanisms of STAT3, suggesting that there might be a potential interaction between PVT1, STAT3, and ferroptosis in the progression of cancer. However, it has not been investigated whether PVT1 inhibits ferroptosis to promote OS metastasis by activating STAT3/glutathione peroxidase 4 (GPX4) pathway. Therefore, in the present study, we aimed to investigate the mechanism underlying the PVT1/STAT3/GPX4 pathway in OS metastasis.
Here, we established PVT1 silencing OS cell line MG63, with or without
co-transfection of STAT3 overexpressing plasmid, to determine the role of PVT1
mediated STAT3/GPX4 pathway in OS progression. We found that PVT1 expression
significantly increased in MG63 cells. PVT1 knockdown increased apoptosis and
suppressed the proliferation, migration, and invasion of MG63 cells. The
Inhibition of PVT1 expression elevated malondialdehyde (MDA), Fe
NHOst and MG63 were acquired from ATCC (Manassas, VA, USA). All cell lines were
validated by STR profiling and tested negative for mycoplasma. Cells were
cultured in medium containing 10% fetal bovine serum (FBS), 90% DMEM high
glucose medium, and 1% penicillin-streptomycin. Cells were all cultured in a
humidified incubator at 37 °C and 5% CO
Total RNA was obtained employing the TRIzol reagent (Vazyme, Nanjing, China)
pursuant to the directions supplied by the manufacturer. Using a reverse
transcription kit (Vazyme) and carefully following the instructions
provided, RNA was effectively converted into cDNA. To assess PVT1
expression levels, GAPDH was used as the reference gene, and the data
were analyzed using the 2
2000 cells in the logarithmic growth phase, including MG63 cells and transfected MG63 cells, were seeded in 96-well plates and grown for 24, 48, and 72 h. Following the respective incubation times, 10 µL of the CCK-8 solution was added to each well, resulting in a final concentration of 10%. A microplate reader (Rayto, Shenzhen, China) was used to calculate the optical density (OD) at 450 nm.
MG63 cells or transfected MG63 cells were suspended within serum-free medium at
a density of 5
Fifty microliters of Matrigel diluent (Corning, Shanghai, China) (VMatri-gel:
VDEME = 1:4–6 volume ratio in serum-free medium) was evenly spread into
Transwell chambers (8 µm model) and then placed in an incubator at 37 °C for
6 h to solidify. The subsequent steps were identical to those use for cell
migration. The concentration of the treated cells was adjusted to 5
In 6-well plates, MG63 or transfected MG63 cells were planted. Following a 72-h
incubation in an incubator, the cells were collected and suspended in PBS. To
create a 1
The cells were cultured as previously described. When the cells reached 80% confluence, the culture medium was replaced with fresh medium for 24 h. The supernatant was discarded and the cells were washed twice with PBS. Prepare 50 µM dihydroethidium (DHE) red fluorescent dye (final concentration) (Solarbio, Beijing, China). The cells were incubated at room temperature for 30 min, then wash cells three times. Images within 2 h of fluorescence microscopy.
The cells were nurtured in the manner indicated before. The cells were collected and lysed. The lysate was centrifuged, and the supernatant was tested. Standard substances and reaction solutions were prepared in accordance with the protocals of the MDA instructions (Beyotime, Shanghai, China). The samples were mixed with the reaction solution, heated, cooled, and centrifuged. The supernatant was transferred to a 96-well plate, and the Optical Density (OD) was calculated under 412 nm.
The cells were nurtured in the manner indicated before. The cells were digested,
collected into EP tubes and centrifuged to discard the supernatant. A protein
removal reagent S solution, three times the volume of the cell precipitate, was
added and vortexed vigorously. The samples were then placed in a 37 °C-water bath
and then quickly frozen and thawed with liquid nitrogen. The cells were kept
either at 4 °C or in an ice bath for 5 min. After centrifugation at 10,000
The cells were nurtured in the manner indicated before. 0.9 mL buffer was added
to each 1
The cells were nurtured in the manner indicated before. 100 µL RIPA lysis buffer was added for cell lysis. Protein quantification was performed using a BCA assay (NCM Biotech, Suzhou, China). Total proteins were added to the electrophoresis cell using precooled electrophoresis buffer. Following electrophoresis, polyvinylidene fluoride (PVDF) membranes were coated with proteins. PVDF membranes were then incubated overnight at 4 °C with the following primary antibodies: rabbit anti-STAT3 (1:2000; Proteintech Group, 10253-2-AP; Wuhan, Hubei, China), rabbit anti-p-STAT3 (1:1000; Cell Signaling Technology, #9134; Danvers, MA, USA), rabbit anti-GPX4 (1:2000; Proteintech Group, 67763-1-Ig; Wuhan, Hubei, China), and rabbit anti-GAPDH (1:20,000; Proteintech Group, 60004-1-Ig; Wuhan, Hubei, China). The cells were then washed thrice with TBST. The secondary antibody (Goat Anti-Rabbit IgG H&L/HRP, Bioss Antibodies, bs-0295G-HRP; 1:20,000; Beijing, China) was placed on the PVDF membrane for two h. Chemiluminescent reagents A and B were mixed and added to the PVDF membrane by uniform drops. The samples were imaged using a JP-K6000 chemiluminescence imaging system. ImageJ software (LOCI, University of Wisconsin, Madison, WI, USA) was used to analyze protein expression.
Graphpad Prism 9 (Version 9.4.0, GraphPad Software, Inc., San Diego, CA, USA)
was used for analyzing and displaying the data. All data were given as means
Various studies have shown that PVT1 contributes to a range of malignancies,
including OS [14]. First, to confirm the expression of PVT1 in OS, we evaluated
its differential expression in MG63 and NHOst by RT-qPCR. The morphologies of
MG63 and NHOst cells are shown in Fig. 1A. Comparison with the NHOst group, the
level of PVT1 in the MG63 group exhibited a significant increase, as revealed by
the findings (Fig. 1B, p
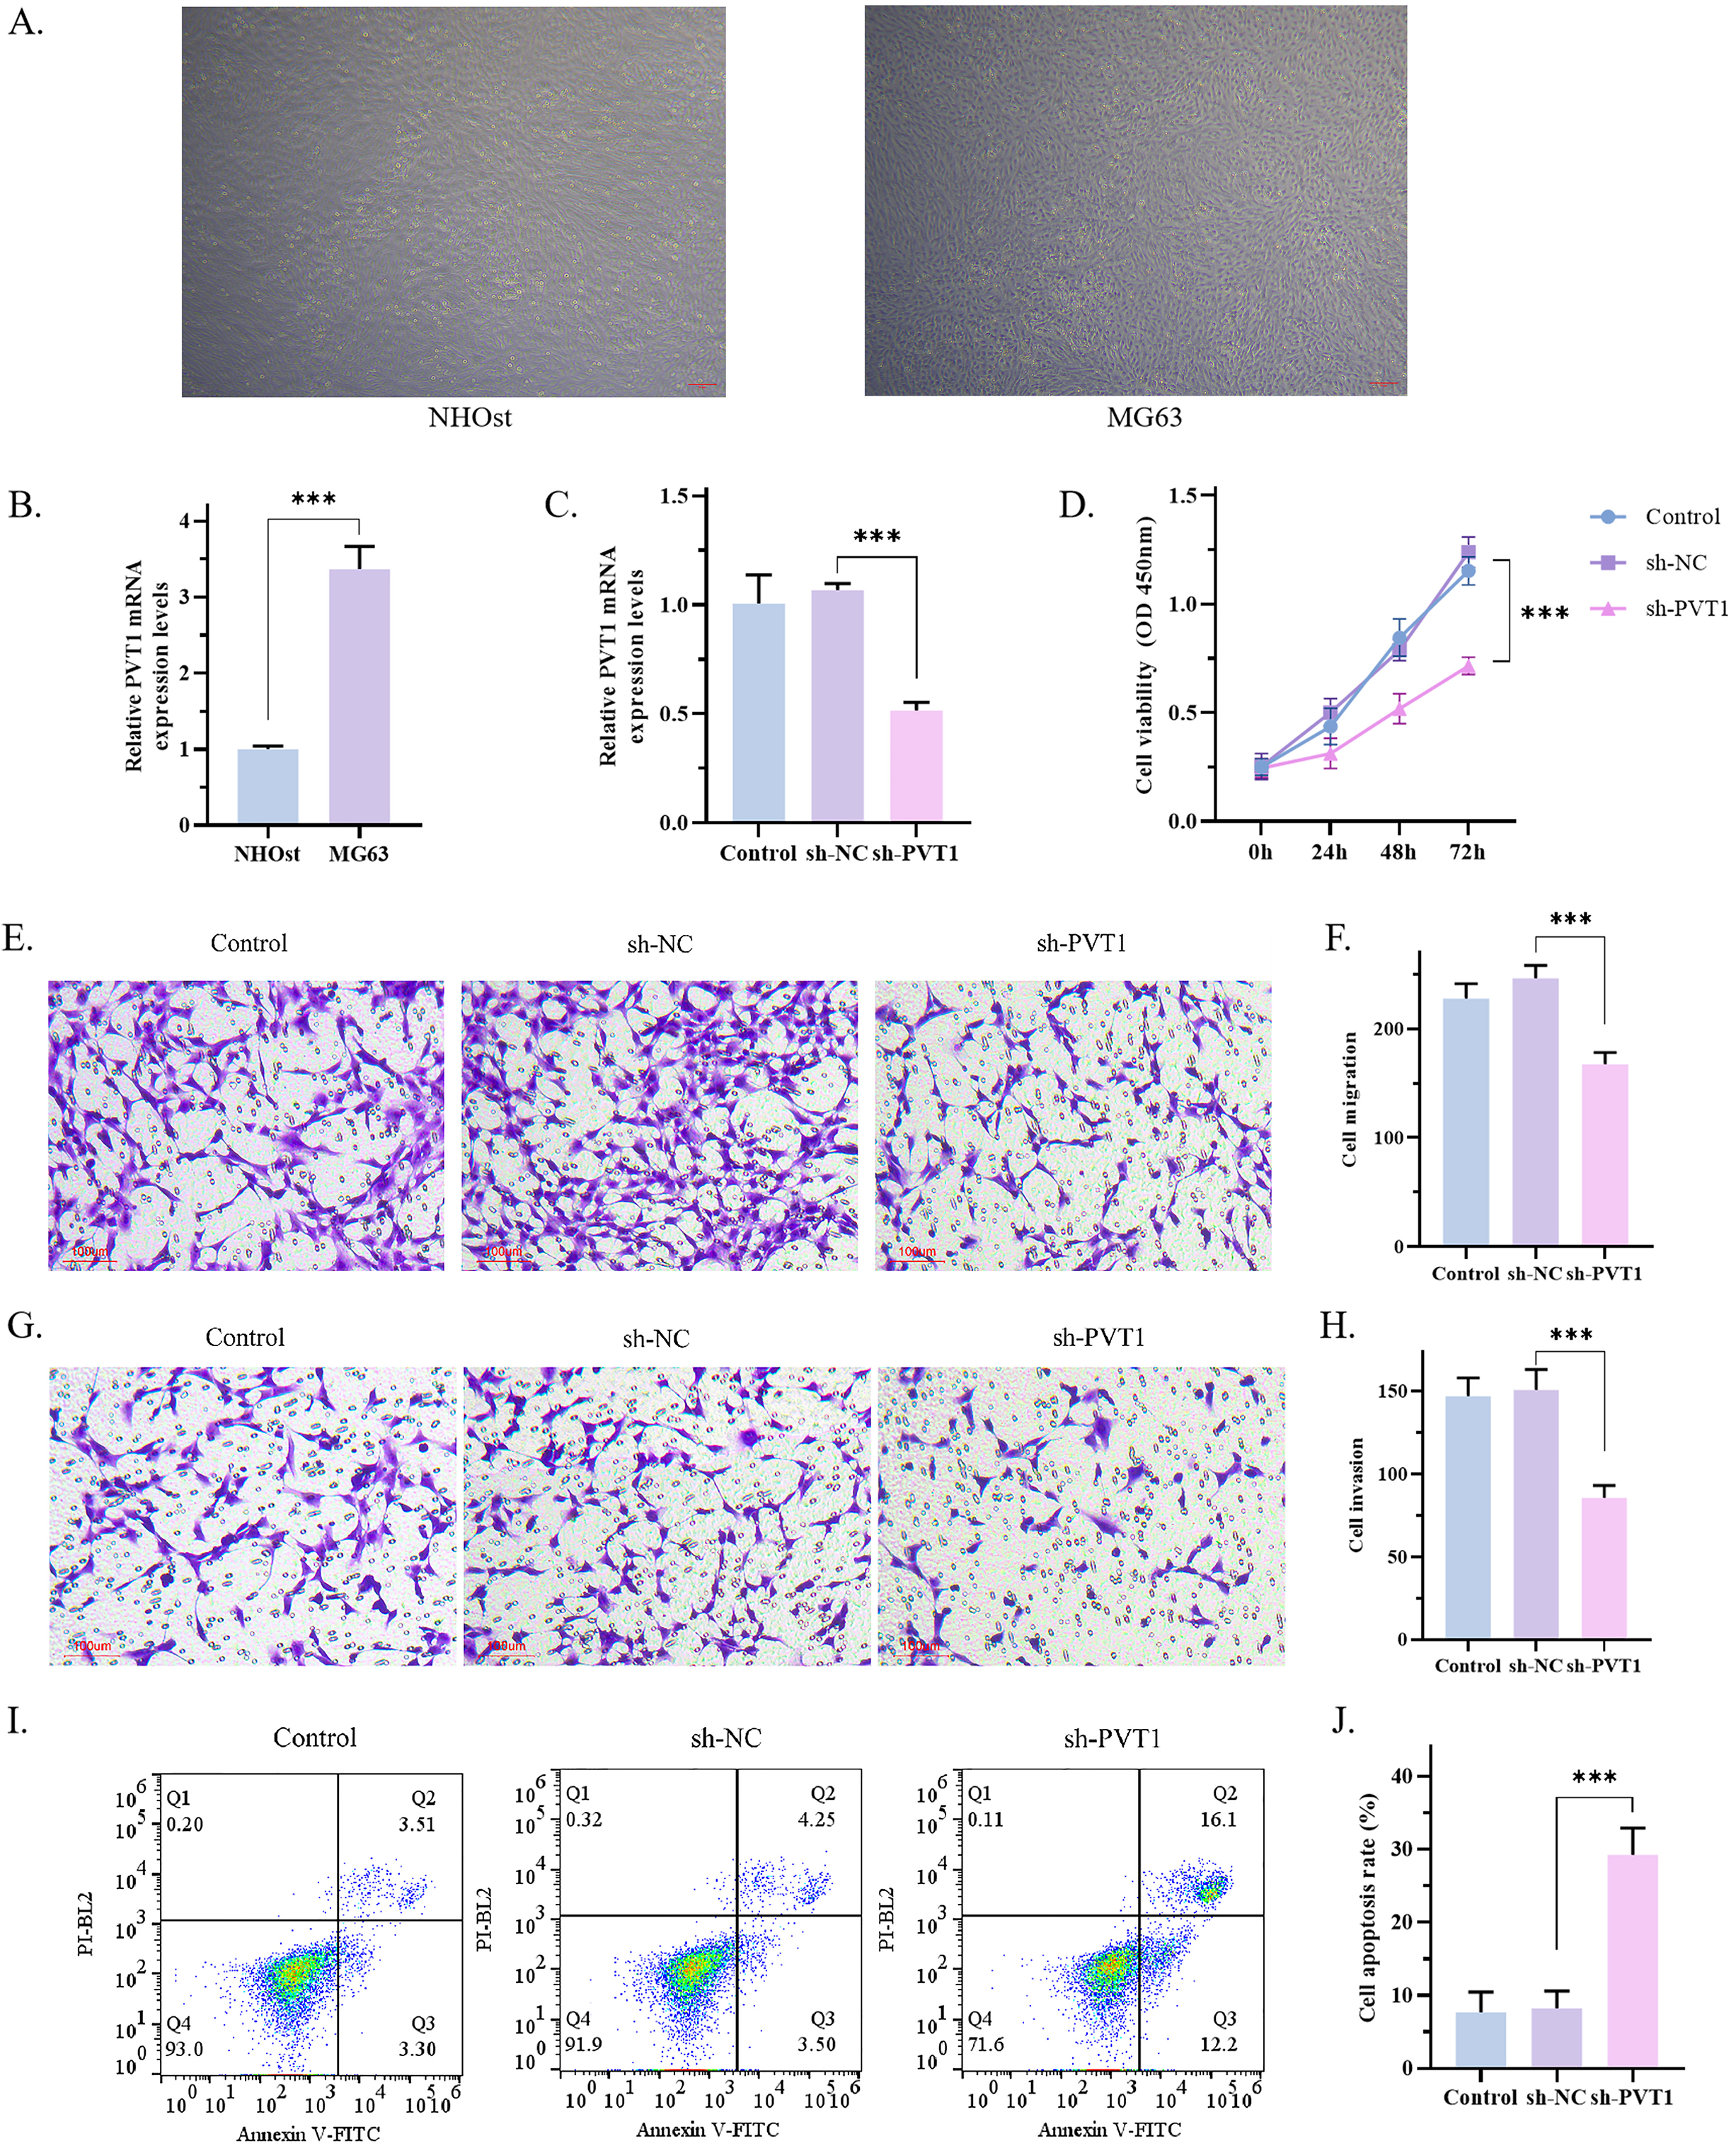
 Fig. 1.
Effects of PVT1 on proliferation, migration, invasion and
apoptosis of MG63 cells. (A) The morphology of MG63 and NHOst cells was observed
under microscope (scale bar: 50μm). (B) The expression of PVT1 in MG63 and NHOst was detected by
RT-qPCR. The results showed that the expression of PVT1 in MG63 cells was
significantly higher than that of NHOst (p = 0.0002). (C) The
transfection efficiency of PVT1 detected by RT-qPCR. The results showed that the
expression of PVT1 was significantly decreased in sh-PVT1 group (p =
0.0003). (D) The results of CCK8 assay showed that sh-PVT1 inhibited the
proliferation of MG63 cells (p
Recent reports have suggested an association between ferroptosis. It is reported
that ferroptosis is inhibited in OS, and that OS progression was inhibited when
ferroptosis is activated [9, 14, 25]. To investigate whether PVT1 promotes the
progression of OS by inhibiting ferroptosis, we examined ferroptosis-related
indicators (ferroptosis inducers: ROS, MDA, and Fe
 Fig. 2.
PVT1 inhibited cell ferroptosis. (A,B) The ROS levels in MG63
were determined by fluorescence staining using dihydroethidium (DHE) red fluorescent dye, and the
results showed that sh-PVT1 increased the ROS levels in the cells (p
Furthermore, we investigated the effects of PVT1 on the protein expression of
GPX4. Remarkably, the sh-PVT1 group demonstrated a substantial decrease in GPX4
expression compared with the sh-NC group (Fig. 3A,B, p
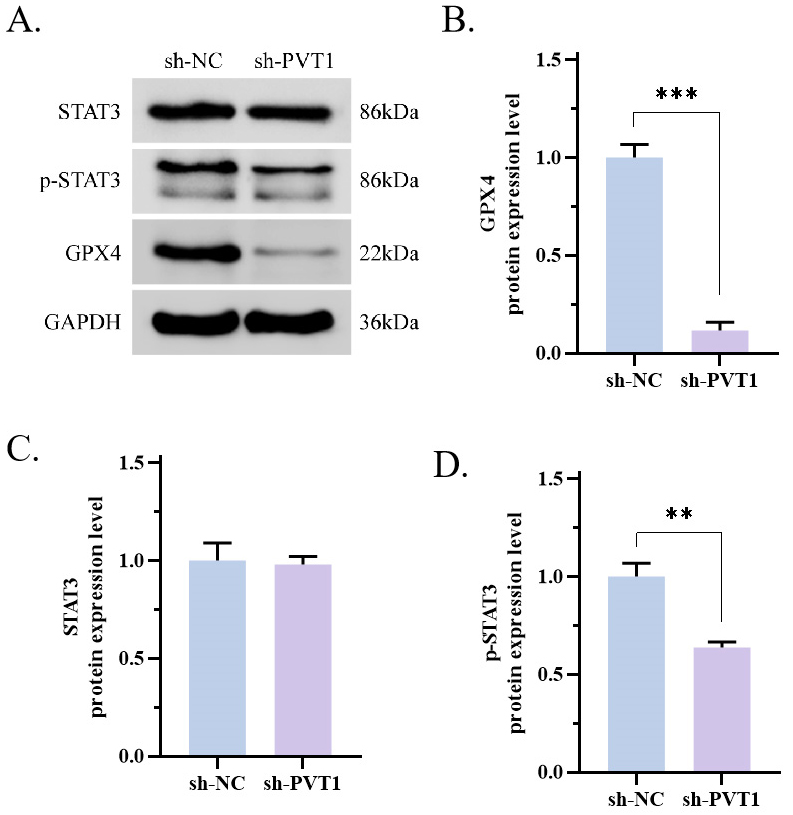 Fig. 3.
PVT1 activated the STAT3/GPX4 signaling pathway. (A–D) The
quantity of STAT3, p-STAT3 and GPX4 was ascertained through WB. The results
showed that sh-PVT1 decreased the expression of GPX4 (p
Finally, we evaluated whether the activity of STAT3 could be attributed to PVT1
regular ferroptosis in OS. For this purpose, we elevated STAT3 in MG63 cells
co-transfected with STAT3 overexpression plasmid. The activity of p-STAT3 and
GPX4 was markedly increased in the OE-STAT3 group, comparing with OE-NC group
(Fig. 4A–D). And p-STAT3 and GPX4 were reduced in the sh-PVT1 group but
increased in the sh-PVT1 + OE-STAT3 group (Fig. 4A–D, p
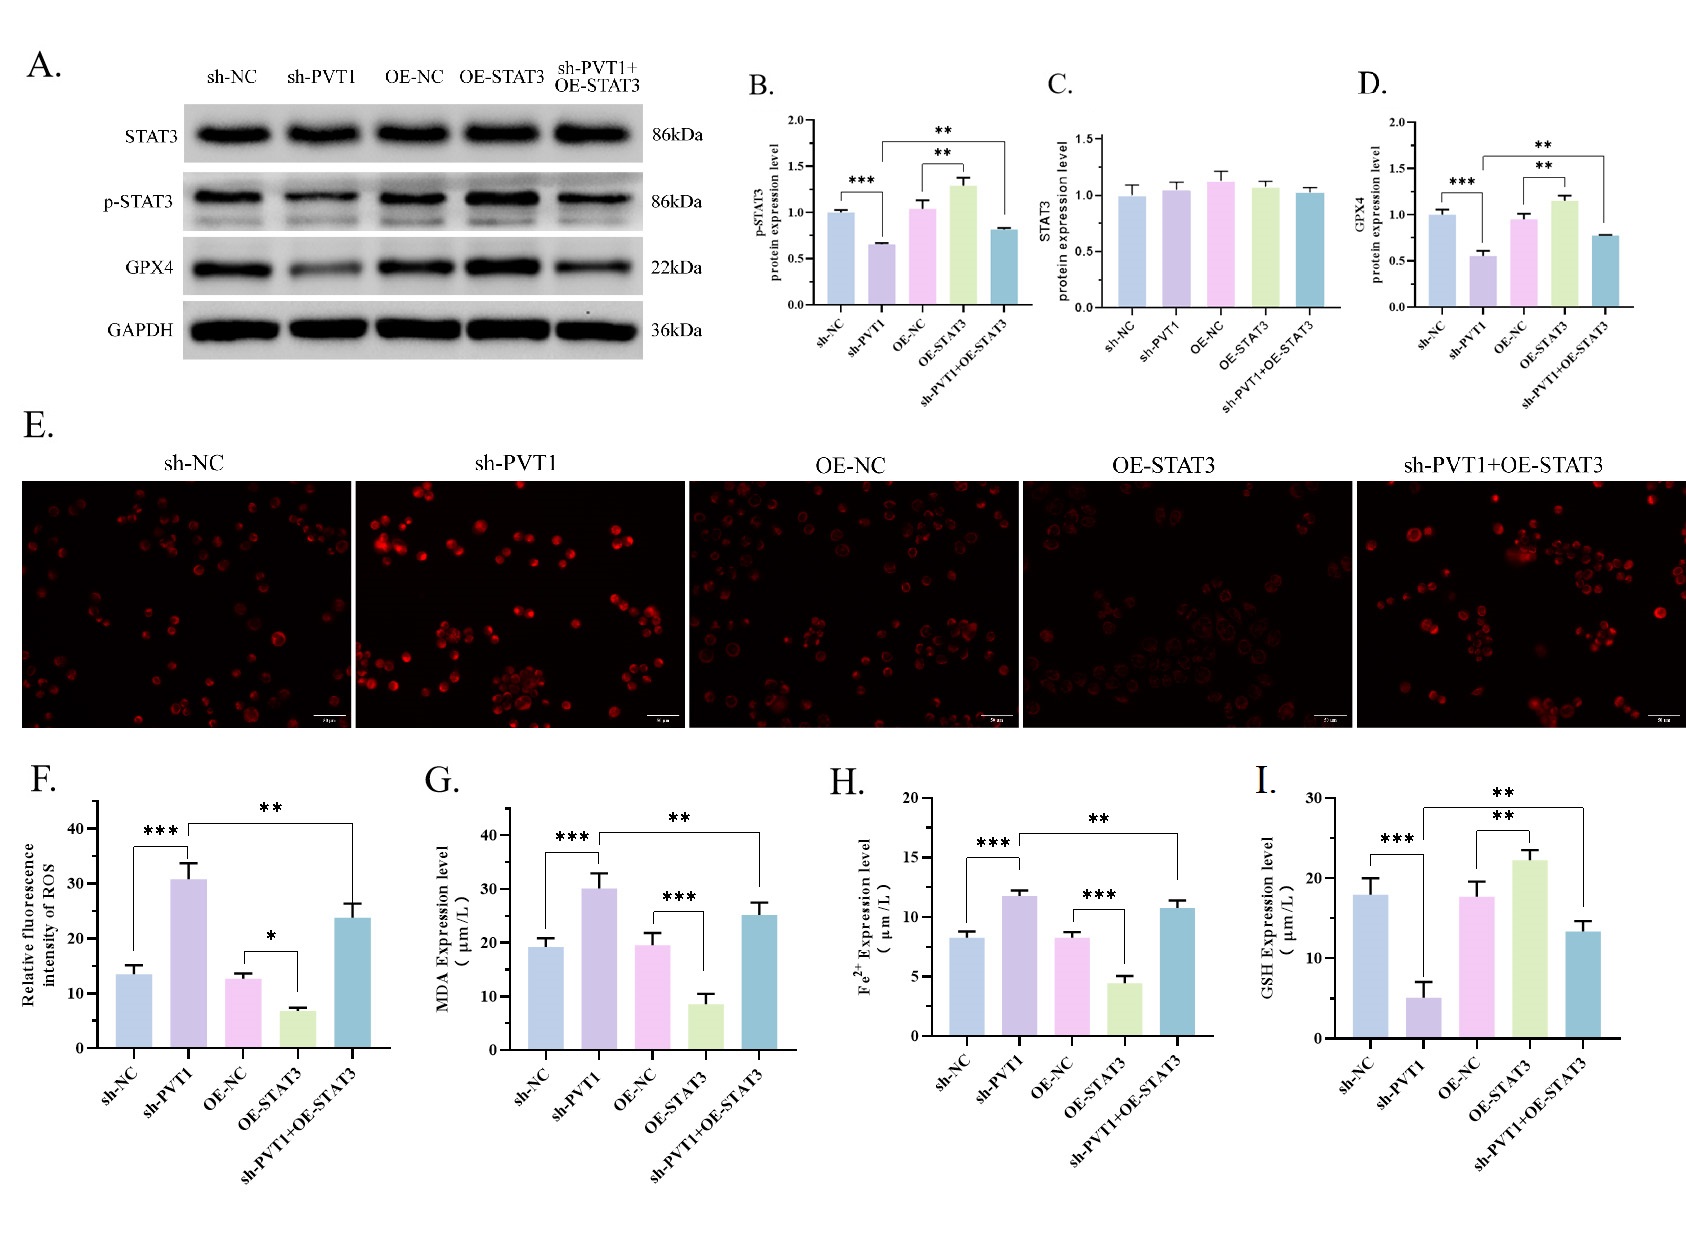 Fig. 4.
Overexpression of STAT3 reverses the effects of sh-PVT1 on
ferroptosis and STAT3/GPX4. (A–D) The protein expressions of p-STAT3 and GPX4
were determined using WB experiment. Results showed that OE-STAT3 reversed the
inhibition of sh-PVT1 on p-STAT3 and GPX4 cells. (C) sh-Negative control (sh-NC) vs. sh-PVT1
(p = 0.0003), OE-NC vs. OE-STAT3 (p = 0.0032), sh-PVT1
vs. sh-PVT1 + OE-STAT3 (p = 0.0048). (D) sh-NC vs.
sh-PVT1 (p
OS is one of the most prevalent primary bone tumors, with a 5-year survival rate below 20% due to the occurrence of metastases. Despite the development in medical approach such as neoadjuvant chemotherapy, OS patients still develop tumor recurrence and metastasis, particularly lung metastasis [2, 3]. Therefore, it is essential to explore innovative therapies and medications to enhance the outcome of OS patients. Over the past few years, multiple investigations have demonstrated the dysregulation of lncRNAs involving in cancer progression and associating with poor prognosis in OS patients [30, 31, 32, 33]. Given the role of lncRNAs in cancer, some studies have proposed that lncRNA PVT1 is a predictor of OS [34]. Therefore, we aimed to further explore the function of PVT1 in the progression of OS, and to reveal the underlying signaling transduction of PVT1-mediated ferroptosis in OS metastasis.
LncRNAs are a heterogeneous group of non-protein-coding transcripts with
sequences higher than 200 nucleotides [35]. As oncogenes or tumor suppressors,
lncRNAs may play intricate and precise regulatory functions in the development
and spread of cancer, according to mounting evidence. Studies have consistently
indicated a strong link between poor prognosis and high PVT1 transcript levels in
the malignancies of nasopharyngeal carcinoma, colorectal cancer, and non-small
cell lung cancer [9]. We discovered that osteosarcoma cells generated more PVT1.
This is consistent with previous studies [14]. Subsequently, we investigated
effect of PVT1 on OS metastasis. The results indicated that downregulation of
PVT1 significantly attenuated the proliferation, invasion, and migration of OS
cells, indicating that PVT1 is crucial to the progression of OS. Current studies
have found that PVT1 controls cancer progression through multiple pathways. For
example, PVT1 contributes to pancreatic cancer drug resistance via the
miR-619-5p/Pygo2 and the miR-619-5p/ATG14 axes, activates the miR-214-3p/GPX4
pathway to mediate ferroptosis, and regulates the miR-143/HK2 axis in gallbladder
cancer to promote tumor progression [7, 36, 37]. Considering that ferroptosis
plays a critical role in the development of OS [38, 39], we determined the
alterations in ferroptosis-related indicators (ROS, MDA, Fe
Our results showed that PVT1 is highly expressed in MG63 cells compared with
NHOst cells. Knockdown of PVT1 can inhibit the proliferation, migration and
invasion of MG63 cells, and promote cell apoptosis. sh-PVT1 also increased
intracellular ROS, MDA, Fe
OS, Osteosarcoma; PVT1, Plasma-cytoma variant translocation1; STAT3, Signal transducer and activator of transcription 3; MDA, Malondialdehyde; GSH, Glutathione; ROS, Reactive oxygen species; GPX4, Glutathione peroxidase 4; HK2, Hexokinase 2; LncRNAs, Long non-coding RNAs; Cyclin D1, G1/S-specific cyclinD1; C-MET, Cellular-mesenchymal epithelial transition factor; PI3K, Phosphatidylinositol 3-kinase; AKT, Serine/threonine kinase; RCD, Regulatory cell death; OE-STAT3, Overexpression STAT3; sh-PVT1, Small hairpin PVT1; Pygo2, Pygopus family PHD finger 2; ATG14, Autophagy-related gene 14; CCK8, Cell counting kit-8; RT-qPCR, Real-time fluorescence quantitative PCR analysis; WB, Western blot.
The original data involved in the present manuscript are available under reasonable requests from the corresponding author.
Conceptualization and investigation: GL, JF, SH, QL; methodology and resources: GL and QL; writing and Original Draft Preparation: GL; Critical review and Editing: QL. All authors contributed to editorial changes in the manuscript. All authors have read and approved the final manuscript. All authors have participated sufficiently in the work and agreed to be accountable for all aspects of the work.
Not applicable.
Not applicable.
This research received no external funding.
The authors declare no conflict of interest.
References
Publisher’s Note: IMR Press stays neutral with regard to jurisdictional claims in published maps and institutional affiliations.