


 , Maria Vulf 1, Anastasia Minchenko 1, Natalia Gazatova 1, Georgy Kuznetsov 2, Natalia Todosenko 1, Larisa Volkova 3, Pavel Ivanov 1, Larisa Litvinova 1
1 Center for Immunology and Cellular Biotechnology, Institute of Medicine and Life Sciences, Immanuel Kant Baltic Federal University, 236001 Kaliningrad, Russia
2 Surgical Department, Regional Clinical Hospital Kaliningrad, 236035 Kaliningrad, Russia
3 Medical Faculty, Moscow University for Industry and Finance “Synergy”, 125190 Moscow, Russia
Abstract
Epidermal growth factor receptor 4 (ERBB4) and neuregulin 4 (NRG4) have been shown to reduce steatosis and prevent the development of non-alcoholic steatohepatitis in mouse models, but little to nothing is known about their role in non-alcoholic fatty liver disease (NAFLD) in humans. This study is the first to investigate the expression of ERBB4 and NRG4 mRNAs and their role in lipid metabolism in the livers of individuals with obesity, type 2 diabetes and biopsy-proven NAFLD.
Liver biospecimens were obtained intraoperatively from 80 individuals. Quantitative reverse transcription polymerase chain reaction was used to measure the expression levels of mRNAs ERBB4 and NRG4, as well as key lipogenesis genes in the liver tissue of the donors. Histological analysis was conducted on liver biopsies from 36 subjects, and the levels of the examined transcripts were compared with the stage of NAFLD.
In individuals with elevated body mass index (BMI), ERBB4 and NRG4 levels decreased, while ACACA levels increased. A strong negative correlation was observed between NRG4 and ACACA levels. No deregulation of the analyzed transcripts was detected in NAFLD.
The study demonstrates a decrease in ERBB4 and NRG4 mRNA expression in the livers of subjects with high BMI but not in those with NAFLD. The correlation of the studied transcripts with major lipogenesis genes was assessed, and on this basis a putative scheme for NRG4-mediated suppression of hepatic de novo lipogenesis was hypothesised, offering new research vectors in this field.
Keywords
- ERBB4
- NRG4
- obesity
- NAFLD
- steatosis
- NASH
Non-alcoholic fatty liver disease (NAFLD) is currently emerging as one of the most common chronic liver diseases in the world, affecting 24–32% of the global population [1]. NAFLD encompasses a spectrum of diseases ranging from hepatic steatosis to non-alcoholic steatohepatitis (NASH), which can develop into liver cirrhosis and hepatocellular carcinoma. Hepatic steatosis is diagnosed when more than 5% of the liver area consists of fatty inclusions, while NASH involves inflammation and hepatocellular ballooning in addition to lipid infiltration [2]. Since NAFLD ultimately leads to oncological diseases [3] and imposes a heavy socioeconomic burden for the state, research into the molecular mechanisms of NAFLD for prevention and early treatment is particularly relevant.
Promising biomarkers for the diagnosis [4] and potential therapy [5] of NAFLD include proteins from the epidermal growth factor receptor (ERBB) family. This family consists of four transmembrane receptor tyrosine kinases that bind various growth factors [6]. For a long time, research interest in NAFLD has focused primarily on ERBB1 (also known as EGFR). In animal models, ErbB1 has repeatedly been shown to promote steatosis, while its inhibition significantly reduced liver lipid infiltration, injury, fibrosis, and increased glucose sensitivity [7, 8, 9, 10]. However, other members of the ERBB family are less well studied. Since ERBB proteins dimerize heterotypically with each other [11], in this context it is important to investigate the mechanisms and signaling pathways mediated by the less studied ERBB2, ERBB3 and ERBB4. Of particular interest in recent years has been the last member of this family, ERBB4, and its specific ligand neuregulin 4 (NRG4).
As we have already discussed the structural and functional properties of the ERBB4 and NRG4 proteins, their role in the pathogenesis of metabolic syndrome and its components, and the specifics of their expression and production in humans [12], only the most important aspects will be emphasised here.
Studies have highlighted Nrg4 and Erbb4’s protective roles and positive modulation of energy metabolism in the liver, primarily observed in animal models [5, 13, 14, 15, 16]. However, their expression/production and their overall role in human pathophysiology remaim less understood. For example, in Nrg4 knockout mice with NASH, Nrg4 deficiency was shown to be associated with an increase in liver inflammation and fibrosis [13]. Conversely, overproduction of Nrg4 in the liver and white adipose tissue inhibited insulin resistance and suppressed hepatic lipogenesis [5]; it also protected against hepatic steatosis by activating fatty acid oxidation and ketogenesis [14]. ErbB4-deleted mice developed metabolic syndrome features when fed a medium-fat diet: they showed increased obesity, dyslipidemia, hepatic steatosis, hyperglycemia, hyperinsulinemia and insulin resistance compared to wild-type mice [15]. Recent study demonstrated that administring Nrg4 protein to aged mice can improve age-related insulin resistance and impaired glucose homeostasis, reduce fat mass, and alleviate hepatic steatosis and sarcopenia [16].
There are few studies of human-derived specimens. One study suggests that genetic variations of NRG4 in the Chinese population may be either a risk (in the case of a loss-of-function mutation) or a protective factor (in the case of a gain-of-function mutation) for the development of NAFLD and associated metabolic disorders [17]. A genome-wide association study in Thai patients identified a significant association between morbid obesity and a single nucleotide polymorphism in the ERBB4 gene [18].
Thus, as shown in animal models, Erbb4 and Nrg4 have beneficial effects and could hypothetically be used to alleviate NAFLD. However, animal models are not always an accurate representation of the human body. Therefore, it is necessary to initiate studies on liver biosamples from NAFLD patients to evaluate how the results obtained in animal models relate to human pathophysiology. The aim of this work was therefore to measure ERBB4 and NRG4 gene expression in NAFLD and obesity to assess its deregulation in these pathological conditions.
Verification of the diagnosis and inclusion of study participants was carried out at the Regional Clinical Hospital in Kaliningrad. Prior to elective abdominal surgery performed under general anesthesia, participants underwent standard dietary adjustment. All obese patients were required to discontinue medication affecting carbohydrate and lipid metabolism 36 hours before surgery. A fasting blood sample was taken on the morning of surgery. During surgery, liver samples of up to 0.5 cm3 were collected for RNA extraction (immediately placed in 600 µL RNAlater solution (Ambion, Waltham, MA, USA)) and up to 1 cm3 for histologic analysis (immediately fixed in 5 mL neutral buffered formalin (SigmaMed, Moscow, Russia)). The study was conducted in accordance with the World Medical Association Declaration of Helsinki (2000) and the Protocol to the Convention on Human Rights and Biomedicine (1999). The study was approved by the local ethics committee of the Immanuel Kant Baltic Federal University: IKBFU Ethics Committee Conclusion №40 of 26.06.2023. All of the participants provided signed informed consent. All interventions were performed by highly qualified medical professionals and posed no risk to the patients’ health.
Inclusion criteria: Participants were eligible if they were over 21 years of age, had received a diagnosis of their health condition from an official healthcare provider at the Kaliningrad Regional Clinical Hospital and were referred for planned abdominal surgery. Eligible surgeries included hernia repair, gastric resection, and interventions for various gallbladder and bile duct pathologies (e.g., cholelithiasis, cholecystitis, polyposis, cysts, etc.). Aditionally, participants had to declare their willingness to participate in the study and donate a small tissue sample and their blood (approx. 12 mL) by giving informed written consent.
Exclusion criteria: Patients were excluded if they had infectious liver diseases (such as hepatitis), concomitant somatic and infectious diseases in the acute inflammatory stage, known human immunodeficiency virus infection, or any malignant or benign neoplasms. Individuals under 21 years old or those who refused to undergo medical and laboratory examinations during the study or to sign the informed consent form were also excluded.
Biochemical parameters were measured in blood serum (fasting blood glucose, alkaline phosphatase, alanine transaminase, aspartate aminotransferase, total bilirubin, direct bilirubin, indirect bilirubin, high-density lipoprotein cholesterol, low-density lipoprotein cholesterol, total cholesterol, triglycerides, total protein, gamma-glutamyltransferase, pancreatic alpha-amylase). The analysis was performed using an automated biochemical analyzer, Furuno CA-180 (Furuno Electric Company, Nishinomiya, Hyogo, Japan) with DiaSys test systems (DiaSys Diagnostic Systems, Holzheim, Hessen, Germany).
Histological analysis of liver biopsies was performed to confirm NAFLD. Liver wedge biopsies (approx. 1 cm3) were obtained intraoperatively by incisional biopsy from the left lobe of the liver and immediately fixed in neutral-buffered formalin. Paraffin sections of the liver, stained with hematoxylin and eosin, were examined by traditional histologic examination using a Leica DM3000 microscope (Leica Microsystems, Wetzlar, Hessen, Germany). The biopsies analyzed contained at least four portal tracts and were deemed informative. The categorisation of liver morphology was bases on the LITMUS NAFLD Atlas [19].
The histologic parameters (steatosis, ballooning, lobular inflammation, portal inflammation, fibrosis) were scored according to an adjusted “Steatosis – Activity – Fibrosis” (SAF) scoring system (the exact analytical parameters used by the histologist in this study are given below) [19]; examples of all conditions mentioned are shown in Fig. 1:
• steatosis—0 points:
• hepatocellular ballooning—0 points: normal cell size; 1 point: pale cytoplasm, normal sized cells; 2 points: pale cytoplasm, enlarged cells;
• lobular inflammation—0 points: none; 1
point:
• portal inflammation—0 points: none or minimal; 1 point: mild; 2 points: more than mild;
• fibrosis—0 points: none; 1 point: perisinusoidal; 2 points: in 2 areas; 3 points: without complete partitions; 4 points: with partitions.
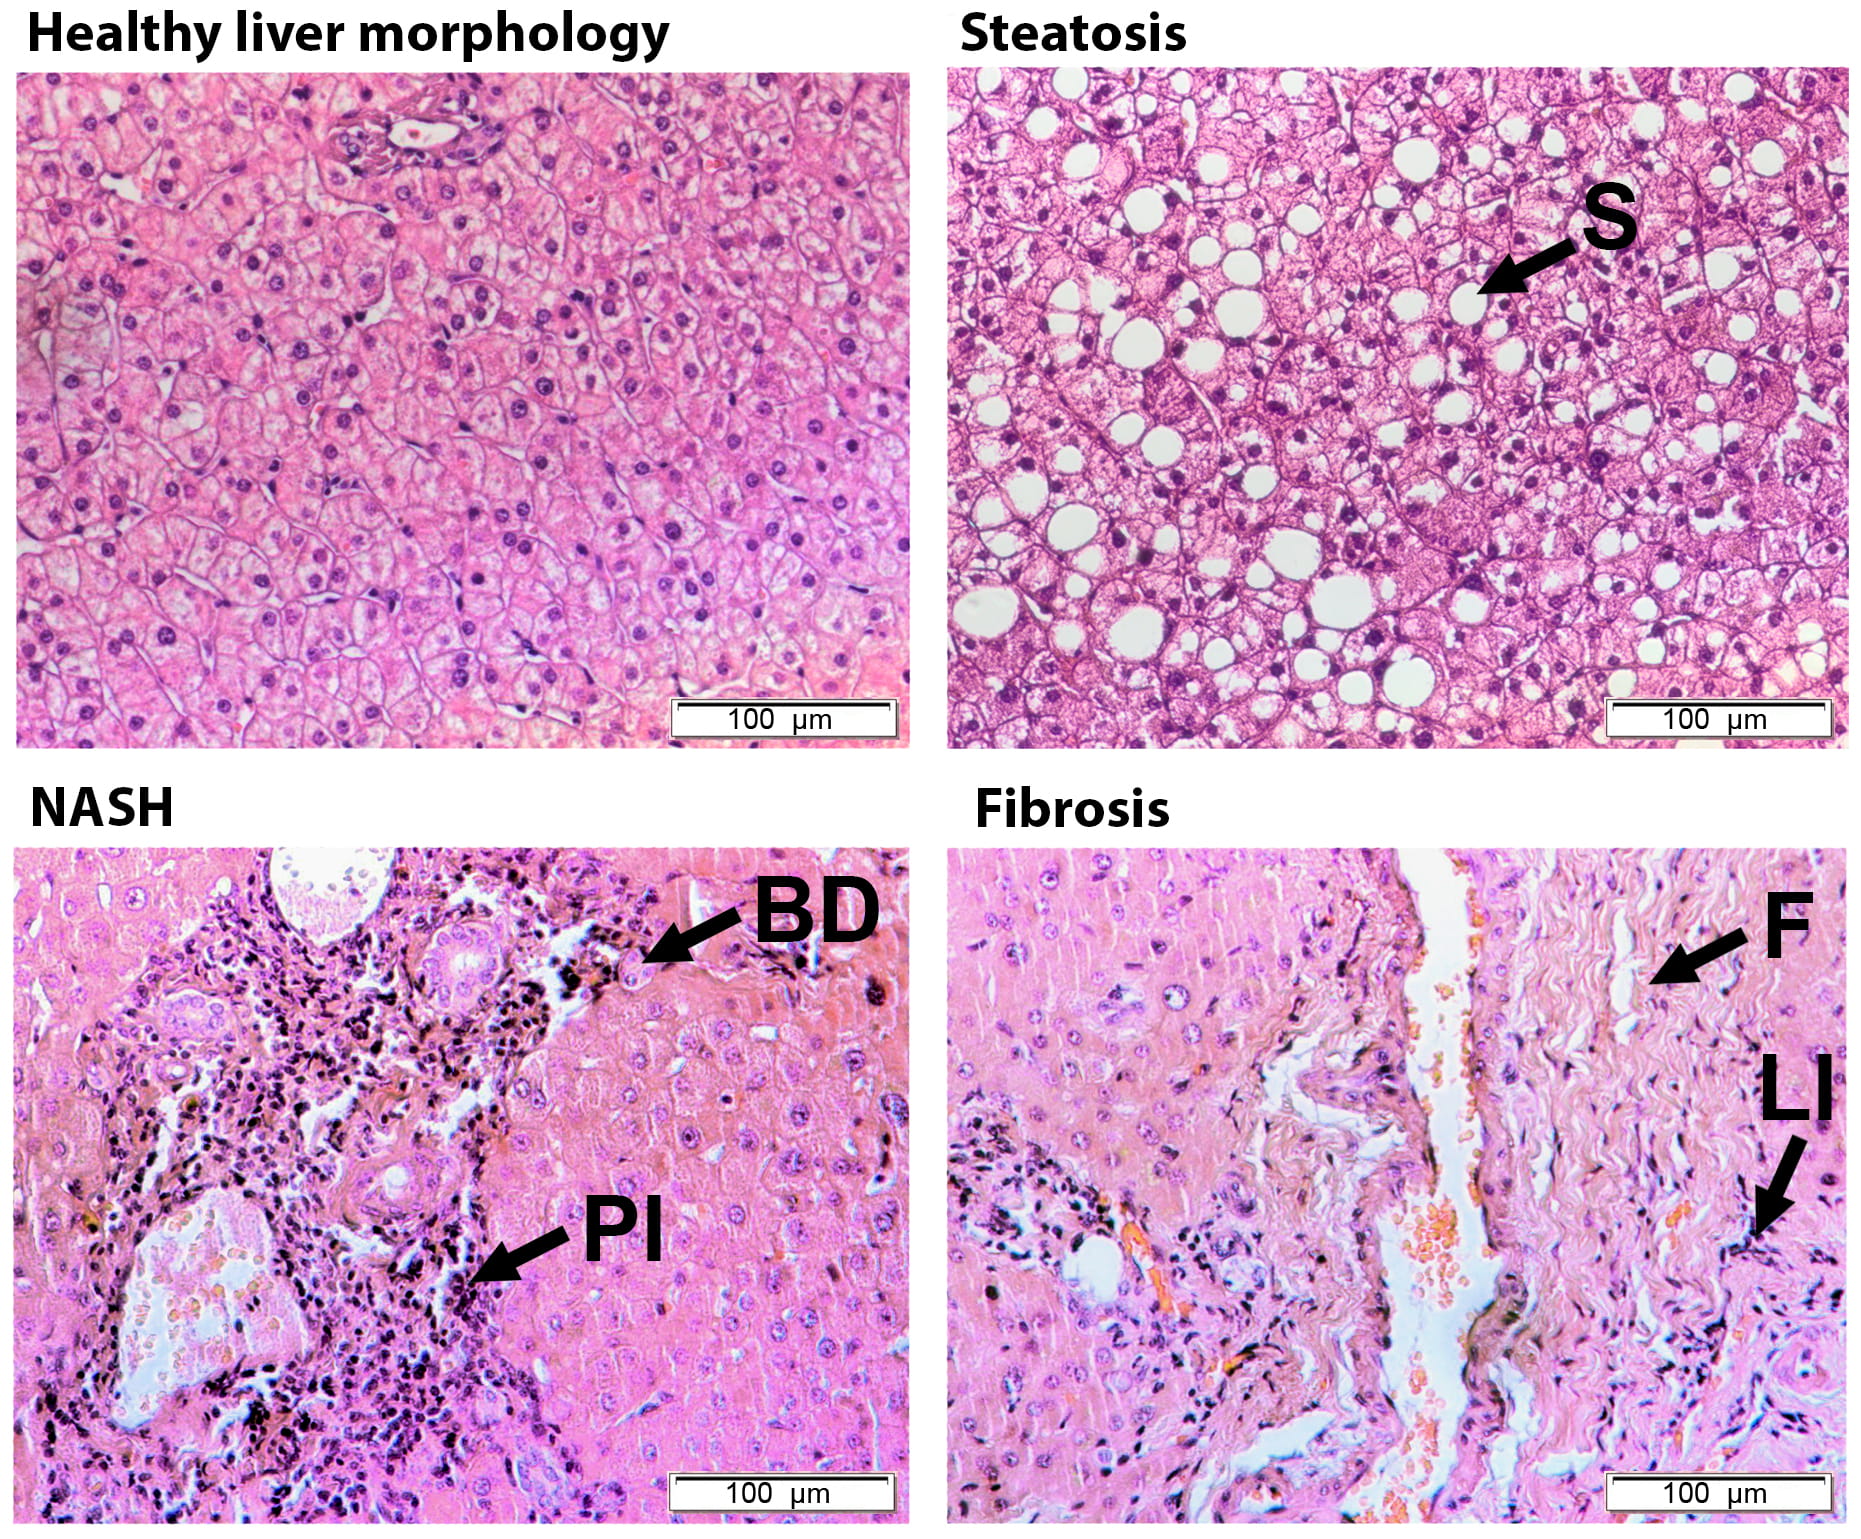 Fig. 1.
Histological examination of liver biopsies: steatosis, NASH (non-alcoholic steatohepatitis) and fibrosis. Arrows indicate different histological parameters: ballooning (BD), lobular inflammation (LI), portal inflammation (PI), steatosis (S) and fibrosis (F). Hematoxylin and eosin staining (H&E). All images have the same scale. The scale marker corresponds to 100 μm.
Normal liver morphology was defined if the biopsy showed neither steatosis nor
fibrosis and exhibited no more than 1 point of lobular, portal inflammation, or
hepatocellular ballooning. Steatosis was characterized by a score of
Liver samples were preserved in 600 µL RNAlater solution (Ambion, Austin, TX, USA) and stored at –80 °C until further use. Total RNA was extracted from approximately 100 µL of liver sample using the RNeasy Plus Mini Kit (Qiagen, Hilden, Nordrhein-Westfalen, Germany). The isolated total RNA was eluted in 45 µL of RNase-free water. RNA concentration was measured immediately after isolation using an Implen NanoPhotometer N (Implen, München, Bayern, Germany). Samples were stored at –80 °C until subsequent use in reverse transcription-polymerase chain reaction (RT-PCR).
Quantitative reverse transcription polymerase chain reaction for genes was performed as follows: universal reverse transcription was carried out using the MMLV RT kit (Evrogen, Moscow, Russia) with the addition of the RNase inhibitor RiboCare (Evrogen, Moscow, Russia) according to the manufacturer’s protocol. For quantitative polymerase chain reaction (qPCR), HS SYBR PCR mix (Evrogen, Moscow, Russia) was used. The primer sequences are listed in Table 1. Amplification and reading of qPCR results were performed on a CFX96 thermal cycler (Bio-Rad, Hercules, CA, USA). The annealing of all primers was conducted at 62 °C. After amplification, the melting curves were analyzed to verify the specificity of the reactions.
| Gene name | Primer sequence 5′ – 3′ |
| ERBB4 | Forward: TGAGAGGCCAGCACATTATC |
| Reverse: CCAATCCTTACTCGCATTCCT | |
| NRG4 | Forward: CAGCCCATTTTGTAGGTGCG |
| Reverse: TTACTAGGACCGCCAATGCC | |
| ACACA | Forward: AGCCCTCAACAAAGTCCTCG |
| Reverse: GGGCATGTAAGACAGCCAGT | |
| FASN | Forward: AGATGGCTTGCTGGAGAACC |
| Reverse: AAGCCGTAGTTGCTCTGTCC | |
| FTO | Forward: GGATGAGCCAGCTTCACTGT |
| Reverse: TGATCTCACCTTTCGGATTCACT | |
| SREBF1 | Forward: ACTTCTGGAGGCATCGCAAGCA |
| Reverse: AGGTTCCAGAGGAGGCTACAAG | |
| TFEB | Forward: CAATACCCCCGTCCACTTCC |
| Reverse: AGGTCTCGGACAGGTACTCC | |
| RPLP0 | Forward: TCTATCATCAACGGGTACAAAC |
| Reverse: AAAGAGACCAAATCCCATATCC |
To normalize gene expression data, the reference gene RPLP0 was used as
an internal control. Threshold cycles of the transcripts were converted to
relative expression values using the 2-ΔCt and
2-ΔΔCt methods. The obtained expression
profiles were transformed into Log10 to bring the data into a normal
distribution. Outliers were identified and excluded using the ROUT method (Q =
1%). Normality of the data distribution was assessed using the Shapiro–Wilk
test. If the data conformed to normal distribution, the hypothesis of equality of
sample means was tested using Student’s t-tests or one-way ANOVA for
comparison across three or more groups. If the data did not follow a normal
distribution, further assessment of differences between samples was calculated
using the non-parametric Mann–Whitney or Kruskal-Wallis test for comparison of
three or more groups. Correlations were determined using Pearson’s method for
continuous data and Spearman’s method for discrete data (histologic scores).
Differences were considered significant at p
The study enrolled 80 subjects (24 men and 56 women), aged 24 to 84 years. As indicated in Table 2, study participants were first classified according to body mass index (BMI) (groups from 1 to 4). Thus, there were 14 individuals in the lean group with a BMI of less than 25 kg/m2, 12 subjects with pre-obesity (BMI of 25–29.9 kg/m2), 27 obese (BMI over 30 kg/m2) without type 2 diabetes mellitus (T2DM), and 27 obese subjects with T2DM. Of the 80 participants, 36 underwent histologic analysis of their liver biopsies and were futher divided into four groups (5 through 8) depending on liver morphology: group 5 with normal liver morphology (without steatosis and fibrosis and also without or with minimal inflammation) consisted of 8 subjects, 9 subjects were diagnosed with steatosis (group 6), and 7 study participants had NASH (group 7). Group 8 consisted of 20 subjects with any stage of fibrosis: this group included subjects with or without a diagnosis of steatosis and NASH (but not those with normal liver morphology), and can therefore only be compared with group 5.
| Studied parameters | Lean (1) | Pre-obese (2) | Obese (3) | Type 2 diabetes (4) | Normal liver† (5) | Steatosis (6) | Steato-hepatitis (7) | Fibrosis (8) | Significant p-valuea |
| n = 14 | n = 12 | n = 27 | n = 27 | n = 8 | n = 9 | n = 7 | n = 20 | ||
| Sex, men/women | 4/10 | 5/7 | 5/22 | 10/17 | 2/6 | 2/7 | 1/6 | 5/15 | – |
| Age#, years | 52.9 |
57.1 |
47.9 |
47.8 |
61.3 |
50.7 |
49.6 |
52.2 |
– |
| Body mass index#, kg/m2 | 21.1 |
27.7 |
42.2 |
48.5 |
26.6 |
35.5 |
34.8 |
31.9 |
1–3****, 1–4****, 2–3****, 2–4****, 3–4* |
| ALT##, U/L | 16.5 |
19.9 |
23.2 |
25.5 |
14.6 |
24.2 |
30.8 |
19.5 |
1–4* |
| AST##, U/L | 25.7 |
24.6 |
28.0 |
22.4 |
20.3 |
36.8 |
28.1 |
23.7 |
– |
| FBG#, mmol/L | 4.4 |
4.7 |
5.3 |
7.3 |
5.0 |
5.2 |
4.7 |
4.6 |
1–4****, 2–4****, 3–4*** |
| ALP#, U/L | 144.6 |
177.3 |
196.4 |
195.0 |
195.1 |
260.4 |
218.0 |
182.5 |
– |
| GGT##, U/L | 39.4 |
28.2 |
35.5 |
43.1 |
23.9 |
60.8 |
38.5 |
28.7 |
1–4** |
| TBIL#, mkmol/L | 17.3 |
16.4 |
16.8 |
11.0 |
17.2 |
18.7 |
16.4 |
18.6 |
1–4*, 3–4* |
| DBIL##, mkmol/L | 4.6 |
3.9 |
3.7 |
2.9 |
4.1 |
6.1 |
3.3 |
3.6 |
– |
| IDBIL#, mkmol/L | 13.7 |
12.6 |
14.9 |
9.3 |
14.4 |
12.3 |
13.2 |
15.5 |
– |
| TP#, g/L | 71.7 |
68.7 |
73.6 |
68.1 |
70.6 |
70.3 |
73.0 |
71.0 |
3–4* |
| TC#, mmol/L | 5.2 |
4.8 |
5.9 |
5.1 |
4.4 |
5.6 |
6.5 |
5.5 |
5–7*, 5–8* |
| TG##, mmol/L | 1.2 |
1.3 |
1.8 |
1.9 |
1.1 |
1.6 |
1.9 |
1.7 |
– |
| HDL-C#, mmol/L | 1.3 |
1.1 |
1.2 |
1.2 |
1.2 |
1.1 |
1.2 |
1.2 |
– |
| LDL-C#, mmol/L | 3.3 |
3.0 |
3.6 |
2.9 |
2.8 |
3.5 |
4.3 |
3.5 |
3–4*, 5–7*, 5–8* |
| AI#, U | 3.6 |
3.7 |
3.9 |
4.1 |
2.8 |
4.5 |
4.6 |
4.2 |
– |
| p-Amil#, U/L | 19.4 |
24.8 |
19.5 |
19.1 |
23.8 |
26.5 |
22.7 |
15.7 |
5–8* |
| hs-CRP##, mg/L | 3.7 |
6.5 |
6.6 |
7.7 |
8.1 |
8.1 |
7.3 |
4.9 |
– |
a * p
b All data in the table (exept for sex composition) are presented as
arithmetic mean
# Statistically significant difference assessed by parametric tests.
## Statistically significant difference assessed by non-parametric tests.
† Normal liver morphology was defined if the biopsy showed neither steatosis nor fibrosis and no more than 1 point of lobular, portal inflammation or hepatocellular ballooning.
Abbreviations: AI, atherogenic index; ALP, alkaline phosphatase; ALT, alanine transaminase; AST, aspartate aminotransferase; DBIL, direct bilirubin; FBG, fasting blood glucose; GGT, gamma-glutamyltransferase; IDBIL, indirect bilirubin; HDL-C, high-density lipoprotein cholesterol; hs-CRP, C-reactive protein; LDL-C, low-density lipoprotein cholesterol; p-Amil, pancreatic alpha-amylase; TBIL, total bilirubin; TC, total cholesterol; TG, triglycerides; TP, total protein.
The anthropometric and biochemical characteristics for each group are presented
in Table 2. Statistical analyses were performed separately for BMI-based groups
(groups 1–4) and liver morphology groups (groups 5–7), while the fibrosis group
(group 8) was only compared with the normal liver morphology group (group 5).
Despite the wide age range, the average age did not differ significantly across
groups 1 to 4 (one-way analysis of variance (ANOVA) F(3, 72) = 1.992, p
= 0.1228) or between groups 5 to 7 (ANOVA F(2, 34) = 1.939, p = 0.1595).
Despite a higher proportion of women in the study, the gender distribution did
not differ significantly between the groups (as tested by Chi-square
Although ERBB4 and NRG4 are thought to have protective effects in NAFLD, their
expression patterns in human liver under normal and pathological conditions
remain unclear. Measurement of ERBB4 mRNA levels showed that they were
reduced by 2.75-fold in the liver of obese compared to non-obese individuals
(t(46.78) = 5.023, p
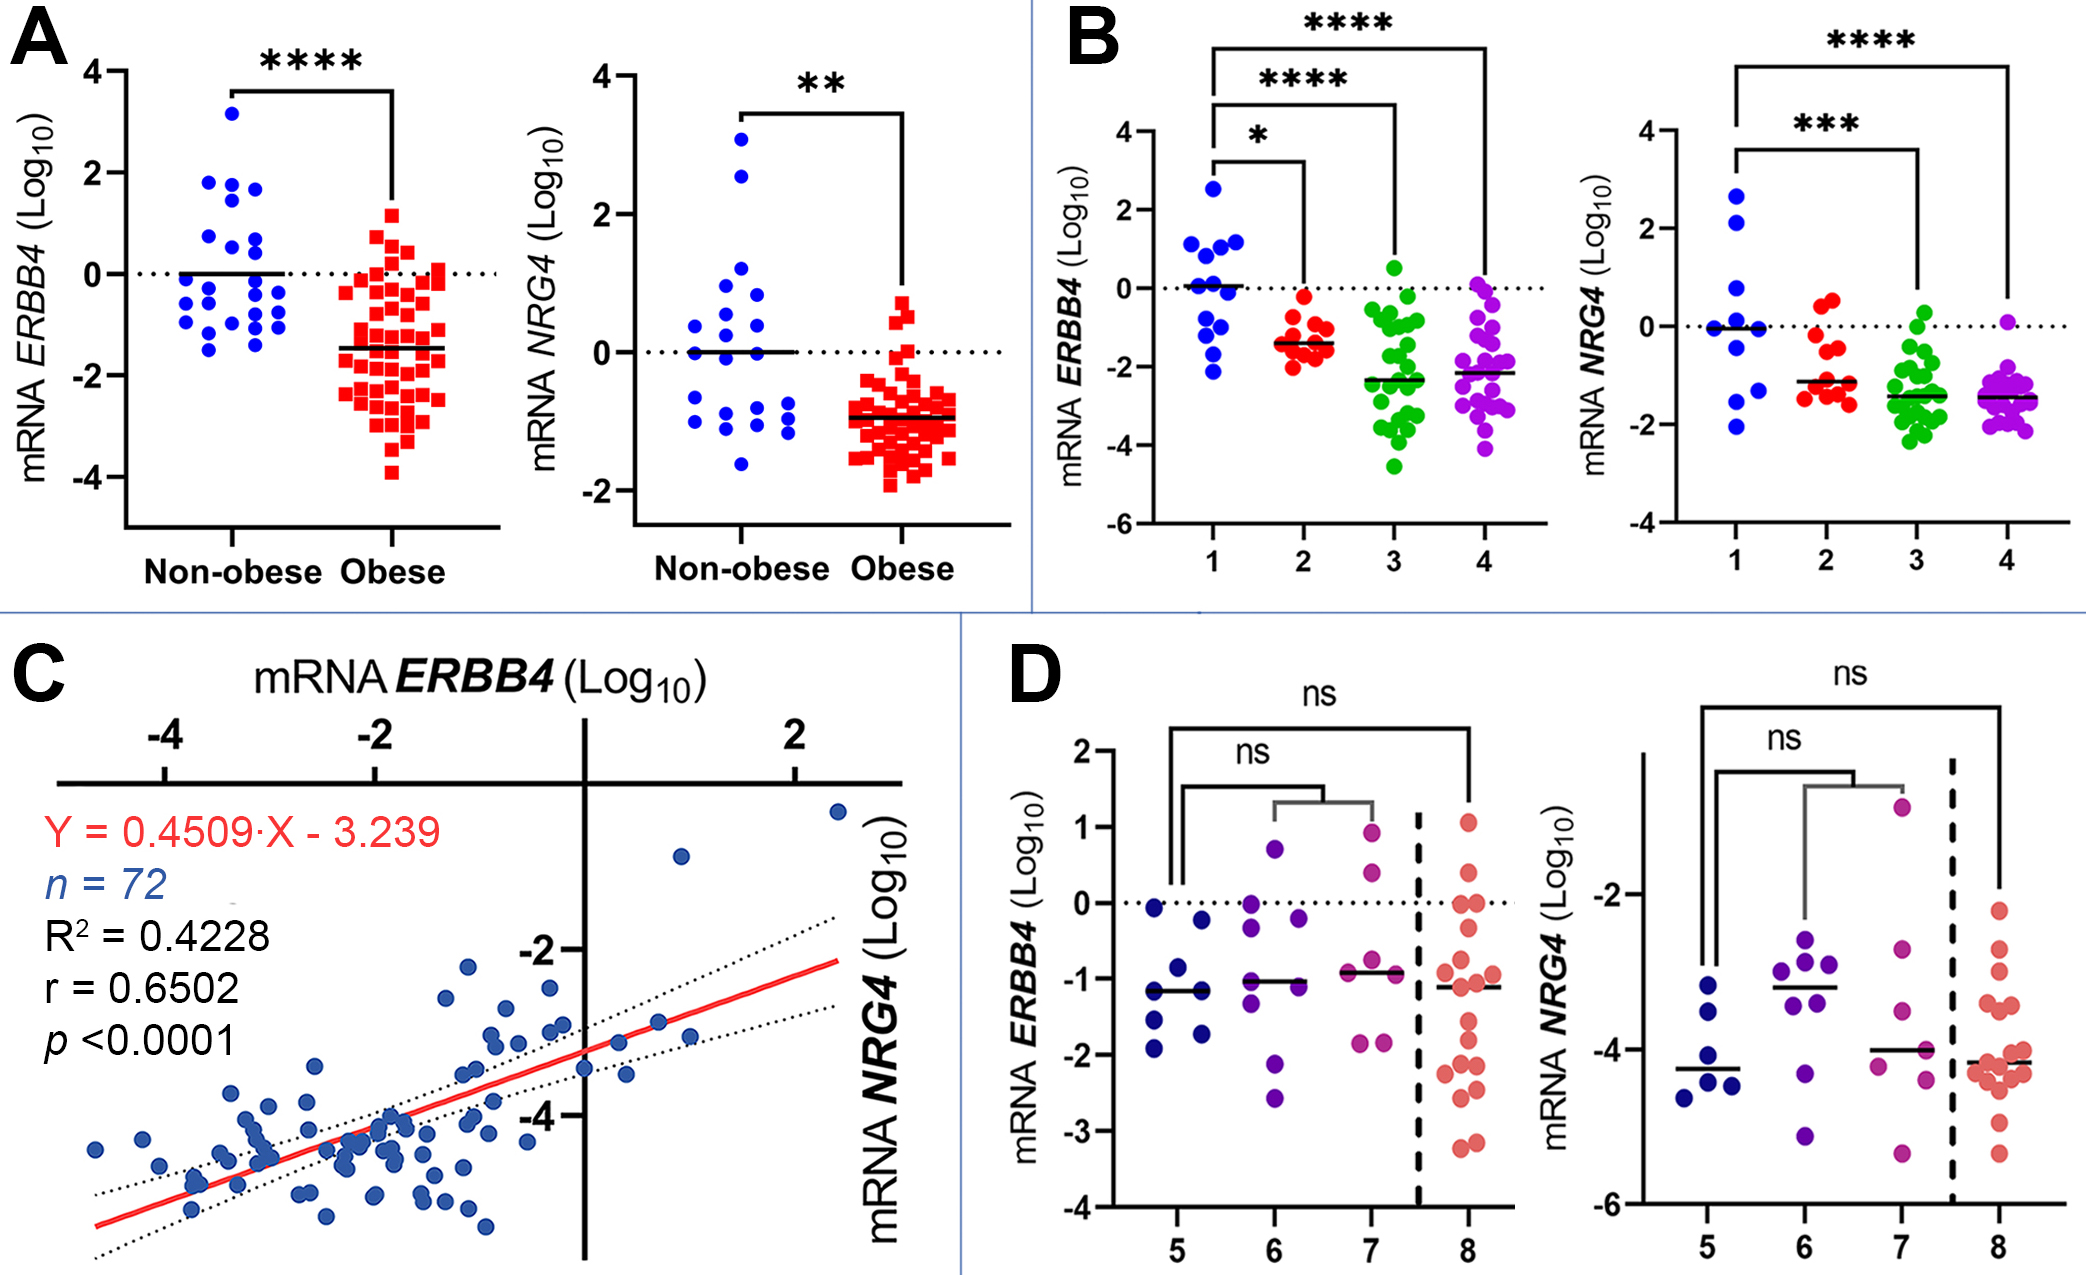 Fig. 2.
Expression of ERBB4 and NRG4 mRNAs in the
liver in different study groups. (A) The expression of ERBB4 (number of
values n = 78) and NRG4 (n = 72) in non-obese and obese subjects,
p-value was determined by Student’s t-test, the data is presented as Log10 of
2-ΔΔCt. (B) The expression of ERBB4
(number of values n = 78) and NRG4 (n = 72) in patient groups 1—lean
individuals, 2—pre-obese, 3—obese, 4—obese with type 2 diabetes mellitus,
p-value was determined by one-way ANOVA, the data are presented as
Log10 of 2-ΔΔCt. (C) A scatter plot of
ERBB4 and NRG4 mRNA expression data, r is Pearson correlation
coefficient, equation (95% confidence interval) and approximation coefficient
(R2) obtained by simple linear regression analysis, the data are presented
as Log10 of 2-ΔCt. (D) The expression of
ERBB4 and NRG4 mRNAs in patient groups 5—liver with normal
morphology (without steatosis and fibrosis and also without or with minimal
inflammation), 6—steatosis, 7—NASH, 8—fibrosis, p-value determined
by one-way ANOVA, the data presented as Log10 of
2-ΔCt. ns—non significant, * p
Liver expression of the NRG4 gene was also significantly down-regulated
(one-way ANOVA F(3, 68) = 9.264, p
Correlation analysis (Pearson, two-tailed) showed that there was a statistically
significant (p
The expression of major lipogenesis genes in the liver biospecimens was also
studied, with the results summarized in Table 3. Only the mRNA of ACACAwas significantly deregulated in the livers of the subjects with increased BMI
(Kruskal-Wallis statistic = 20.45, p
| Gene mRNA | Lean (1) | Pre-obese (2) | Obese (3) | Type 2 diabetes (4) | Normal liver† (5) | Steatosis (6) | Steato-hepatitis (7) | Fibrosis (8) | Significant p-valuea |
| ACACA## | –4.529 |
–4.479 |
–3.759 |
–3.800 |
–4.096 |
–4.394 |
–4.143 |
–4.040 |
1–3**, 1–4*, 2–3**, 2–4* |
| FASN# | –3.389 |
–3.218 |
–3.037 |
–2.830 |
–3.297 |
–3.275 |
–3.030 |
–3.086 |
– |
| FTO# | –2.725 |
–2.441 |
–2.716 |
–2.753 |
–2.466 |
–2.143 |
–2.103 |
–2.407 |
– |
| SREBF1# | –3.513 |
–3.774 |
–3.511 |
–3.410 |
–3.842 |
–3.394 |
–3.538 |
–3.625 |
– |
| TFEB# | –3.296 |
–4.421 |
–4.437 |
–4.281 |
–4.357 |
–5.018 |
–4.288 |
–4.285 |
– |
a * p
b All data in the table are presented as arithmetic mean
# Statistically significant difference assessed by parametric tests.
## Statistically significant difference assessed by non-parametric tests.
† Normal liver morphology was defined if the biopsy showed neither steatosis nor fibrosis and no more than 1 point of lobular, portal inflammation or hepatocellular ballooning.
The search for correlations with anthropometric and biochemical parameters revealed several statistically significant correlations (Fig. 3A). Hepatic ERBB4 mRNA levels correlated negatively with BMI (r = –0.5073) and fasting blood glucose (r = –0.3632); hepatic NRG4 mRNA correlated positively with total bilirubin (r = 0.2578) but negatively with BMI (r = –0.4494) and fasting blood glucose (r = –0.3625). The negative correlation of fasting blood glucose with hepatic ERBB4 and NRG4 is particularly noteworthy. There is sufficient evidence that insulin receptor substrates (IRS) are regulated by epidermal growth factor receptors (especially ERBB1 and ERBB2). In several cancer lines, ERBB1-3 has been shown to phosphorylate various IRS, resulting in modulated cellular glucose uptake [21, 22, 23]. However, we found no evidence in the literature to suggest an interaction between ERBB4 and IRS. This could be an effect of heterotypic dimerization with ERBB1-3 or an unexplored property of ERBB4, which warrants further investigation. Correlations with histological parameters are shown in Fig. 3B. Among the studied genes, ERBB4 and FTO demonstrated weak positive correlations with steatosis (r = 0.3331 at p = 0.0472 and r = 0.3692 at p = 0.0410, respectively), and ACACA demonstrated a moderate positive correlation with portal inflammation (r = 0.4206 at p = 0.0324). The correlations between the transcript levels are discussed in detail in the Duscussion section.
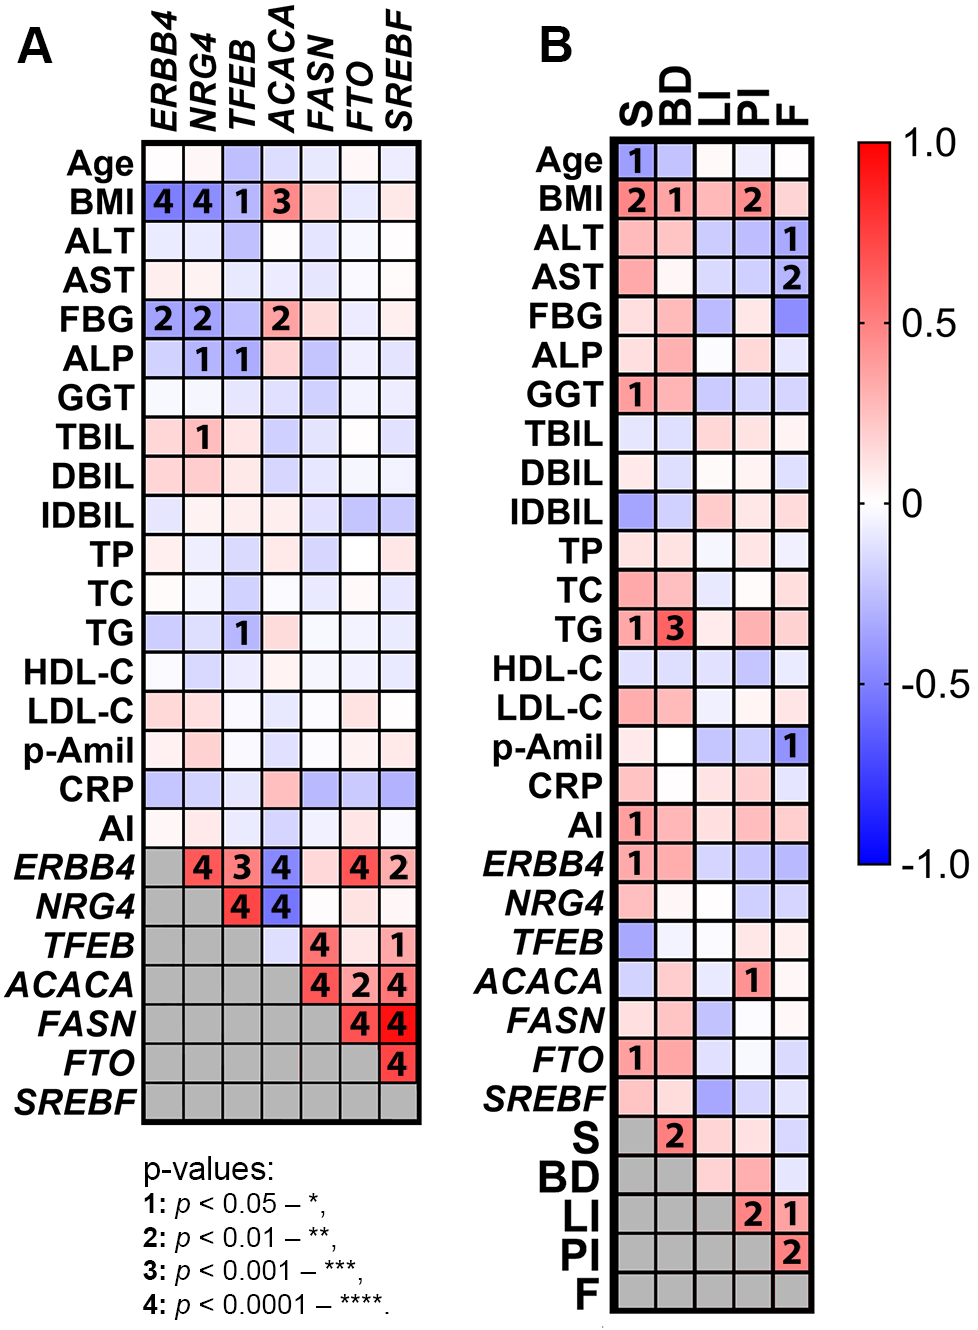 Fig. 3.
Correlations between mRNAs levels in the liver, anthropometric and biochemical parameters and histological scores (NAFLD) of the study participants. (A) Correlations between mRNAs, anthropometric and biochemical parameters with each other, Pearson correlation. (B) mRNAs, anthropometric and biochemical parameters with histological scores, Spearman correlation.
Our pilot study showed that liver ERBB4 and NRG4 mRNA levels decreased in study participants with obesity and T2DM but remained unchanged in NAFLD (Fig. 2). The patterns of NRG4 and ERBB4 expression and production in the human liver, under both normal and pathologic conditions, have not yet been investigated, and information on systemic ERBB4 and NRG4 levels in NAFLD is conflicting. For example, a study by De Munck et al. [24] (2021) failed to confirm the involvement of NRG4 in the pathogenesis of NAFLD of humans. However, several other studies have found a decrease in NRG4 plasma levels in patients with NAFLD [4, 25, 26].
The lack of differences in the expression of lipogenesis genes in the liver of humans with increased BMI (with the exception of ACACA) or NAFLD (all genes studied) was unexpected, as this contradicts the notion that NAFLD and obesity are associated with impaired de novo lipogenesis. This notion has been supported by a recent study of high-fat diet-induced NAFLD in mice [27]. These results may be influenced by the small sample size of our study, and given the limited data available on gene expression in human samples, it is difficult to interpret the data obtained correctly.
After assessing the correlations between the genes studied we constructed a putative network of interactions between ERBB4 and NRG4, the lipogenesis genes (Fig. 4, Ref. [28]). This diagram combines both the data we obtained and data from the literature and genetic interaction network databases.
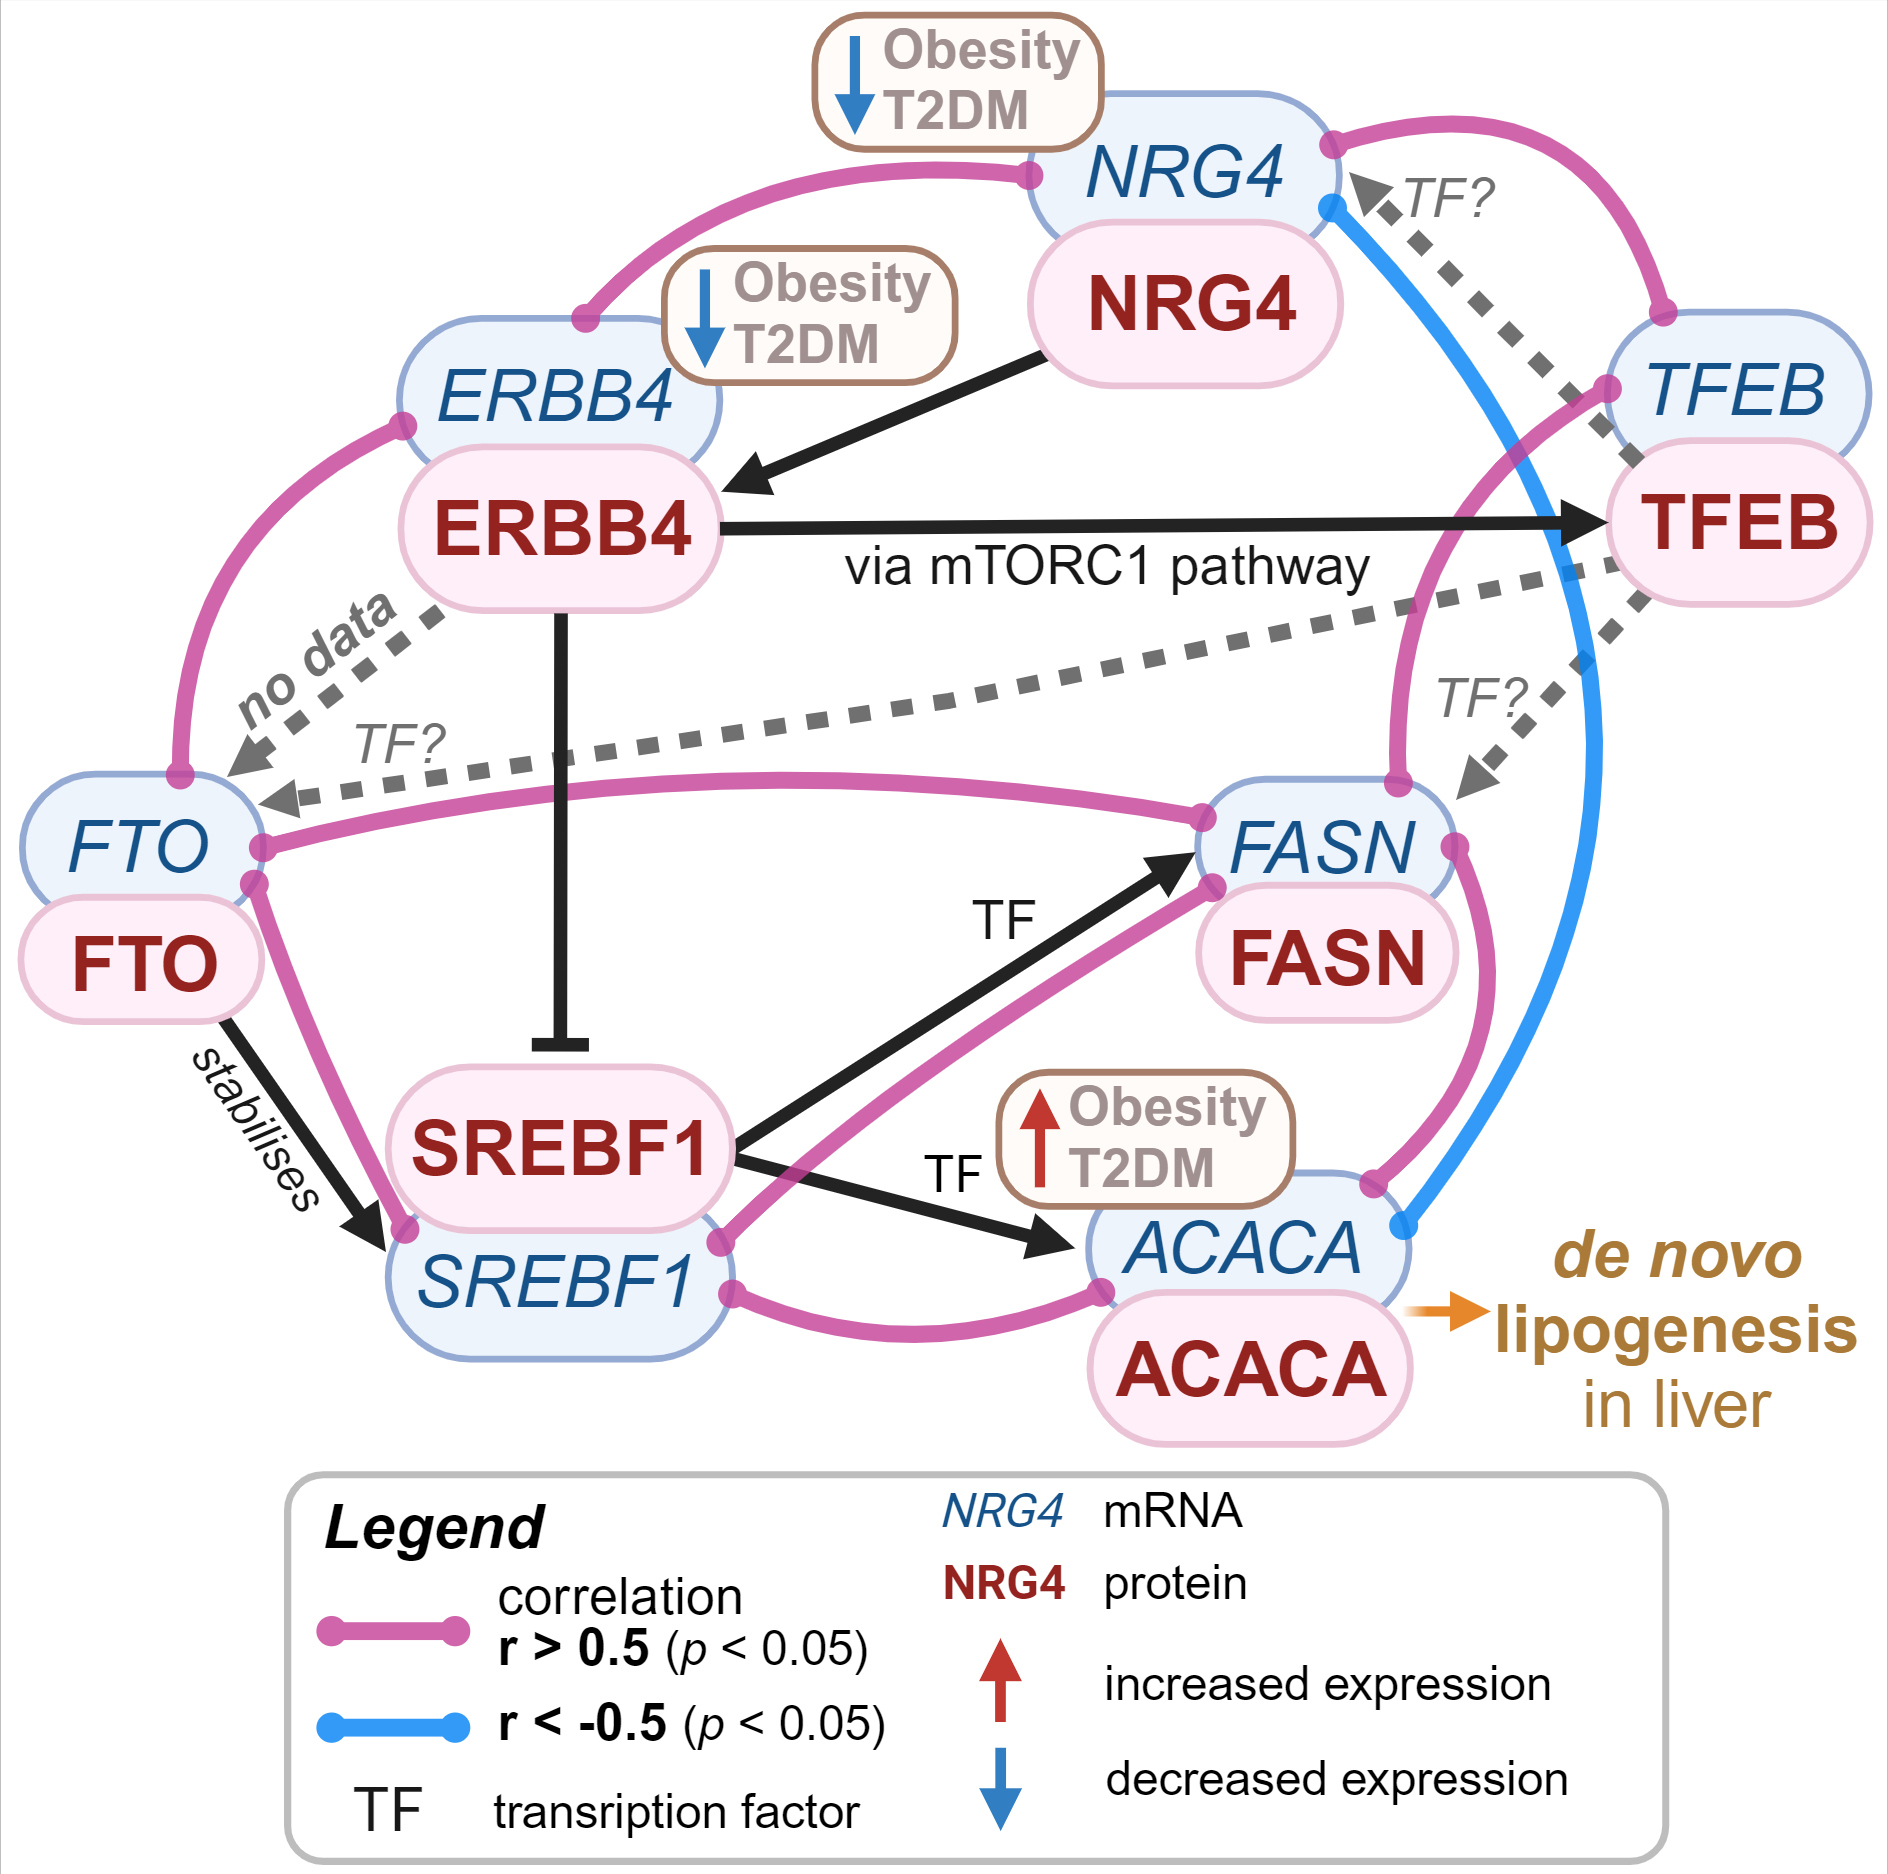 Fig. 4.
Hypothetical mechanism of NRG4-mediated suppression of lipogenesis in liver. The association of transcription factors with gene promoter regions was assessed using GeneCards [28]. Created in BioRender. Vulf, M. (2024) https://BioRender.com/m77a307. NRG4, neuregulin 4; ERBB4, epidermal growth factor receptor 4; T2DM, type 2 diabetes mellitus; FASN, fatty acid synthase gene; ACACA, acetyl-CoA carboxylase alpha; SREBF1, sterol regulatory element binding transcription factor 1; FTO, fat mass and obesity-associated protein; mTORC1, mammalian target of rapamycin complex 1; TFEB, transcription factor EB.
ERBB4 activates mTORC1 (mammalian target of rapamycin complex 1) signaling,
leading to the mobilization of the transcription factors TFE3 (transcription
factor binding to IGHM enhancer 3) and transcription factor EB (TFEB) [29].
According to our data, TFEB correlates with NRG4 and
FASN levels (r = 0.7246 at p
A strong correlation was detected between FTO and SREBF1 (r =
0.7234 at p
Just as important, a moderate negative correlation was found between
ACACA and NRG4 (r = –0.5379, p
The study has several limitations. First, due to technical limitations of the research, the number of liver biopsies analyzed was quite small comprising only 36 subjects (with only 8 of them having normal liver morphology and 16 showing signs of NAFLD). Second, due to the preservation method of the biomaterial, we were unable to perform adequate Western blots to measure the concentrations of the proteins of interest, which limited our understanding of the protein-level mechanisms. Third, several participants in our cohort had co-existing conditions, such as cholecystitis and gallbladder polyposis, which could hypothetically influence the expression of the transcripts studied. Nevertheless, given the limited number of donors, we decided to include these patients in the study. Moreover, the patients in the study group were taking drugs that affect carbohydrate and lipid metabolism, such as insulin sensitizers, statins and fibrates. These therapies can significantly influence liver function and structure, as they can alter hepatic lipid accumulation, insulin sensitivity and overall metabolic homeostasis [33]. However, this does not invalidate the results of the study: even if a patient had been undergoing hypolipidemic and/or hypoglycemic therapy for a long time before participating in our study, and this altered the morphological parameters of their liver, this would also affect the molecular metabolism in the liver. Our aim was to determine how ERBB4 and NRG4 levels in the liver were related to the morphology of the organ, without considering the reasons that led to such morphology. Finally, 70% of our study participants were women. NRG4 (at least its circulating levels) seems to depend on hormonal background in women [34]. However, no significant statistical differences were found between sexes in the data analyzed, with or without regard to sex. This should definitely be further investigated and considered when analyzing NRG4 expression profiles.
It should be noted that the study did not examine the fat distribution and skeletal muscle mass of the subjects. However, this now appears to be a very important aspect that could shed light on the issue. Given the emerging concepts of “metabolically healthy obesity” and “metabolically unhealthy normal weight”, the distribution of adipose tissue and skeletal muscle mass in relation to the development of NAFLD is of greater importance than BMI alone [35]. Reduced muscle mass (sarcopenia) is more common in metabolically unhealthy groups (when comparing metabolically healthy and metabolically unhealthy individuals with both normal weight and obesity) [36], and sarcopenia has been shown to be associated with NAFLD [37]. As recently shown by Chen et al. [16] (2024), the improvement in hepatic steatosis after administration of recombinant Nrg4 to aged mice was accompanied by a concomitant reduction in sarcopenia in these mice. All these results offer an interesting and promising vector for further research.
Thus, it is currently not possible to determine the finite role of ERBB4 and NRG4 in human NAFLD, as their expression was unchanged in the livers of NAFLD patients, but was dependent on BMI. This suggests that adipose tissue and its hypertrophy play an important role in the deregulation of ERBB4 and its ligand, which needs to be further investigated.
(1) The mRNA levels of the epidermal growth factor receptor ERBB4 and its ligand NRG4 in the liver decreased significantly in subjects with a higher BMI, but did not change in non-alcoholic fatty liver disease.
(2) The presence of fibrosis did not alter ERBB4 and NRG4 levels in the liver.
(3) A strong positive correlation between FTO and ERBB4 was observed. This hypothesized molecular association has not been reported before and requires further investigation given FTO’s critical role in obesity.
(4) NRG4 levels correlated more strongly than ERBB4 levels with ACACA mRNA levels, suggesting an antilipogenic role of epidermal growth factor NRG4 in the human liver.
The raw data are deposited to Mendeley Data (reserved DOI:10.17632/2vwv7w37j5.1) and will be publicly available as of the date of publication. All data reported in this paper will also be shared by the lead contact upon request.
MV and MB designed the research study. PI participated in the design of the research study by providing relevant guidelines for the inclusion and exclusion of patients for the present study and also assisted with the collection of the biospecimens and clinical examination. LL participated in the planning of the research study and sought references relevant to the study. GK recruited and enrolled the study participants, performed operations and obtained biopsies. MB, AM, NG and LV performed the research and acquisited the data. MB, AM and NT analysed and interpretated the data. MB, MV and LL wrote the manuscript and compiled it as a whole, while AM, NG and LV critically appraised it methodologically, PI and GK helped to describe the clinical characteristics of the study participants, and NT assessed the translation into English and proofreading according to the journal’s rules. LL and PI provided help and advice on administrative, technical and material support. LL (director of the Center), PI and GK (as practicing clinicians) interpreted the data from a clinical perspective and its significance in relation to the medical history and blood biochemistry of the study participants. All authors contributed to editorial changes in the manuscript. All authors read and approved the final manuscript. All authors have made a significant contribution to this study and have approved the final manuscript.
The study was conducted in accordance with the World Medical Association Declaration of Helsinki (2000) and the Protocol to the Convention on Human Rights and Biomedicine (1999). The research was approved by Local Ethics Committee of Immanuel Kant Baltic Federal University: IKBFU Ethics Committee Conclusion №40 of 26.06.2023. All of the participants provided signed informed consent.
We thank all the reviewers for their valuable opinions and suggestions that made this manuscript better and more informative. We also thank the students of the Center for Immunology and Cellular Biotechnology who helped in maintaining the working conditions in the laboratories and in sample management.
The work was supported by the State Assignment Grant number FZWM-2024-0012.
The authors declare no conflict of interest.
References
Publisher’s Note: IMR Press stays neutral with regard to jurisdictional claims in published maps and institutional affiliations.