


 , Chao Zhang 1,*, Chong Zhang 1,*
1 Department of General Surgery, The First Affiliated Hospital of Anhui Medical University, 230022 Hefei, Anhui, China
2 Department of General Surgery, Anqing Municipal Hospital, 246000 Anqing, Anhui, China
3 Clinical Pathology Center, The First Affiliated Hospital of Anhui Medical University, 230022 Hefei, Anhui, China
4 Clinical Pathology Center, Anhui Public Health Clinical Center, 230011 Hefei, Anhui, China
5 School of Basic Medical Sciences, Anhui Medical University, 230032 Hefei, Anhui, China
†These authors contributed equally.
Abstract
Aneuploidy is crucial yet under-explored in cancer pathogenesis. Specifically, the involvement of brain expressed X-linked gene 4 (BEX4) in microtubule formation has been identified as a potential aneuploidy mechanism. Nevertheless, BEX4’s comprehensive impact on aneuploidy incidence across different cancer types remains unexplored.
Patients from The Cancer Genome Atlas (TCGA) were stratified into high-score (training) and low-score (control) groups based on the aneuploidy score. Mfuzz expression pattern clustering and functional enrichment were applied to genes with BEX4 as the core to explore their regulatory mechanisms. Various machine learning techniques were employed to screen aneuploidy-associated genes, after which aneuploidy characteristic subtypes were established in cancers. Moreover, the aneuploidy characteristics across multiple cancer types were investigated by integrating the extent of tumor cell stemness acquisition and a series of immune traits. Immunohistochemistry and proliferation assay mainly verified the anti-tumor effect of different BEX4 level.
Functional clustering results showed that aneuploidy and stemness were significantly associated in kidney chromophobe (KICH) and thyroid carcinoma (THCA). And cell metabolism and cell cycle had key effects. Residual analysis indicates superior screening performance by random forest (RF). An aneuploid feature gene set with BEX4 as the core was screened to construct a Nomogram model. BEX4, calmodulin regulated spectrin associated protein 2 (CAMSAP2), and myristoylated alanine rich protein kinase C substrate (MARCKS) were identified as aneuploidy characteristic hub genes. Molecular subtypes in thymoma (THYM), thyroid carcinoma (THCA), and kidney chromophobe (KICH) showed significant differences in tumor cell stemness among different subtypes. The competitive endogenous RNA (ceRNA)-Genes network revealed that hub genes, co-regulated by hsa-miR-425-5p, hsa-miR-200c-3p, and others, regulate microtubules, centrosomes, and microtubule cytoskeleton. Furthermore, elevated BEX4 emerged as a significant protective factor in Pancreatic adenocarcinoma (PAAD), KICH, kidney renal papillary cell carcinoma (KIRP), and kidney renal clear cell carcinoma (KIRC).
BEX4, CAMSAP2, and MARCKS specifically express in microtubules, centrioles, and cytoskeletons, influencing tumor chromosome division and inducing aneuploidy. Additionally, the relationship between the acquisition of tumor cell stemness and the severity of aneuploidy varies significantly across tumor types, displaying positive and negative correlations.
Keywords
- aneuploidy
- BEX4
- machine learning
- pan-cancer
- biomarkers
Cancer is a highly challenging worldwide disease, distinguished by genomic instability that involves various chromosomal abnormalities such as deletion, amplification, gene mutation, DNA hypermethylation, and other significant disorders [1, 2]. Brain Expressed X-linked (BEX) genes, situated on the X chromosome in mammals, perform crucial functions in regulating the cell cycle, promoting cancer development, and facilitating tumor growth, displaying remarkable conservation across a wide range of species [3, 4, 5]. Empirical evidence strongly supports their participation in signaling pathways such as apoptosis, carcinogenesis, gene regulation, and cell division. While BEX4’s role as an oncogene is confirmed in ovarian cancer (OV), oral squamous cell carcinoma (OSCC), stomach adenocarcinoma (STAD), and glioblastoma (GBM) [4, 6, 7, 8] systematic research on its varied roles in different tumor types, especially in aneuploidy and potential co-expression with other genes, remains lacking.
BEX4 was markedly upregulated in aneuploid cells [5], referring to
cells with errors in chromosome separation, deviating from the expected number of
chromosomes [9]. Aneuploidy, being influenced by the environment and specific to
certain types of cancer, holds clinical significance as both a prognostic
indicator and a potential target for therapeutic intervention [10]. In the
context of human lung tissues, the upregulation of BEX4 results in the excessive
acetylation of
In recent years, a growing body of evidence has implicated aneuploidy in the acquisition of stem cell-like properties by cancer cells, a phenomenon known as tumor stemness. This correlation underscores the complex interplay between genetic aberrations and cellular plasticity in cancer progression. Aneuploid cells, characterized by gains or losses of whole chromosomes, exhibit increased genetic diversity that can fuel tumor heterogeneity [9]. This genetic variability not only contributes to intra-tumoral diversity but also plays a crucial role in the emergence of subpopulations of cells with stem cell-like properties. In liver cancer, Tschaharganeh et al. [16] highlighted the role of p53-dependent mechanisms in regulating nestin, a marker of cellular plasticity, in response to aneuploidy. This study underscored how specific molecular pathways can modulate stemness traits in the context of chromosomal instability [16]. Similarly, Duijf and Benezra [17] discussed how whole-chromosome instability, a form of aneuploidy, contributes to the adaptability of cancer cells and their ability to acquire stem cell-like properties through complex signaling networks [17]. Moreover, meta-analytical studies across multiple cancer datasets have identified BEX4 as a potential regulator of pathways associated with both aneuploidy and tumor stemness, providing further evidence for the intertwined nature of these processes in cancer biology [18].
Our analysis aims to explore the effects of genomes (especially BEX4) on cancer biology, focusing on aneuploidy effects and the therapeutic potential of BEX4. Through computational analysis and experimental verification, we identified differential BEX4 expression and screened aneuploid characteristic genes (ACGs) through bioinformatics and machine learning. This study reveals the importance of ACGs in cancers, with BEX4 as the focus, laying the foundation for understanding the association between aneuploidy and tumor stemness and promoting personalized cancer treatment. It deepens the understanding of the role of BEX4 in aneuploidy and cancer progression, emphasizes the complexity of ACGs in tumor development, and provides insights for future research and progress (Fig. 1).
 Fig. 1.
Flow chart of or research. We refined the key steps and showed the relationship between the various links. BEX4, Brain Expressed X-Linked 4; ceRNA, competitive endogenous RNA.
mRNA expression profiles and relatted clinical data for pan-cancer were sourced from UCSC XENA (https://xenabrowser.net/). The ‘limma’ (version 3.58.1), ‘plyr’ (version 1.8.9), ‘reshape2’ (version 1.4.4) and ‘ggpubr’ (version 0.6.0) R packages were used to analyze and visualize expression difference between normal and tumor samples for each cancer type. Unpaired Wilcoxon Tests identified significant differences. Sngerbox (http://vip.sangerbox.com/home.html) was employed to validate these differences using an augmented sample size, including normal tissue samples from GTEx (https://www.gtexportal.org/).
RNAseq data (level 3) for BEX4 across various cancers were obtained from The
Cancer Genome Atlas (TCGA) database (https://portal.gdc.cancer.gov/).
Rank sum tests were performed, with p
The TCGA dataset excluded samples with a survival time of less than 30 days. Cox regression analysis was conducted on clinical data and BEX4 RNAseq data, with forest plots generated using the forestplot (version 1.1.2) R package to display p values, Hazard Ratio (HR) and 95% Confidence Intervals (CI). For tumor types with significant results, Kaplan-Meie (KM) survival curves were stratified by expression levels using the KM plotter database (https://kmplot.com/analysis/). Differential expression data across cancer stages were provided by the TNM database (https://tnmplot.com/analysis/).
Immune correlation was assessed using the immunedeconv (version 2.0.3) R
package, which integrates six algorithms: TIMER, xCell, MCP-counter, CIBERSORT,
EPIC, and QUANTIseq. Rank sum tests identified significant differences, with
p
The clusterProfiler (version 4.10.1) R package was used to assess gene sets associated with BEX4 expression. Global Student Entrepreneur Awards (GSEA) gene set files (c2.cp.kegg.v7.4.symbols.gmt) were obtained from the official GSEA website(https://www.gsea-msigdb.org/gsea/index.jsp).
The tumor ploidyscore of each tumor were obtained from the previous study [19]. Pearson correlation analysis between BEX4 expression and ploidy score was performed to identify significant correlations. The GEPIA (https://genomics.senescence.info/cells/) and HUMANBASE (https://hb.flatironinstitute.org/) databases provided a list of 178 BEX4-related genes. Aneuploidy scores were collected from the cBioPortal database (https://www.cbioportal.org/). Machine learning models (random-forest (RF), support vector machine (SVM)) were applied to analyze gene matrices and identify aneuploid characteristic genes (ACGs), with model fitting assessed via residual analysis and receiver operating characteristic (ROC) curve visualization using the Caret (version 6.0), ggplot2 (version 3.5.1), randomForest (version 3.3.1), kernlab (version 0.9), and pROC (version 1.18.5) R packages.
As a classical ensemble algorithm, Random-Forest (RF) has superior regression and classification capabilities by constructing multiple decision trees and forming forests. And We averaged all aneuploidyscore of samples from different cancers and grouped them into high and low groups. We inputted a matrix containing 178 gene expressions in 9 cancers. The samples with low aneuploidyscore were set as the control group, and the samples with high aneuploidyscore were set as the training group. With support from ConsensusPathDB (http://cpdb.molgen.mpg.de/), we were able to perform enrichment analysis of aneuploidy characteristic Hub-genes (AHGs) at the gene functional level and study the cell components that are mainly affected by its expression.
We extracted 30 ACGs in differential tumors and plotted Nomogram. At the same time, as an important part of the prediction model, we used the Hosmer-Lemeshow test to test the gap between the actual value and the predicted value and made the continuous calibration curve. The decision curve analysis (DCA) and clinical impact curve (CIC) were used to further evaluate the clinical predictive effect of the model. In this process, we use the R package: ‘rms’ (version 1.1), ‘rmda’ (version 1.6).
Using 30 ACGs as input variables for kidney chromophobe (KICH), thyroid carcinoma (THCA), and thymoma (THYM), consistency analysis was performed using the ConsensusClusterPlus R package(version 1.66.0), with cluster numbers set to 2 and 100 iterations extracting 80% of the sample. Visualization was done via pheatmap (version 1.0.12) and ggplot2.
The Mfuzz package clustered Mfuzz expression patterns for KICH, THCA, and THYM samples from the TCGA database. ssGSEA scores for different clustering modules and tumor patients were calculated, identifying the gene module most correlated with BEX4.
We obtained four important gene sets from Miranda et al.’s study [21] that can represent the evaluation of tumor stemness and calculated the corresponding ssGSEA-stemness-scores for all samples based on the expression matrix, including: Cell cycle score, Cell Transcription Score, Metabolism Synthesis Score and Signal recognition and transduction score. Next, we collected aneuploidy scores from the CI database, and comprehensively constructed a sample matrix containing 55 scores (including 50 cluster pattern expression scores, 4 stemness scores and aneuploidy scores) for all samples in pan-cancer. And Pearson correlation analysis was performed between the two.
The ENCORI database (https://rnasysu.com/encori/index.php) was utilized to identify 4 AHGs as target genes in pan-cancer. We hypothesize that the relevant microRNA (miRNA) can be identified through the inclusion of multiple databases.
According to the ENCORI database, we screened miRNAs with high overlap of
meaningful cancer species (
When collecting downstream genes, the filter condition was associated with miRNA and long non-coding RNA (lncRNA) in 9 or more cancer species at the same time.
The ceRNA-gene co-expression network was constructed by Cytoscape software (version 3.10.2).
ceRNA expression data for KICH, THCA, and THYM were collected for differential
expression and survival analysis. RNA
sequencing (RNAseq) data (level 3) and clinical information for nine tumors were
sourced from the TCGA database, with survival analysis performed using log-rank
tests. A p value
Using 30 ACGs as input variables, we loaded the R package ‘ConsensusClusterPlus’ (version 1.66.0) for consistency analysis, set the number of clusters to 2, repeat 100 times to extract 80% of the total sample in KICH, THCA and THYM. The clustering heat map is visualized by ‘pheatmap’. Gene expression heat map retained genes with variance above 0.1. The box line diagram is drawn by ‘ggplot2’. Then, we used non-parametric tests between different types to understand the differential expression of AHGs.
The aneuploidy scores of all collected TCGA samples were analyzed in the form of non-parametric tests between the two subtypes of different cancers to verify whether the sample typing using ACGs can distinguish the high aneuploidy score group and the low aneuploidy score group at the gene expression level. At the same time, the Principal Component Analysis (PCA) score was constructed as aneu-score in KICH, THCA and THYM using the characteristic genes screened by RF, and its correlation with the vest was analyzed.
Expression values of eight immune checkpoint-related genes (SIGLEC15, TIGIT, CD274, HAVCR2, PDCD1, CTLA4, LAG3, PDCD1LG2) were extracted and visualized using ggplot2 and pheatmap. The TIDE algorithm predicted Immune Checkpoint Blockade (ICB) responses, with immune scores calculated using MCP-counter, CIBERSORT, TIMER, and quanTIseq.
Several studies have demonstrated that the occurrence of polyploidy is a significant contributing factor to the development of Cell Stemness Score (CSCs), alongside the transformation of tissue stem cell [22, 23]. To determine the mRNAsi of the samples, the logistic regression machine learning algorithm (OCLR) [24, 25] was employed, which utilize the pan-cancer expression and clinical information files available on TCGA. When we obtained the mRNAsi scores of all samples, a difference analysis was performed between different subtypes to understand the association between the degree of aneuploidy acquisition and the degree of stemness acquisition. We employed Spearman correlation analysis mapping the dryness index onto the (0–1) interval.
HPA (https://www.proteinatlas.org/) is a human proteome atlas database that contains information on the distribution of proteins in human tissues and cells. With the help of HPA database, we collected immunohistochemical images of 16 tumor tissues. Meanwhile, HPA database also showed that it had significant prognostic efficacy only in pancreatic cancer and renal cancer (p
Western blotting was conducted as previously described [26]. cells were lysed in radio immunoprecipitation assay lysis (RIPA) buffer (P0013), and protein concentrations were measured using the bicinchoninic acid (BCA) assay. Proteins were separated via 10% or 15% sodium dodecyl sulfate–polyacrylamide gel electrophoresis (SDS-PAGE) and transferred to nitrocellulose membranes (Mil-lipore, Burlington, MA, USA). Following an overnight incubation with the primary antibody (BEX4, Bioss, bs-7978R, dilute 1:100) at 4 °C, the membranes were exposed to an HRP-conjugated secondary antibody (BEX4, Bioss, Cat No. SA00001-2). Protein complexes were visualized using enhanced chemiluminescence reagents (Millipore, USA).
Human renal cell carcinoma cell line A498 and pancreatic cancer cell line PANC-1 were purchased from Biyuntian Biotechnology Company (Shanghai, China). A498 or PANC-1 cells (2.5
Cells (2
Statistical analyses were performed using R (version 4.3.1)
(https://www.r-project.org/) and SPSS 27 (IBM Corp., Chicago, IL, USA). All
relative risks were presented with a 95% confidence interval (p
The findings of this study revealed that the expression of BEX4 was found to be down-regulated in 18 different cancer types. Furthermore, a notable increase in BEX4 expression was observed in two distinct tumor types, namely pheochromocytoma and paraganglioma (PCPG) and cholangiocarcinoma (CHOL), as depicted in Fig. 2A. Interestingly, upon amplification using normal samples obtained from GTEx, a significant decrease in BEX4 expression was observed in 23 tumor types, as shown in Fig. 2B. These findings suggest that BEX4 displays considerable variations across various cancer types, except for lower grade glioma (LGG) , thereby highlighting its importance in pan-cancer investigations. However, it is important to acknowledge that the results for PAAD and THCA exhibited inconsistencies before and after sample expansion. Upon further analysis, we found that the expression of BEX4 was highest in PCPG and lowest in LIHC (Fig. 2C).
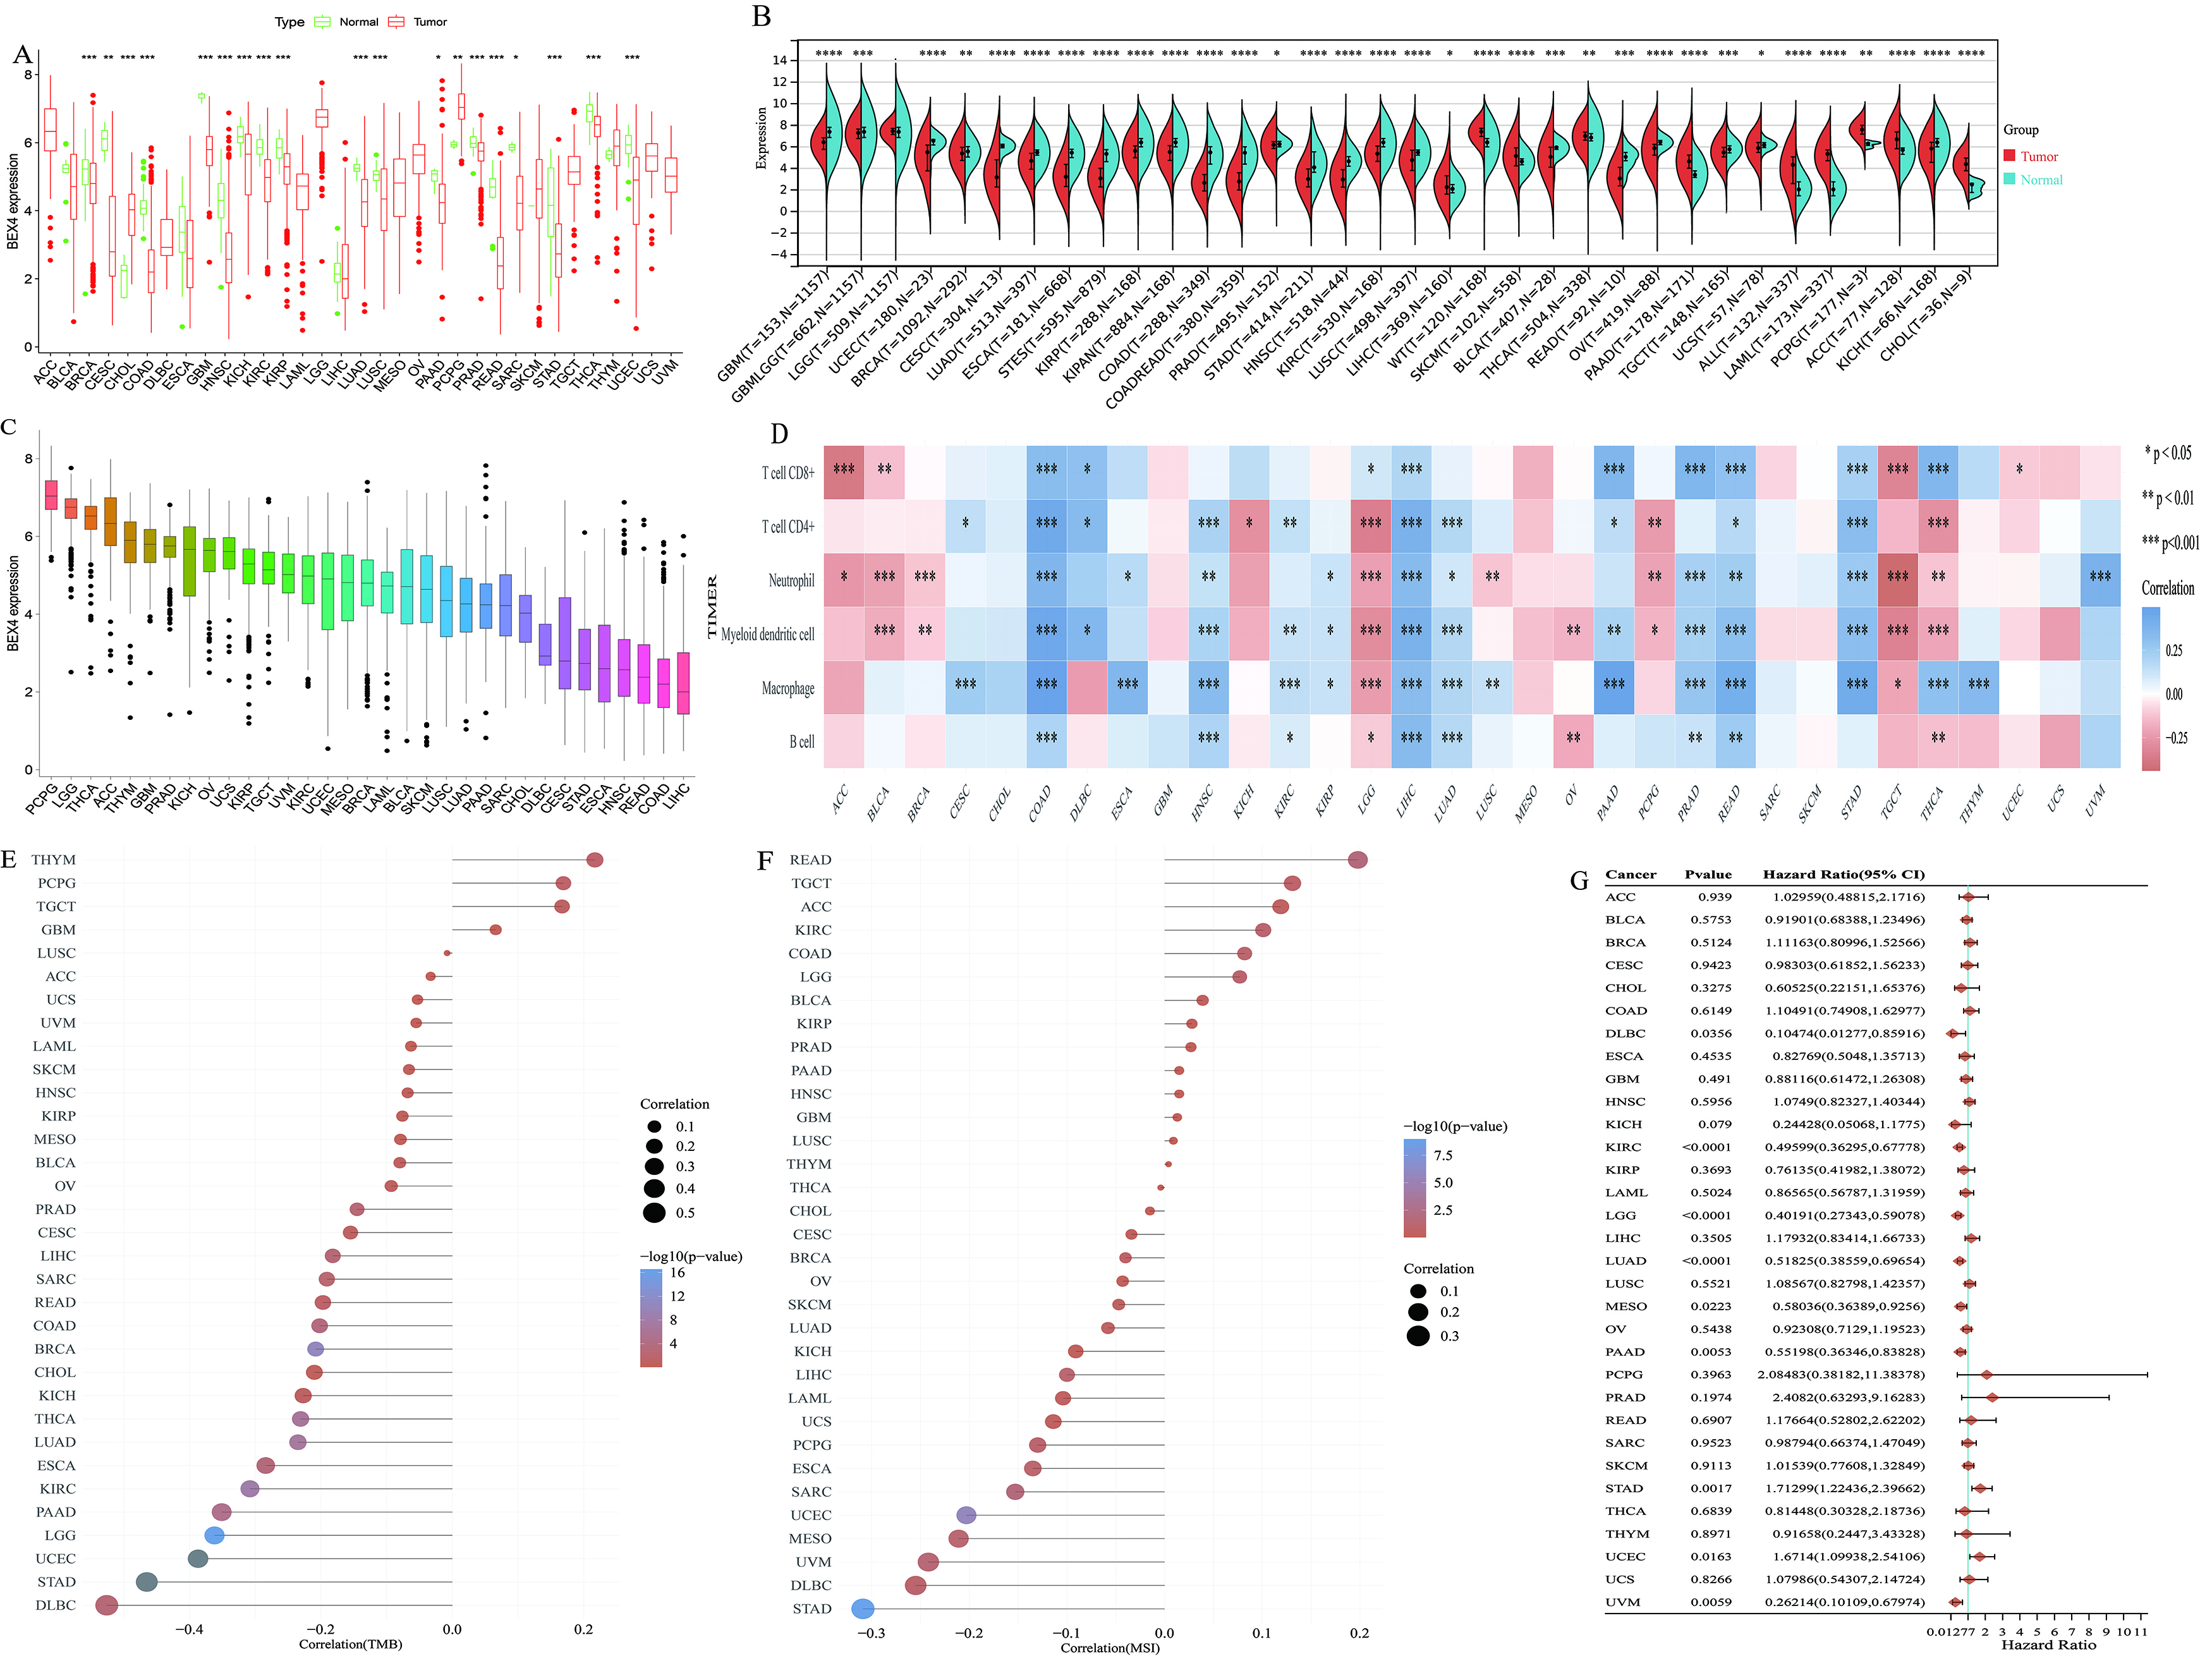 Fig. 2.
Pancancer analysis of genomics and prognostic value of BEX4. (A) The visualization of differential expression of BEX4 was conducted on
pan-cancer data obtained from The Cancer Genome Atlas (TCGA) database. A
significant down-regulation of BEX4 was observed in most cancer types. The green
group represented the normal sample group, while the red group represented the
cancer sample group. (B) After expanding the sample set with normal samples from
GTEx, BEX4 expression showed a significant decrease in 23 cancer types,
suggesting its variable expression pattern in pan-cancer studies. The expression
of BEX4 in LGG remained consistent, while PAAD and THCA exhibited inconsistencies
before and after sample expansion. (C) The box plot shows the expression of BEX4
in different tumor tissues and the order from high to low. (D) According to the
TIMER algorithm, the correlation between BEX4 expression and different immune
cell infiltration scores in pan-cancer was shown. (E,F) The relationship between
BEX4 expression and genomic instability markers, such as tumor mutation burden
(TMB) and microsatellite instability (MSI), indicated a predominantly negative
correlation in DLBC and STAD, highlighting the potential role of BEX4 in
maintaining genomic stability within these tumor types. (G) The forest plots
indicated the outcomes of single-factor cox analysis for BEX4 across various
cancer types, which included p-values, risk coefficient HR, and
confidence intervals. LGG, Lower Grade Glioma; PAAD, Pancreatic adenocarcinoma; THCA, Thyroid Carcinoma; DLBC, Diffuse Large B-cell Lymphoma; STAD, stomach adenocarcinoma; HR, Hazard Ratio. *p
The presence of genomic instability in tumor tissues is characterized by tumor mutation burden (TMB) and microsatellite instability (MSI) [27]. In the cases of Diffuse Large B-cell Lymphoma (DLBC) and STAD, the expression of BEX4 exhibited a strong negative correlation with the occurrence of TMB and MSI, with the negative correlation being predominant (Fig. 2E,F).
Analysis of survival data across various cancer types revealed that high expression of STAD was associated with a poor prognosis. Additionally, low expression of BEX4 was also found to be linked to a poor prognosis in 8 tumor types (Fig. 2G). Moreover, the clinical prognostic and efficacy value of BEX4 was validated in 5 different cancer species through the KM Plotter, including: kidney renal papillary cell carcinoma (KIRP) (Supplementary Fig. 1A), lung adenocarcinoma (LUAD) (Supplementary Fig. 1B), PAAD (Supplementary Fig. 1C), STAD (Supplementary Fig. 1D) and uterine corpus endometrial carcinoma (UCEC) (Supplementary Fig. 1E). And the data from TNM Plot represented that the high expression of BEX4 was protective factor in kidney renal clear cell carcinoma (KIRC) (Supplementary Fig. 1F–H) and PAAD (Supplementary Fig. 1I–K).
Combined with four immune scoring algorithms, our analysis revealed a strong correlation between BEX4 expression and immune cell infiltration in COAD, rectum adenocarcinoma (READ), STAD, LIHC and THCA, mainly positive correlation. It is worth noting that in a variety of tumor types, T cell CD4+ memory activity and T cell CD4+ TH1 infiltration score were positively correlated with BEX4 expression (Fig. 2D and Supplementary Fig. 1L–P). Especially in COAD, READ, LIHC, there was a significant positive correlation between immune cells and BEX4 expression, include: T cells CD4+, CD8+; Neutrophil, B cell. A variety of algorithms also show that macrophages have a significant correlation with BEX4 expression in multiple cancers (Supplementary Fig. 1L–P).
The longitudinal gene set enrichment analysis (GSEA) yielded significant findings regarding the pathways implicated in multiple cancers (Supplementary Fig. 2), including CELL _ ADHESION _ MOLECULES _ CAMS [26, 28, 29], CYTOSOLIC _ DNA _ SENSING _ PATHWAYCY [30], TOLL _ LIKE _ RECEPTOR _ SIGNALING _ PATHWAY [31, 32], NEUROACTIVE _ LIGAND _ RECEPTOR _ INTERACTION [31, 32, 33], RIG _ I _ LIKE _ RECEPTOR _ SIGNALING _ PATHWAY [34], CHEMOKINE _ SIGNALING _ PATHWAY [35]. Additionally, OLFACTORY _ TRANSDUCTION exhibited the most representative pan-cancer value due to its expression trend closely resembling that of BEX4 across 16 cancer species. Furthermore, a horizontal analysis of all pathways revealed the pan-cancer significance of various immune system-related pathways, such as Toll-like receptor signaling pathway, RIG-I-like receptor signaling pathway, Chemokine signaling pathway, cytosolic DNA-sensing pathway. Additionally, within the domain of environmental information processing, pathway enrichment with pan-cancer significance primarily pertained to signaling molecules, interactions, including neuroactive ligand-receptor interaction, cytokine-cytokine receptor interaction, cell adhesion molecules in signaling molecules and interaction and signals-transduction including calcium signaling pathway.
After conducting correlation analysis with BEX4, a total of 178 genes were identified as being related. Among these genes, there were 9 significant tumors, namely THYM, KICH, OV, TGCT, PAAD, THCA, SARC, LIHC, and UCEC. These tumors were selected based on their strong correlation between ploidyscore and the expression of BEX4, as indicated in Supplementary Table 2. Further analysis using residual tests demonstrated that RF efficacy was more significant in all cancer types except UCEC, which was confirmed by the ROC curve (Fig. 3A–I and Supplementary Fig. 3A–I). Subsequently, RF or SVM was utilized to identify the respective aneuploid characteristic genes in the 9 cancer species (Supplementary Fig. 4J–O). Subsequently, we identified the recurrent presence of three genes, namely BEX4, CAMSAP2, and MARCKS, as AHGs through the intersection of aneuploidy characteristic genes across different tumors. To further investigate their significance, we selected KICH, THCA, and THYM for subsequent studies (Fig. 3J–L, respectively), considering multiple factors. Additionally, we developed nomogram prediction score utilizing the aneuploidy characteristic genes (Supplementary Fig. 4P–R). The effectiveness of the model was further confirmed through decision curve analysis (DCA) and clinical impact curve (CIC) in KICH (Fig. 3M), THCA (Fig. 3N) and THYM (Fig. 3O).
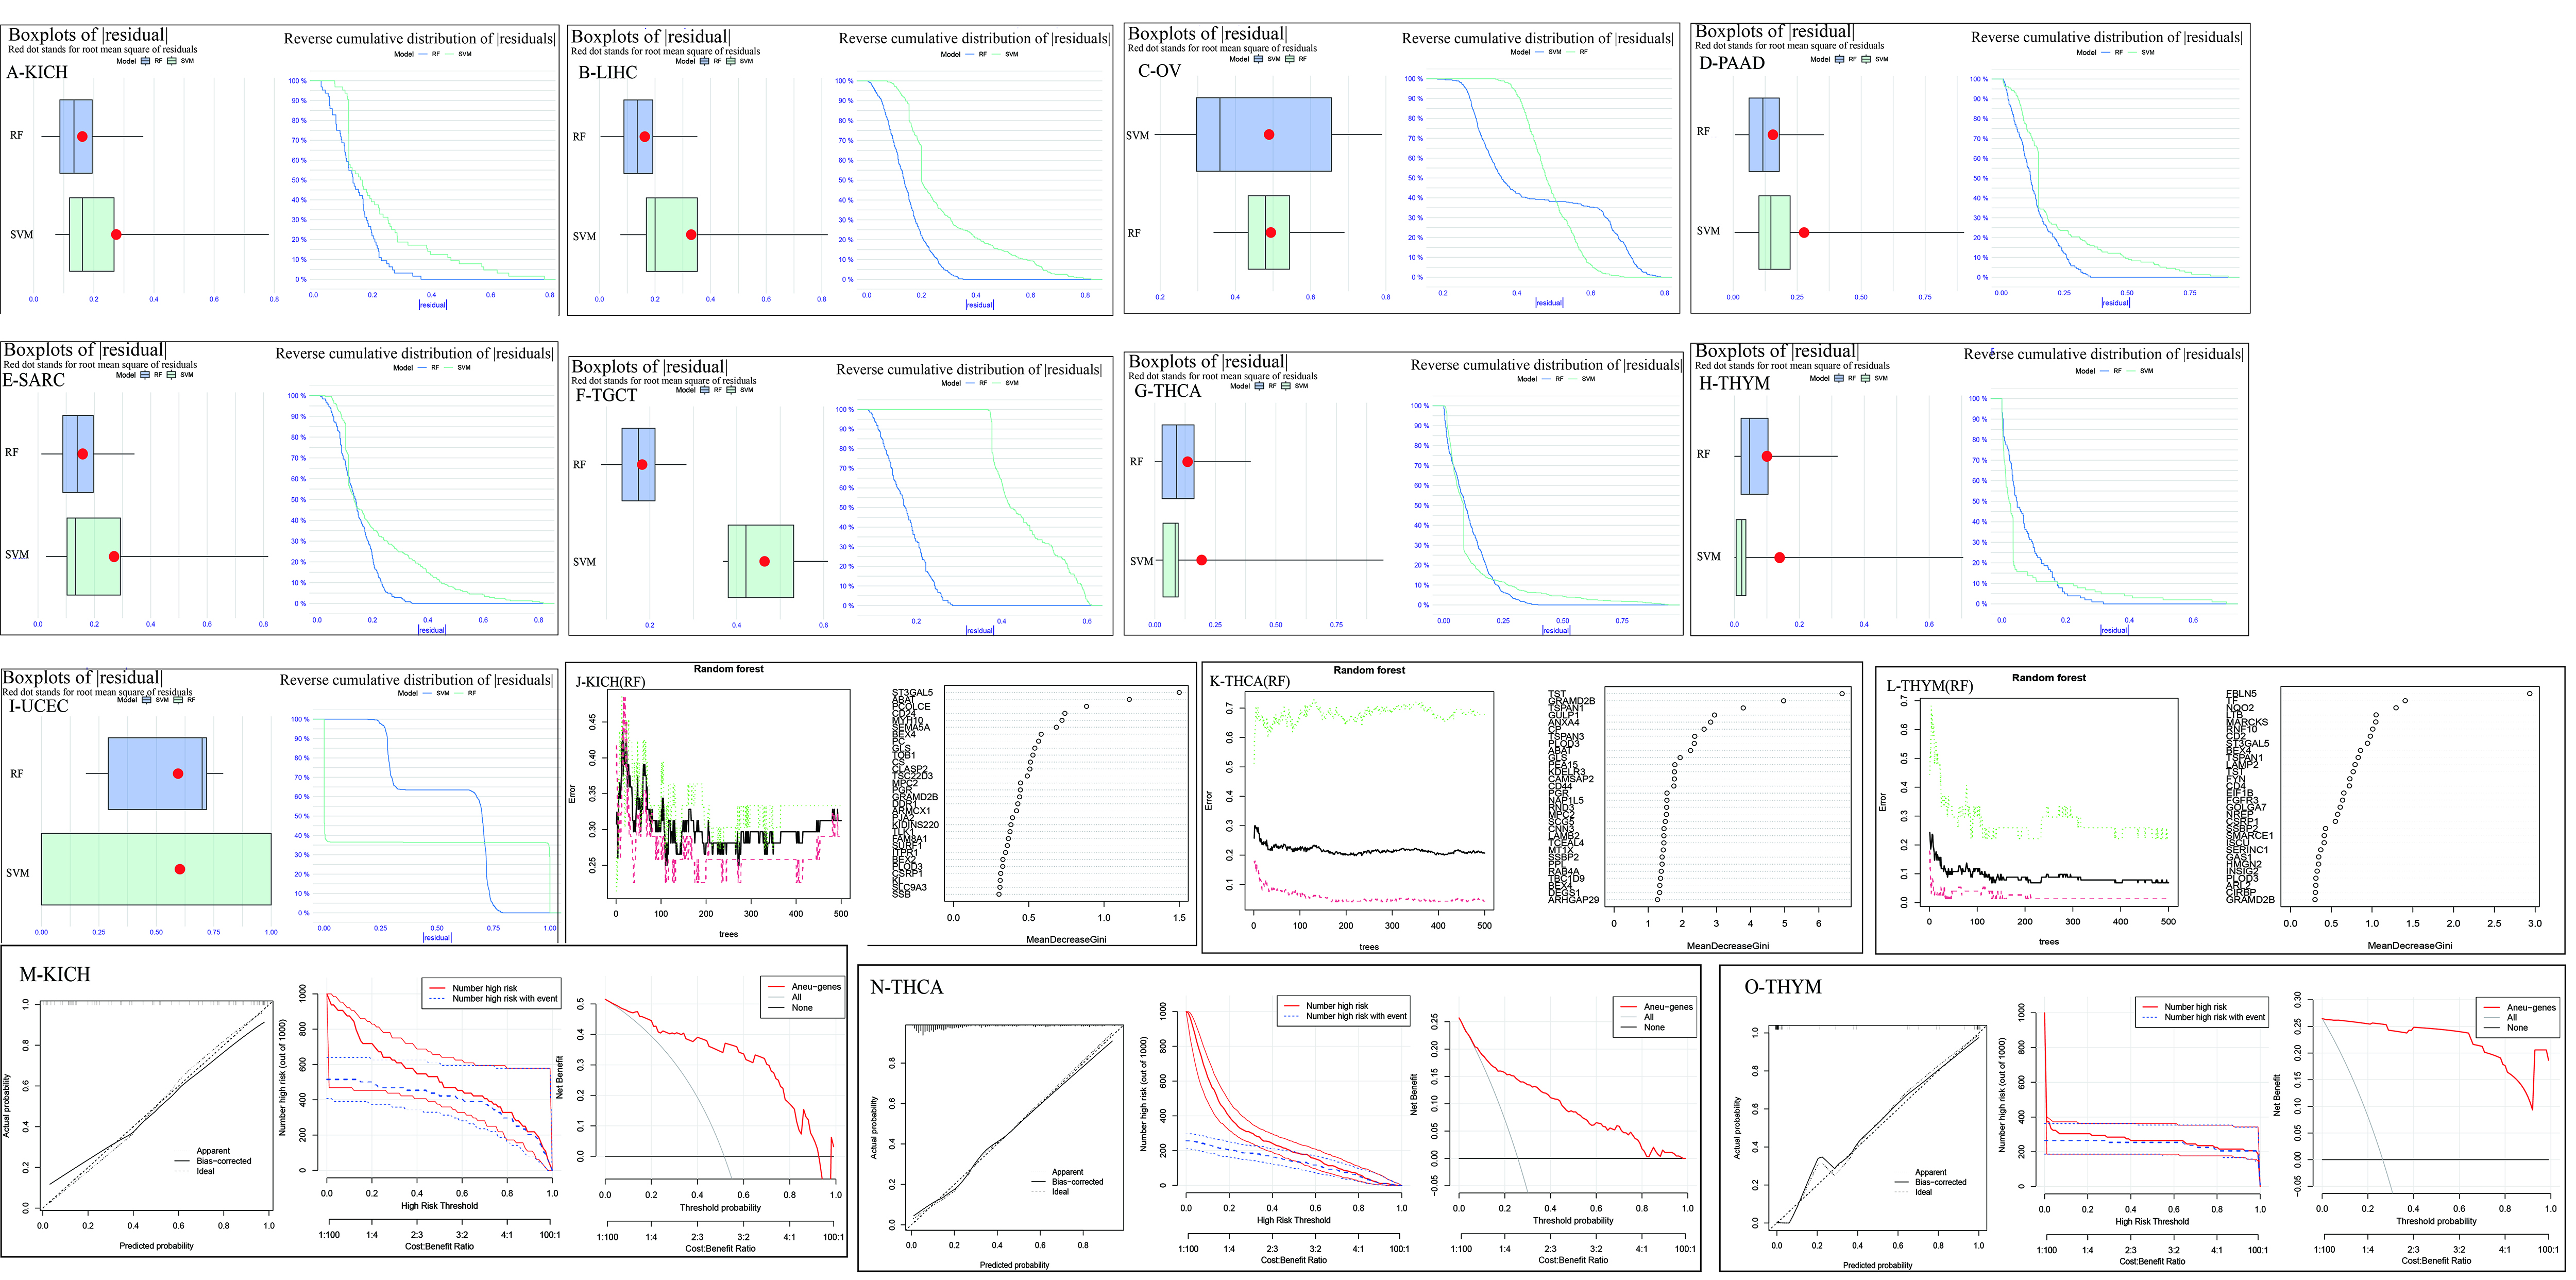 Fig. 3.
The efficiency test and application of machine learning. (A–I) The curves shows the performance test of random forest and support vector machine using residual analysis in 9 cancer species. (J–L) The recurrent presence of three genes, BEX4, CAMSAP2, and MARCKS, identified as Aneuploidy-Related Characteristic Genes (AHGs) through random forest (RF) or support vector machine (SVM) analysis, is illustrated in KICH, THCA, and THYM. These tumors were selected for further studies due to their strong correlation with BEX4 expression and aneuploidy characteristics. (M–O) DCA (decision curve analysis) and CIC (clinical impact curve) were used to further test the effect of feature gene screening in three kinds of tumors. KICH, kidney chromophobe cell carcinoma; THCA, thyroid carcinoma; THYM, thymoma.
The enrichment results, as facilitated by ConsensusPathDB, encompassed various cellular components and molecular functions related to the microtubule cytoskeleton, including cytoskeletal part, centrosome, cytoskeleton, microtubule organizing center, spindle pole, cytoskeletal protein binding, calmodulin binding, tubulin binding, spindle, microtubule, intracellular non-membrane-bounded organelle, supramolecular fiber organization, and polymeric cytoskeletal fiber (Supplementary Table 3). The gene function enrichment analysis revealed that three AHGs had an impact on the biological process of cytoskeleton protein binding and the cytoskeleton in cell components. Additionally, BEX4 and CAMSPA2 were found to influence the synthesis of polymer cytoskeleton fibers. Furthermore, the analysis of cell components indicated that the three AHGs could affect the microtubule cytoskeleton, with MARCKS and CAMSAP2 affecting both the microtubule organization center and centrosome. Moreover, BEX4 and CAMSAP2 were found to have a combined effect on microtubules. Lastly, BEX4 and CAMSPA2 were found to influence the molecular function of microtubule protein binding.
We found 4 miRNAs strongly correlated with BEX4, CAMSAP2, and MARCKS in the ENCORI database: hsa-miR-425-5p, hsa-miR-200c-3p, hsa-miR-200b-3p, and has-miR-425. From these miRNAs, we identified 6 related genes and 6 lncRNAs. Using these 3 genes, we found more miRNAs and created the LncRNA-miRNA-Gene Co-expression network (Fig. 4A,B). After identifying ACGs, we established the ceRNA and gene network, which demonstrated the mutual regulation of AHGs in tumor tissues (Fig. 4C). After excluding miRNAs with less than 30% expressed individuals, TCGA-based survival analysis identified significant risk factors in different cancers: hsa-miR-200b-3p in THYM, hsa-miR-200c-3p in LIHC and THYM, hsa-miR-425-5p in KICH (but protective in OV), and hsa-miR-429in THYM. Then, to explore the prognosis value of those miRNAs and lncRNAs, we employed survival analysis and KM curve to investigate the survival status of samples with different expression of miRNAs or lncRNAs respectively (Fig. 4D–I).
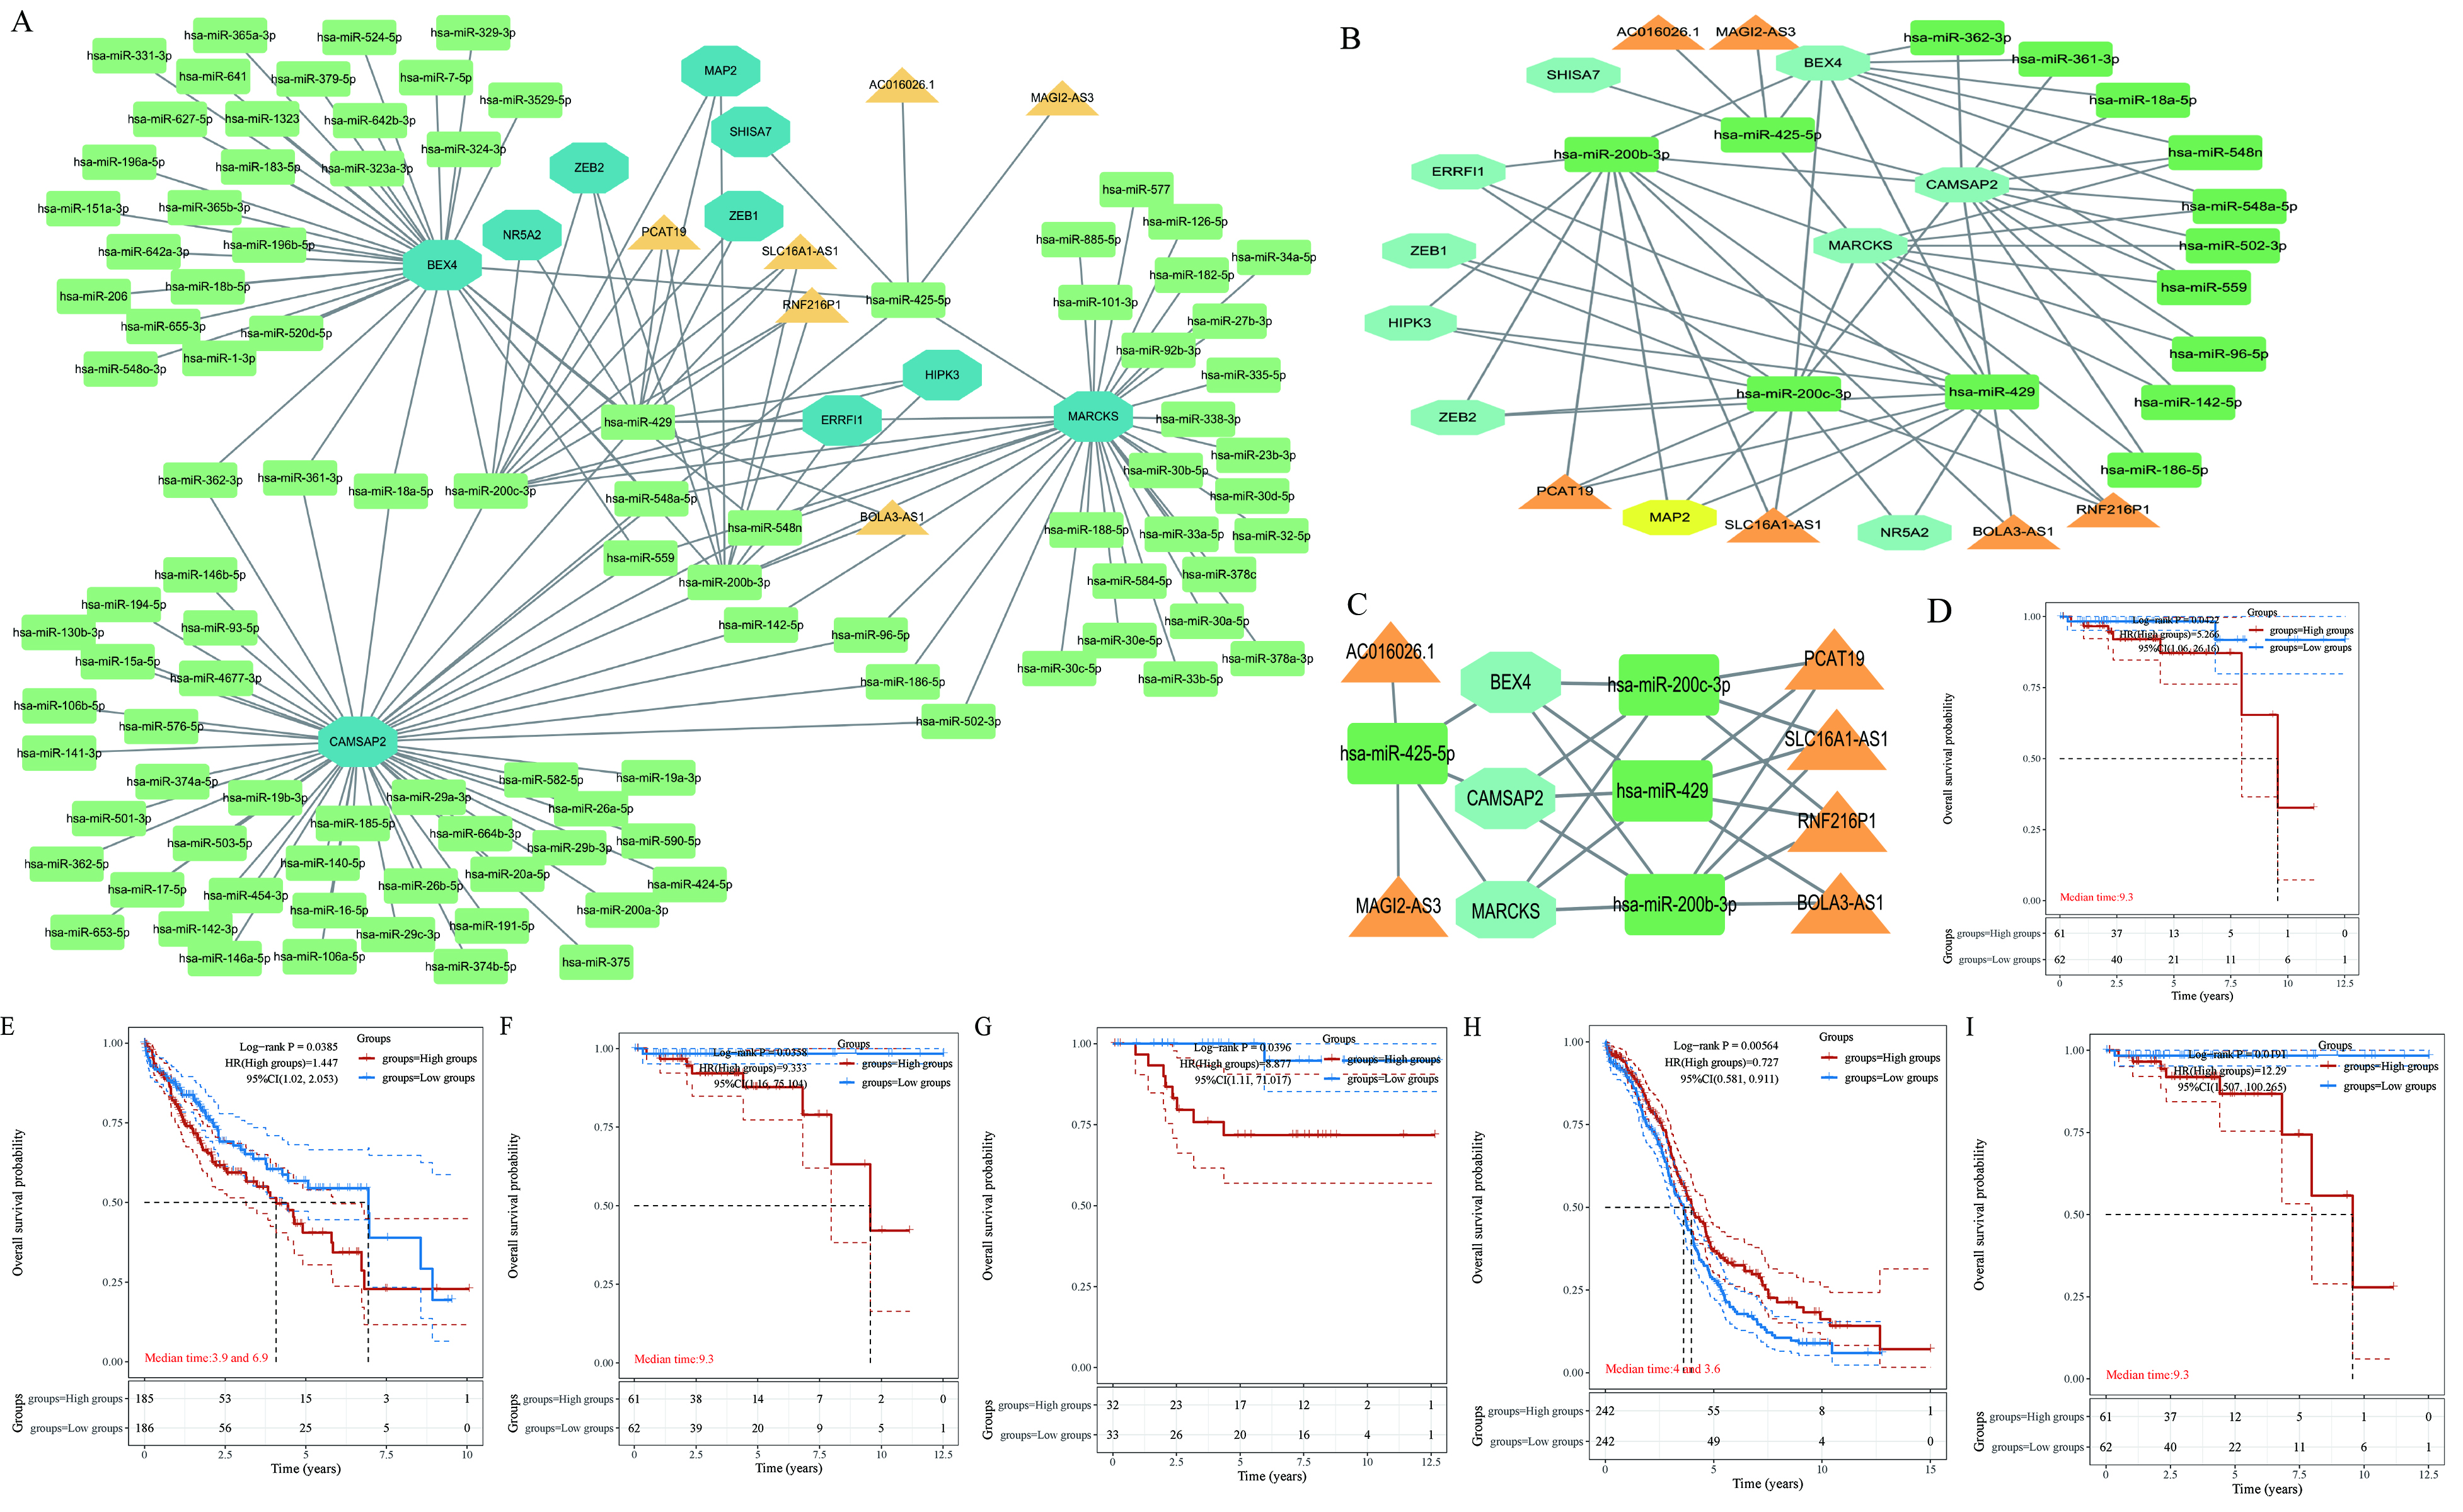 Fig. 4.
Construction of ceRNA-genes Co-expression network and prognostic significance of miRNA in KICH, THCA and THYM. (A) The comprehensive regulatory network suggested miRNAs that may regulate the expression of ACGs. The yellow triangle module represented lncRNA, the green rectangle module represented miRNA, and the green polygon module represents gene. The network demonstrates the intricate interactions and co-expression patterns among long non-coding RNAs (lncRNAs), microRNAs (miRNAs), and genes, highlighting their potential regulatory roles in cancer biology. (B) Through the extraction of the integrated network, we obtained a close and multi-layer accurate ceRNA-genes network (C) The ceRNA-genes network constructed by AHGs. (D–I) Survival analysis identified significant risk factors in various cancers, with miR-200b-3p in THYM, miR-200c-3p in LIHC and THYM, miR-425-5p in KICH and OV, and miR-429 in THYM, respectively. ACGs, aneuploid characteristic genes; AHGs, aneuploidy-related characteristic genes. LIHC, liver hepatocellular carcinoma; OV, ovarian serous cystadenocarcinoma.
ACGs identified two molecular subtypes in KICH, THCA, and THYM (Fig. 5A-1,2; B-1,2; C-1,2). The aneuploid score from the Cbioportal database and a difference test revealed significant differences in aneuploidy between the subtypes (Fig. 5A-3, B-3, C-3). Notably, in KICH and THCA, the subtype with a higher aneuploidy score had a lower tumor cell stemness. At the same time, the difference between the two subtypes of AHGs in the three cancer species was not consistent (Fig. 5A-6,B-6,C-6). The correlation analysis results showed a correlation coefficient greater than 0.3 (Fig. 5A-7,B-7) between the Aneu-score based on characteristic genes and aneuploidies. In THYM, the correlation coefficient reached 0.6 (Fig. 5C-7). Additionally, in pan-cancer, the immune checkpoint response indicated differential responses between the two subtypes in their respective tumors (Fig. 5A-8,B-8,C-8). In THYM, the TIDE SCORE difference indicated a significant difference in the effectiveness of immune checkpoint blockade therapy (ICB) between the two patient types, with C1 being superior to C2 (Fig. 5C-9). Additionally, CAMSAP2 expression was significantly higher in the immunotherapy response group compared to the non-response group (Supplementary Fig. 8G). The analysis of immune infiltration scores revealed that Macrophage and Neutrophil were the main differing immune cells (Fig. 5A-10,B-10,C-10, and Supplementary Fig. 8A–C).
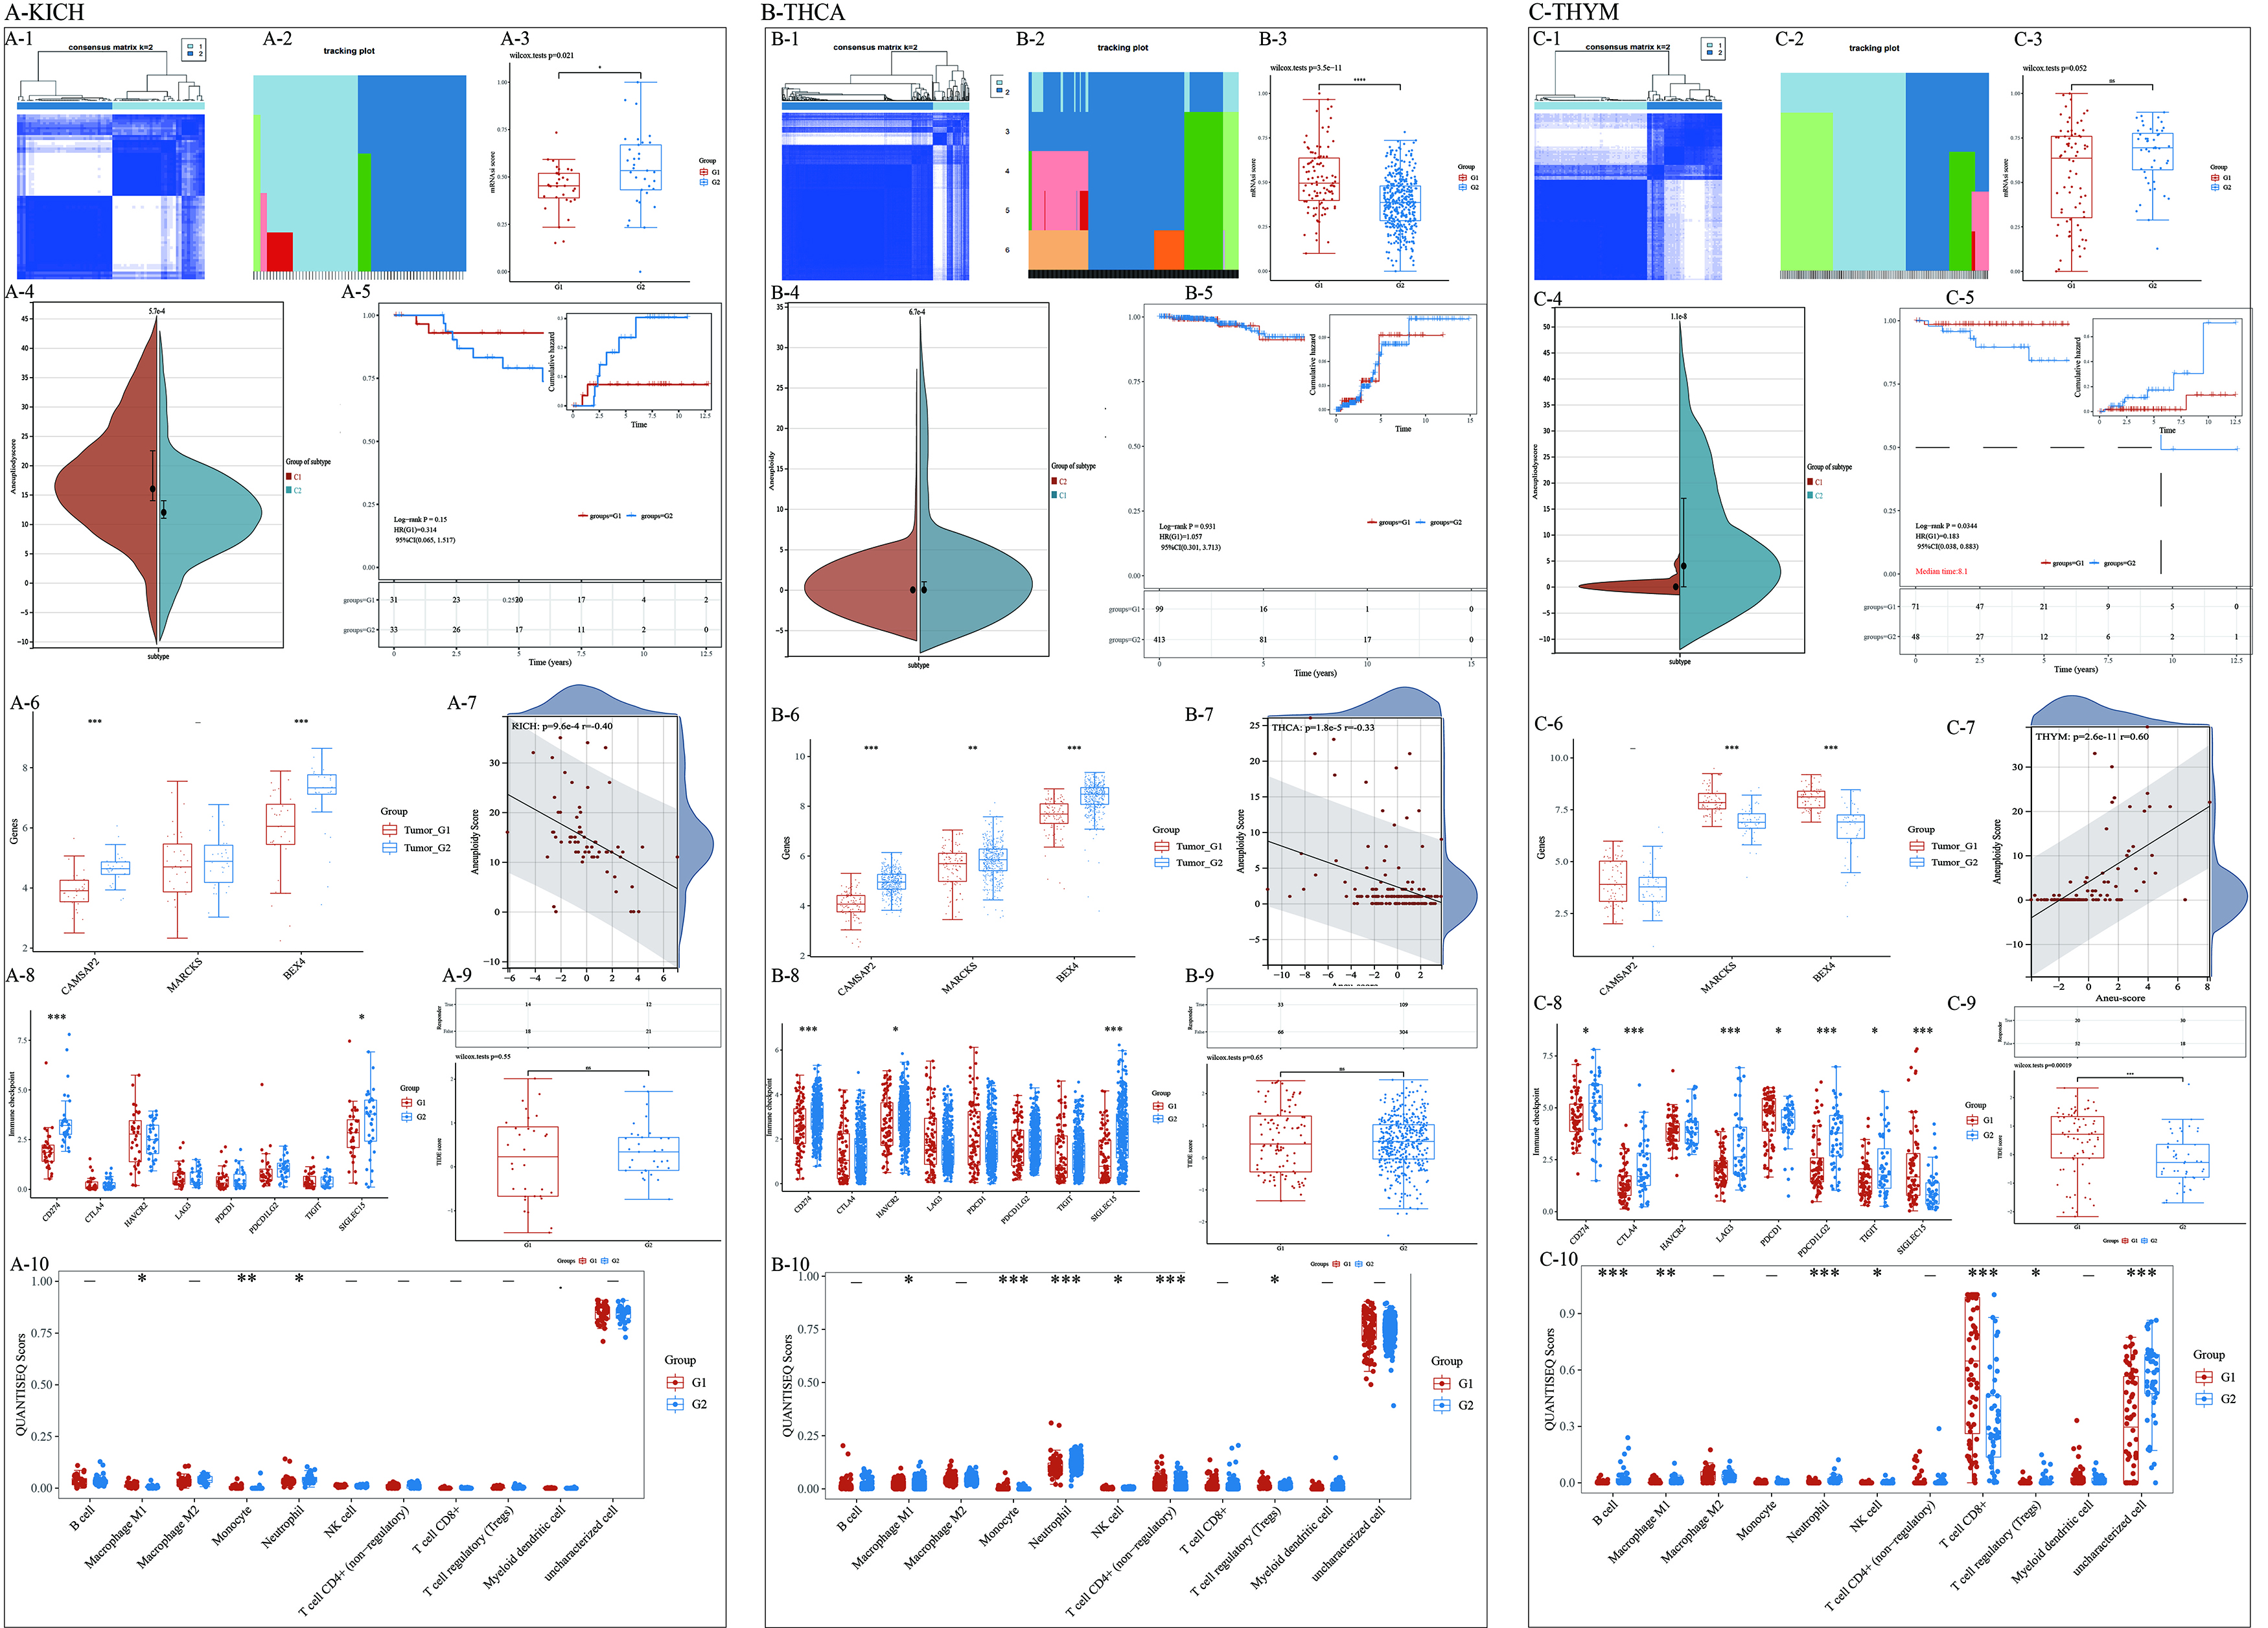 Fig. 5.
Identification of Molecular Subtypes and Analysis of Aneuploidy,
Tumor Cell Stemness, and Immune Response in KICH, THCA, and THYM. (A–C) The
three modules represented Two molecular subtypes were identified in KICH, THCA,
and THYM using Aneuploidy-Related Characteristic Genes (ACGs). (A-1,2; B-1,2;
C-1,2) All the heatmaps showed the results of cluster in KICH, THCA and THYM.
(A-3,B-3,C-3) MRNAsi scores were collected and analyzed between the two subtypes
of different tumors. (A-4,B-4,C-4) The difference violin plot showed the
difference in aneuploidy scores between different subtypes. (A-5,B-5,C-5) The Kaplan-Meie (KM)
curve compared and visualized the survival information of patients with different
subtypes in three cancer types. (A-6,B-6,C-6) Multiple sets of box plots in three
cancer species visualized the differential expression of AHGs between subtypes.
(A-7,B-7,C-7) Correlation analysis between the Aneu-score, based on
characteristic genes, and aneuploidies demonstrated a correlation coefficient
greater than 0.3 in KICH and THCA, while in THYM, the correlation coefficient
reached 0.6, indicating a strong association between aneuploidy and the
expression of ACGs. (A-8,B-8,C-8) The expression of immune checkpoint in
different subtypes was significantly different and there was a great difference
between different tumors. (A-9,B-9,C-9) checkpointblockadetherapy (ICB) treatment varied among different
tumor subtypes. The above pictures were the statistical data of immune response
of samples in different subtypes, and the following pictures were the box diagram
of the difference results of treatment response scores. (A-10,B-10,C-10) The
immune infiltration score analysis highlighted macrophages and neutrophils as the
main differing immune cells between the subtypes, suggesting their potential role
in the immune response and tumor microenvironment in these cancers.
*p
In our study, we performed clustering based on the expression level of BEX4 who Mfuzz expression pattern, and successfully obtained 50 clustering results in KICH (Supplementary Fig. 5A), THCA (Supplementary Fig. 6A), and THYM (Supplementary Fig. 7A), respectively (Supplementary Table 4A: Gene lists in different cluster pattern.xls). Combined with the ssGSEA score and expression characteristics of the clustering module, we found that in pan-cancer, the score obtained by clustering according to the BEX4 expression pattern (Supplementary Table 4B: Correlation between the expression of BEX4 and ssGSEA score.xls) can effectively distinguish the degree of aneuploidy in the tissue (Supplementary Fig. 5C,6C,7C). At the same time, there are many expression pattern clustering gene sets that are significantly correlated with the expression trend of BEX4 in each cancer species (Supplementary Fig. 5B,6B,7B).
In KICH, there was no significant correlation between aneuploidy score and stemness score. However, in the four scores related to stemness, Cell Transcription Score was significantly positively correlated with Cell cycle score and Metabolism Synthesis Score, and Cell cycle score was also significantly positively correlated with metabolism. The expression score of clusters 24, 43 clustered gene set was significantly positively correlated with the score of stemness thought and was significantly correlated with the expression of BEX4. Through the enrichment analysis of clusters 24, 43, we observed that the genes in the cluster were involved in tumor metabolism and infection-related pathways. Then, for aneuploidy score, clusters 17, 19 was positively correlated with GSEA score, and showed a significant correlation with BEX4 expression, and was enriched in many metabolic related pathways (Supplementary Fig. 5D,E).
In THCA, there is a correlation between aneuploidy score and signal recognition pathway. In the stemness score, Cell Transcription Score was significantly positively correlated with Cell cycle score and Metabolism Synthesis Score, and Cell cycle score was also significantly positively correlated with metabolism. And Signal recognition and transduction score also showed a significant correlation with the other three scores. The gene expression scores in clusters 1, 13, 23 showed a significant positive correlation with the four scores of stemness, and a strong correlation with BEX4 expression. The genes in clusters 2, 6, 8, 18, 21, 26, 32, 50 showed a significant negative correlation with stemness score and a strong correlation with BEX4 expression. Cluster 11 showed a strong correlation with aneuploidy score and BEX4 expression. Enrichment results showed that cluster 11 was mainly enriched in related biological processes such as metabolism and virus, such as: Arginine and proline metabolism; legionellosis; hepatitis and so on (Supplementary Table 4C: Samples with different scores in clsuters.xls). There was a strong positive correlation between clusters 50 and 26, 32. The genes in the three clusters were mainly enriched in metabolic-related pathways and biosynthesis (Supplementary Fig. 6D,E).
In THYM, we observed a strong positive correlation between cell cycle and cell transcription, and a negative correlation between cell cycle and metabolism (Supplementary Fig. 7D,E).
In the process of cancer progression, there is a gradual loss of differentiated phenotypes and a gain of progenitor/stem cell-like characteristics. Through the calculation of the mRNAsi score, it was observed that there were predominantly negative correlations in most tumors. Notably, the correlation coefficient reached –0.75 in ESCA, –0.57 in THYM, –0.21 in THCA, and –0.68 in STAD. These strong correlation coefficients indicate a close association between BEX4 and the stem cell score across multiple tumors (Supplementary Fig. 3A–Y). Furthermore, in KICH, THCA, and THYM, calmodulin regulated spectrin associated protein 2 (CAMSAP2), and myristoylated alanine rich protein kinase C substrate (MARCKS) exhibited a significant negative correlation with the acquisition of dryness (Supplementary Fig. 3Z–AD).
In KICH, only LncRNA (BOLA3-AS1) showed significant high expression in low aneuploid subtype (Supplementary Fig. 9E). However, in THCA, miRNAs (miR-429 and miR-200b-3p) (Supplementary Fig. 9K,L) and LncRNAs (BOLA3-AS1, PCAT19 and RNF216P1) (Supplementary Fig. 9M–O) showed high expression in high aneuploid subtypes. Finally, in THYM, LncRNAs (BOLA3-AS1 and RNF216P1) (Supplementary Fig. 9U,W) were significantly down-regulated in high aneuploidy subtypes. Other miRNAs (miR-200c-3p, miR-425-5p and miR-429) (Supplementary Fig. 9Q–S) and LncRNA (PCAT19) (Supplementary Fig. 9V) were differentially expressed in high aneuploidy subtypes. And the differential expression trend of miRNAs (miR-425-5p, miR-429 and miR-200c-3p) between the two subtypes of THYM was opposite to the expression trend of AHGs.
To evaluate the protein expression of BEX4, we used the HPA database (https://www.proteinatlas.org/) to extract immunohistochemical image and found that the protein expression of BEX4 in tumor tissues of 16 cancer types was significantly lower than that in normal tissues (Supplementary Fig. 10A). Meanwhile, we also found that patients with high level of BEX4 had a good prognosis in pancreatic cancer and renal cancer in HPA database KM plotter database (Supplementary Fig. 10B,C).
To investigate the influence of BEX4 expression on the prognosis of patients in PAAD, KICH, KIRC, and KIRP, level of BEX4 was conducted by immunohistochemistry (IHC) and patients were divided into two groups with different level of BEX4 (Fig. 6A). In PAAD, KICH, KIRC, and KIRP, we found that patients with high level of BEX4 had great prognosis than patients with low level of BEX4, which indicated that high expression of BEX4 was a protective factor (Fig. 6B–E). These results were consistent with the information provided by the HPA database (Supplementary Fig. 10B,C). Then, to confirm the influence of BEX4 expression on the renal cancer and pancreatic cancer, we constructed BEX4 overexpression in A498 cells (A498 OE) and PANC-1 cells (PANC-1 OE), respectively (Fig. 6F,G). Subsequently, we found that overexpression of BEX4 alleviated motility and proliferation of A498 cells and PANC-1 cells (Fig. 6H–J), respectively.
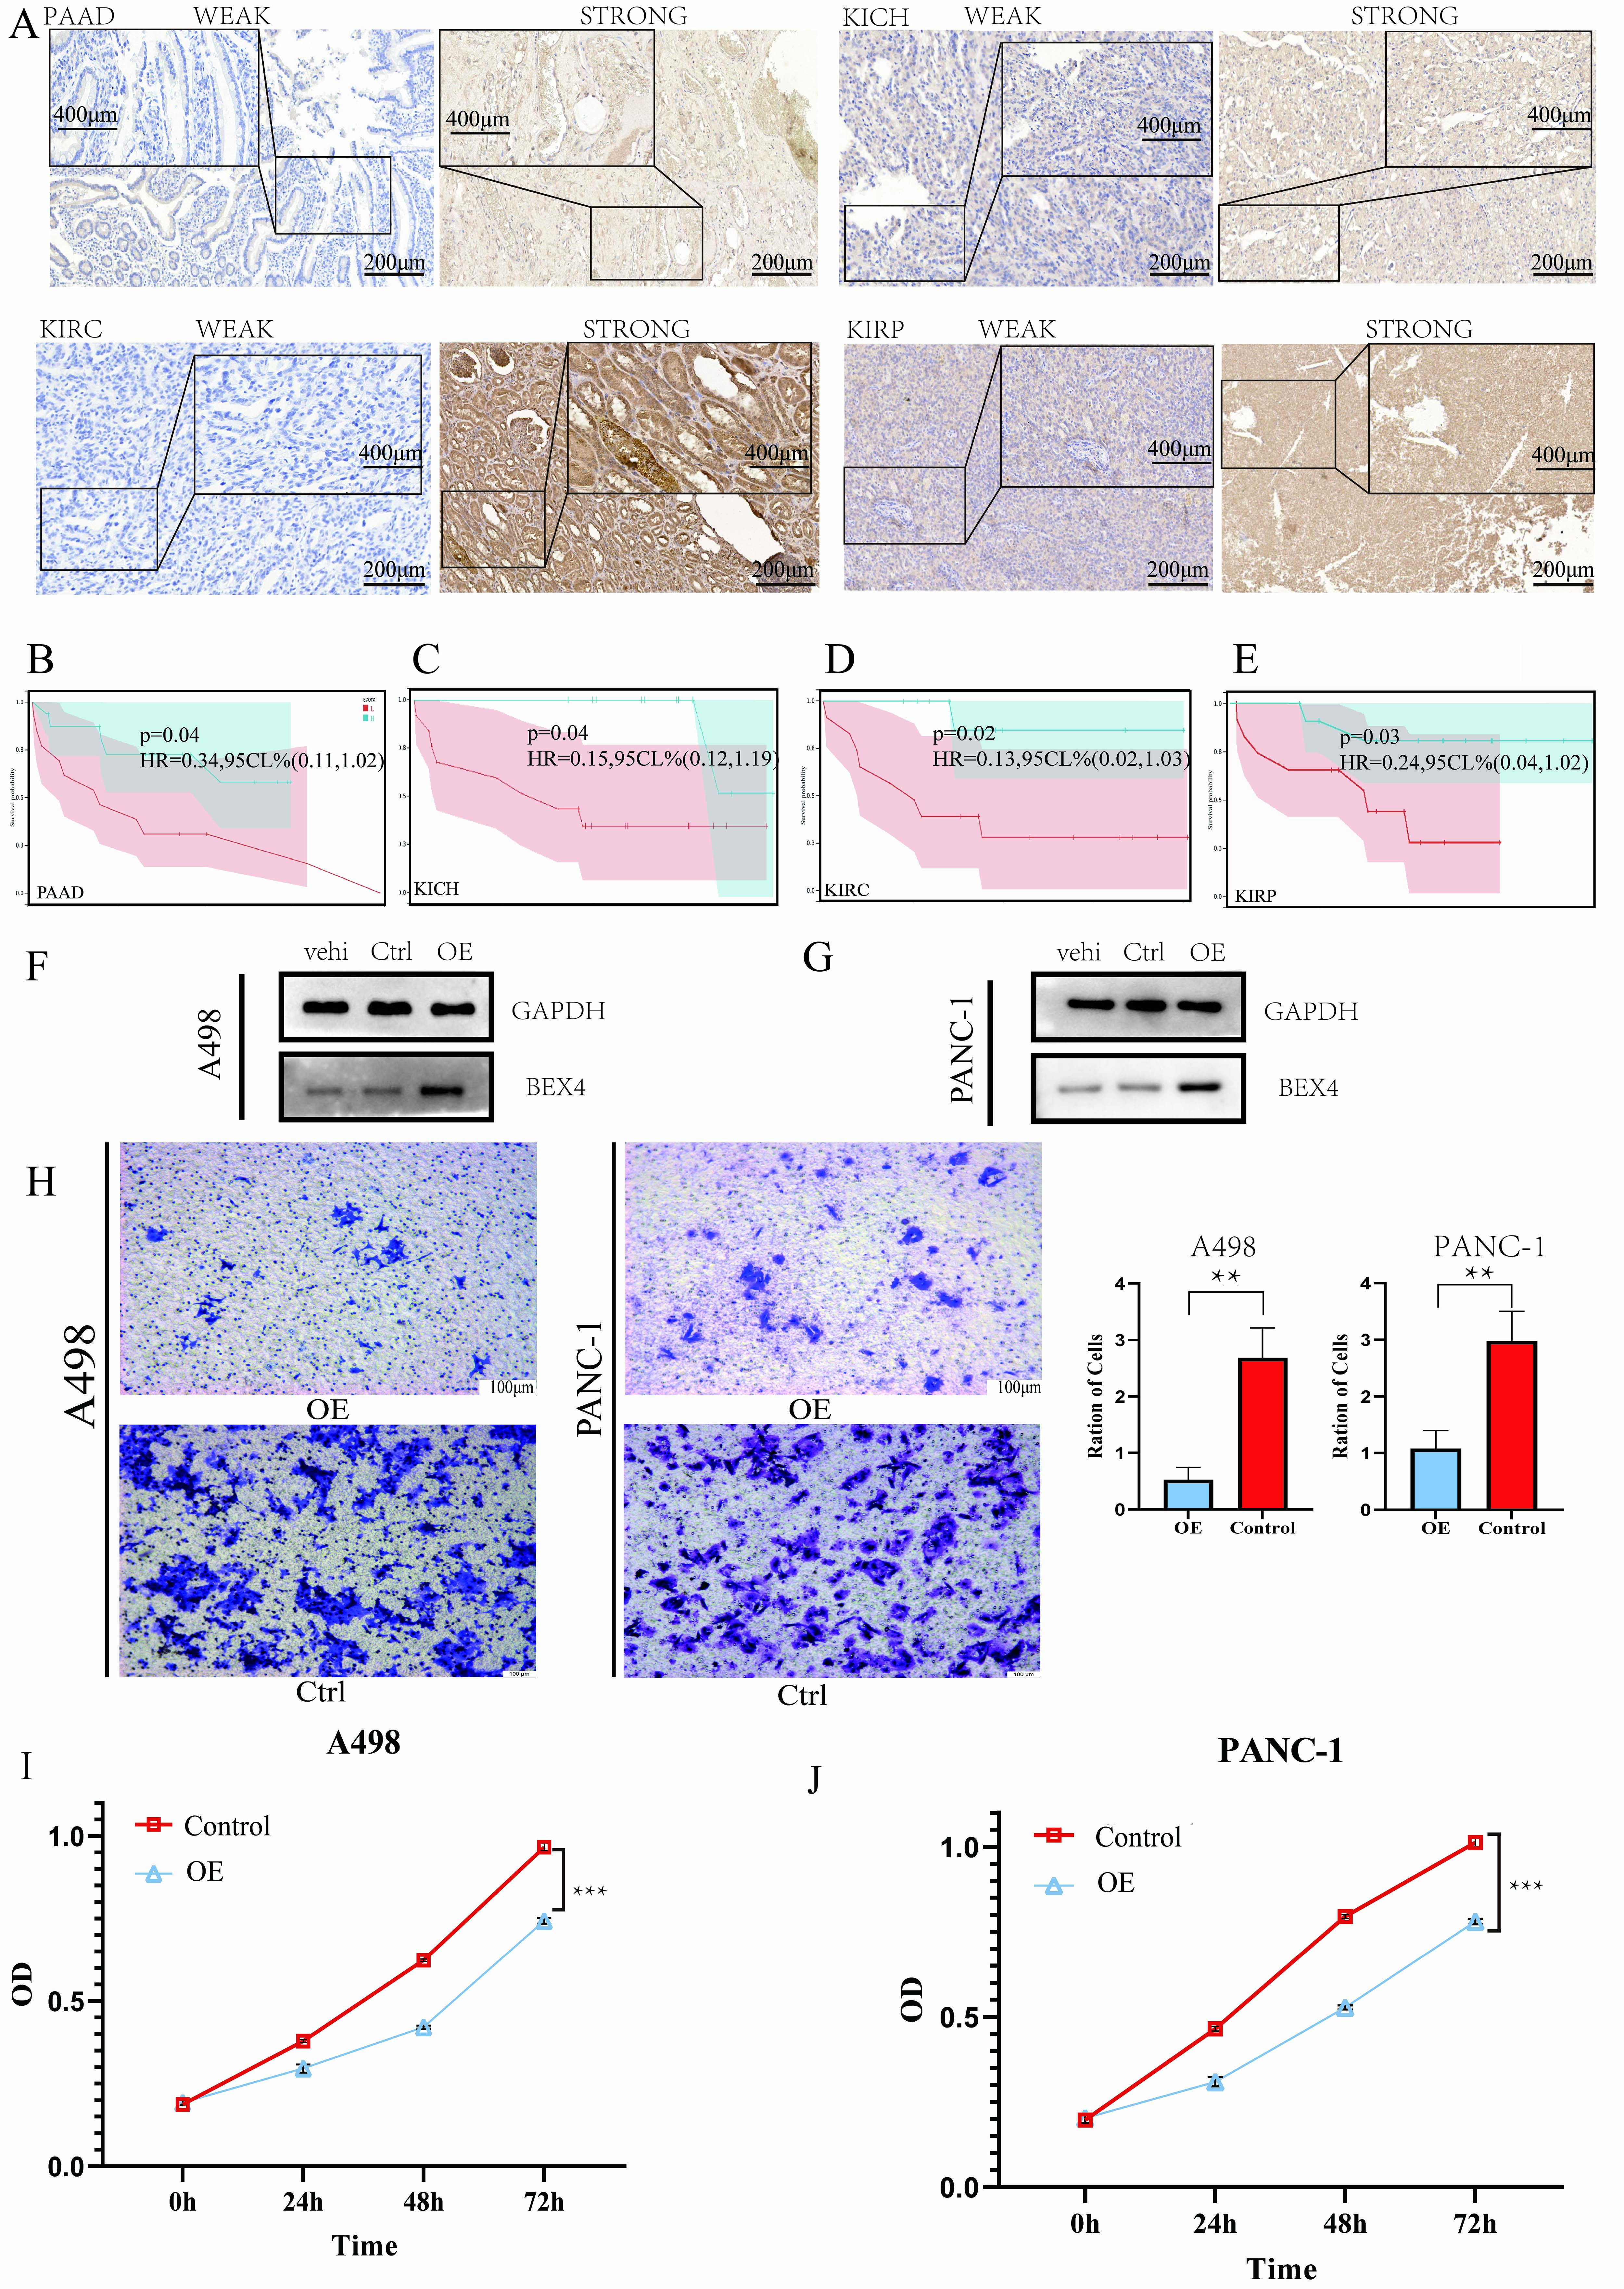 Fig. 6.
The influence and prognostic value of BEX4 in
pancreatic cancer and renal cell carcinoma. (A) Immunohistochemistry (IHC)
showed the low and high expression of BEX4 in pancreatic adenocarcinoma (PAAD), KICH, kidney renal clear cell carcinoma (KIRC) and kidney renal papillary cell carcinoma (KIRP). Scale
bar = 200 µm and 400 µm . (B–E) KM survival curves showed patients with high
expression of BEX4 has great prognosis in PAAD (B), KICH (C), KIRC (D) and KIRP
(E), respectively. (F,G) Western blot showed protein level of BEX4 in different
A498 (F) and PANC-1 (G), respectively. (H) Migration of A498 and PANC-1 cells was
assessed by transwell assay after overexpression of BEX4. Scale bar = 100
µm. (I,J) Proliferation of A498 (I) and PANC-1 cells (J) was assessed by cell counting kit-8 (CCK-8) assay after overexpression of BEX4.
**p
The comprehensive analysis of machine science, in conjunction with the findings of this study, has elucidated the significant role of BEX4 in various aspects of cancer biology. This has yielded valuable insights into its differential expression, clinical prognostic value, immune microenvironment, and its potential involvement in the development of aneuploidy in tumor tissues and screening applications. Additionally, our study has systematically established a regulatory network involving competing endogenous RNA (CeRNA) and associated hub genes (AHGs). The complexity of this regulatory network underscores the necessity of considering multi-layered gene and miRNA regulation in future research endeavors and understanding the pathogenesis of cancer. The present study focuses on the co-regulation of BEX4, CAMSAP2, and MARCKS by hsa-miR-425-5p, hsa-miR-200c-3p, hsa-miR-200b-3p, and has-miR-425 in multiple tumors. Furthermore, the significance of aneuploidy in cancer is discussed through the construction of tumor subtypes and analysis of tumor cell stemness. Previous research has indicated that aneuploidy and chromosome instability contribute to tumor drug resistance [36].
Additionally, the screening of aneuploidy-associated genes (ACGs) using machine learning presents a novel approach to identify genes related to aneuploidy, with particular emphasis on AHGs such as BEX4, which play a crucial role in various cancer types. Mitosis is the primary contributor to chromosome instability [15], which in turn is closely linked to aneuploidy [34]. Research has demonstrated that the overexpression of BEX4 has a direct impact on tubulin’s normal functioning, resulting in aberrant microtubule behavior and the development of cancerous aneuploid cells. Furthermore, CAMSAP2 and MARCKS within AHGs also influence microtubules in cellular constituents alongside BEX4. Functional enrichment analysis has revealed that BEX4 and CAMSAP2 jointly affect the molecular function of tubulin binding. Furthermore, AHGs exert an influence on various organelles, including centrosomes, which directly impact cell mitosis, and they also interact with cytoskeletal proteins in molecular capacities. Consequently, the impact of BEX4 on the aberrant biological process of aneuploidy is not isolated, suggesting its involvement in cellular functions alongside other AHGs. Simultaneously, the distinct expression patterns of AHGs in diverse tumor subtypes may indicate that the specific molecular mechanisms through which BEX4 affects aneuploidy in different cancer cells vary.
The emergence of genomic instability has been identified as a contributing factor in the generation of stem-like cancer cells (SLCCs), particularly during tumor relapse [23, 37]. Cancer stem cells (CSCs) [33, 38] or SLCCs, despite constituting a minor fraction of tumor tissue [36, 39], have a significant impact on tumor initiation, proliferation, and progression [36]. By utilizing the OCLR algorithm for mRNAsi computation, we can predict the acquisition of stem cell attributes during tumor progression [19]. The negative correlation observed between AHGs and cancer stem cell scores in various tumors suggests the potential regulatory role of AHGs in regulating stemness phenotype. In the context of esophageal adenocarcinoma, the correlation coefficient demonstrated a noteworthy value of –0.75, indicating a strong indication of the potential significance of the BEX4-related pathway in the progression of tumors and introducing an additional aspect to its involvement in cancer progression. In KICH, THCA and THYM, after Mfuzz expression pattern clustering analysis, we found that within the four scores related to stemness, the expression levels of gene sets involved in cell transcription and cell cycle pathways were significantly positively correlated. At the same time, among different cancer types, although there are many clusters showing significant correlation with functional scores that affect tumor stemness, there are significant differences in the positive and negative correlation coefficients. This means that there are significant differences in the mechanisms leading to tumor stemness in different cancer species. In KICH and THCA, the gene set with similar expression trend to BEX4 not only affects the emergence of stemness, but also widely participates in the related pathways of viral infection or biological metabolism. This suggests a new biological mechanism that may lead to or enhance tumor stemness. Despite the subtype analysis conducted in KICH and THCA revealing a potential negative correlation between the acquisition of stemness by tumor cells and the degree of aneuploidy, previous research has demonstrated that aneuploidy fosters the proliferation and carcinogenesis of human stem cells [40, 41]. This implies that there exists an intricate mechanism of interaction between aneuploidy and the acquisition of tumor cell stemness, necessitating further investigation and elucidation.
The assessment of BEX4 protein expression through immunohistochemical evaluation, along with its association with the prognosis of cancer types, offers valuable insights into the process of transformation and amplifies the clinical significance of BEX4. Experimental validation, encompassing Western blot analysis and cell function analysis, further reinforces the potential therapeutic importance of modulating BEX4 expression.
This study offers significant insights into the involvement of key genes, particularly BEX4, in cancer. However, it is important to acknowledge the limitations of this research. Our findings primarily rely on bioinformatics analysis, and further experimentation involving various proteins and biomolecules is necessary to validate the specific role and precise function of BEX4. we can elucidate the molecular mechanism underlying the functional alterations resulting from differential expression of BEX4. Collectively, our examination of BEX4 underscores the significance of aberrant gene expression in the advancement of cancer and underscores the necessity for a comprehensive comprehension of the tumor-specific milieu. Additionally, the correlation analysis of immunotherapeutic effectiveness across subtypes further suggests a plausible association between aneuploidy and tumor therapy, with BEX4 exhibiting a distinct role and potential as a therapeutic target.
This study identified the key biological role of BEX4 and other aneuploidy-associated genes in the process of aneuploidy and discovered new clues in the dynamics of microtubule cytoskeleton. Moreover, the abnormal expression of BEX4 not only affects genomic stability but also enhances stem cell characteristics, driving the acquisition of tumor stemness. These findings provide new insights into the mechanistic link between aneuploidy and stemness, highlighting BEX4 as a potential therapeutic target.
The RNA sequencing data, clinical data, and survival data used in this study were all collected from publicly available databases TCGA, GEO, HPA, TARGET and GSEA. The datasets used and analyzed during the current study are available from the corresponding author on reasonable request.
AZX, JJL and LT contributed to the design of the study. BSZ and YJX were responsible for preprocessing the collected data. JJL, LT and SLX collected the clinical samples, performed clinical data analysis and pathology analysis. WKY, AHY and ZJK summarized the experimental results. AZX, LT, JJL, TTS and ZHW performed most of the experiments, analyzed the data and wrote the manuscript. ChoZ, ChaZ and WQY designed the frame of this work and provided the raw data. The authors read and approved the final manuscript. All authors contributed to editorial changes in the manuscript. All authors have participated sufficiently in the work and agreed to be accountable for all aspects of the work.
Informed consent was provided by all patients or their families/legal guardians, and the Ethical Committee of the First Affiliated Hospital of Anhui Medical University approved the study (Anhui, China) (ID:2023558).
Our special acknowledgments to Dr. Laura Jordhen (Department of Family Medicine, Adventist Health Parkrose, USA) for revising the language of our manuscript.
This work was supported by the National Natural Science Foundation of China (Grant nos 82303475), and the University Research Project of Anhui Province (Grant nos 2022AH040161).
During the preparation of this work, I used ChatGPT 4.0 and ChatGPT 3.5 (OpenAI) to find suitable substitute words and overcome non-native language barriers. Supported by the AI tool, I reviewed and edited the content as needed and took full responsibility for the content of the publication.
The authors declare no competing interests.
Supplementary material associated with this article can be found, in the online version, at https://doi.org/10.31083/j.fbl2912407.
References
Publisher’s Note: IMR Press stays neutral with regard to jurisdictional claims in published maps and institutional affiliations.