


 , Xiaoping Zhang 1,2,*
1 Department of Urology, Union Hospital, Tongji Medical College, Huazhong University of Science and Technology, 430022 Wuhan, Hubei, China
2 Institute of Urology, Union Hospital, Tongji Medical College, Huazhong University of Science and Technology, 430022 Wuhan, Hubei, China
†These authors contributed equally.
Abstract
Clear cell renal cell carcinoma (ccRCC) represents the most prevalent form of renal cell carcinoma. The management of early-stage ccRCC has a better prognosis, while patients with metastatic ccRCC have a lower five-year survival rate. Angiogenesis serves as the fundamental process underlying tumor metastasis. Therefore, it is crucial to discover new targets for angiogenesis to improve patient survival rates.
The Cancer Genome Atlas database, International Cancer Genome Consortium database, Clinical Proteomic Tumor Analysis Consortium database, and a gene set of the vascular endothelial growth factor (VEGF) signaling pathway were utilized to identify differentially expressed genes. Western blot (WB), quantitative real-time polymerase chain reaction, and immunohistochemistry were employed to validate the downregulation of phospholipase C gamma 2 (PLCG2) in ccRCC tissues and cells. Cell Counting Kit-8 (CCK-8) assays, transwell assays, tube formation assays, and oil-red staining were performed to elucidate the biological functions of PLCG2 in tumor cells. Gene set enrichment analysis was applied to explore the downstream pathway. Subcutaneous tumor models and live small animal fluorescent imaging assay were utilized for in vivo investigation of the roles played by PLCG2.
Our study has identified a novel biomarker, PLCG2, for ccRCC. PLCG2 is a central gene in regulating angiogenesis in ccRCC, as validated by bioinformatics analysis. The findings revealed a diminished expression of PLCG2 in both ccRCC tissues and cells. Further experiments in vivo and in vitro have demonstrated the significant roles of PLCG2 in tumor proliferation, invasion, migration, and lipid accumulation. Results of tube formation assays and WB support the role of PLCG2 in regulating VEGFA expression and angiogenesis.
Our results show that PLCG2 functions as a potential biomarker and an independent prognostic indicator for ccRCC. PLCG2 may modulate angiogenesis by influencing the expression of VEGFA. Therefore, targeting PLCG2 could potentially lead to drug discovery and improved cancer treatment strategies.
Keywords
- PLCG2
- VEGF signaling way
- clear cell renal cell carcinoma
- metastasis
- angiogenesis
Renal cell carcinoma (RCC) is a prevalent malignant tumor within the urinary system. According to an estimated report by the American Cancer Society, there was an increase in approximately 81,610 new cases of kidney and renal pelvis cancer in the United States in 2024, with around 14,390 deaths attributed to this disease [1]. The most prevalent form of RCC is clear cell renal cell carcinoma (ccRCC) [2]. Unfortunately, metastatic ccRCC has low 5-year survival rates ranging from 10% to 20% [3]. Therefore, it is particularly important to explore the mechanism of the occurrence and development of RCC.
Risk factors of RCC include tobacco smoke exposure [4], hypertension [5], and
obesity [6]. Additionally, von Hippel-Lindau (VHL) gene mutation is
frequently observed in RCC [7]. Numerous studies have reported that over 80% of
ccRCC tumors exhibit biallelic inactivation of VHL [8, 9, 10]. Furthermore, it
has been discovered that deletion of VHL along with p53 and RB
Transcriptional Corepressor 1 (RB1) specifically leads to the transition from
renal epithelial cells to ccRCC in mice models [11]. Among these, the p53 protein
plays a crucial role as a guardian of the genome. RB1 mutations were
associated with retinoblastomas [12]. The discovery of VHL occurred in
1993 when its delineated region on human chromosome 3p25-p2 was identified.
However, VHL mutations are rare outside VHL disease and ccRCC; as
previously mentioned, approximately 80% of sporadic ccRCC cases display
VHL mutations [13]. Therefore, undoubtedly, VHL serves as a potential
biomarker for RCC. When there is a mutation in VHL gene expression,
vascular endothelial growth factor (VEGF) and glucose transporter-1 levels
increase [14]. Additionally, the deficiency of VHL is closely associated with
hypoxia-inducible factor-
Due to the pivotal roles played by HIF-
Phospholipase C gamma 2 (PLCG2) is an enzyme that hydrolyzes the membrane phospholipid phosphatidylinositol-4,5-bisphosphate (PIP2) to produce two second messengers: diacylglycerol (DAG) and inositol-1,4,5-trisphosphate (IP3) [15]. Current research on PLCG2 primarily focuses on its roles in leukemia, Alzheimer’s disease, and PLCG2-associated antibody deficiency and immune dysregulation (PLAID). Numerous studies have shown that PLCG2 plays a crucial role in Bruton’s Tyrosine Kinase Inhibitor (BTKi) resistance in patients with chronic lymphocytic leukemia (CLL). Another common mutation associated with BTKi resistance is Bruton’s Tyrosine Kinase (BTK) mutation [16, 17]. Both of these mutations are results of secondary resistance and are currently key areas of research in BTKi resistance [17]. In addition to its role in CLL, where most patients are affected by heterozygous deletions in the PLCG2 gene, leading to spontaneous activation of mast cells at low temperatures and subsequent cold-induced urticaria, PLCG2 is also crucial for the immune function of these patients. B cells and natural killer (NK) cells in PLAID patients exhibit impaired activation due to PLCG2 deletions. Given that PLCG2 plays a significant role in the immune system of PLAID patients and considering that renal cancer, specifically ccRCC, is characterized by abnormal immune infiltration, there may be a potential connection between these conditions [18]. Besides its role in PLAID, PLCG2-induced increases in DAG can potentially activate Protein kinase C (PKC), which has been extensively studied for its impact on the VEGF signaling pathway [19]. Investigating PLCG2 may offer a novel approach to addressing tumor angiogenesis driven by VEGF pathway activation. Meanwhile, given that ccRCC is also characterized by abnormal immune infiltration, there might be a significant connection between these conditions.
Here, we demonstrated that PLCG2 plays an important role in ccRCC. First, The Cancer Genome Atlas (TCGA) database, International Cancer Genome Consortium (ICGC) database, Clinical Proteomic Tumor Analysis Consortium (CPTAC) cohorts, and a gene set associated with the VEGF signaling pathway were used to search the hub gene of angiogenesis of ccRCC. PLCG2 was picked relying on the better clinical values. The result of gene set enrichment analysis (GSEA) confirmed the correlation between PLCG2 and angiogenesis of ccRCC once again. Second, clinical samples and cell lines were utilized to confirm the low expression of PLCG2 in ccRCC tissues and cells. Functional studies confirmed that PLCG2 plays an essential role in ccRCC proliferation, migration, and invasion. The tube formation assays and the Western blot proved that PLCG2 influences VEGFA expression and plays an important role in angiogenesis. Finally, we find that PLCG2 could take part in the management of ccRCC proliferation and metastatic ability in vivo.
The data that we analyzed was downloaded from TCGA database(https://www.cancer.gov/ccg/research/genome-sequencing/tcga), ICGC database(https://platform.icgc-argo.org/), and CPTAC-PDC000127(https://pdc.cancer.gov/pdc/browse) cohorts which included gene expression datasets corresponding with clinicopathological information.
The human ccRCC cell lines (786-O, Caki-1, A498, ACHN, OSRC-2) and the human normal cell line (HEK293) were sourced from the American Type Culture Collection (Manassas, VA, USA). All cell lines were authenticated through STR profiling and confirmed to be mycoplasma-free. Cells were maintained in high glucose Dulbecco’s Modified Eagle’s Medium (DMEM, Gibco, Waltham, MA, USA) with 10% fetal bovine serum (Gibco) at 37 °C in a 5% CO2 environment.
Tissue samples from ccRCC patients were collected by the Department of Urology, Union Hospital (Wuhan, Hubei, China) from 2022 to 2023. All the patients only accepted surgery without any other antitumor treatment before. All the pathological results were ccRCC. The tumor-adjacent normal renal tissues were taken more than 2.5 cm away from the cancer tissues. All patients were informed and consented to it with written documents. Huazhong University of Science and Technology Ethics Committee approved this study (IEC-072).
TRIzol reagent (#R4801, Magen Biotechnology Co., Ltd., Guangzhou, China) was employed for the extraction of total RNA from cells and tissues. A quantity of 500 ng RNA was utilized for reverse transcription, followed by cDNA synthesis. Subsequently, qPCR analysis was performed using the Sybr Green Mix (#11203ES03, Yeasen, Shanghai, China). The qPCR procedures were performed in accordance with the manufacturer’s instructions and data analysis was conducted using the StepOnePlus™ PCR system (Thermo Fisher Scientific, Waltham, MA, USA). Primer sequences were as follows: pLCG2: Forward, 5′-CGTCTACCCAAAGGGACAAA-3′; Reverse, 5′-GACTGTCAGCGTCATCAGGA-3′. GAPDH: Forward, 5′-GAGTCCACTGGCGTCTTCA-3′; Reverse, 5′-GGTCATGAGTCCTTCCAGGA-3′.
Protein extraction from cells was performed using a mixture of radioimmunoprecipitation assay lysis buffer (#P0013C, Beyotime, Shanghai, China), phenylmethanesulfonyl fluoride, and proteinase inhibitors. Bicinchoninic acid (BCA) Protein Assay Kit (#23225, Thermo Fisher Scientific, Waltham, MA, USA) was used for protein quantification. The extracted proteins underwent electrophoresis on a sodium dodecyl sulfate-polyacrylamide gel electrophoresis at 80 V and were then transferred onto polyvinylidene fluoride membranes. The membrane was blocked using 5% non-fat dried skim milk for 30 min and subsequently incubated overnight at 4 °C with the primary antibody. Following this, the membranes were incubated with the secondary antibody for two hours at room temperature prior to development. Primary antibodies were diluted according to the manual’s instructions, including PLCG2 (1:800, #A5182, ABclonal Biotech Co., Ltd., Wuhan, China), VEGFA (1:800, #A12303, ABclonal Biotech Co., Ltd.), GAPDH (1:2000, #60004-1-Ig, Proteintech, Chicago, IL, USA), HIF-2ɑ (1:1500, #66731-1-Ig, Proteintech), VEGFR2 (1:2000, #A5609, ABclonal Biotech Co., Ltd.). Western blot utilized horseradish peroxidase (HRP)-conjugated Affinipure Goat Anti-Rabbit IgG (H+L) (1:2000, #SA00001-2, Proteintech) and HRP-conjugated Affinipure Goat Anti-Mouse IgG (H+L) (1:2000, #SA00001-1, Proteintech) as secondary antibodies.
PLCG2-targeted siRNAs (siRNA#1: 5′-CUGAGAAAGCAGAUAUAUUTT-3′; siRNA#2: 5′-GAGGCGAUGUGGAUGUCAACA-3′) were supplied by Genechem Co., Ltd. (Shanghai, China). PLCG2-overexpressed lentivirus was also provided by Genechem Co., Ltd. The targeted transcript of PLCG2-overexpressed lentivirus was NM002661 and the lentiviral vector was GV492 (Ubi-MCS-3FLAG-CBh-gcGFP-IRES-puromycin). Lentivirus and vector were transduced into A498 and CAKI-1 cell lines, while siRNA and negative control were transfected into A498 and CAKI-1 cells as well.
Inoculating 2
The cell pellets were collected in a six-well plate, and the triglyceride content was quantified using triglyceride determination kits (#A110-1-1, Nanjing Jiancheng Institute of Bioengineering, Nanjing, China) following the manufacturer’s instructions.
Immunohistochemistry (IHC) was performed on tumors and adjacent normal tissues from patients. First, the tissues are sliced, formalin-fixed, and paraffin-embedded. The following steps were de-paraffinization, rehydration, and incubating for antigen retrieval. PLCG2 antibody was the primary antibody (#A5182, ABclonal Biotech Co., Ltd.) that was used against PLCG2 for 12 h. Then the sections were washed with PBS before corresponding with secondary antibodies (#5220-0336(074-1506), KPL, Gaithersburg, MD, USA). After that, the picture was obtained by microscope (#Pannoramic SCAN, 3D Histech, Budapest, Hungary) randomly.
The cell was starvation with fetal bovine serum (FBS)-free for 24 h before transwell assays. The inserts were placed in 24-well plates with 500 µL high glucose medium (Gibco) with 10% FBS at the underpart. Cells would be cultured in the top of inserts with FBS-free DMEM to invade the inserts with or without Matrigel. After 24 h culturing, methanol (Sinopharm Chemical Reagent Co., Ltd., Beijing, China) was used to fix the cells, and crystal violet (#G1014, Servicebio) was used to stain it. The image was caught by the microscope (#DSZ2000, UOP Photoelectric Technology, Chongqing, China) randomly.
Each well was cultured 2
Cultivate ccRCC cells until they reach approximately 70% confluency, then replace the medium with serum-free medium and continue to culture for 24 h. Collect the supernatant and centrifuge at 200 g for 5 min to remove any debris. Filter the supernatant through a 0.22-micron filter to obtain the conditioned medium. Store the conditioned medium at 4 °C for short-term use or at –80 °C for long-term storage. Cultivate HUVEC in endothelial cell medium until they reach approximately 70% confluency, then replace the medium with the previously prepared conditioned medium before experiments.
Add 200 µL of Matrigel to each well of a 24-well plate and incubate at 37
°C for 30 min before the addition of 6
The ELISA kit utilized was the Human VEGF-A ELISA Kit from Elabscience (#E-EL-H0111c, Elabscience Biotechnology Co., Ltd., Wuhan, China), following all procedures as per the manufacturer’s instructions. In summary, a preliminary experiment was conducted to determine the optimal dilution concentration. Thereafter, the extracted conditioned medium, diluted to the identified concentration, was added in equal volumes to the antibody-coated plates supplied by the kit. The protocol involved repeated cycles of incubation at 37 °C in the dark, followed by washing and blotting dry. Finally, the substrate solution was added and incubated for 15 min, after which the stop solution was introduced. The absorbance was immediately measured at 450 nm. After calibrating the obtained ptical density (OD) values, the corresponding concentrations were calculated using the curve fitted to the standard samples.
The negative control and lentivirus were used to infect 1
Using negative control and lentivirus infected 1
Data analyses were conducted using SPSS Statistics version 25.0 (IBM Corp.,
Chicago, IL, USA) and GraphPad Prism version 9.0 (GraphPad Software Inc., San
Diego, CA, USA). Variations between control and experimental groups were assessed
through unpaired and paired Student’s t-tests. One-way ANOVA was applied
to explore differences among multiple groups relative to a control group.
Kaplan-Meier survival analysis was utilized to project patient prognoses.
Furthermore, logistic regression analyses focusing on single genes were executed
in SPSS and results were methodically presented in tabular formats. Statistical
data were expressed as mean values
The VEGF signaling pathway was markedly correlated with the clinical prognosis in ccRCC. Thus, the genes that were differential expression in TCGA-KIRC database, ICGC-KIRC database, CPTAC-PDC000127 cohorts, and a gene set of the VEGF signaling pathway were used to screen the hub gene of the angiogenesis in ccRCC. The intersection of these four datasets showed that 6 genes were significantly different expressions in ccRCC relative to the normal tissues (Fig. 1A). From go without saying, that VEGFA and VEGFB, as two famous factors of the VEGF signaling pathway, played important roles in the angiogenesis of ccRCC. There was not much innovativeness to study with those two genes. Kaplan–Meier analysis showed ccRCC patients with higher expression of FMS-like tyrosine kinase 1 (FLT1) and neuropilin 1 (NRP1) had better overall survival which was opposite to the upregulation in the tumor, indicating these two factors had no clinical significance (Fig. 1B–D). The prognostic values of PLCG2 and carboxy-terminal Src kinase (CSK) were consistent in the expression of ccRCC (Fig. 1B–D). Next, monogenic logistics were performed demonstrating that PLCG2 had more diagnostic value to be a biomarker for ccRCC (Tables 1,2). The findings from the receiver operating characteristic curve (ROC) analysis also indicated the expression of PLCG2 was associated with the clinical prognosis (Fig. 1E and Supplementary Fig. 1A). Pair comparison by TCGA and ICGC database and unpair comparison by CPTAC database showed that PLCG2 was significantly downregulated in tumor tissues (Fig. 1F and Supplementary Fig. 1B). The data from the ArrayExpress database (E-MTAB-1980) and TCGA database indicated that PLCG2 expression was associated with clinical stages of ccRCC (Supplementary Fig. 1C,D). GSEA showed the high-expression group of PLCG2 was enriched in the VEGF signaling pathway and angiogenesis (Supplementary Fig. 1E). The Kyoto Encyclopedia of Genes and Genomes (KEGG) analysis showed the same results. Even more interesting is renal cell cancer was enriched in KEGG analysis which confirmed that PLCG2 may be a hub gene to make RCC in connection with angiogenesis (Supplementary Fig. 1F). The results consistently supported the significance of PLCG2 as a pivotal gene implicated in renal cancer and angiogenesis.
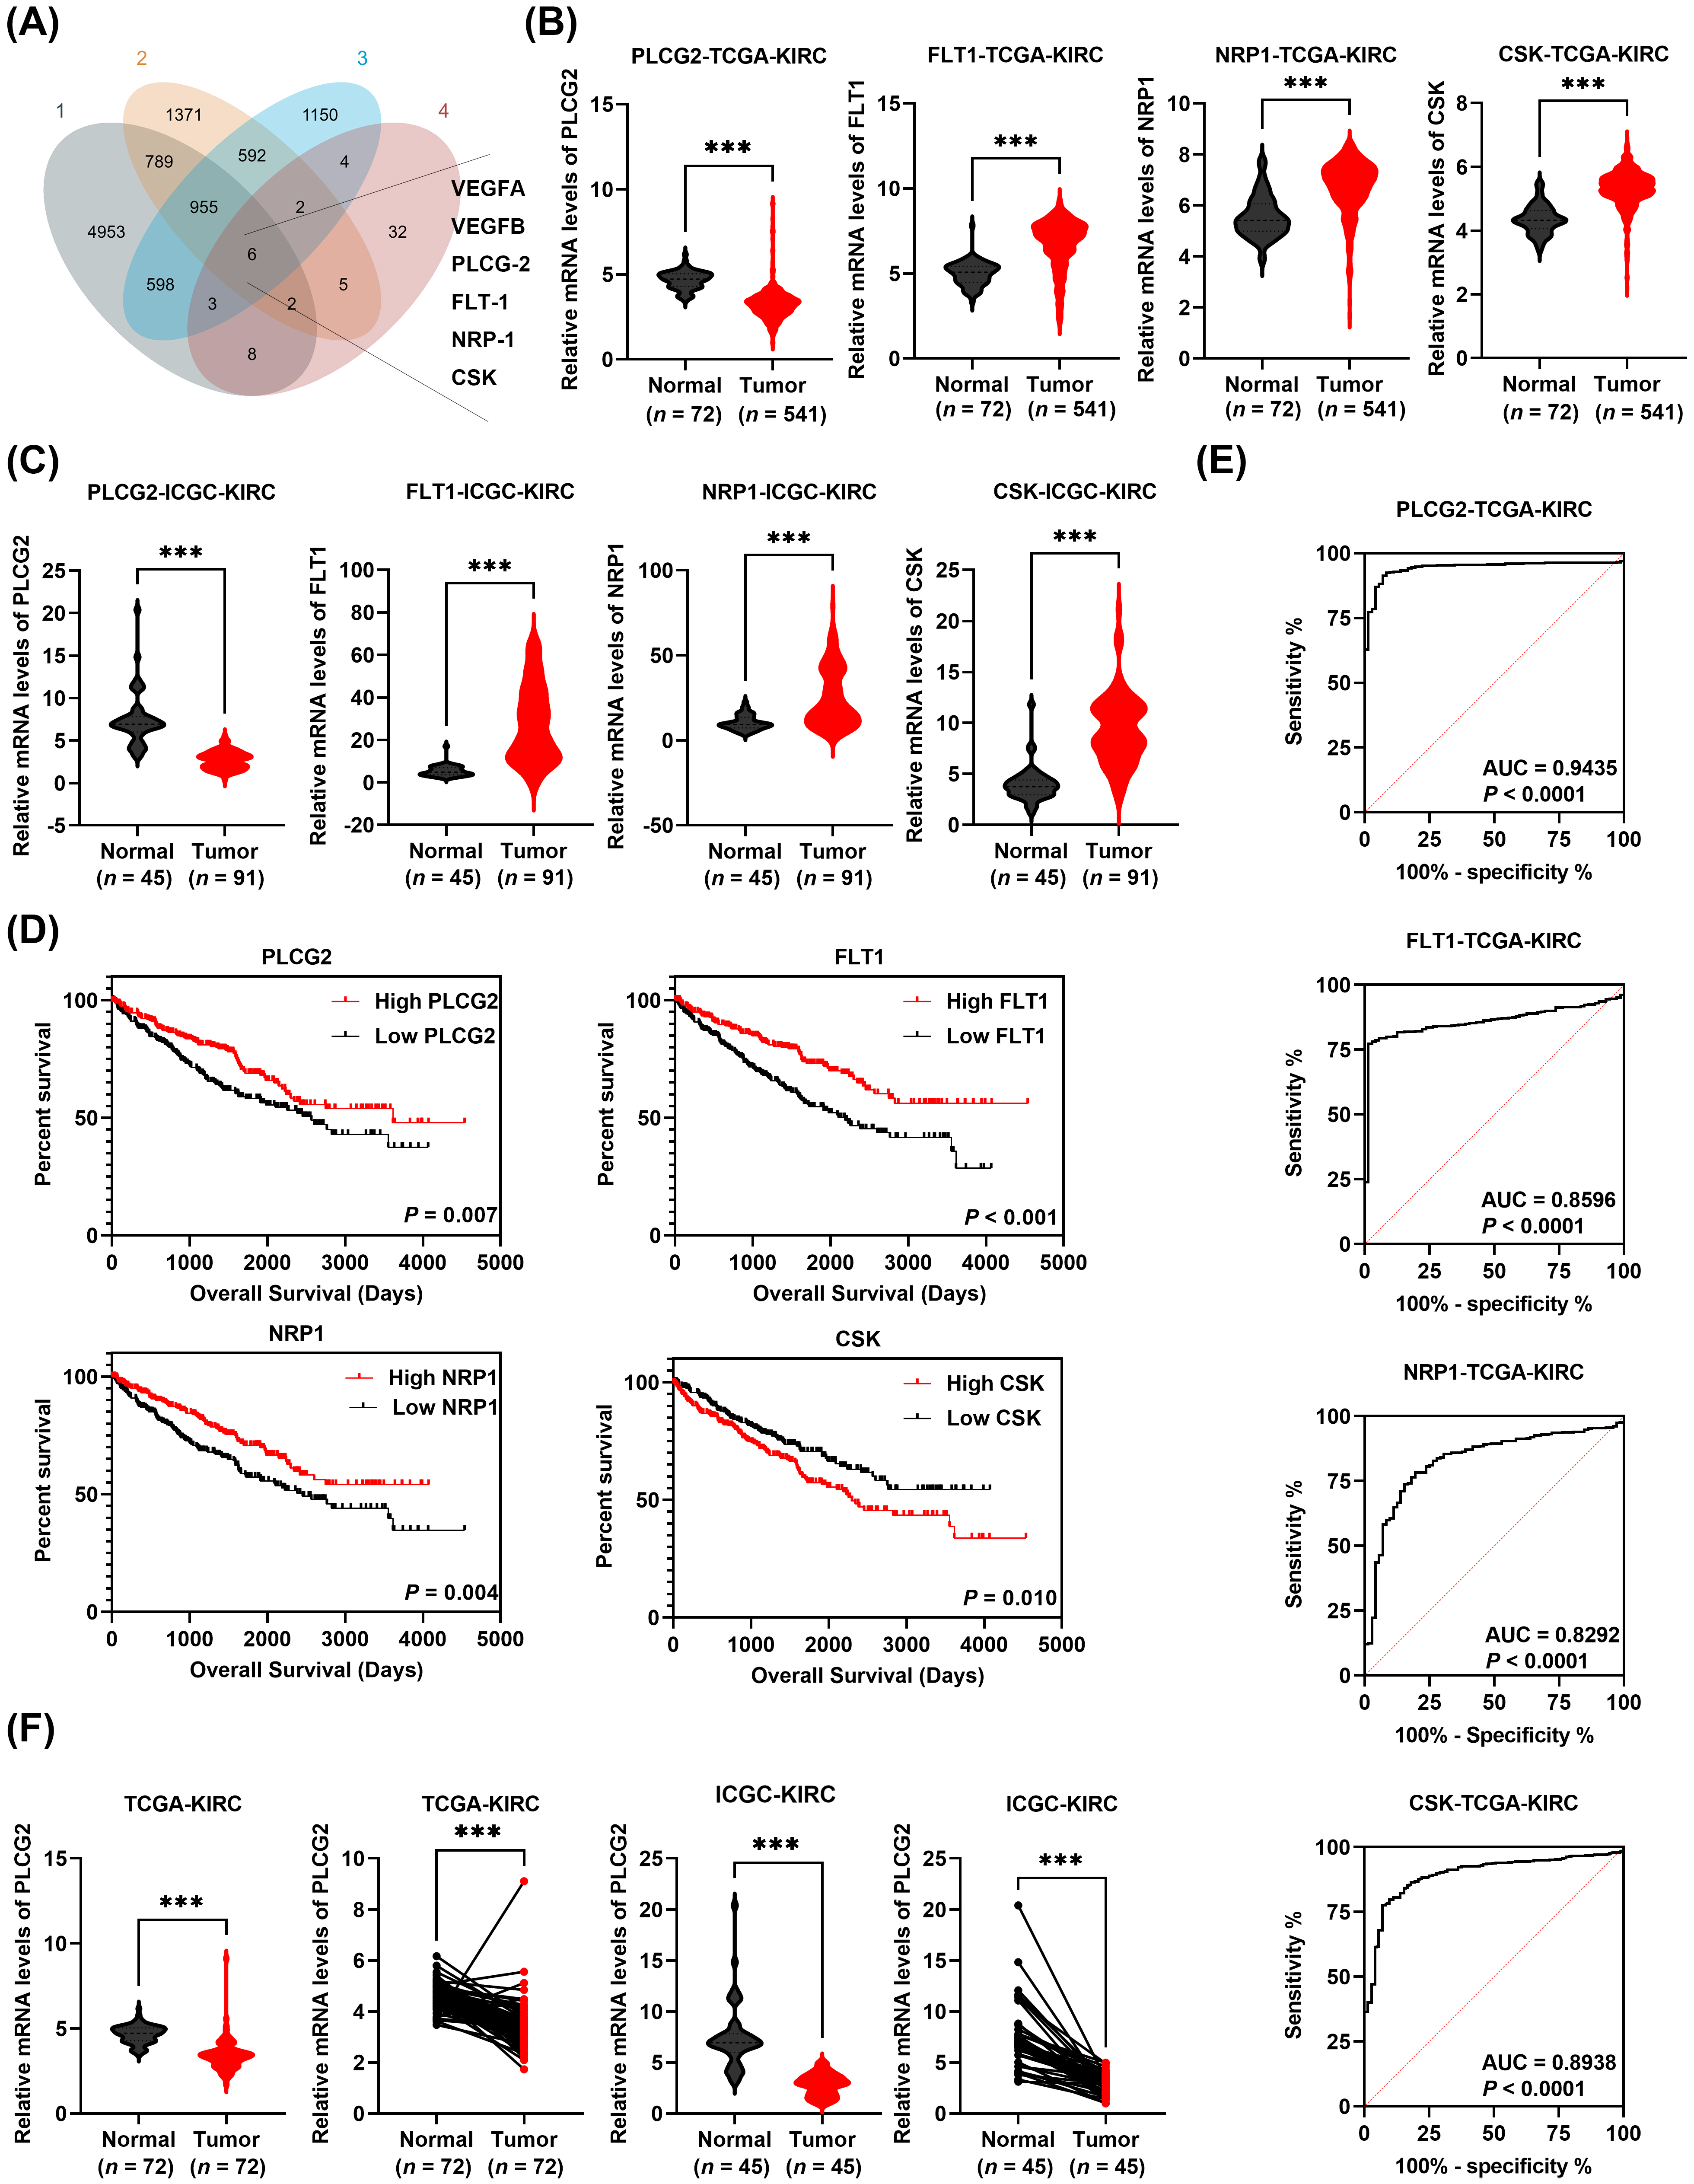 Fig. 1.
PLCG2 was downregulated and was a potential biomarker in ccRCC.
(A) The intersection of differential genes of TCGA-KIRC (gene set 1), ICGC-KIRC
(gene set 2), CPTAC-PDC000127 cohorts (gene set 3), and a VEGF-related gene set
(gene set 4). (B) The mRNA levels of 4 genes (PLCG2, FLT1,
NRP1, CSK) in ccRCC tissues and normal tissues based on
TCGA-KIRC cohort. (C) The mRNA levels of 4 genes (PLCG2, FLT1,
NRP1, CSK) in ccRCC tissues and normal tissues based on
ICGC-KIRC cohort. (D) The Kaplan-Meier survival curve of 4 genes (PLCG2,
FLT1, NRP1, CSK). (E) The ROC curve of 4 genes
(PLCG2, FLT1, NRP1, CSK) in TCGA-KIRC cohort.
(F) The mRNA levels of PLCG2 in matched normal and cancerous tissues
based on TCGA-KIRC cohort and ICGC-KIRC cohort (***p
| Characteristics | Total (N) | OR (95% CI) | p value |
| Pathologic T stage (T2&T3&T4 vs. T1) | 541 | 0.547 (0.389–0.769) | |
| Pathologic N stage (N1 vs. N0) | 258 | 1.307 (0.472–3.623) | 0.607 |
| Pathologic M stage (M1 vs. M0) | 508 | 0.484 (0.294–0.797) | 0.004 |
| Pathologic stage (Stage III&Stage IV vs. Stage I&Stage II) | 538 | 0.480 (0.337–0.685) | |
| Gender (Male vs. Female) | 541 | 0.868 (0.609–1.238) | 0.434 |
| Age ( |
541 | 0.882 (0.629–1.235) | 0.465 |
PLCG2, Phospholipase C gamma 2; TNM, T, tumor; N, regional lymph node; M, metastasis; OR, odds ratio.
| Characteristics | Total (N) | OR (95% CI) | p value |
| Pathologic T stage (T2&T3&T4 vs. T1) | 541 | 1.023 (0.730–1.433) | 0.896 |
| Pathologic N stage (N1 vs. N0) | 258 | 2.390 (0.806–7.085) | 0.116 |
| Pathologic M stage (M1 vs. M0) | 508 | 1.635 (1.004–2.663) | 0.048 |
| Pathologic stage (Stage III&Stage IV vs. Stage I&Stage II) | 538 | 1.287 (0.908–1.823) | 0.156 |
| Gender (Male vs. Female) | 541 | 0.787 (0.551–1.122) | 0.186 |
| Age ( |
541 | 0.856 (0.611–1.200) | 0.367 |
CSK, Carboxy-terminal Src kinase; TNM, T, tumor; N, regional lymph node; M, metastasis.
The expression levels of PLCG2 were found to be significantly downregulated in ccRCC. To confirm this observation, WB, qPCR, and IHC were employed to compare the expression levels of PLCG2 between ccRCC tissues and adjacent normal tissues. Both WB and qPCR results indicated a marked reduction in PLCG2 expression in ccRCC tissues (Fig. 2A,B). This finding was further supported by IHC analysis (Fig. 2C). Additionally, we confirmed the downregulation of PLCG2 in ccRCC cell lines compared to normal renal cell lines (Fig. 2D,E). In conclusion, these results collectively validated the downregulation of PLCG2 in ccRCC.
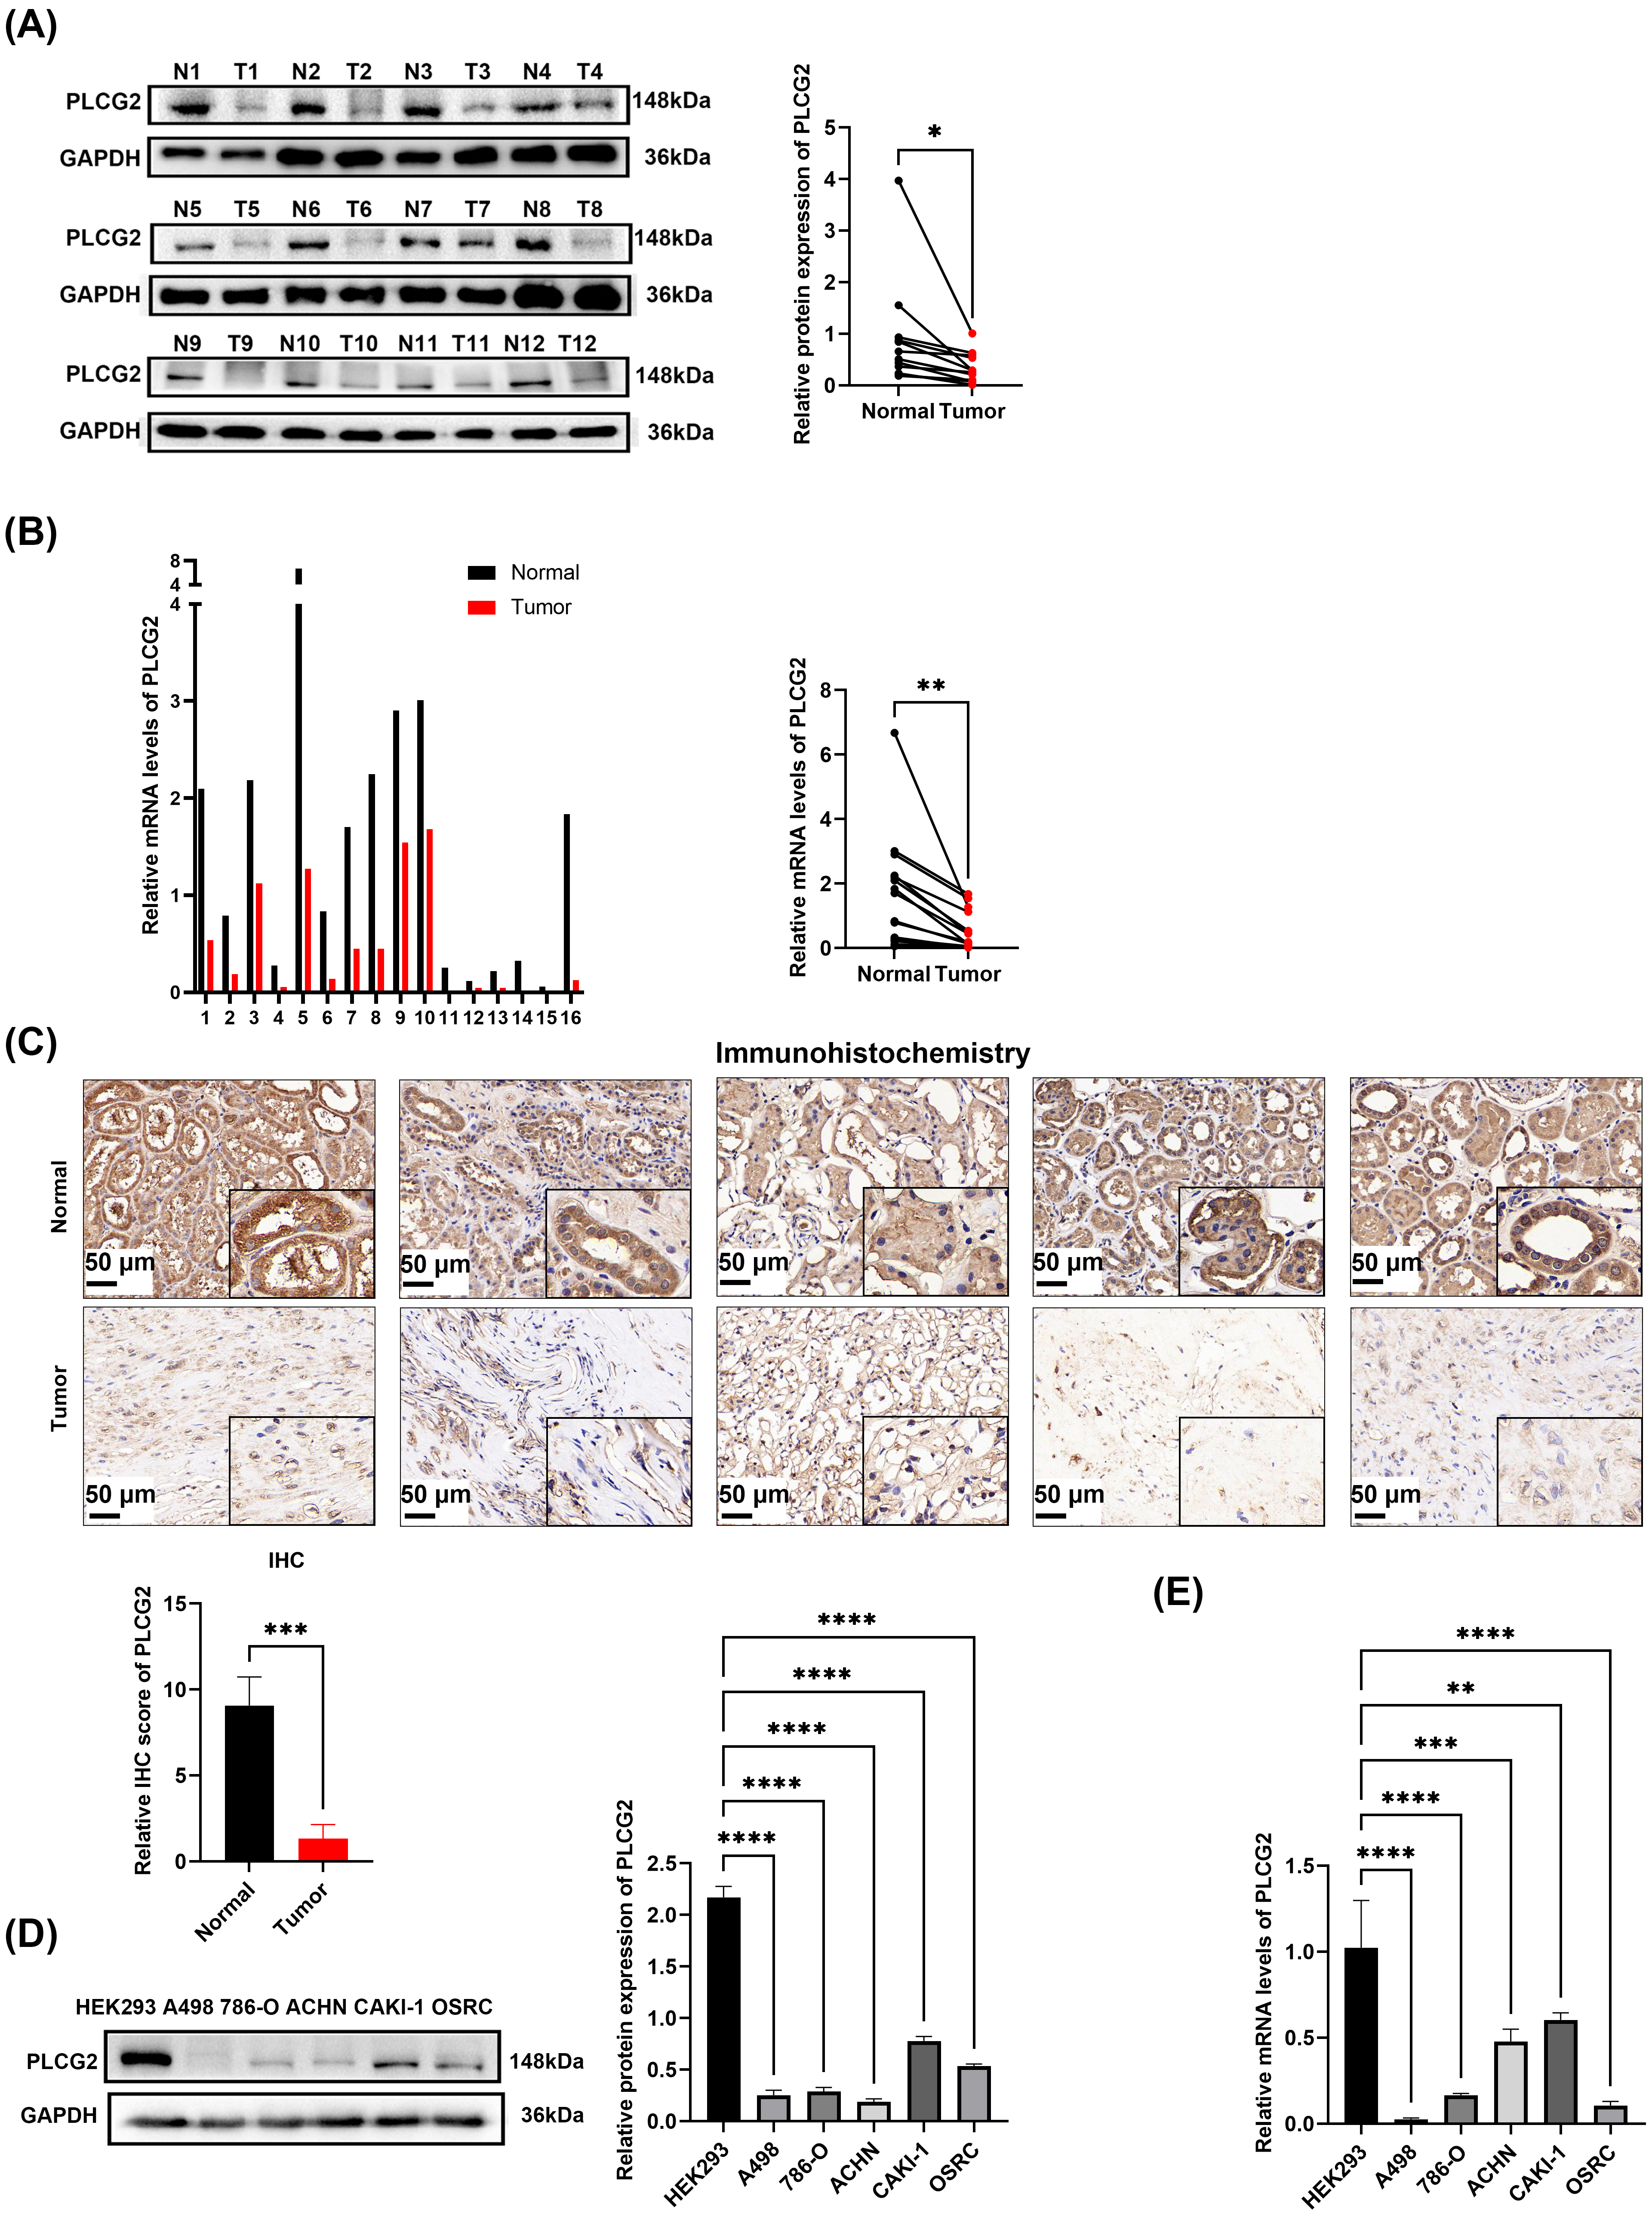 Fig. 2.
PLCG2 was downregulated in ccRCC tissues and cell lines. (A)
The protein expression of PLCG2 in 12 pairs matched normal and cancerous tissues
and the statistical graph of gray value. In this context, N1 represents the
adjacent normal tissue of the first patient, T1 represents the cancerous tissue
of the first patient, and so on. (B) The mRNA levels of PLCG2 in 16
pairs matched normal and cancerous tissues of ccRCC patients and the statistical
graph. (C) The immunohistochemical analyses of 5 pairs matched normal and
cancerous tissues and the statistical graph of IHC score. Scale bar = 50
µm. (D) The protein expression of PLCG2 in ccRCC cell lines (A498, 786-O,
CAKI-1, ACHN, OSRC) and human embryonic kidney cell (HEK293) (n = 3) and
statistical graph of gray value. (E) The mRNA levels of PLCG2 in ccRCC
cell lines (A498, 786-O, CAKI-1, ACHN, OSRC) and HEK293 (n = 3)
(*p
ccRCC cells were transfected with lentivirus to investigate the role PLCG2 played in ccRCC. Using qPCR and Western bolt to confirm the mRNA level’s and protein expression’s upregulation compared with the vector group (Fig. 3A,B). Transwell assays suggested that increased PLCG2 expression reduced the ccRCC cells invasion and migration ability (Fig. 3C). Also, CCK-8 assays indicated that tumor cells reduced the ability of proliferation while the PLCG2 were upregulated in ccRCC cells (Fig. 3D). Lipid accumulation is the most remarkable biological feature of ccRCC. To investigate whether the PLCG2 can effect a change in ccRCC cells’ lipid metabolism, the oil red staining assay was used which showed overexpressing the PLCG2 could reduce lipid accumulation (Fig. 3E). Triglyceride determination showed that PLCG2 reduces the triglyceride content in ccRCC cells (Fig. 3F). The findings clearly demonstrate that overexpression of PLCG2 inhibits proliferation, invasion, migration, and lipid accumulation of ccRCC cells.
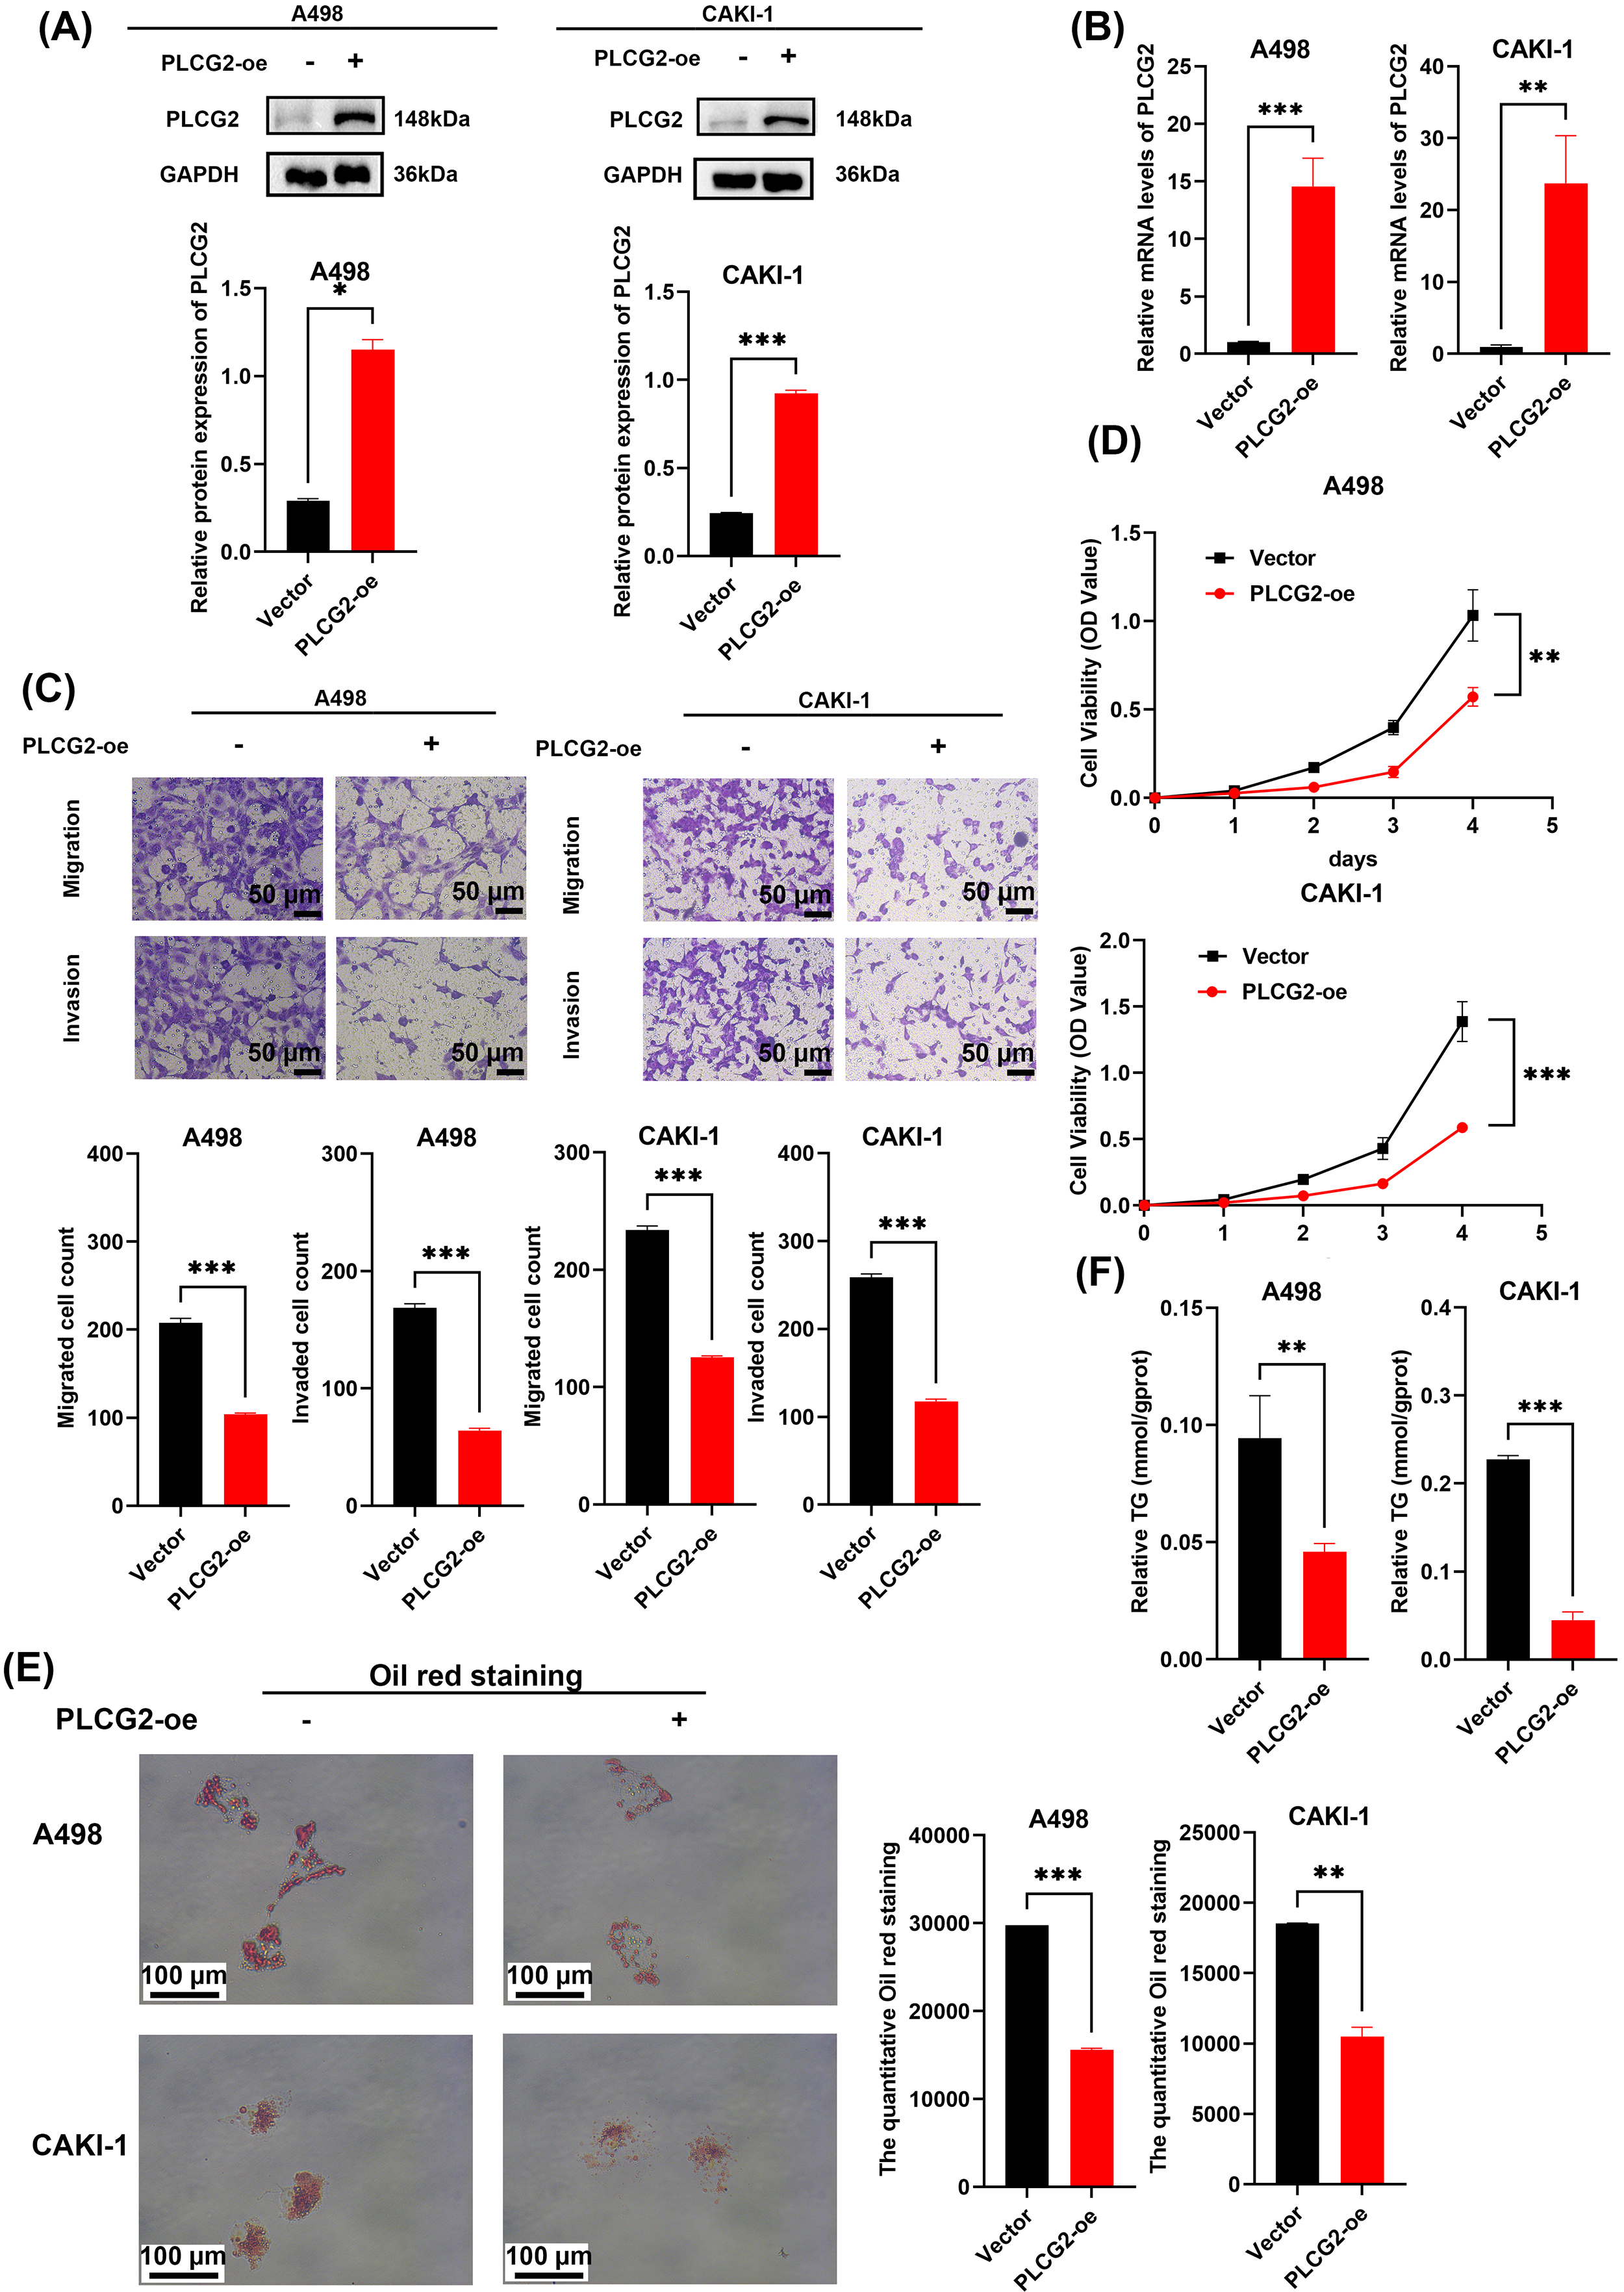 Fig. 3.
Overexpression PLCG2 inhibited cell proliferation, migration,
invasion, and lipid accumulation in ccRCC. (A) Protein expression of A498 and
CAKI-1 cells with transfected PLCG2-overpressed lentivirus (n = 3) and
the statistical graph of gray value. (B) The mRNA levels of A498 and CAKI-1 cells
with transfected PLCG2-overpressed lentivirus (n = 3). (C) The
transwell assays were used to evaluate the migration and invasion ability of A498
and CAKI-1 transfected PLCG2 overexpression and the statistical graph was used to
compare the number of cells between the PLCG2 overexpression group and vector
group (n = 3). Scale bar = 50 µm. (D) Cell proliferation curves of
CCK-8 assays for A498 and CAKI-1 transfected PLCG2 overexpression compared with
the control group (n = 3). (E) The oil red staining of A498 and CAKI-1
transfected PLCG2 overexpression compared with the control group (n = 3)
and the statistical graph of the quantitative oil red staining. Scale bar = 100
µm. (F) The relative TG content in ccRCC cells transfected PLCG2
overexpression compared with the control group (n = 3) (*p
Si-RNAs targeted PLCG2 were used to study the function of PLCG2 knocking down plays in cells. As mentioned before, qPCR and WB were used to verify the decreased expression of PLCG2 in protein and mRNA levels (Fig. 4A and Supplementary Fig. 2A,B). The migration and invasion abilities of A498 and CAKI-1 were promoted by PLCG2 downregulation (Fig. 4B). The promotion of proliferation ability was verified by CCK-8 assays (Fig. 4C). The influence of PLCG2 played in lipid metabolism was verified again by oil red staining assay to compare negative control and PLCG2-downregulated group (Fig. 4D and Supplementary Fig. 2C). Triglyceride determination showed that knocking down the PLCG2 improved the triglyceride content in ccRCC (Fig. 4E). It was proved that knockdown of PLCG2 promoted cell proliferation, migration, invasion, and lipid accumulation in ccRCC.
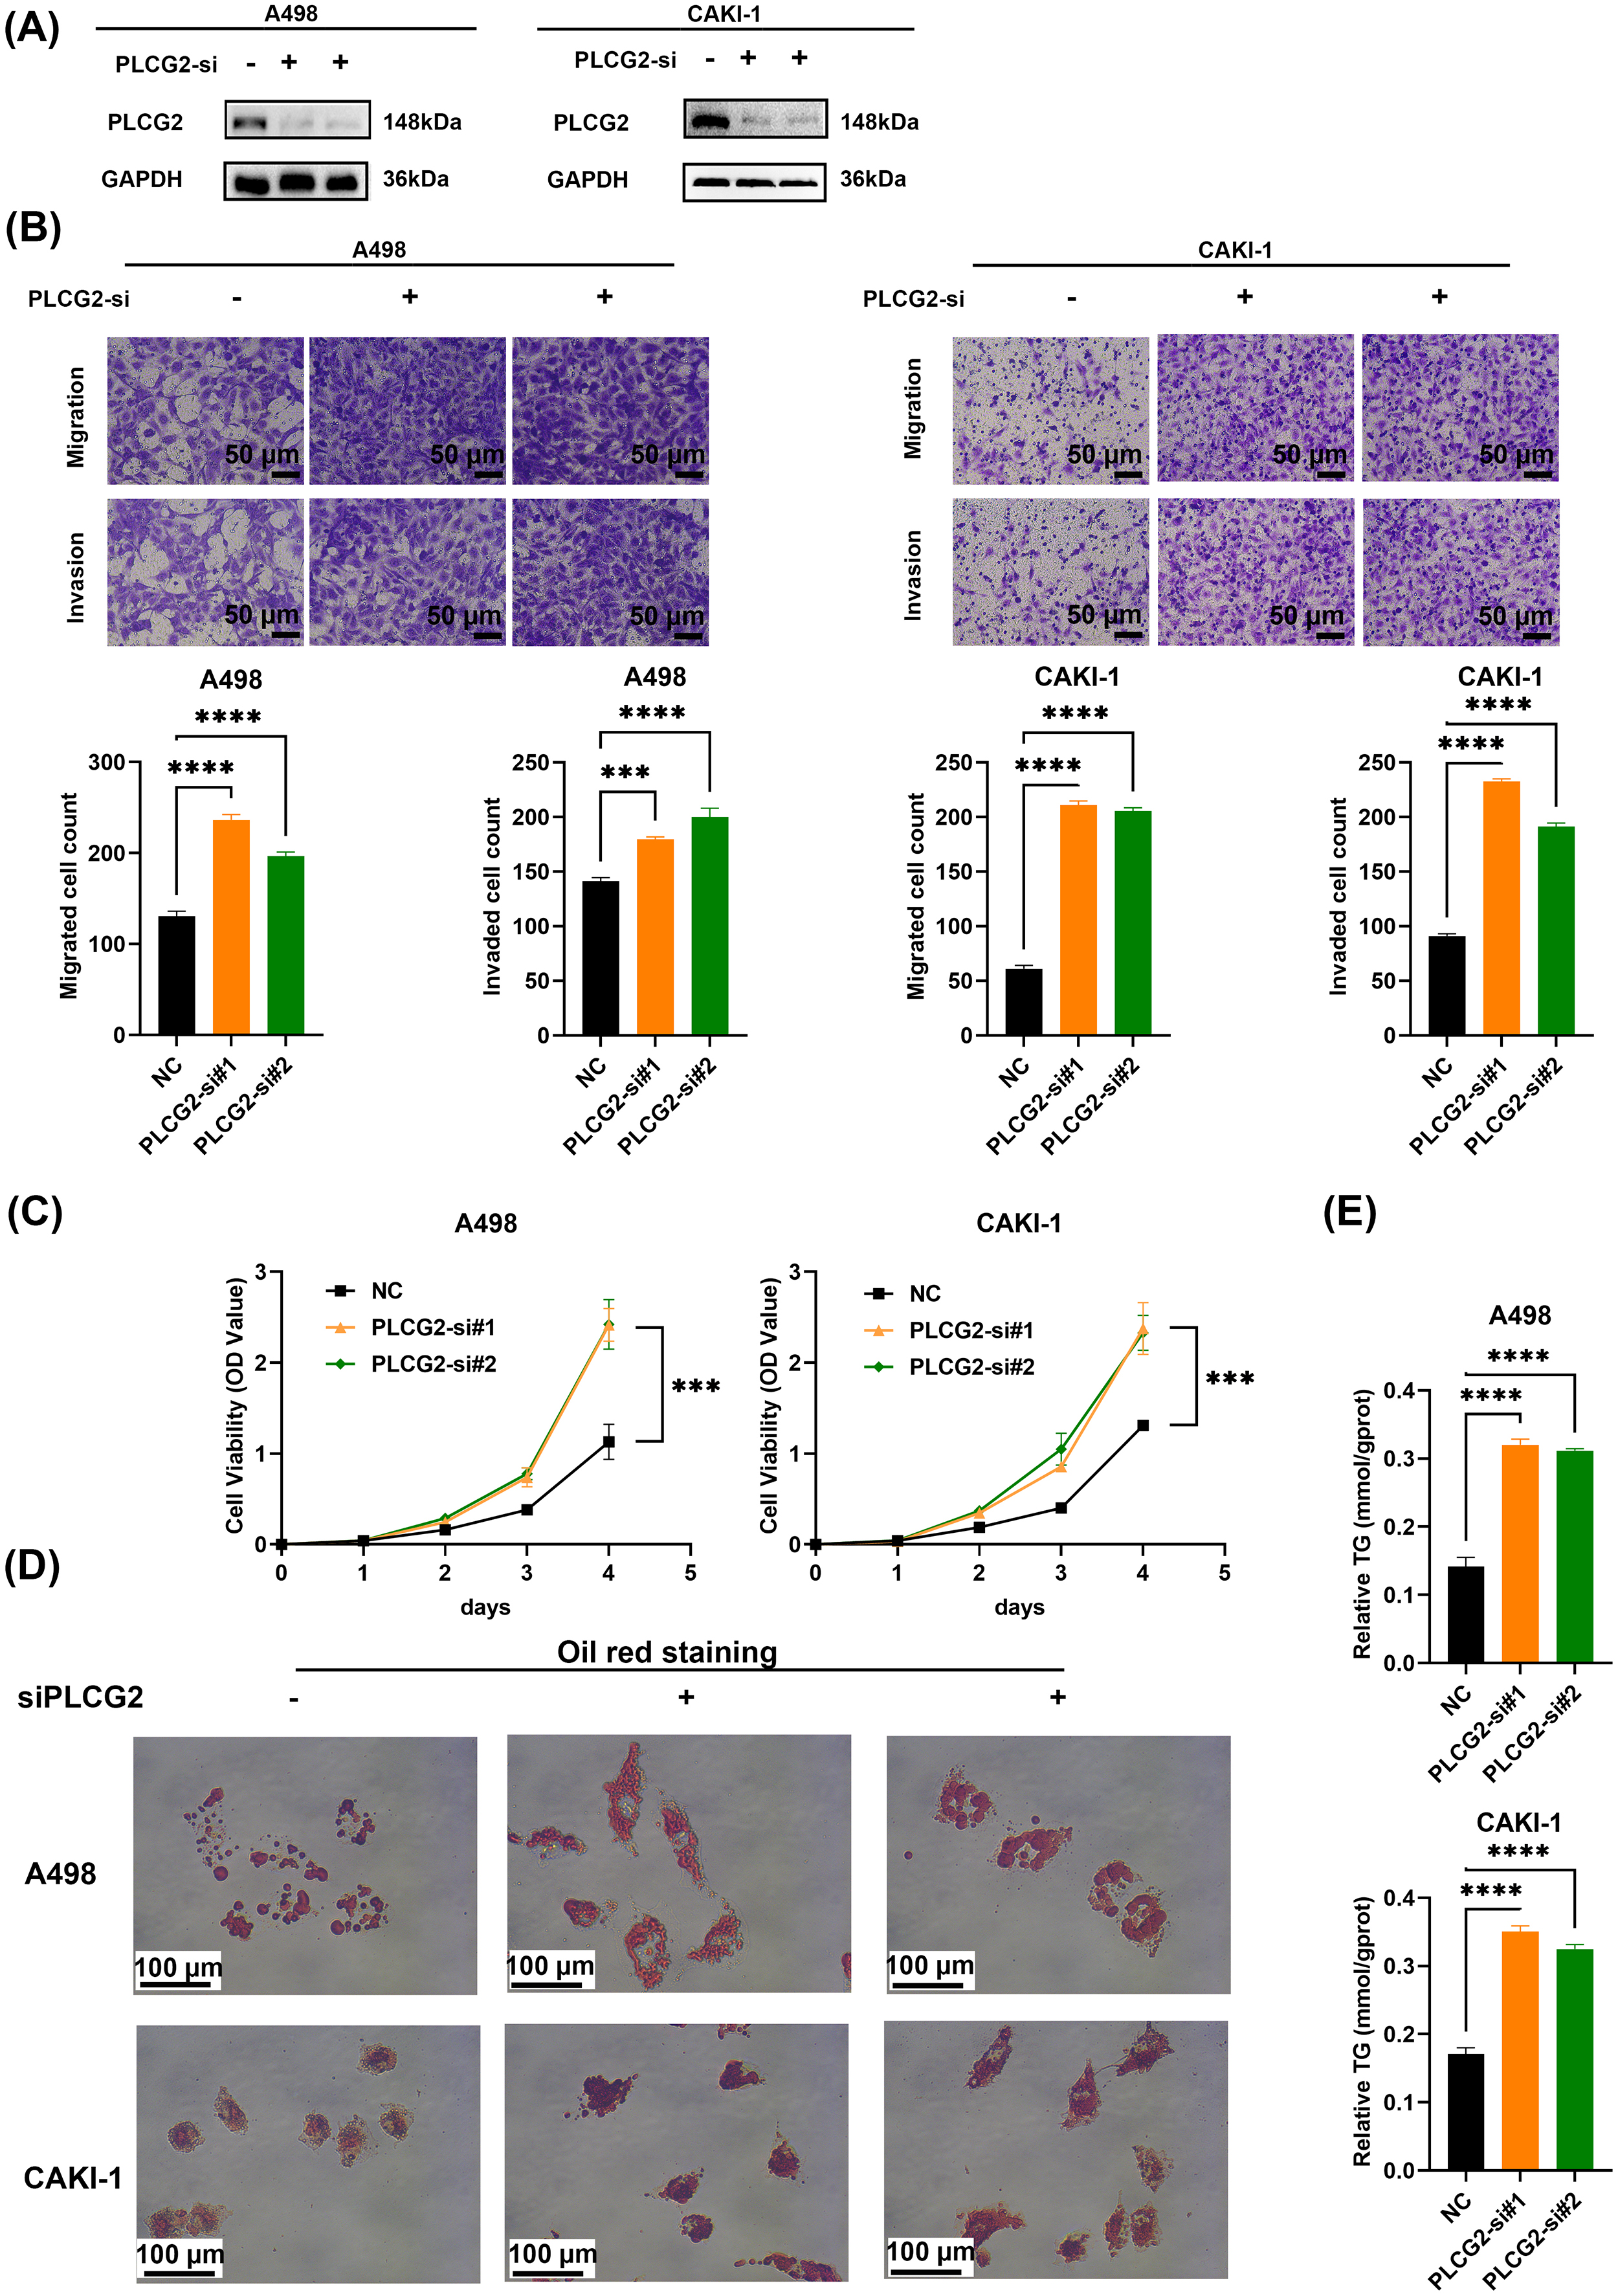 Fig. 4.
Knocking down PLCG2 promoted cell proliferation, migration,
invasion, and lipid accumulation in ccRCC. (A) Protein expression of A498 and
CAKI-1 cells with PLCG2 knockdown (n = 3). (B) The transwell assays were
used to evaluate the migration and invasion ability of ccRCC cells with PLCG2
knockdown. The statistical graph was used to compare the number of cells between
the PLCG2 knockdown group and the control group (n = 3). Scale bar = 50
µm. (C) Cell proliferation curves of CCK-8 assays for A498 and CAKI-1 with
PLCG2 knockdown and the control group (n = 3). (D) The Oil red staining
PLCG2-knockdown group and the negative control group (n = 3). Scale bar
= 100 µm. (E) The relative TG content in the PLCG2-knockdown group and the
negative control group (n = 3) (***p
To dig deep into the correlation between the PLCG2 and the VEGF signaling
pathway, we added the supernatant collected from ccRCC knocking down or
overexpressing the PLCG2 group into the medium of HUVEC. The tube formation
assays in vitro indicated that HUVEC co-culture with supernatant of
PLCG2-overexpressed or PLCG2-knockdown group inhibited or promoted the ability of
angiogenesis, respectively (Fig. 5A,B). The tube length of HUVEC co-cultured with
overexpression PLCG2 was markedly shorter than HUVEC with negative control,
whereas the down-regulated group exhibited the opposite effect
(Supplementary Fig. 3A,B). The findings of Western blot indicate that
PLCG2 may exert an influence on the process of angiogenesis mediated by VEGFA
(Fig. 5C). The results of the ELISA experiment also demonstrated that
overexpression of PLCG2 led to increased levels of VEGFA in the supernatant of
ccRCC cell lines (Supplementary Fig. 3C). Also, CCK-8 assays suggested
that HUVECs co-cultured with the overexpressing PLCG2 group reducing the ability
of proliferation (Fig. 5D). As expected, knocking down group improved the
proliferation of HUVEC (Fig. 5E). In order to determine whether the role of PLCG2
in promoting angiogenesis is related to HIF-2
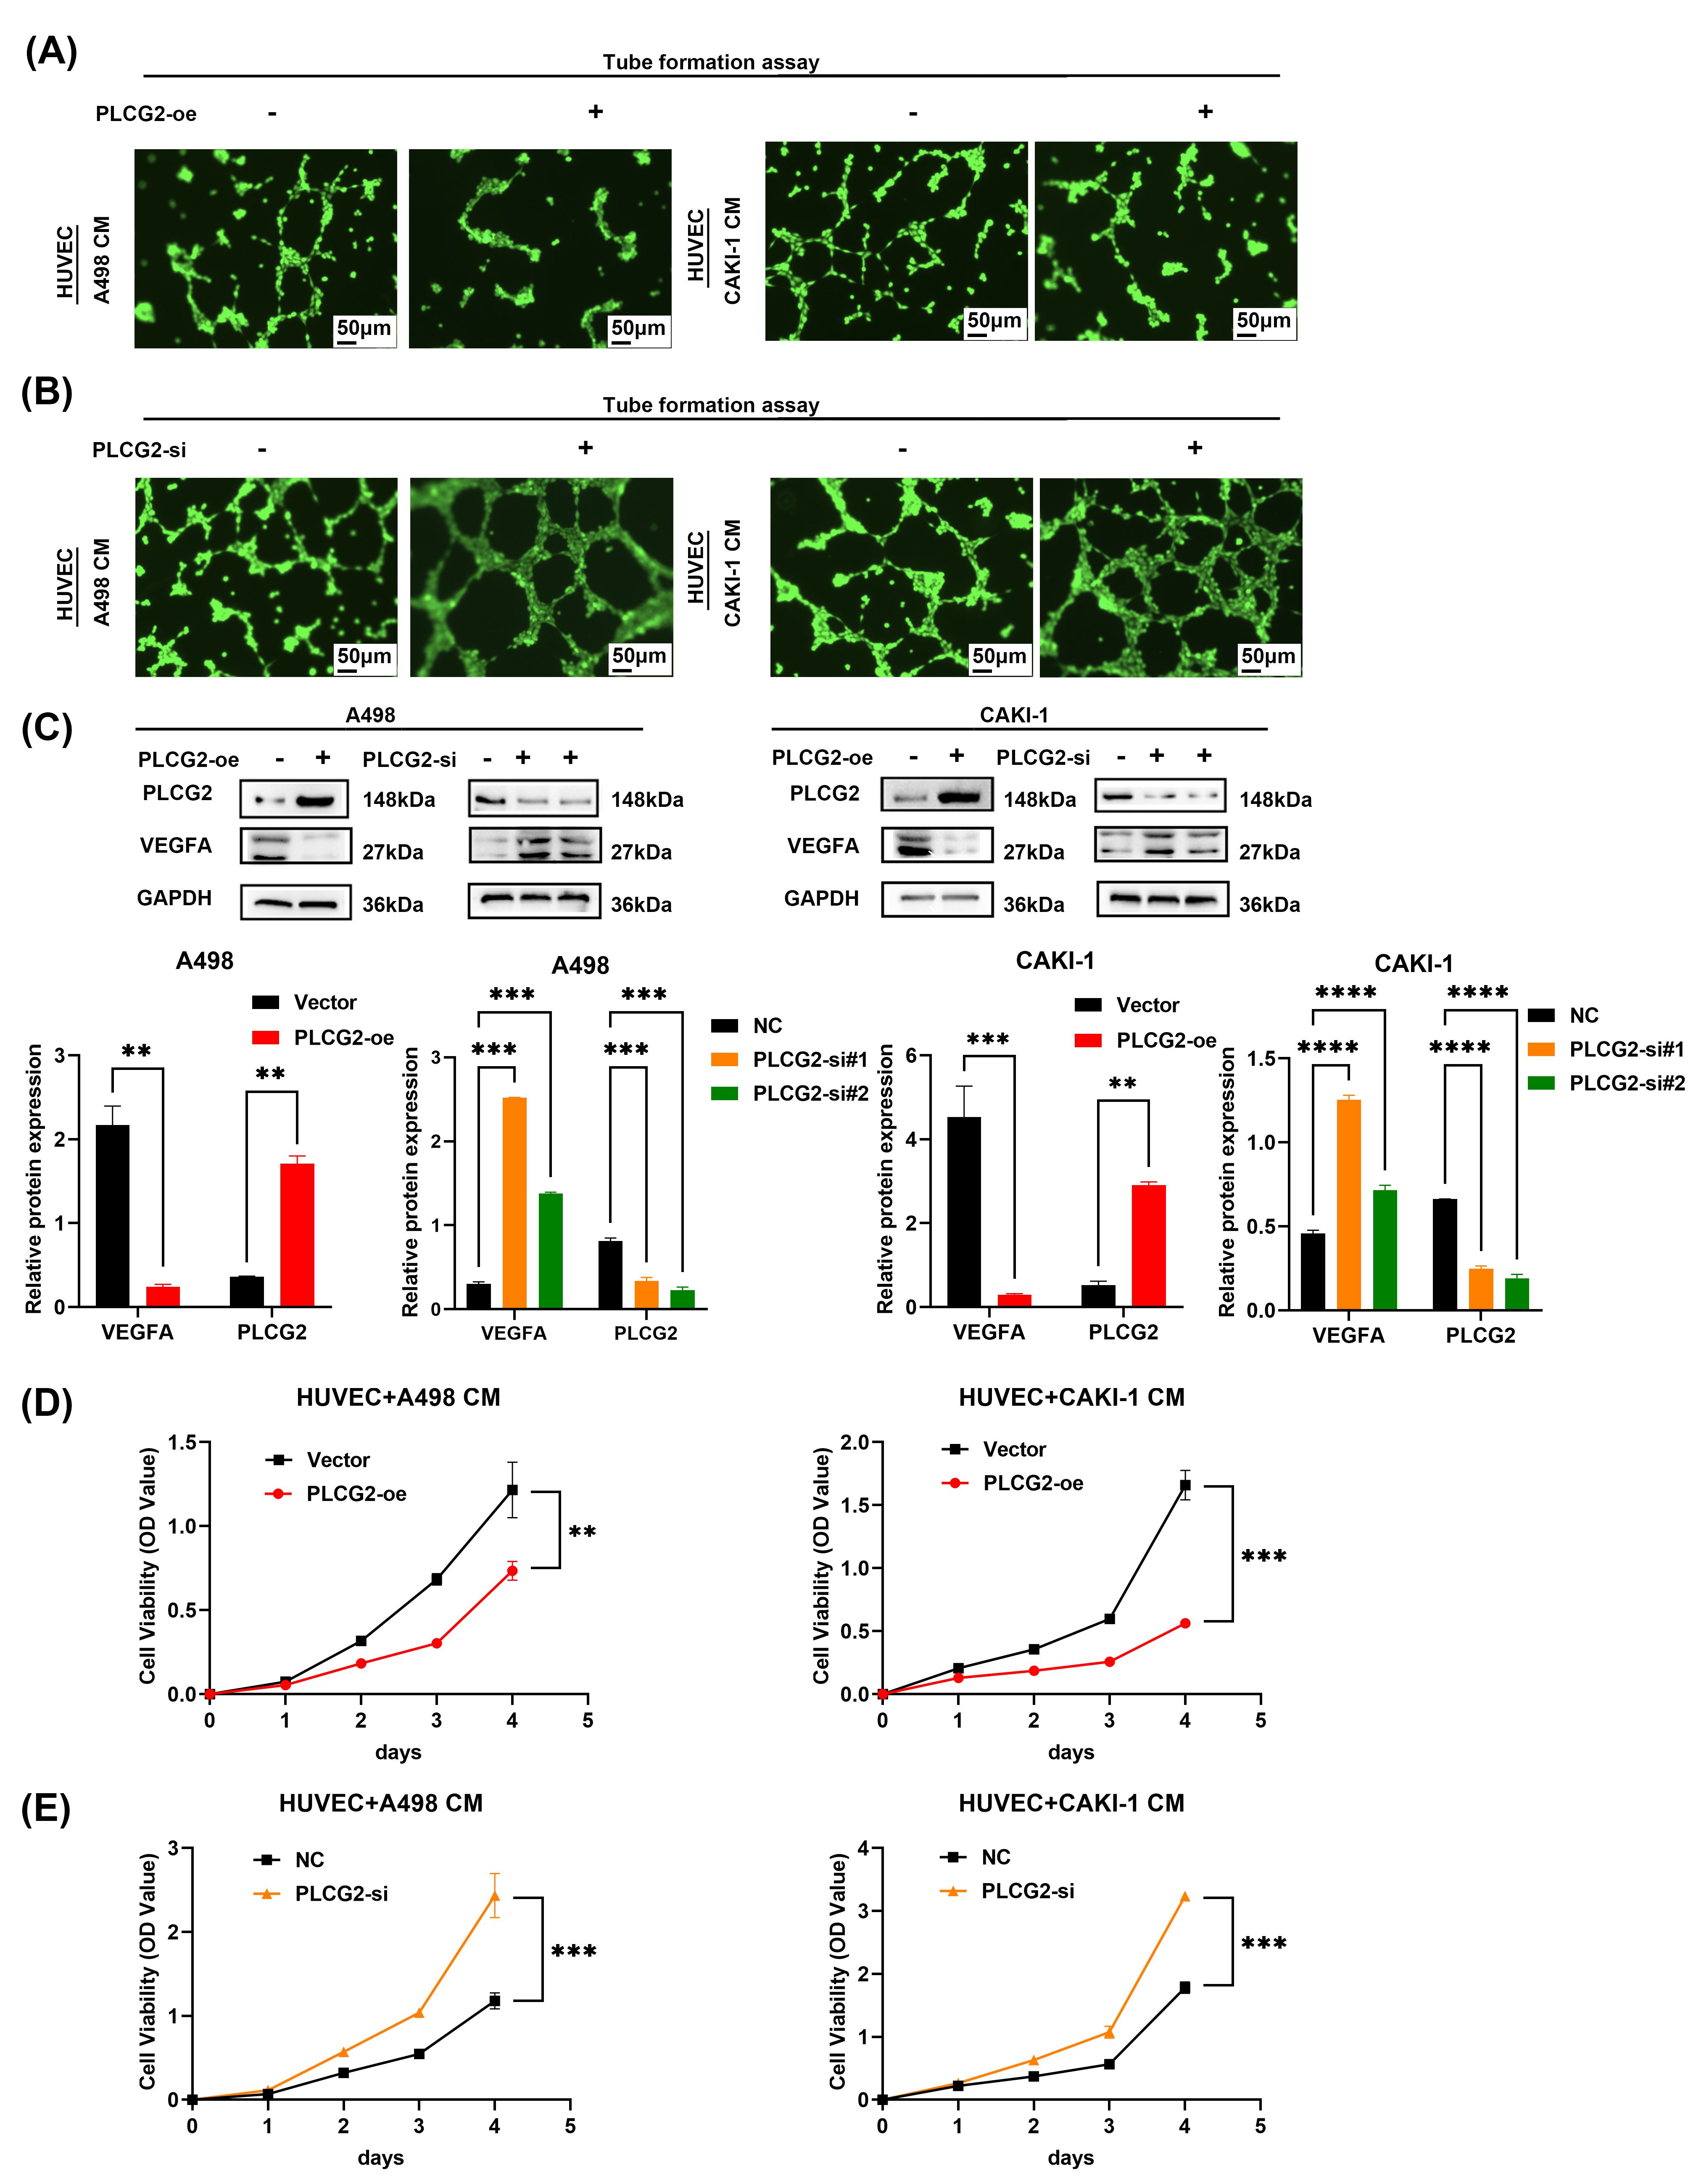 Fig. 5.
PLCG2 played an important role in tumor angiogenesis. (A) The
tube formation assays were used to evaluate the ability of pro-angiogenic ability
of A498 and CAKI-1 transfected PLCG2 overexpression compared with the vector
group (n = 3), scale bar = 50 µm. (B) The tube formation assays were used to evaluate the
ability to inhibit the angiogenic ability of A498 and CAKI-1 transfected PLCG2
knocking down compared with the negative control group (n = 3), scale bar = 50 µm. (C)
Western blot was used to verify the VEGFA protein down-regulated and up-regulated
in PLCG2 overexpression and knockdown group (n = 3) and the statistical
graph of gray value. (D) Cell proliferation curves of CCK-8 assays for HUVEC
cells culturing with the conditioned medium from A498 and CAKI-1 transfected
PLCG2 overexpression compared with the vector group (n = 3). (E) Cell
proliferation curves of CCK-8 assays for HUVEC cells culturing with the
conditioned medium from A498 and CAKI-1 transfected PLCG2 knocking down compared
with the negative control group (n = 3) (**p
Subcutaneous tumor models were used to verify the function of PLCG2 in vivo (Fig. 6A), and the results of tumor weight and triglyceride determination verified overexpression PLCG2 inhibited tumor proliferation and lipid accumulation in vivo (Fig. 6B,C). The tumor growth curve showed that PLCG2 reduced the tumor growth (Fig. 6D). And the live small animals fluorescent imaging assays were used to evaluate the proliferation and invasion capabilities of ccRCC in vivo (Fig. 6E,F). The findings aligned with the cell experiment. The PLCG2 overexpression group had a smaller range of ccRCC cell metastasis and invasion than the negative control group. These observations confirmed that the function of PLCG2 is to inhibit tumor growth in vivo.
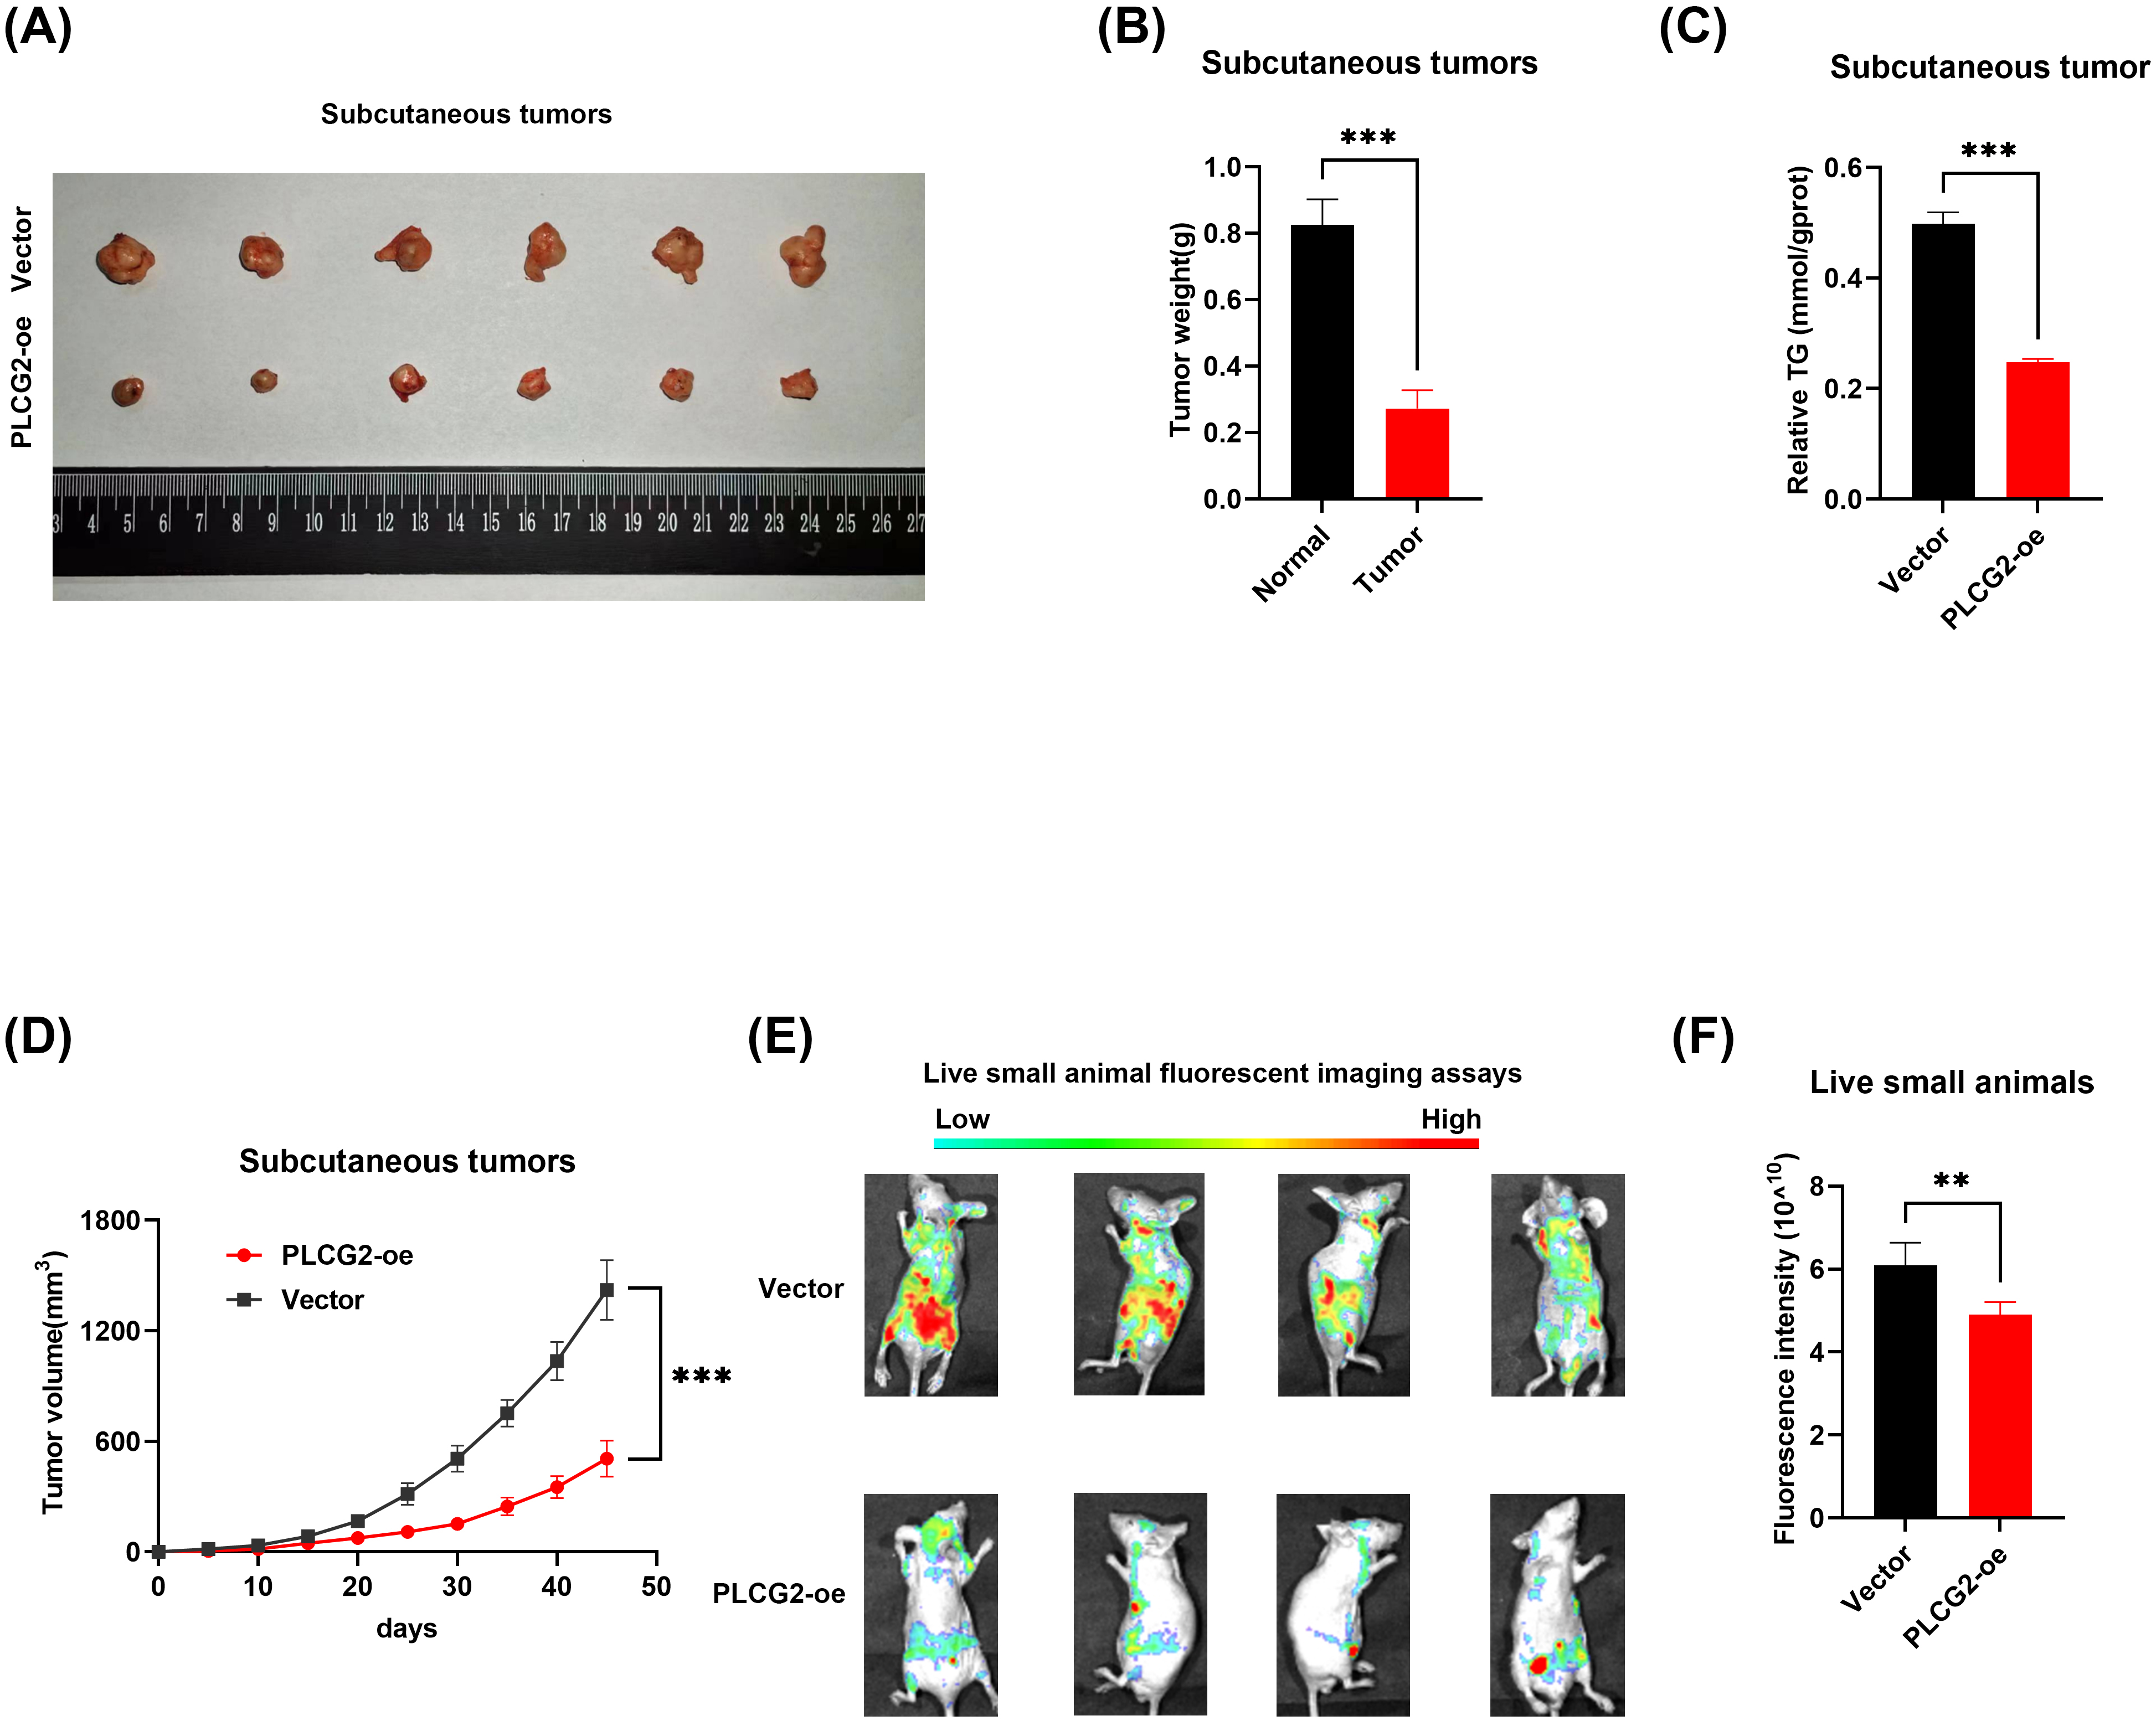 Fig. 6.
The PLCG2 suppressed tumor progression in vivo. (A)
Subcutaneous tumor model was constructed by overexpressing PLCG2 lentivirus and
negative control cells (n = 6). (B) The statistical graph of tumor
weight of the subcutaneous tumor model (n = 6). (C) The statistical
graph of relative TG content in subcutaneous tumors (n = 6). (D) Growth
curve of subcutaneous tumor (n = 6). (E) Small animal living
fluorescence images of the vector and overexpression PLCG2 group in the
metastasis model (n = 3). (F) Fluorescence intensity statistical graph
of small animal living fluorescence assays (n = 3) (**p
In recent years, studies have demonstrated that monotherapy targeting ccRCC angiogenesis yields limited efficacy, while combination chemotherapy inflicts unimaginable suffering upon patients [20, 21]. Therefore, it is of paramount importance to identify a dual-targeting strategy capable of inhibiting both angiogenesis and the proliferative capacity of ccRCC itself.
The PLC family plays a crucial role in catalyzing the transformation of 1-phosphatidyl-1D-myo-inositol 4,5-bisphosphate (PIP2) to inositol 1,4,5-trisphosphate (IP3) and diacylglycerol (DAG) [22]. Previous study suggested that PLCG2 was implicated as a risk factor in Alzheimer’s disease and could be therapeutically targeted [23]. Study [24] has shown that in Alzheimer’s disease, the Triggering Receptor Expressed on Myeloid Cells 2 (TREM2) depends on PLCG2 activity to regulate the expression of lipid metabolism-related genes in microglia. Cells with PLCG2 knockout tend to accumulate cholesterol and sphingolipids after sphingomyelin treatment [24]. This underscores the role of PLCG2 in regulating lipid metabolism. Additionally, aberrant lipid metabolism is a significant characteristic of renal cancer. We have discovered that PLCG2 can modulate lipid metabolism in renal cancer cell lines, but the specific mechanisms remain unexplored. This could be a direction for future experiments. Furthermore, there was report on the correlation between PLCG2 and Bruton tyrosine kinase resistance in chronic lymphocytic leukemia [25]. On the other hand, in patients with ankylosing spondylitis (AS), there is a significant differential expression of PLCG2, with notably high levels of PLCG2 in peripheral blood. A further study has found that high PLCG2 expression may be associated with a significant increase in CD4-positive T cells and monocytes in AS patients [26]. Study on soft tissue sarcoma (STS) has also demonstrated that PLCG2 is a key gene associated with STS immunity. High expression of PLCG2 is positively correlated with CD8+ T cells, M1 macrophages, and monocytes, indicating that PLCG2 may be a potential prognostic marker for STS patients [27]. Renal cancer patients also exhibit significant immune infiltration. Immunotherapy for RCC is diverse and includes cytokine therapy, cell therapy, and vaccine therapy. Among these, the use of immune checkpoint inhibitors has been a recent focus and has shown promising results. Therefore, immunotherapy for RCC holds great potential for the future [28]. PLCG2 exhibits strong immune relevance, and immunotherapy for ccRCC has proven to be highly effective. Discovering the regulatory role of PLCG2 in ccRCC immunity could potentially have a significant impact on the treatment of ccRCC. Unfortunately, such studies are rare, which may become one of our key focus areas in future research., thereby providing a novel target for ccRCC treatment. Moreover, PLCG2 has a significant impact on lipid levels in ccRCC. While there are many reports on the association between lipids and VEGFA, in-depth mechanistic studies remain scarce. Research indicates that VEGFA might elevate lipid levels by inhibiting LPL activity [29]. In mouse models, VEGFA overexpression can lead to the accumulation of TG in large very-low-density lipoprotein (VLDL) particles [30]. Furthermore, VEGFA serves as a biomarker for obesity, but clinical trials have not demonstrated that a reduction in blood lipids in obese individuals necessarily correlates with a significant decrease in VEGFA [29]. Therefore, the relationship between VEGFA and lipids requires further investigation to determine whether it is a contributing factor to lipid abnormalities in ccRCC.
Angiogenesis is the process of neovascularization from capillaries, ultimately forming a comprehensive network of blood vessels [31]. Similar to other physiological processes, it can be distinguished between physiological and pathological angiogenesis. However, most blood vessels remain quiescent in adulthood [32]. Angiogenesis serves as a hallmark of cancer, not causing malignancy but promoting its metastatic potential [33]. It contributes to the progression of RCC [34], non-small cell lung carcinoma, colorectal cancer, breast cancer, and various other cancers [31]. Under normal circumstances, pro-angiogenic and anti-angiogenic factors maintain a delicate balance. When local oxygen demands surpass supply (commonly occurring when tumor diameter reaches 1–2 mm), hypoxia triggers the activation of angiogenesis. Sunitinib, a renowned tyrosine kinase inhibitor targeting pro-angiogenic growth factor receptors, aids in improving overall survival for ccRCC patients. Nevertheless, drug tolerance issues continue to pose threats to patients’ well-being. The disease progresses in over 70% of patients following administration of first-line treatment [35]. Therefore, addressing drug tolerance or identifying novel targets for inhibiting angiogenesis becomes particularly crucial. Combining with other drugs may be a good option. Study has shown that combining with Decitabine can enhance Sorafenib sensitivity [36]. Additionally, why anti-VEGF drugs fail to exhibit efficacy as monotherapy remains an unanswered question [32]. However, they do demonstrate effectiveness in rodent models.
The main factors promoting tumor angiogenesis include VEGFA, platelet-derived growth factor B, angiotensin, and axon-guidance molecules [37]. The VEGF family consists of 7 members [38] with VEGFA being an indispensable component in angiogenesis. The deletion of a single VEGFA allele leads to embryonic lethality, highlighting the crucial role played by VEGFA in angiogenesis. As a cytokine, VEGFA not only affects angiogenesis but also influences coagulation function, macrophage recruitment, cell homeostasis maintenance, hematopoietic stem cell survival support, and tumor cell survival promotion [31]. VEGFR is a tyrosine kinase receptor. While VEGFR-1 (FLT1) acts as a negative regulator by controlling the levels of VEGFA in the blood, it can also act as a pro-tumor factor in certain cancers. Current drug therapies targeting angiogenesis primarily focus on endothelial cells, parietal cells, stromal cells as well as hematopoietic cells and tumor cells [32]. Among them, monoclonal antibodies targeting the VEGF pathway are extensively employed for this purpose [31].
The enrichment analysis results suggest that PLCG2 may exert its function
through the mitogen-activated protein kinase (MAPK) signaling pathway, which
predominantly encompasses extracellular signal-regulated kinase (ERK)/MAPK, Jun
N-terminal kinase (JNK)/MAPK, and p38/MAPK. The JNK/MAPK pathway targets the
transcription factor AP1, which plays a role in carcinogenic affection [39].
Interestingly, JNK1 and JNK2 exhibit distinct roles in tumor proliferation. While
Jun expression can be stabilized and phosphorylated by JNK1, it undergoes
degradation by JNK2. Transcription factors regulated by the p38/MAPK signaling
pathway include p53 and Activating Transcription Factor 2 (ATF2) among others.
Although p38
Our study has certain limitations. If RNA-seq is employed to compare the vector with the overexpressed PLCG2 group, it will provide additional insights into the function of PLCG2 and enhance the correlation between the VEGF signaling pathway and PLCG2. Although Western blot, tube formation assays, and ELISA are utilized for exploring the potential impact of PLCG2, in vivo verification is not conducted. While our conclusions are supported by both cell culture and animal model experiments, the underlying mechanism through which PLCG2 influences ccRCC proliferation remains unexplored. These unresolved issues can serve as key focal points for future research.
The results from the integration of bioinformatic analysis and experimental research demonstrate that PLCG2 exhibits low expression in ccRCC and is associated with patient prognosis. As a tumor suppressor gene, PLCG2 inhibits tumor proliferation, metastasis, and potentially angiogenesis by modulating the expression of VEGFA. Moreover, PLCG2 may influence the proliferative capacity of renal cancer itself through MAPK signaling pathways. Targeting PLCG2 can be a promising strategy for inhibiting both angiogenesis and the progression of renal cancer.
The datasets used and analyzed during the current study are available from the corresponding author on reasonable request.
ZYX and XPZ designed and conducted all experiments in this study, while CYZ, DJM, DYT, JS, and QYL actively participated in the experimental procedures, data analysis, and sample collection. The manuscript was edited by CYZ and XPZ. All authors contributed to editorial changes in the manuscript. All authors read and approved the final manuscript. All authors have significantly contributed to this work and agreed to be accountable for all its aspects.
Written informed consent was obtained from each patient or their families/legal guardians for the collection of tissue samples, and ethical approval for this study was granted by Huazhong University of Science and Technology Ethics Committee (IEC-072). Additionally, all animal experiments conducted in this research received approval from the Institutional Animal Use and Care Committee at Tongji Medical College (IACUC Number: 3693).
Not applicable.
This study was supported by National Natural Science Foundation of China (82202911, 82300786), Hubei Provincial Natural Science Foundation Projects (2024AFB640) and Wuhan Yingcai (02.05.22030029).
The authors declare no conflict of interest.
Supplementary material associated with this article can be found, in the online version, at https://doi.org/10.31083/j.fbl2911390.
References
Publisher’s Note: IMR Press stays neutral with regard to jurisdictional claims in published maps and institutional affiliations.