


 , Linfei Luo 1,†, Zhengqiang Wu 1, Lijun Wan 1, Fan Li 1, Zhili Wen 1,*
1 Department of Gastroenterology, Second Affiliated Hospital of Nanchang University, 330006 Nanchang, Jiangxi, China
†These authors contributed equally.
Abstract
Macrophage polarization is involved in the development of ulcerative colitis (UC). This study investigated the mechanism by which high mobility group box-1 protein (HMGB1) regulates macrophage polarization through metabolic reprogramming, thereby contributing to the pathogenesis of UC.
Dextran sulfate sodium (DSS) was used to induce colitis in mice. RAW264.7 cells were polarized to M1 or M2 macrophages in vitro by stimulating with lipopolysaccharide (LPS)/interferon-γ (IFN-γ) or Interleukin-4 (IL-4), respectively. Macrophage infiltration and distribution within colon tissue were assessed by immunohistochemistry and flow cytometry. Glycolysis, fatty acid oxidation (FAO), and inflammatory factors were evaluated using relevant reagent kits. Chromatin Immunoprecipitation (ChIP) and luciferase reporter experiments were performed to study the regulation of Carnitine palmitoyltransferase 1A (Cpt1a) promoter transcriptional activity by HMGB1.
The mouse UC model showed upregulated HMGB1 and increased macrophage infiltration. Overexpression of HMGB1 promoted M1 macrophage polarization, increased glycolysis, and reduced FAO, whereas knockdown of HMGB1 promoted M2 macrophage polarization, reduced glycolysis, and increased FAO. HMGB1 negatively regulated Cpt1a expression by inhibiting transcription of the Cpt1a promoter. Knockdown of Cpt1a reversed the effects of small interfering RNA targeting HMGB1 (si-HMGB1) on macrophage metabolism and polarization. Administration of adeno-associated virus (AAV)-shHMGB1 in vivo caused a reduction in UC symptoms and inflammation.
HMGB1 modulates macrophage metabolism in UC by inhibiting Cpt1a expression, leading to increased M1 polarization. This provides a theoretical basis for the clinical application of HMGB1 inhibitors in the treatment of UC.
Keywords
- ulcerative colitis
- HMGB1
- macrophage polarization
- cell metabolism
- Cpt1a
Ulcerative colitis (UC) is a chronic inflammatory disorder [1]. The worldwide incidence of UC was estimated to be approximately 5 million cases in 2023 [2], with an increased prevalence in China in recent years [3]. The development of effective treatments for UC has therefore become an important medical priority, and more basic research is urgently needed to explore the pathogenesis of this disease.
Numerous studies have indicated that macrophages play a crucial role in the pathogenesis of UC [4]. These cells can switch between M1 and M2 activation states in response to different environmental cues. M1 macrophages fight bacteria and promote inflammation, while M2 macrophages reduce inflammation and assist tissue repair [5]. Clinical study have found abnormal M1 phenotype polarization in colon lesions of UC patients, suggesting that modulation of intestinal macrophage polarization may be a promising strategy for the treatment of UC [6].
High mobility group box-1 protein (HMGB1) is a highly conserved chromosomal protein that has various functions depending on its subcellular localization [7]. Intracellular HMGB1 is involved in maintaining nucleosome dynamics, ensuring chromosome stability, and participating in DNA repair and telomere maintenance. Extracellular HMGB1 on the other hand can interact with multiple receptors and functions as a cytokine and chemokine to modulate inflammation and immunity [8]. HMGB1, identified as a significant mediator of late-stage inflammation, was initially linked to the onset, progression, and evolution of sepsis [9]. Elevated HMGB1 expression in acute pancreatitis indicates a poor prognosis [10]. Patients with ankylosing spondylitis exhibit heightened serum HMGB1 levels, which are positively associated with disease activity [11]. HMGB1 is also involved in the pathogenesis of inflammatory bowel disease and is a sensitive marker of intestinal inflammation [12]. Several studies have reported that HMGB1 is abnormally expressed in UC patients [13, 14] and in mice with dextran sulfate sodium (DSS)-induced UC [15]. High expression of HMGB1 was shown to induce macrophage M1 polarization [16], whereas knockdown of HMGB1 can reduce M1 polarization and promote M2 polarization [17]. Classical M1 macrophages rely predominantly on glycolysis [18], whereas M2 macrophages require the induction of fatty acid oxidation (FAO) [19]. The metabolic characteristics of macrophages are strongly associated with their phenotype and immune function. A recent research study indicates extracellular secretion of HMGB1 from gastric cancer cells regulates neutrophil glucose metabolism reprogramming, thereby mediating neutrophil N2 polarization [20]. We speculated that HMGB1 may regulate macrophage polarization by affecting macrophage metabolism reprogramming.
Carnitine palmitoyltransferase 1A (Cpt1a, also referred to as Cpt1) is one of
the key enzymes involved in the oxidation of
This research was approved by the Ethics Committee of the
Nanchang University (Approval No. NCULAE-20221031185). BALB/C mice were procured
from Cavens Laboratory Animal Co., Ltd. (Changzhou, China) and maintained in a
germ-free facility at the Animal Laboratory Center for Nanchang University. The
mice were housed in a controlled environment with a temperature of 23
The colon specimens were fixed in 4% paraformaldehyde for 12 h, followed by dehydration, paraffin embedding, sectioning (3 µm), and staining with an H&E staining kit (Beijing Solaibao Technology Co., Ltd., Beijing, China). Subsequently, images were captured using an optical microscope.
Dewaxed and rehydrated slides of colon tissue were blocked for endogenous peroxidase activity using an H2O2 solution post-antigen retrieval, followed by blocking for 30 min with 10% normal goat serum. Tissue sections were then exposed to anti-F4/80 (ab300421, Abcam, Cambridge, MA, USA) or anti-HMGB1 (ab79823, Abcam, Cambridge, MA, USA) overnight at 4 °C, and subsequently incubated with secondary antibody (S0001/2, Affinity, Cincinnati, OH, USA) at 37 °C for 60 min. After 3,3’-diaminobenzidine (DAB) staining for 5 min, hematoxylin counterstaining was performed before dehydration. Imaging was conducted using an optical microscope (BX63, Olympus, Tokyo, Japan).
Mice were euthanized post-experimentation under anesthesia. Serum was collected
from blood after centrifugation at 3000 rpm for 15 min and the levels of tumor
necrosis factor
Colon tissues were collected, diced, enzymatically digested, filtered, purified, and centrifuged to isolate individual cells. These were stained with specific antibodies including PerCP-Cy5.5 rat anti-CD11b (550993, BD, New York, NY, USA), fluorescein Isothiocyanate (FITC)-leukocyte common antigen (CD45) (553080, BD, New York, NY, USA), APC-iNOS (696807, BioLegend, San Diego, CA, USA), PE-CD206 (568273, BD, New York, NY, USA), and BV421-F4/80 (554722, BD, New York, NY, USA) at the recommended dilutions for 30 min at 4 °C in the dark. The single cell suspensions were then analyzed using flow cytometry (CytoFLEX S, Beckman Coulter, Brea, CA, USA) and FlowJo LLC software (Ver.10, Ashland, OR, USA), and the percentages of macrophages (CD45+F4/80+), M1-macrophages (CD45+F4/80+iNOS+) and M2-macrophages (CD45+F4/80+CD206+) were quantified.
All cell lines were validated by STR profiling and tested negative for mycoplasma. Cells were all cultured in a humidified incubator at 37 °C and 5% CO2. RAW264.7 cells (YS1879C, Shanghai Yaji Biotechnology Co., Ltd., Shanghai, China)
were cultured in DMEM medium (PM150210B, Wuhan Pricella Biotechnology Co., Ltd.,
Wuhan, China) supplemented with 10% FBS, 100 U/mL penicillin and streptomycin in
disposable plastic cell culture flasks at 37 °C with 5% CO2. To
investigate the effect of HMGB1 on macrophage polarization, cells were divided
into four groups: overexpression negative control (NC), HMGB1, small interfering
RNA targeing negative control (si-NC), and si-HMGB1. The first two groups were
polarized into M2 macrophages using 50 ng/mL IL-4 (90105ES08, YEASEN
Biotechnology, Shanghai, China), while the latter two groups were polarized into
M1 macrophages using 100 ng/mL interferon-
Small interfering RNA (siRNA) that targeted HMGB1 and Cpt1a, as well as their corresponding negative controls, were obtained from GenePharma (Shanghai, China). Transfection was conducted using Lipofectamine 3000 (Invitrogen, Carlsbad, CA, USA).
Total RNA was extracted from cells using TRIzol reagent (15596026CN, Invitrogen, Carlsbad, CA, USA). The mRNA expression levels for inducible nitric oxide synthase (iNOS),
Arginase 1 (Arg-1) and Carnitine palmitoyltransferase 1A (Cpt1a) were quantified
with a SweScript One-Step RT-PCR Kit (G3335-100, Servicebio, Wuhan, China), as
per the manufacturer’s instructions.
| Gene (mouse) | Primer sequences (5 |
| iNOS-F | GTTTACCATGAGGCTGAAATCC |
| iNOS-R | CCTCTTGTCTTTGACCCAGTAG |
| Arg-1-F | ACATTGGCTTGCGAGACGTA |
| Arg-1-R | ATCACCTTGCCAATCCCCAG |
| Cpt1a-F | GATTCTGTGCGGCCCTTATTG |
| Cpt1a-R | TCTCTTTGCCTGGGATGCGTG |
| CCACTGCCGCATCCTCTTCC | |
| CTCGTTGCCAATAGTGATGACCTG |
Cpt1a, Carnitine palmitoyltransferase 1A; iNOS, Inducible nitric oxide synthase; Arg-1, Arginase 1.
Cellular proteins were extracted and quantified using a BCA kit (E112, Vazyme, Nanjing, China). Subsequently, the proteins were separated by Sodium dodecyl sulfate polyacrylamide gel electrophoresis (SDS-PAGE) and then transferred onto Polyvinylidene Fluoride (PVDF) membranes (IPVH00010, Immobilon, Millipore Co., Bedford, MA, USA). Following blocking, the membranes were incubated overnight at 4 °C with primary antibodies against iNOS (1:1000, 18985-1-AP, ProteinTech Group, Chicago, IL, USA), Arg-1 (1:5000, 16001-1-AP, ProteinTech Group, Chicago, IL, USA), Cpt1a (1:10,000, 15184-1-AP, Proteintech), and glyceraldehyde-3-phosphate dehydrogenase (GAPDH). After washing, horseradish peroxidase (HRP)-conjugated Immunoglobulin G (IgG) secondary antibodies were then applied for 2 h at 37 °C. Protein detection was performed using an enhanced chemiluminescence kit (BL523A, Biosharp, Shanghai, China), and Band Scan software (ImageJ, National Institutes of Health, Bethesda, MD, USA) was used to analyze the optical density of bands.
Cellular glycolysis activity was assessed using a glycolysis assay kit (ab197244, Abcam, Cambridge, MA, USA). Briefly, harvested cells were pelleted and the supernatant discarded. Cells were disrupted by ultrasonication at a cell: distilled water ratio of 500:1 to 1000:1, followed by incubation at 95 °C for 10 min. After cooling, the cell lysate was centrifuged and the resulting supernatant collected. A spectrophotometer/plate reader was preheated, and the detection wavelength set at 505 nm for analysis.
The assessment of FAO in cells was performed using a FAO assay kit (BR00001,
AssayGenie, Wuhan, China) according to the manufacturer’s instructions. About
106 cells were resuspended in 50–100 µL of cold
1
The level of acetyl CoA in the cell was assessed using a commercial kit (ab87546, Abcam, Cambridge, MA, USA) according to the manufacturer’s instructions. Fifty µL of standard dilution solution was added to the standard well, and sample adjusted to 50 µL with assay buffer was added to the sample well. The sample adjusted to 50 µL with assay buffer was also added to the background sample well. CoA quencher was added to all wells and incubated for 5 min. Quencher remover (2 µL) was then added to all wells, followed by another 5 min incubation. Reaction mixtures were prepared within the range of the standard curve. Each well received 50 µL of reaction mixture, followed by incubation at 37 °C for 10 min. Measurements were then made using a microporous reader. The acetyl CoA concentration was calculated as Ay/Sv, where Ay is the amount of acetyl CoA in the sample well (pmol), and Sv is the volume of sample added to the well (µL). The molecular weight of acetyl CoA is 809.6 g/mol.
ChIP-PCR was conducted on cell samples in order to assess the binding of HMGB1 to the promoter region of Cpt1a. Cells were first incubated with 1% formaldehyde for 10 min to induce protein-DNA cross-linking. Pre-cleared chromatin was aliquoted equally and subjected to sonication. Immunoprecipitation was then performed using a monoclonal antibody against HMGB1 (MA5-31967, Invitrogen) or with a corresponding IgG isotype control. Subsequently, DNA was purified and prepared for quantitative PCR (qPCR) analysis.
The full-length human Cpt1a promoter (–2000 to +100) and three truncated fragments (–2000 to –1300, –1299 to –600, –599 to +100) were cloned into the pGL3 luciferase reporter vector. These reporter constructs, along with the HMGB1 expression vector, were co-transfected into cells using Lipofectamine 2000 (11668-027, Invitrogen). Luciferase activity was then quantified 48 h post-transfection using the luciferase reporter assay system.
Statistical evaluation was performed utilizing Prism 8 (GraphPad Software,
GraphPad Software, Inc., San Diego, CA, USA). Experimental outcomes were
presented as the mean
H&E staining (Fig. 1A) revealed an intact colon tissue structure in the control group, with no inflammation. In the UC group, the colon tissue showed scattered and missing epithelium, with significant edema and bleeding under the mucosa. The formation of ulcers and the shorter colon length observed in the UC group demonstrated the successful modeling of UC (Fig. 1B). Subsequent immunohistochemical analysis revealed upregulated HMGB1 expression and increased macrophage infiltration in the colon tissue of UC mice (Fig. 1C,D). Moreover, flow cytometry showed an imbalance in the M1/M2 macrophage ratio in the colon tissue of UC mice (Fig. 1E). These results suggest that upregulation of HMGB1 expression and infiltration of macrophages are involved in the pathogenesis of UC.
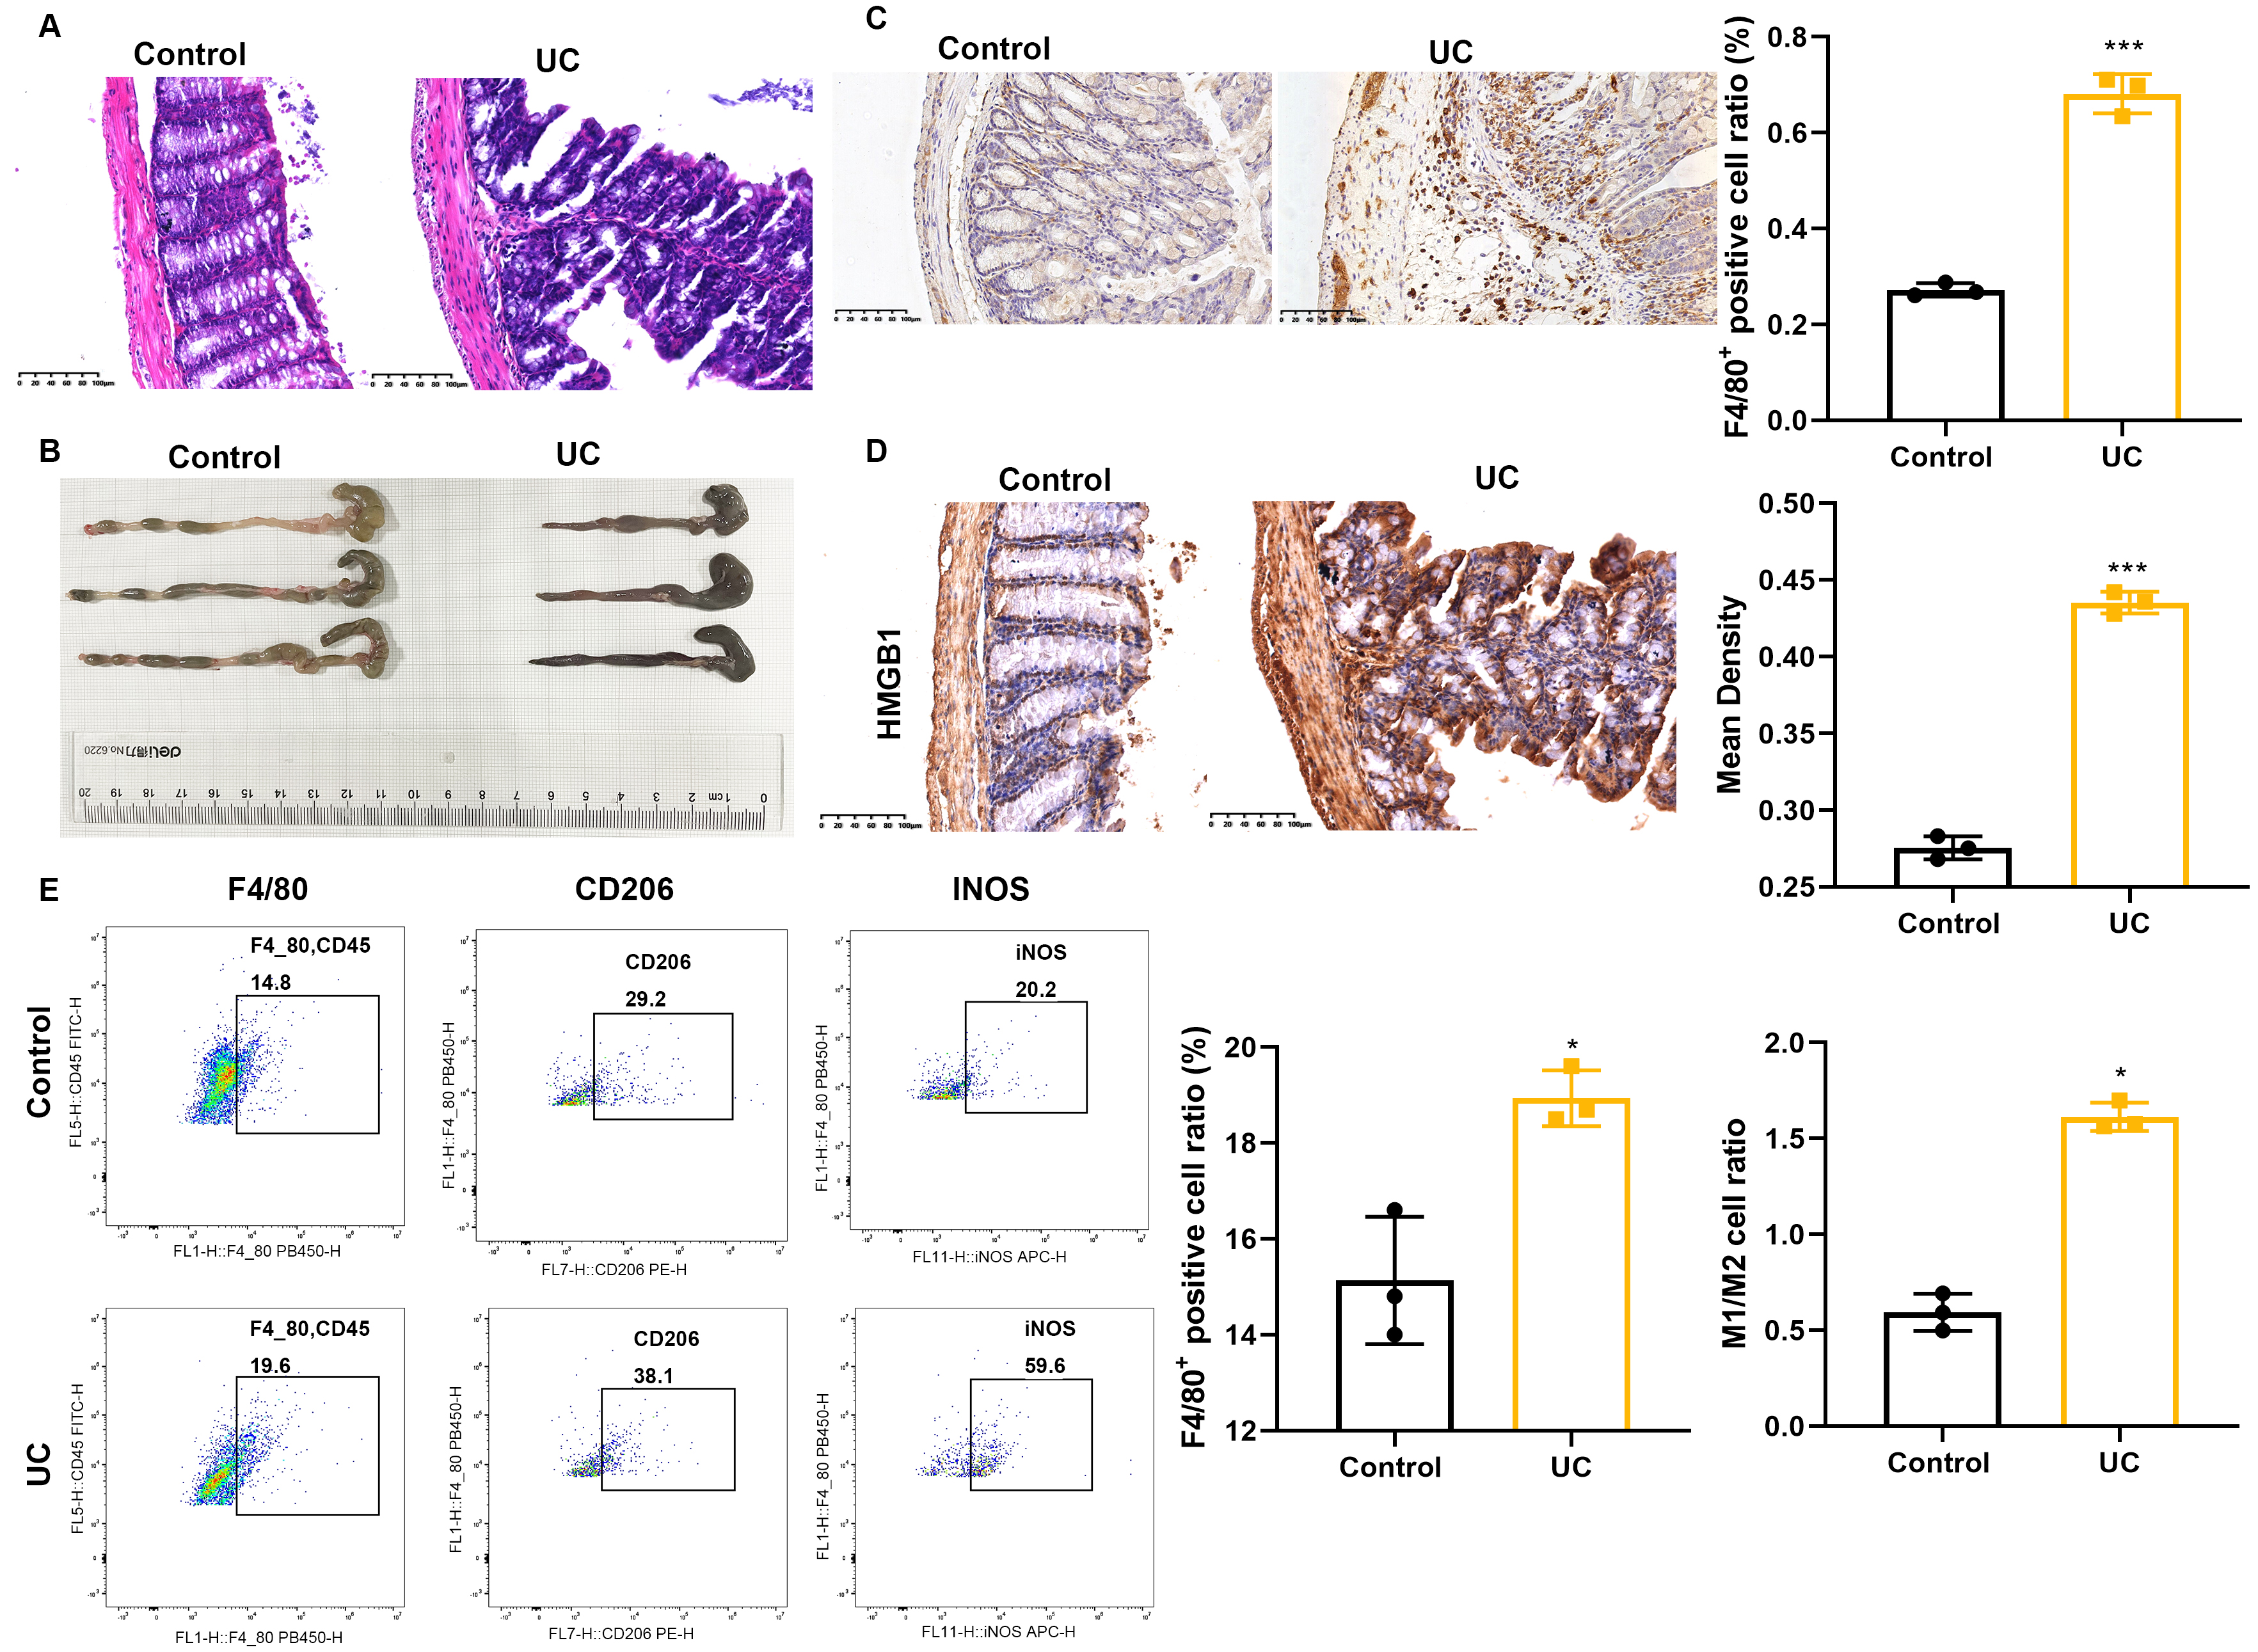 Fig. 1.
High mobility group box-1 protein (HMGB1) expression and
macrophage infiltration in the colon mucosal tissue of ulcerative colitis (UC)
mice. Mice were administered dextran sulfate sodium (DSS) to induce colitis,
with the control group receiving no treatment. (A) Representative histological
images of colon tissue sections stained with H&E, scale bars = 100μm. (B) Representative colon
images, scale bars = 100μm. (C) F4/80 immunohistochemical images of colitis-affected tissues, scale bars = 100μm. (D)
HMGB1 immunohistochemistry of colitis tissue, scale bars = 100μm. (E) Analysis of the M1/M2
macrophage ratio in colon tissue by flow cytometry. Statistical analysis was
conducted using Student’s t-test. Data shown are the mean
To explore the impact of HMGB1 on macrophage metabolism and polarization, mouse
macrophages (RAW264.7) were subjected to HMGB1 overexpression or knockdown by
HMGB1 overexpression plasmid and small interference RNA, and RT-PCR and western
blot were used to validate the overexpression or knockdown efficiency
(Supplementary Fig. 1). This was shown to induce the M1 or M2 macrophage
phenotypes, respectively. The upregulation of iNOS and downregulation of Arg-1 in
HMGB1-overexpressing cells showed that HMGB1 overexpression promotes the
polarization of M1 macrophages (Fig. 2A). Furthermore, the downregulation of iNOS
and upregulation of Arg-1 in HMGB1-knockdown cells demonstrated that knockdown of
HMGB1 promotes M2 macrophage polarization (Fig. 2B). Next, macrophage glycolipid
metabolism was studied by evaluating the ECAR, FAO activity and acetyl CoA
levels. As shown in Fig. 2C–H, overexpression of HMGB1 increased ECAR, reduced
FAO, and increased the acetyl CoA level. In contrast, knockdown of HMGB1 had the
opposite effects, suggesting that overexpression of HMGB1 promotes glycolysis and
inhibits FAO. The addition of acetyl CoA to HMGB1-knockdown cells, followed by
induction of M1 macrophages using IFN-
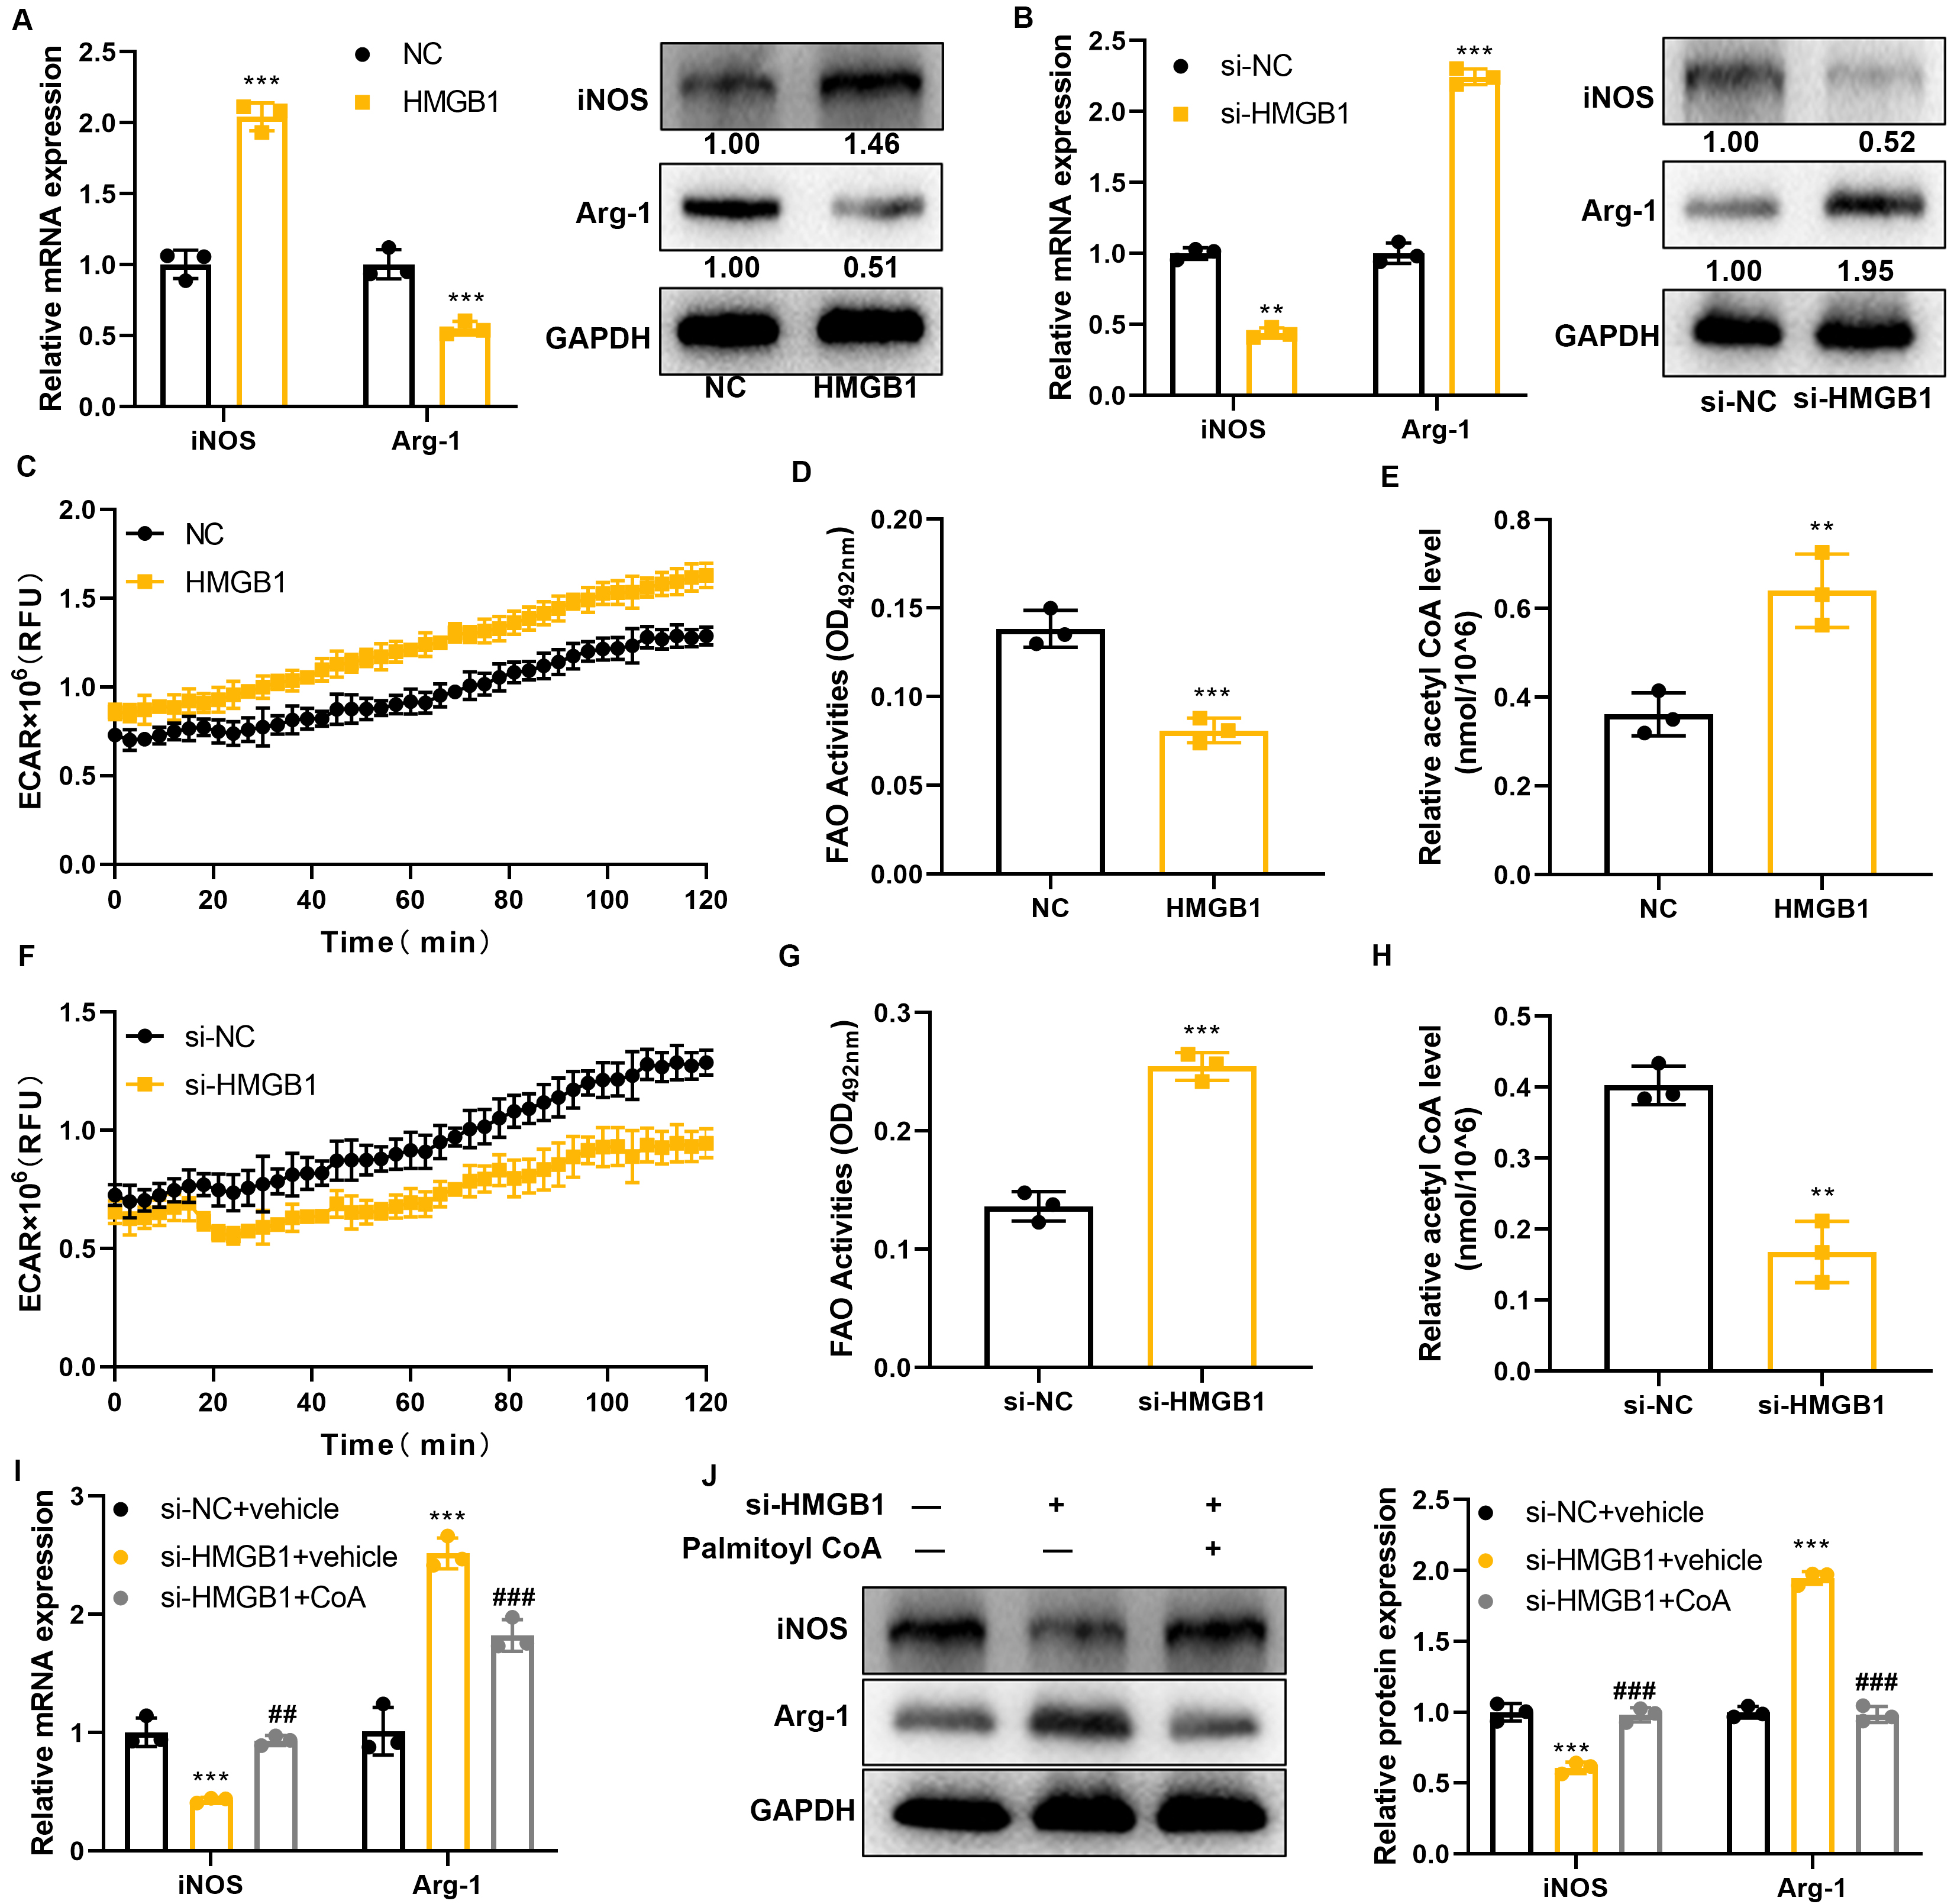 Fig. 2.
Effect of HMGB1 on macrophage metabolism and polarization.
(A,B) The mRNA and protein expression levels of iNOS and Arg-1 were quantified
using RT-PCR and Western blot, respectively. (C,F) Measurement of extracellular
acidification rate (ECAR) in cells. (D,G) Evaluation of fatty acid oxidation
(FAO) in cells. (E,H) Quantification of acetyl-CoA content in cells. (I,J)
Quantification of iNOS and Arg-1 mRNA and protein expression. Statistical
analysis was conducted using Student’s t-test or one-way ANOVA. Data
shown are the mean
In view of its important role in cellular glucose and lipid metabolism, we next evaluated the expression of Cpt1a in cells with HMGB1 overexpression or knockdown. RT-PCR and Western blot results showed that HMGB1 negatively regulates Cpt1a gene and protein expression (Fig. 3A,B). Moreover, ChIP-PCR experiments demonstrated the binding of HMGB1 protein to the Cpt1a promoter (Fig. 3C). The luciferase reporter gene method also showed that HMGB1 could inhibit transcriptional activity from the Cpt1a promoter (Fig. 3D). We conclude from these findings that HMGB1 negatively regulates Cpt1a expression by inhibiting transcription from its promoter.
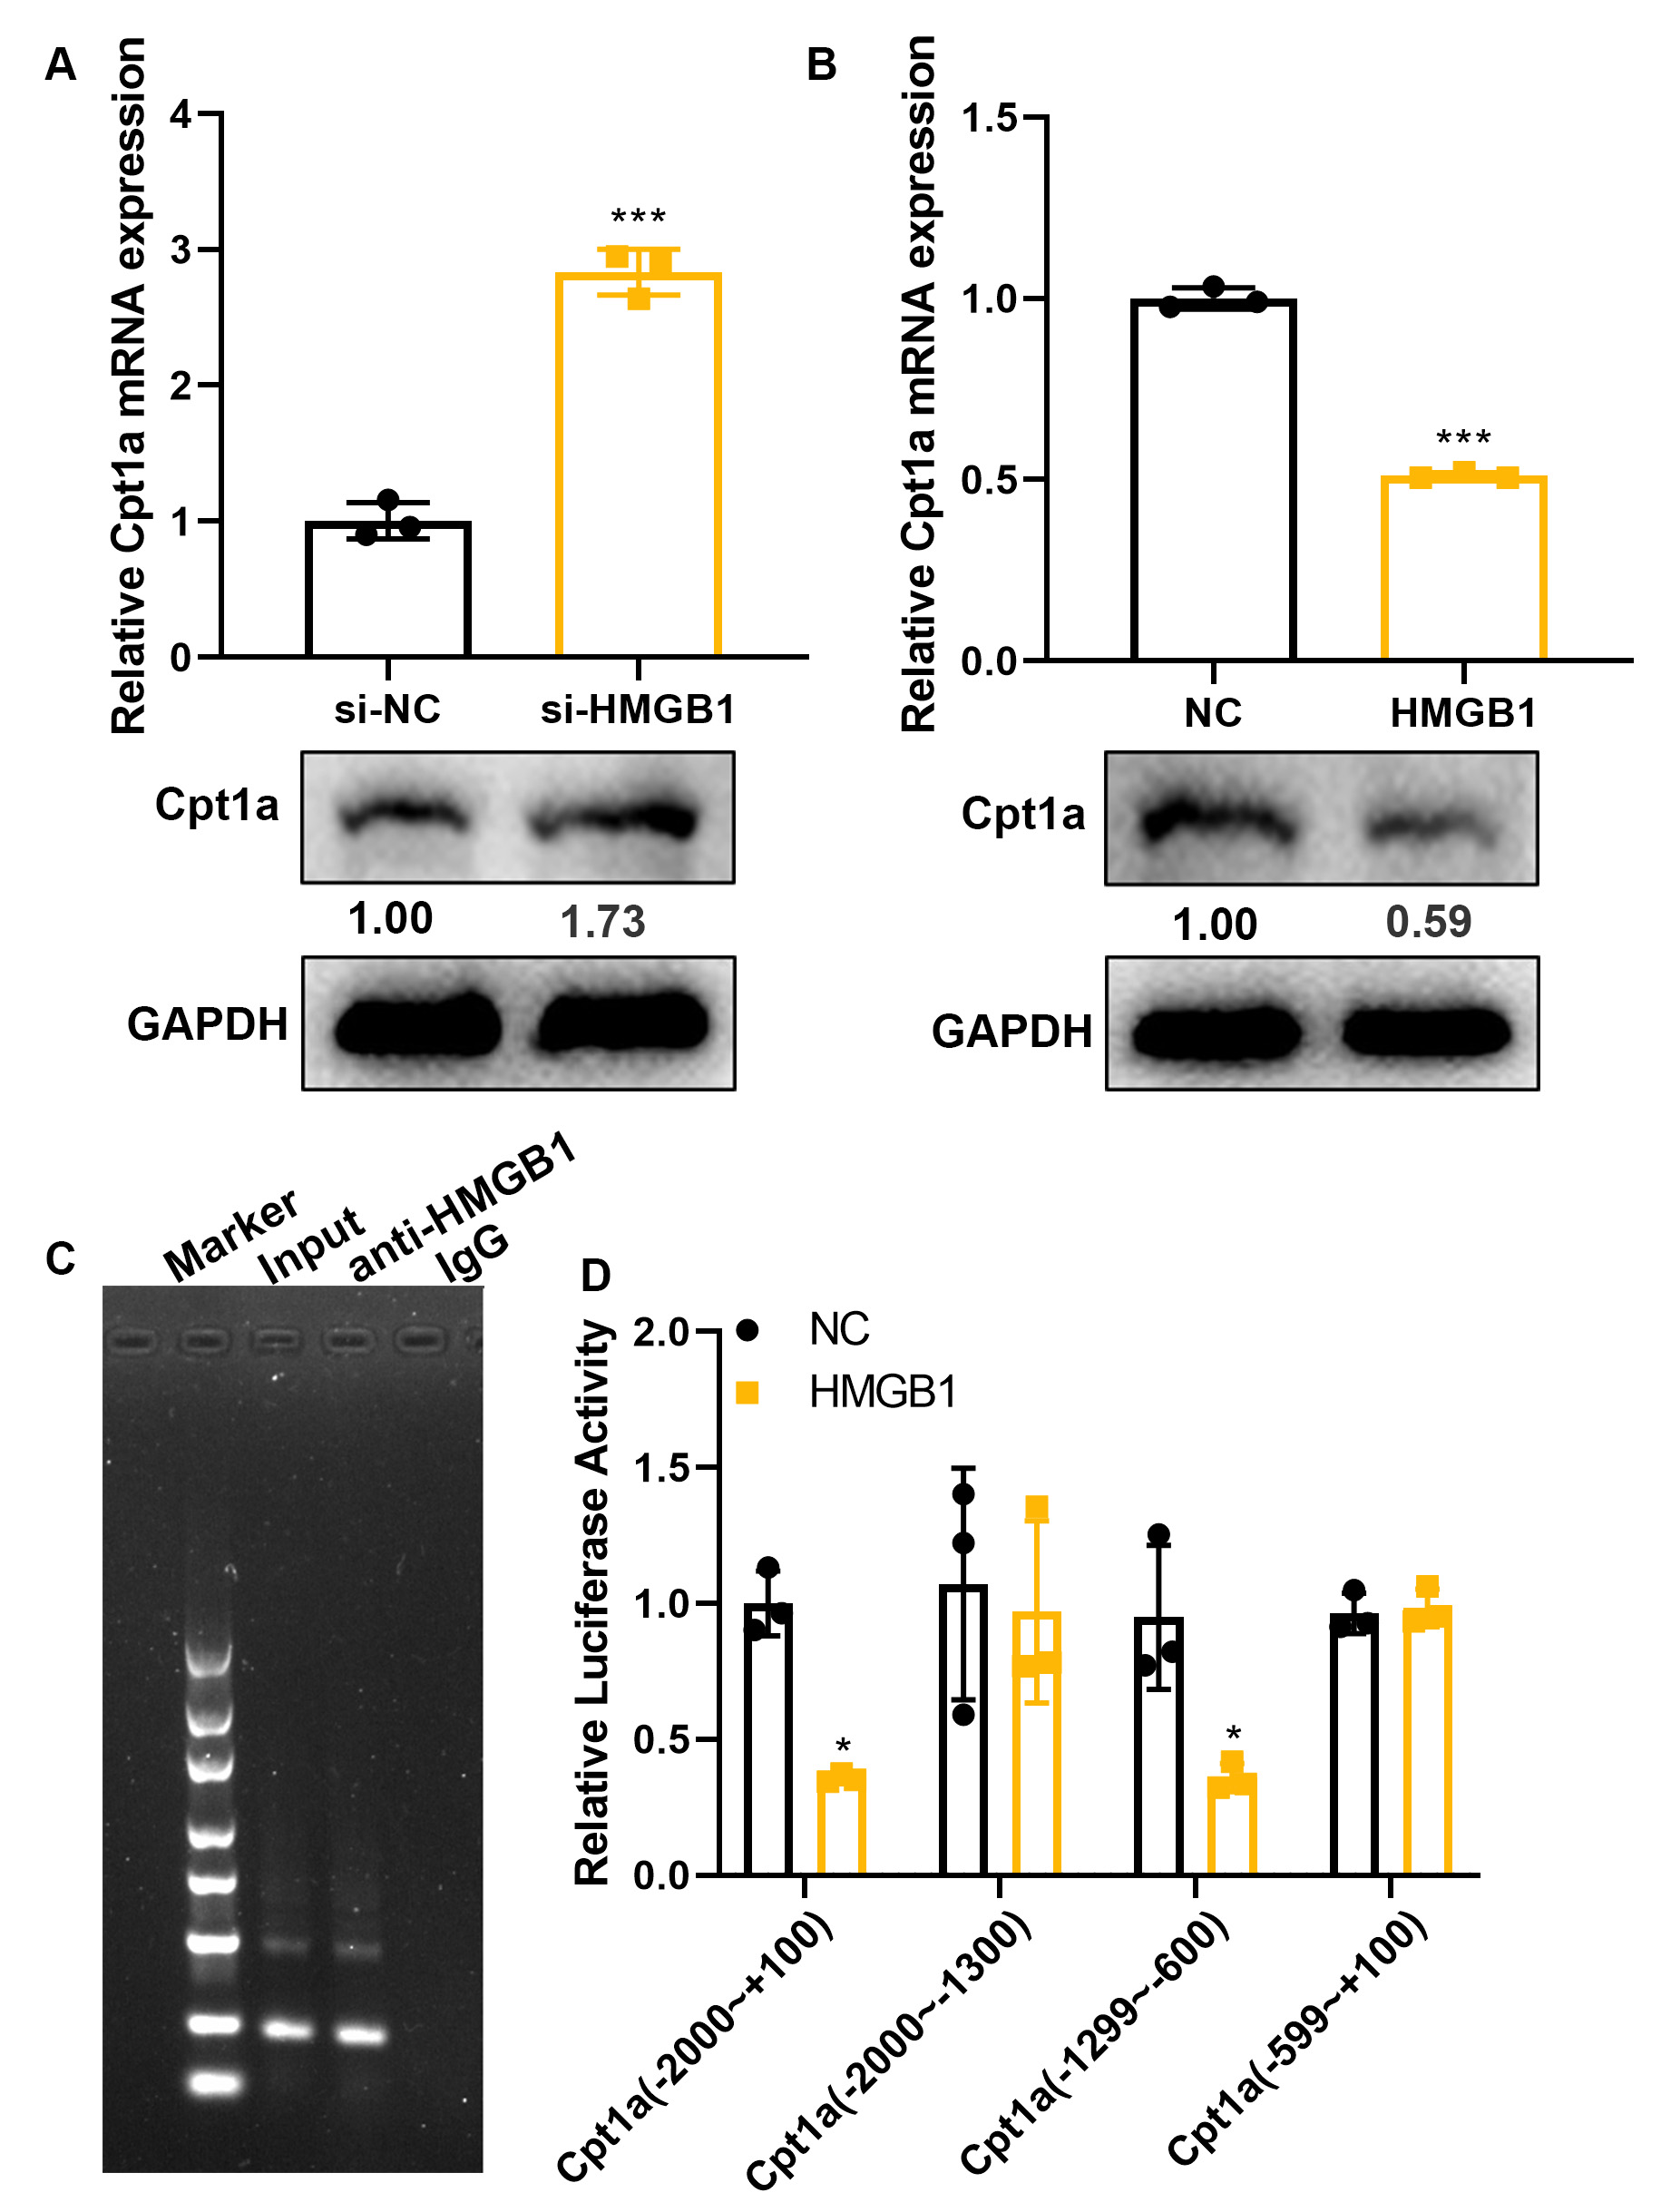 Fig. 3.
HMGB1 inhibits Cpt1a transcription by binding to its promoter.
(A,B) HMGB1-knockdown cells were induced into M1 macrophages by IFN-
To confirm that HMGB1 modulates the metabolism and polarization of macrophages through negative regulation of Cpt1a, we conducted simultaneous intervention of HMGB1 and Cpt1a. Knockdown of Cpt1a resulted in the upregulation of iNOS and downregulation of Arg-1. In contrast, knockdown of HMGB1 caused downregulation of iNOS and upregulation of Arg-1. Furthermore, knockdown of Cpt1a reversed the effects of si-HMGB1 on macrophage polarization (Fig. 4A,B). Interestingly, knockdown of Cpt1a increased ECAR, reduced FAO, and upregulated acetyl CoA, whereas knockdown of HMGB1 had the opposite effects. As expected, knockdown of Cpt1a reversed the effects of si-HMGB1 on macrophage metabolism (Fig. 4C–E). Therefore, we conclude that HMGB1 affects macrophage metabolism and polarization by regulating Cpt1a.
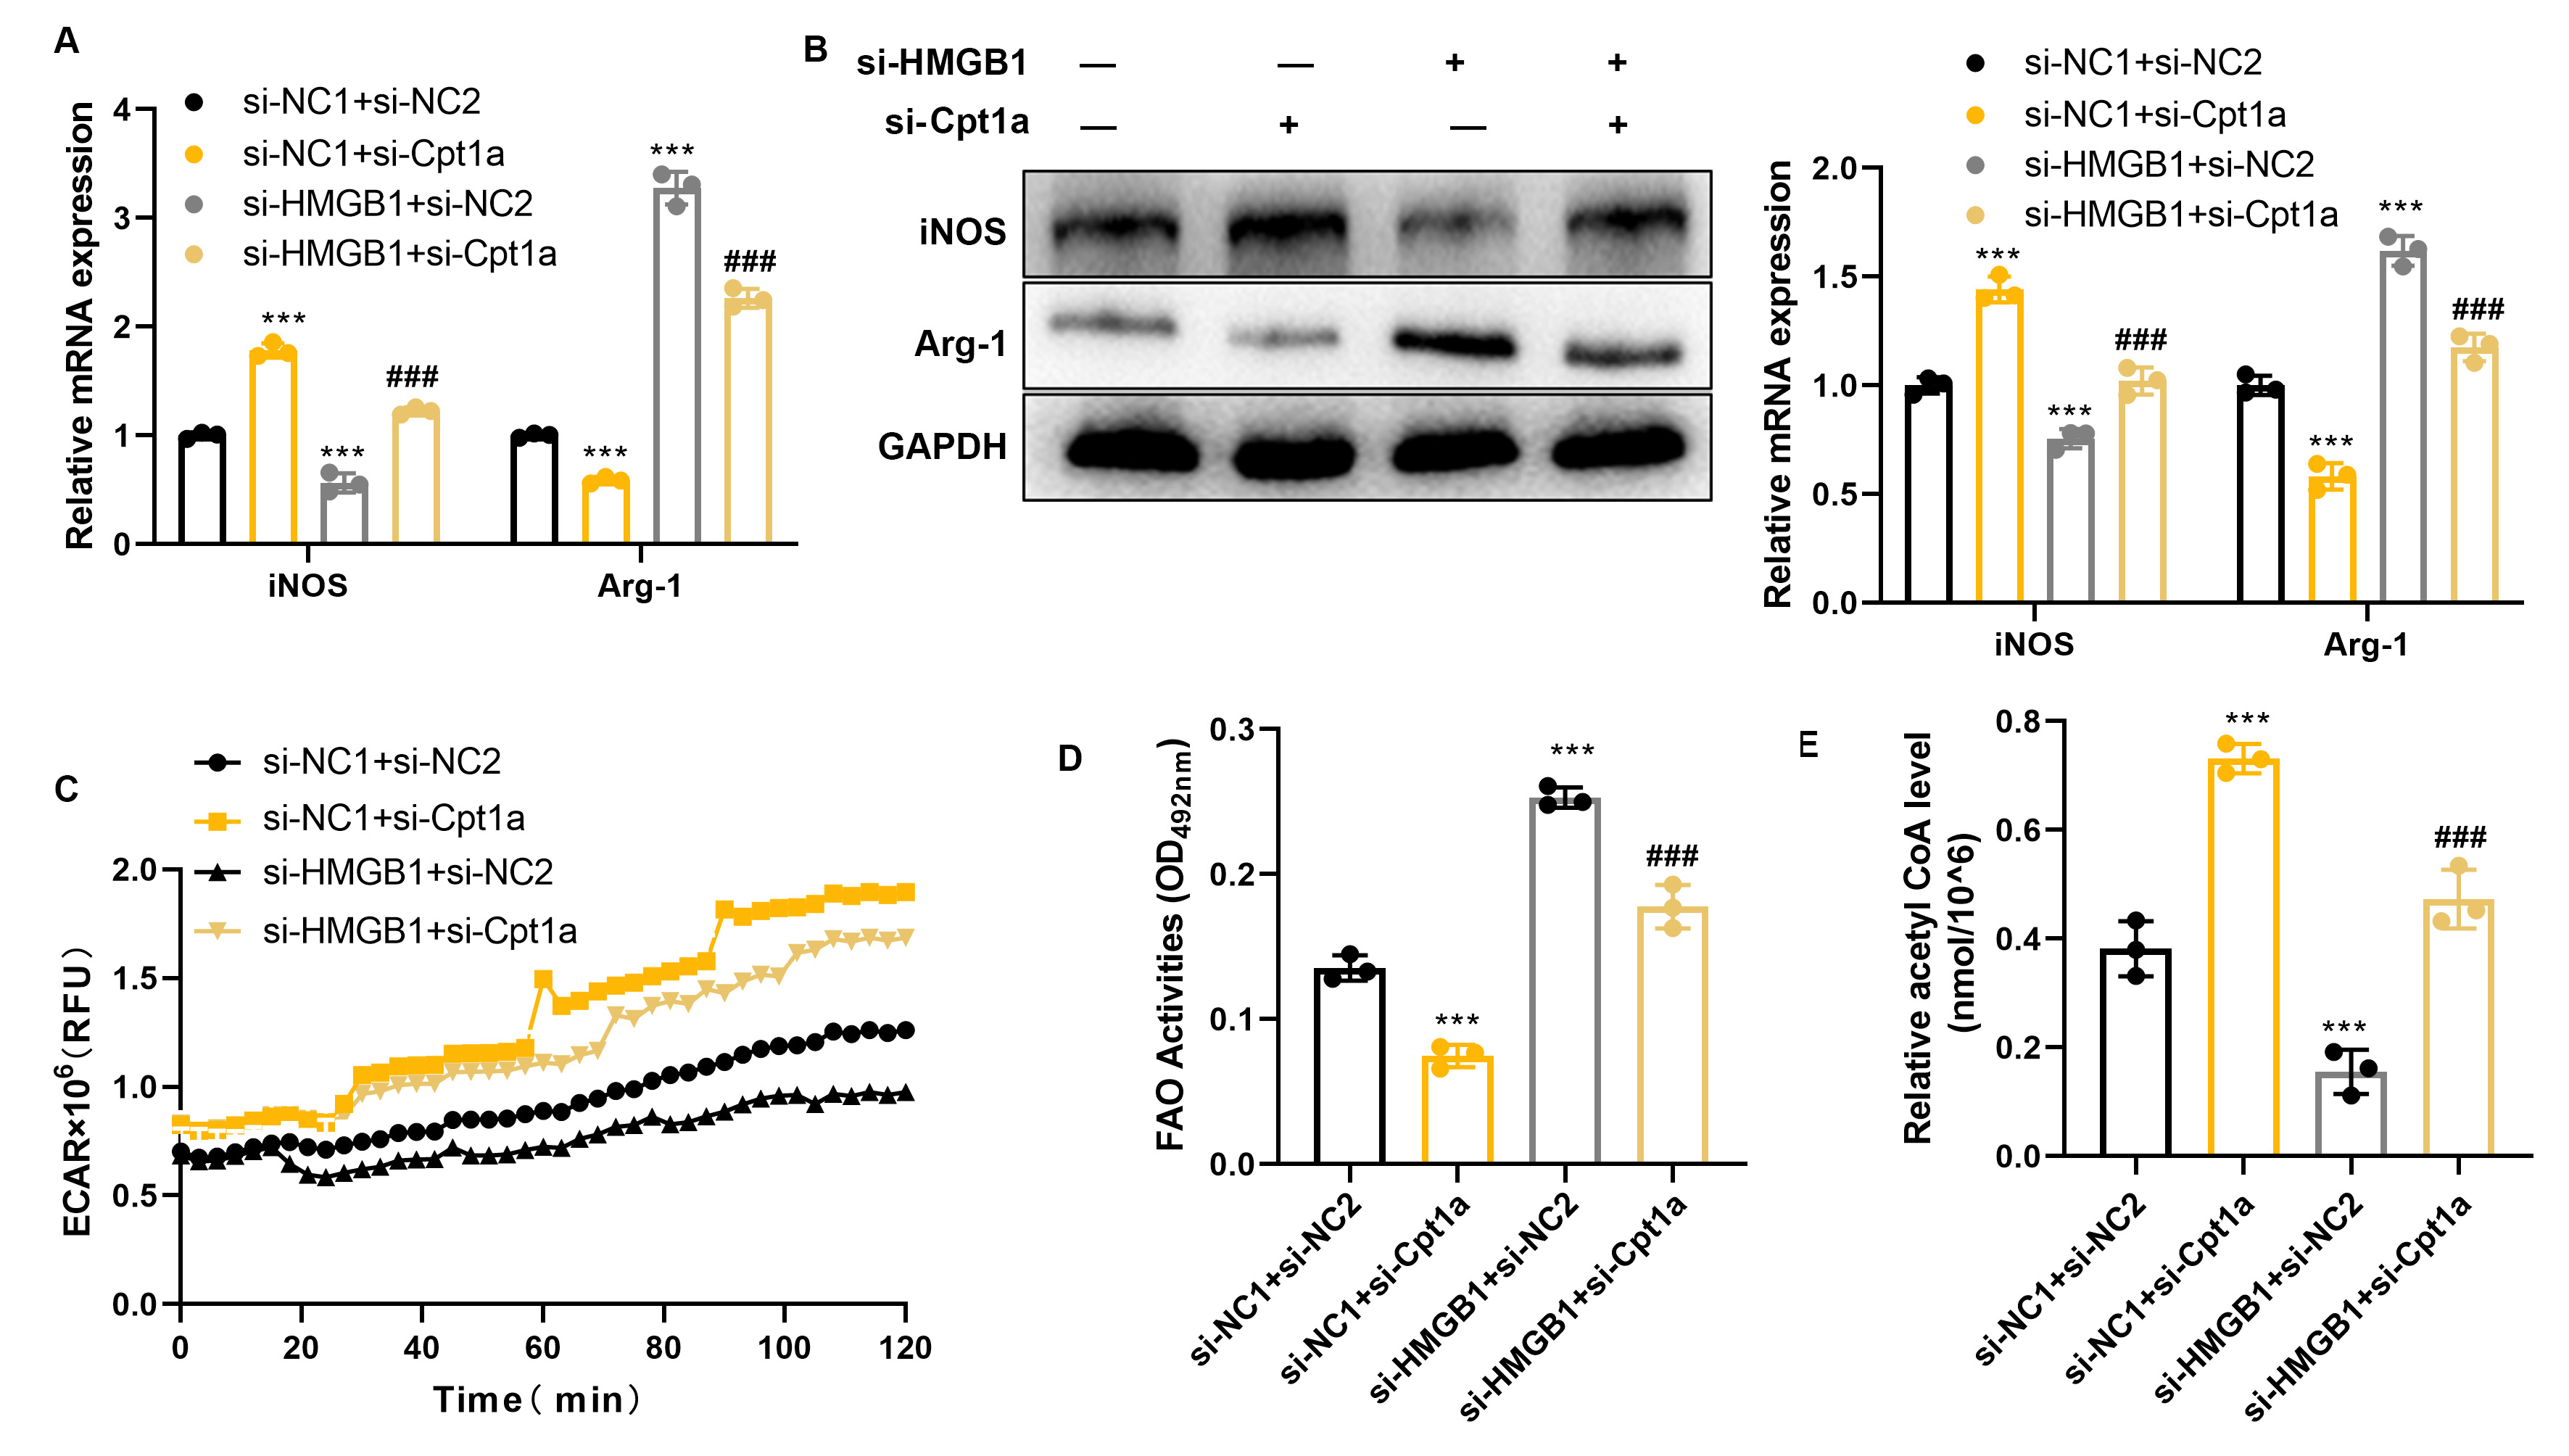 Fig. 4.
Inhibition of Cpt1a reverses the effects of si-HMGB1 on
macrophage metabolism and polarization. RAW264.7 cells were transfected with
interference sequences for Cpt1a and HMGB1, then induced into M1 macrophages
using IFN-
This project uses AAV virus to infect the colon of mice. We first evaluated the in vivo knockout efficiency of AAV-shHMGB1 and its impact on mouse colon tissue. Normal mice were injected with AAV-shNC and AAV- shHMGB1, respectively. Supplementary Fig. 2 showed the expression of HMGB1 in mouse colon tissue. Compared with the AAV-shNC injection group, the expression of HMGB1 in the colon tissue of AAV- shHMGB1 injection group mice was significantly reduced. In addition, histological examination and colon morphology evaluation showed that AAV-shHMGB1 did not have any harmful effects on mouse colon tissue. Supplementary Fig. 3A showed the variations in animal body weight and Disease Activity Index (DAI) scores.
To determine the role of HMGB1 knockdown on UC progression, mice were
administered DSS to induce colitis and were also treated with HMGB1 interference
virus (AAV-shHMGB1). The variations in animal body weight and DAI scores are
depicted in Supplementary Fig. 3B. Compared to the AAV-shNC group, mice in the
AAV-shHMGB1 group exhibited less submucosal edema and bleeding in colon tissue
(Fig. 5A). Additionally, the colon length in the AAV-shHMGB1 group was
significantly longer than in the AAV-shNC group (Fig. 5B). Furthermore, reduced
levels of the pro-inflammatory cytokines TNF-
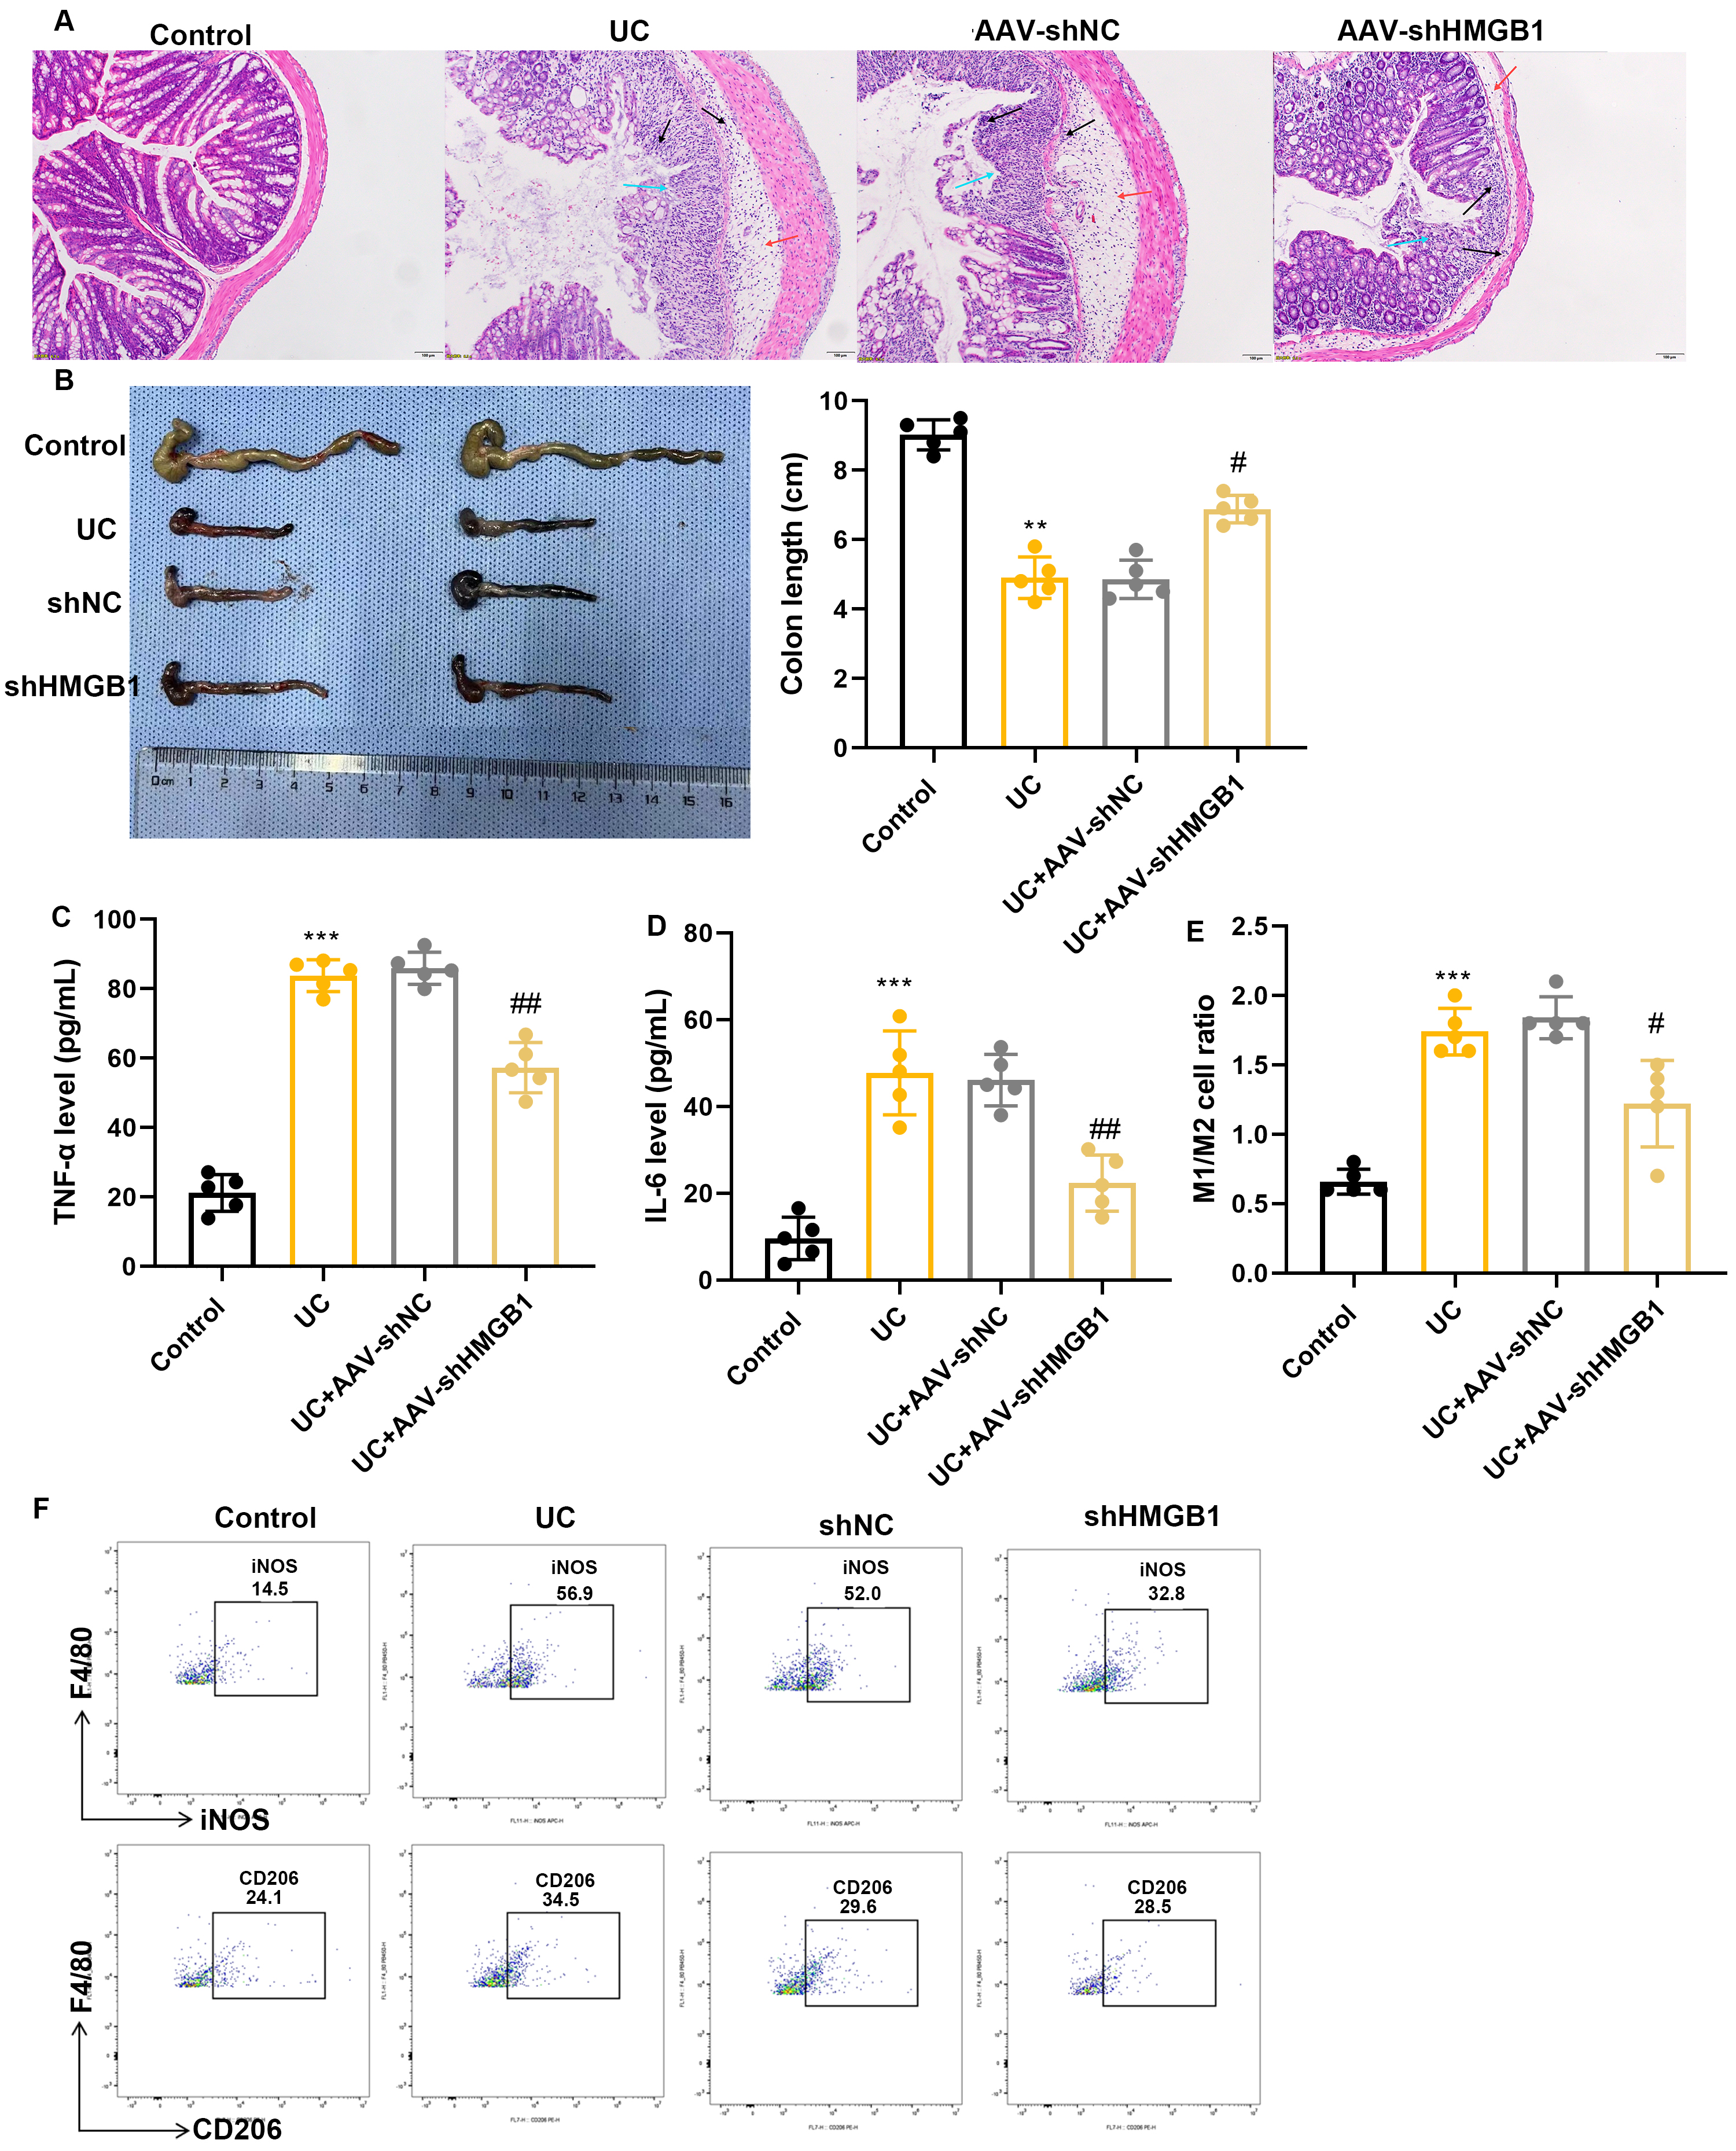 Fig. 5.
Inhibition of HMGB1 regulates macrophage polarization to
ameliorate UC progression. (A) Representative histological analysis of the colon
using H&E staining, scale bars = 100μm. (B) Representative images of the colon, and quantification
of colon length. (C,D) ELISA assay results of TNF-
UC is a chronic inflammatory disease affecting all parts of the colon and characterized by inflammation from the rectal mucosa through to the proximal colon [28]. Macrophages are natural immune cells in tissues and are also key regulators of intestinal immune homeostasis [29, 30]. Studies have shown that intestinal macrophages in UC patients exhibit an abnormal M1 phenotype polarization [31, 32]. The present study also found increased infiltration of M1 macrophages in UC mice, consistent with previous findings [27, 32].
It was recently reported that HMGB1 can promote inflammatory bowel disease by
modulating neutrophil extracellular traps and macrophage polarization [33]. HMGB1
can also trigger macrophage polarization by activating innate immunity pathways
involving Recombinant Renal Tumor Antigen (RAGE)/mitogen-activated protein
kinases (MAPK), nuclear factor kappa-B (NF-
Reprogramming of intracellular metabolism is essential for the polarization and function of activated macrophages. M1 macrophages rely primarily on glycolysis as their key source of energy [18], whereas M2 macrophages are predominantly fueled by FAO [19]. HMGB1 has been shown to play a role in macrophage reprogramming and may be a crucial regulator in this process [39]. The reactive oxygen species (ROS)/HMGB1/TLR4 signaling axis enables nab-paclitaxel to promote the reprogramming of M2-type macrophages into the M1-like phenotype [40]. The present study found that overexpression of HMGB1 regulates a metabolic switch from FAO to glycolysis, thus promoting M1 macrophage phenotype polarization. In contrast, knockdown of HMGB1 regulates a metabolic switch from glycolysis to FAO, thereby promoting M2 phenotype polarization. Therefore, we conclude that HMGB1 regulates macrophage polarization by causing a switch in cell metabolism pathways, although the downstream targets for HMGB1 remain to be identified.
HMGB1 is a nuclear protein that functions as a transcriptional regulator [41].
We found that HMGB1 negatively regulates Cpt1a expression, and subsequently
showed that it inhibits the transcription of Cpt1a by binding to its promoter.
Cpt1a is one of the key enzymes involved in
Currently, various strategies have been developed to inhibit HMGB1 and its inflammatory effects. These methods involve directly binding to HMGB1 proteins, including targeting small natural (such as glycyrrhizic acid or gabexate methanesulfonate) or synthetic molecules of HMGB1 (such as HMGB1 specific antibodies, peptides, proteins, or bent DNA double strands) [42]. Among these inhibitors, the natural steroid pigment tanshinone IIA derivative is highly selective and used in China to treat cardiovascular diseases, offering significant protection against lethal endotoxemia and sepsis in mice [43]. Glycyrrhetinic acid, a natural triterpenoid glycoside, is the most extensively studied HMGB1 inhibitor. At present, studies have revealed the regulatory effects of tanshinone IIA and Glycyrrhetinic acid on macrophage polarization [44, 45], but their therapeutic effects on UC still need further evaluation.
A limitation of this study is that the expression and role of HMGB1 downstream regulatory molecule Cpt1a in UC have not been confirmed yet. Future studies should investigate whether the involvement of Cpt1a in UC pathogenesis also extends to the metabolism and function of other cell types. A more detailed understanding of the contribution of HMGB1 to UC progression may be achieved through the integration of clinical findings and metabolomics.
In summary, this research found the HMGB1/Cpt1a axis directly regulates the metabolic switch from FAO to glycolysis, thereby promoting macrophage polarization towards the M1 phenotype and favoring the development of UC. Moreover, this study sheds light on how alterations in cellular metabolism can impact macrophage polarization, and suggests that targeting of HMGB1 may be a promising therapeutic approach for UC.
The datasets used and/or analyzed during the current study are available from the corresponding author upon reasonable request.
FW, LL designed the research study and analyzed the data. FW, LL, ZQW, LW, FL performed the research. ZLW provided help and advice on experimental methods, wrote the manuscript. All authors contributed to editorial changes in the manuscript. All authors read and approved the final manuscript. All authors have participated sufficiently in the work and agreed to be accountable for all aspects of the work.
The research protocol was approved by the Ethics Committee of Second Affiliated Hospital of Nanchang University (Approval No. NCULAE-20221031185).
Not applicable.
This research was funded by Natural Science Foundation of Jiangxi (China), grant number 20224BAB216020.
The authors declare no conflict of interest.
Supplementary material associated with this article can be found, in the online version, at https://doi.org/10.31083/j.fbl2911387.
References
Publisher’s Note: IMR Press stays neutral with regard to jurisdictional claims in published maps and institutional affiliations.