


1 Department of Haemolymph, Harbin Medical University Cancer Hospital, 150001 Harbin, Heilongjiang, China
2 Department of Hematology, The First Hospital of Qiqihar, 161005 Qiqihar, Heilongjiang, China
3 Shenshan Medical Center, SunYat-sen Memorial Hospital, Sun Yat-sen University, 516621 Shanwei, Guangdong, China
4 Department of Integrated TCM and Western Medicine, The First Hospital of Qiqihar, 161005 Qiqihar, Heilongjiang, China
5 Qiqihar Center for Drug Control, 161006 Qiqihar, Heilongjiang, China
Abstract
The purpose of this study is to investigate the correlation between elevated levels of CCAAT/enhancer-binding protein beta (CEBPB) gene expression and unfavorable outcomes in diffuse large B-cell lymphoma (DLBCL). The goal is to elucidate potential therapeutic targets associated with this relationship.
Differential expression and survival analyses were conducted using data from the Gene Expression Omnibus (GEO) database. The functions of CEBPB in DLBCL cells were investigated through cell culture, RNA extraction, quantitative real-time polymerase chain reaction (qRT-PCR), and Western blot. In addition, a weighted gene co-expression network analysis (WGCNA) was performed to pinpoint gene modules associated with CEBPB. Furthermore, experimental validation was carried out to explore the interaction between CEBPB and interleukin 1 beta (IL1B).
High levels of CEBPB expression are prominently observed in DLBCL, with its overabundance significantly linked to the diagnosis of DLBCL. Survival analysis reveals that patients exhibiting elevated CEBPB expression tend to experience a poorer prognosis. Further validation confirmed CEBPB's role in promoting DLBCL cell proliferation and cell cycle progression. WGCNA identified CEBPB-related gene modules, with IL1B identified as a potential regulatory gene of CEBPB. The presence of high levels of IL1B has been correlated with an unfavorable prognosis in individuals diagnosed with DLBCL. Experiments demonstrate that IL1B promotes DLBCL cell proliferation through CEBPB.
This study reveals the significant roles of CEBPB and IL1B in DLBCL, providing new theoretical foundations and potential molecular targets for the treatment and prognosis of DLBCL.
Keywords
- diffuse large B-cell lymphoma
- CCAAT/enhancer-binding protein beta
- interleukin 1 beta
- diagnostic marker
- in vitro proliferation
- therapeutic target
As the most prevalent form of non-Hodgkin lymphoma in adults, diffuse large B-cell lymphoma (DLBCL) is characterized by diverse clinical manifestations and variable responses to treatment [1, 2, 3, 4, 5, 6, 7]. Characterized by its high malignancy potential, DLBCL’s defining features include dysregulated cell proliferation and resistance to apoptotic signals [8, 9, 10, 11]. While rituximab-based chemotherapy regimens effectively treat 50–70% of DLBCL patients [12, 13, 14], a significant portion of the remaining patients face poor prognoses due to disease relapse or refractoriness [15, 16, 17, 18, 19, 20, 21]. This underscores the critical need for exploring and developing new and more effective therapeutic targets and strategies to improve survival rates in DLBCL patients.
Among the many potential therapeutic targets, the roles of CCAAT/enhancer-binding protein beta (CEBPB) and interleukin 1 beta (IL1B) have garnered particular attention [22, 23]. CEBPB, a key member of the C/EBP family, has three isoforms known as LIP, LAP1, and LAP2. It plays a crucial role in regulating cellular growth [24, 25, 26]. CEBPB is involved in various biological processes, including metabolic regulation, tumor progression, adipogenesis, and inflammatory responses [27], highlighting its multifaceted role in cell fate determination [28, 29]. However, depending on the cellular context, CEBPB can play contradictory roles in cancer development and cell survival [30, 31]. In some cases, CEBPB not only increases melanoma cells’ sensitivity to therapeutic drugs but also participates in endoplasmic reticulum stress processes, leading to cell death [32, 33, 34, 35]. Early study has also shown high expression of CEBPB in positive phagocytic lymphoma cells and Hodgkin lymphoma [36], suggesting its significant role in DLBCL. IL1B is mainly involved in both acute and chronic inflammatory responses, which are produced by monocytes, tissue macrophages, and epithelial cells. Cumulative evidence showed that IL1B amount had increased in numerous malignancies such as cervical, breast, colon, and lung cancers [37]. Consequently, IL1B may be responsible for the formation and development of cancers. Previous study has reported that IL1B promotes matrix metalloproteinase (MMP) gene expression in the A549 lung carcinoma line through activation of the pluripotent transcription factor CCAAT-enhancer-binding protein beta (CEBPB) [38].
Our initial investigations reveal a high expression of CEBPB in the islet tissues of DLBCL patients, prompting a deeper exploration of its involvement in the pathogenesis of DLBCL. This study seeks to explore the pathophysiological mechanisms underlying DLBCL by examining the functions and interactions of CEBPB and its upstream gene IL1B. Specifically, the research aims to elucidate the impact of these factors on the proliferation and survival of DLBCL cells. IL1B, an important inflammatory factor, is closely associated with the exacerbation of various cancers, yet its specific role in DLBCL remains unclear.
Through integrated bioinformatics analysis, molecular biology experiments, and cell biology techniques, this study delves into the roles of CEBPB and IL1B in the pathogenesis of DLBCL, aiming to unveil their potential as new therapeutic targets and prognostic markers. This research not only holds promise for offering new strategies for treating DLBCL but also lays the foundation for developing future personalized treatment plans by deepening the understanding of these molecules’ mechanisms of action in DLBCL. Specifically, the findings of this study will provide more precise molecular markers for the treatment decisions of DLBCL patients, further driving the innovation and development of treatment strategies for DLBCL.
This study included 43 diagnosed DLBCL patients and 43 healthy physical examination patients. All patients received R-CHOP based immunotherapy. The review committee of the First Hospital of Qiqihar approved this study after obtaining informed consent (2023-KY-001) following the Helsinki Declaration.
Collect peripheral blood from DLBCL patients into EDTA anticoagulant blood collection tubes, and mix the blood evenly in a sterile 50 mL tube. Add lymphocyte separation solution, blood, and PBS in a ratio of 1:1:1, and slowly add the above blood diluent along the tube wall to the 45 mL mark. Centrifuge 500g at room temperature for 30 minutes. Depending on the density of each component in the blood, the tube will be filled with a pale yellow plasma layer, a mononuclear cell white membrane layer, a transparent separation solution layer, and the bottom red blood cell layer from top to bottom after centrifugation.
Separate monocytes: Gently aspirate the upper plasma layer using a pipette, transfer the white membrane layer to a new 50 mL tube, add PBS to 50 mL, centrifuge and discard the supernatant, then scatter the cell pellet, add PBS to 50 mL, centrifuge again and discard the supernatant. Finally, the cell pellet was dispersed and purified using a monocyte positive separation kit.
To carry out our investigation, we accessed two gene expression datasets via the Gene Expression Omnibus (GEO, http://www.ncbi.nlm.nih.gov/geo/) to conduct differential expression analysis and survival analysis. The number of diffuse large B-cell lymphoma and human healthy tonsils was 55 and 33, respectively in GSE56315 dataset [39], which were used for differential expression analysis to explore variations in CEBPB gene expression levels between normal and DLBCL tissues. The GSE87371 dataset [40] contains clinical details and gene expression data of 223 DLBCL patients, which were analyzed to study the association between elevated CEBPB expression and unfavorable prognosis in DLBCL patients.
DLBCL cell lines, KARPAS422 (ATCC, CRL-2632) and WSUDLCL2 (ACC 575), were acquired from the American Type Culture Collection (ATCC) and the Leibniz Institute DSMZ-German Collection of Microorganisms and Cell Cultures (DSMZ, Braunschweig, Germany), respectively. Human lymphoblastoid B cells (GM12878, ATCC CRL-2230) were also acquired from ATCC. The DLBCL cell lines were the experimental group, with GM12878 as the control group. The DLBCL cell lines and the control group were cultured in the same manner, with both sets of cells being cultured in RPMI-1640 medium containing 10% fetal bovine serum (FBS) at 37 °C in a 5% CO2 environment. Authenticity of all cell lines was confirmed through short tandem repeat (STR) profiling within the last three years (during the experimental period), ensuring the reliability of the experimental outcomes.
In the experiment, human THP-1 monocytes (TIB-202, ATCC) was cultured in α-MEM medium supplemented with 10% fetal calf serum and 1% penicillin–streptomycin. All THP-1 monocytes were differentiated into macrophages after 72 hours of treatment with 100 ng/mL phorbol 12-myristate 13-acetate (PMA).
To ensure the reliability of our experimental results, all cell lines utilized in this study underwent periodic testing for mycoplasma contamination. Prior to commencing any experimental procedures, cell line authentication and mycoplasma testing were performed to confirm the absence of mycoplasma contamination. This validation process was carried out routinely within the experimental period.
All animal experiments have been approved by the Biomedical Ethics Committee of the First Hospital of Qiqihar (Approval No.: 2023-KY-001). Six to eight week old male SCID mice with an average weight of 20 grams were purchased from the Chinese Academy of Sciences (Shanghai, China), Shanghai Institute of Materia Medica. In the study, mice were anesthetized by intraperitoneal injection of 0.3–0.4 mL of 0.3% pentobarbital sodium to ensure a painless state. Under aseptic conditions, 1 × 10⁷ low-passage human DLBCL OCI-Ly1 cells (ATCC) were placed into the left inguinal region of the mice. Introduce every IL-1B silenced/overexpressed macrophage (sh-IL1B or OE-IL1B macrophage) into the bloodstream in the left inguinal region of mice (inject 200 μL of 20 grams of mouse body weight). Monitor the weight and tumor growth of mice weekly, and record changes in tumor diameter and volume. Use a digital caliper every other day to assess tumor size. Tumor volume= (length × width 2) × 0.5. This study complies with the guidelines of our Institutional Animal Care and Use Committee and the Ethical Vertebrate and Regulated Invertebrate Research Committee, ensuring ethical behavior throughout the entire process.
In this study, we employed human-derived THP-1 macrophages (obtained from ATCC, catalog number TIB-202) and KARPAS422, WSUDLCL2 to investigate the functional silencing of IL1B and CEBPB genes. To achieve gene silencing, THP-1 macrophages were first differentiated using phorbol 12-myristate 13-acetate (PMA) at a concentration of 100 ng/mL for 72 hours. After differentiation, we utilized shRNA plasmids specifically designed to target IL1B and CEBPB (Merck, New York, NY, USA). The sequences of the shRNA used for gene silencing are detailed in Table 1. Transfection was carried out using Lipofectamine 3000 (Invitrogen, Thermo Fisher Scientific, New York, NY, USA), following the manufacturer ’s protocol. The THP-1 macrophages and KARPAS422, WSUDLCL2 were seeded into 6-well plates at a density of 2 × 10⁵ cells per well and were transfected with 50 ng of shRNA plasmid DNA per well. Post- transfection, cells were incubated for 48 hours to allow for efficient silencing.
| Gene name | Oligo 1 (5′-3′) | Oligo 2 (5′-3′) |
| CEBPB (NM_005194)#1 | CCGGCCCGTGGTGTTATTTAAAGAACTCGAGTTCTTTAAATAACACCACGGGTTTTTG | AATTCAAAAACCCGTGGTGTTATTTAAAGAACTCGAGTTCTTTAAATAACACCACGGG |
| CEBPB (NM_005194)#2 | CCGGGCACAGCGACGAGTACAAGATCTCGAGATCTTGTACTCGTCGCTGTGCTTTTTG | AATTCAAAAAGCACAGCGACGAGTACAAGATCTCGAGATCTTGTACTCGTCGCTGTGC |
| IL1B (NM_000576) | CCGGGCGATTTGTCTTCAACAAGATCTCGAGATCTTGTTGAAGACAAATCGCTTTTTG | AATTCAAAAAGCGATTTGTCTTCAACAAGATCTCGAGATCTTGTTGAAGACAAATCGC |
shRNA, interference RNA; CEBPB, CCAAT/enhancer-binding protein beta; IL1B, interleukin 1 beta.
Simultaneously add 25 ng plasmids with and without IL-1B overexpression and CEBPB silencing, including: recombinant IL1B+sh-CEBPB; Recombinant IL1B+sh-negative control (NC); OE-NC+sh-CEPBB ; OE-NC+sh-NC co-transfected plasmids. After completion, co-culture the plasmids and transfection reagents with the tumor cells for 4 hours. After completion, remove the serum-free culture medium and transfection reagents, and add the necessary culture medium for cell proliferation for further cultivation.
The cell transfection groups for IL1B silencing were as follows: sh-negative control(NC) group (Forward oligo: 5′-CCGGAAGGGTGAACTCACGTCAGAACTCGAGTTCTGACGTGAGTTCACCCTTTTTTTG-3′, Reverse oligo: 5′-AATTCAAAAAAAGGGTGAACTCACGTCAGAACTCGAGTTCTGACGTGAGTTCACCCTT-3′. sh-IL1B group (Forward oligo: 5′-CCGGGCGATTTGTCTTCAACAAGATCTCGAGATCTTGTTGAAGACAAATCGCTTTTTG-3′, Reverse oligo: 5′-AATTCAAAAAGCGATTTGTCTTCAACAAGATCTCGAGATCTTGTTGAAGACAAATCGC-3′. RT-qPCR measured the silencing efficiency of the two sh-IL1B sequences. All expression plasmids were bought from Shanghai GenePharma Co., Ltd. (Shanghai, China), with a 50 ng/mL plasmid concentration.
The cell transfection groups for CEBPB silencing were as follows: sh-NC group, sh-CEBPB-#1 group (transfected with the sequence 5′-CCGGCCCGTGGTGTTATTTAAAGAACTCGAGTTCTTTAAATAACACCACGGGTTTTTG-3′ in macrophages), and sh-CEBPB-#2 group (transfected with the sequence 5′-CCGGGCACAGCGACGAGTACAAGATCTCGAGATCTTGTACTCGTCGCTGTGCTTTTTG-3′ in macrophages). RT-qPCR measured the silencing efficiency of the two sh-CEBPB sequences.
The overexpression groups included macrophages overexpressing IL1B/CEBPB, a vector control group, and a blank group. Western blot was employed to assess the efficacy of gene overexpression. All expression plasmids were acquired from Shanghai GenePharma Co., Ltd. (Shanghai, China) and used at a 50 ng/mL concentration.
The preparation of macrophages overexpressing IL1B/CEBPB involved the following steps: PCR amplification of IL1B/CEBPB mRNA, synthesis of the corresponding cDNA sequences, and insertion of the IL1B/CEBPB genes into an overexpression vector using DNA ligase to form a complete plasmid, including promoters, enhancers, and selection markers, to ensure high levels of gene expression. The overexpression vector plasmids (pCMV6-Entry, PS100001) and enzymes required for the experiment were purchased from Invitrogen (Thermo Fisher Scientific). The constructed IL1B/CEBPB overexpression plasmids were mixed with transfection reagents and then added to the macrophage culture. Transfected macrophages were established to overexpress IL1B and CEBPB, following the manufacturer’s instructions for the transfection reagent (Lipofectamine, Thermo Fisher Scientific).
Multicellular co-cultures were composed of IL1B-overexpressed/silenced THP-1 cells, and OCI-Ly1 cells at a
1:50 ratio, respectively. We chose these ratios based on immunohistochemical
(IHC) quantification of diffuse large B-cell lymphoma patient tumors which
reflected the tumor/TME composition. Cells were trypsinized and plated with THP-1 cells
into 6-well plates at 1.5
Total RNA was extracted for the analysis of CEBPB gene
expression using Trizol (16096020, Invitrogen, Waltham, MA, USA). Subsequently, 1 µg of
the total RNA was reverse-transcribed into cDNA with a reverse transcription kit
(RR047A, Takara, Japan). To quantify the mRNA expression levels of CEBPB
and IL1B, cDNA samples were subjected to qRT-PCR amplification following
the TaqMan gene expression assay protocol (Applied Biosystems, Foster City, CA,
USA). Three independent experiments were conducted for each sample to
statistically compare differences between groups. The PCR program was set as
follows: 95 °C for 10 minutes, followed by 35 cycles of 95 °C
for 15 seconds, 60 °C for 30 seconds, and 72 °C for 45 seconds.
Each qRT-PCR reaction was performed in triplicate. The
2-ΔΔCt method was used to calculate the fold change in
gene expression between the experimental and control groups, where
Cells and tumor tissue were divided into experimental and control groups according to the
experimental requirements and then harvested. Proteins were lysed with RIPA
buffer from Thermo Fisher Scientific, and protease inhibitors from Roche were
added. Protein concentrations were determined using the Pierce protein assay kit
also from Thermo Fisher Scientific. Proteins were separated using SDS-PAGE and
transferred to PVDF membranes (Millipore, Bedford, PA, USA). Membranes were then incubated with
primary antibodies against IL1B (1:1000, Rabbit, Abcam, Cambridge, UK, ab216995),
CEBPB (1:1000, Abcam, ab32358), GAPDH (1:3000, Rabbit, Abcam, ab181602),
and
The dataset GSE87371, containing protein-coding gene expression data from DLBCL patients, was selected for WGCNA construction. The top 50% of genes with the largest absolute median difference were screened to establish a co-expression network and generate a gene expression matrix. Sample hierarchical clustering was performed to detect and exclude outlier samples to construct a standard scale-free network. Modules were detected through dynamic tree cutting, with a minimum size requirement of 50 for each module. Modules with very similar eigengene clustering were combined based on a threshold of dissimilarity less than 0.25, and the relationship between module eigengenes and CEBPB expression in DLBCL was calculated.
Cell proliferation was evaluated by employing the cell counting
kit-8 (CCK-8) (Dojindo Molecular Technologies, Inc., Kawasaki, Japan). Cells in the logarithmic
growth phase were diluted to a concentration of 5
For cell cycle analysis, treated cells were fixed in 75% ethanol at 4 °C overnight, washed with PBS, and stained with 400 μL of propidium iodide (PI) staining solution (50 μg/mL, P4170, Sigma-Aldrich, USA) combined with 100 μL of RNase A (100 μg/mL, RNASEA-RO, Sigma-Aldrich, USA). This mixture was incubated at room temperature for 30 minutes in the dark. The samples were analyzed using a FACSCalibur flow cytometer (BD Biosciences, San Jose, CA, USA), and cell cycle phases were quantified using ModFit LT software (v5.0, Verity Software House, Topsham, ME, USA).
Various statistical methods were employed to process and interpret data in this
study. Differential expression analysis was first conducted on data from the GEO
database to compare the expression differences of the CEBPB gene between
normal and DLBCL tissues. Survival analysis was conducted to investigate the
correlation between high CEBPB expression and prognosis in patients with
DLBCL. This analysis typically included the use of Kaplan–Meier survival curves
and log-rank tests to assess survival disparities among different groups. The
protein expression levels of CEBPB and IL1B were examined via
chemiluminescence utilizing Bio-Rad technology with Image J. GraphPad Prism (7.0,
GraphPad Software, San Diego, CA, USA) was used for statistical analyses. Results
are presented as mean
The high expression of CEBPB in DLBCL represents a notable observation.
Differential expression analysis on the GSE56315 dataset revealed a significant
upregulation of the CEBPB gene in DLBCL tissues (T = 16.64, p =
2.48
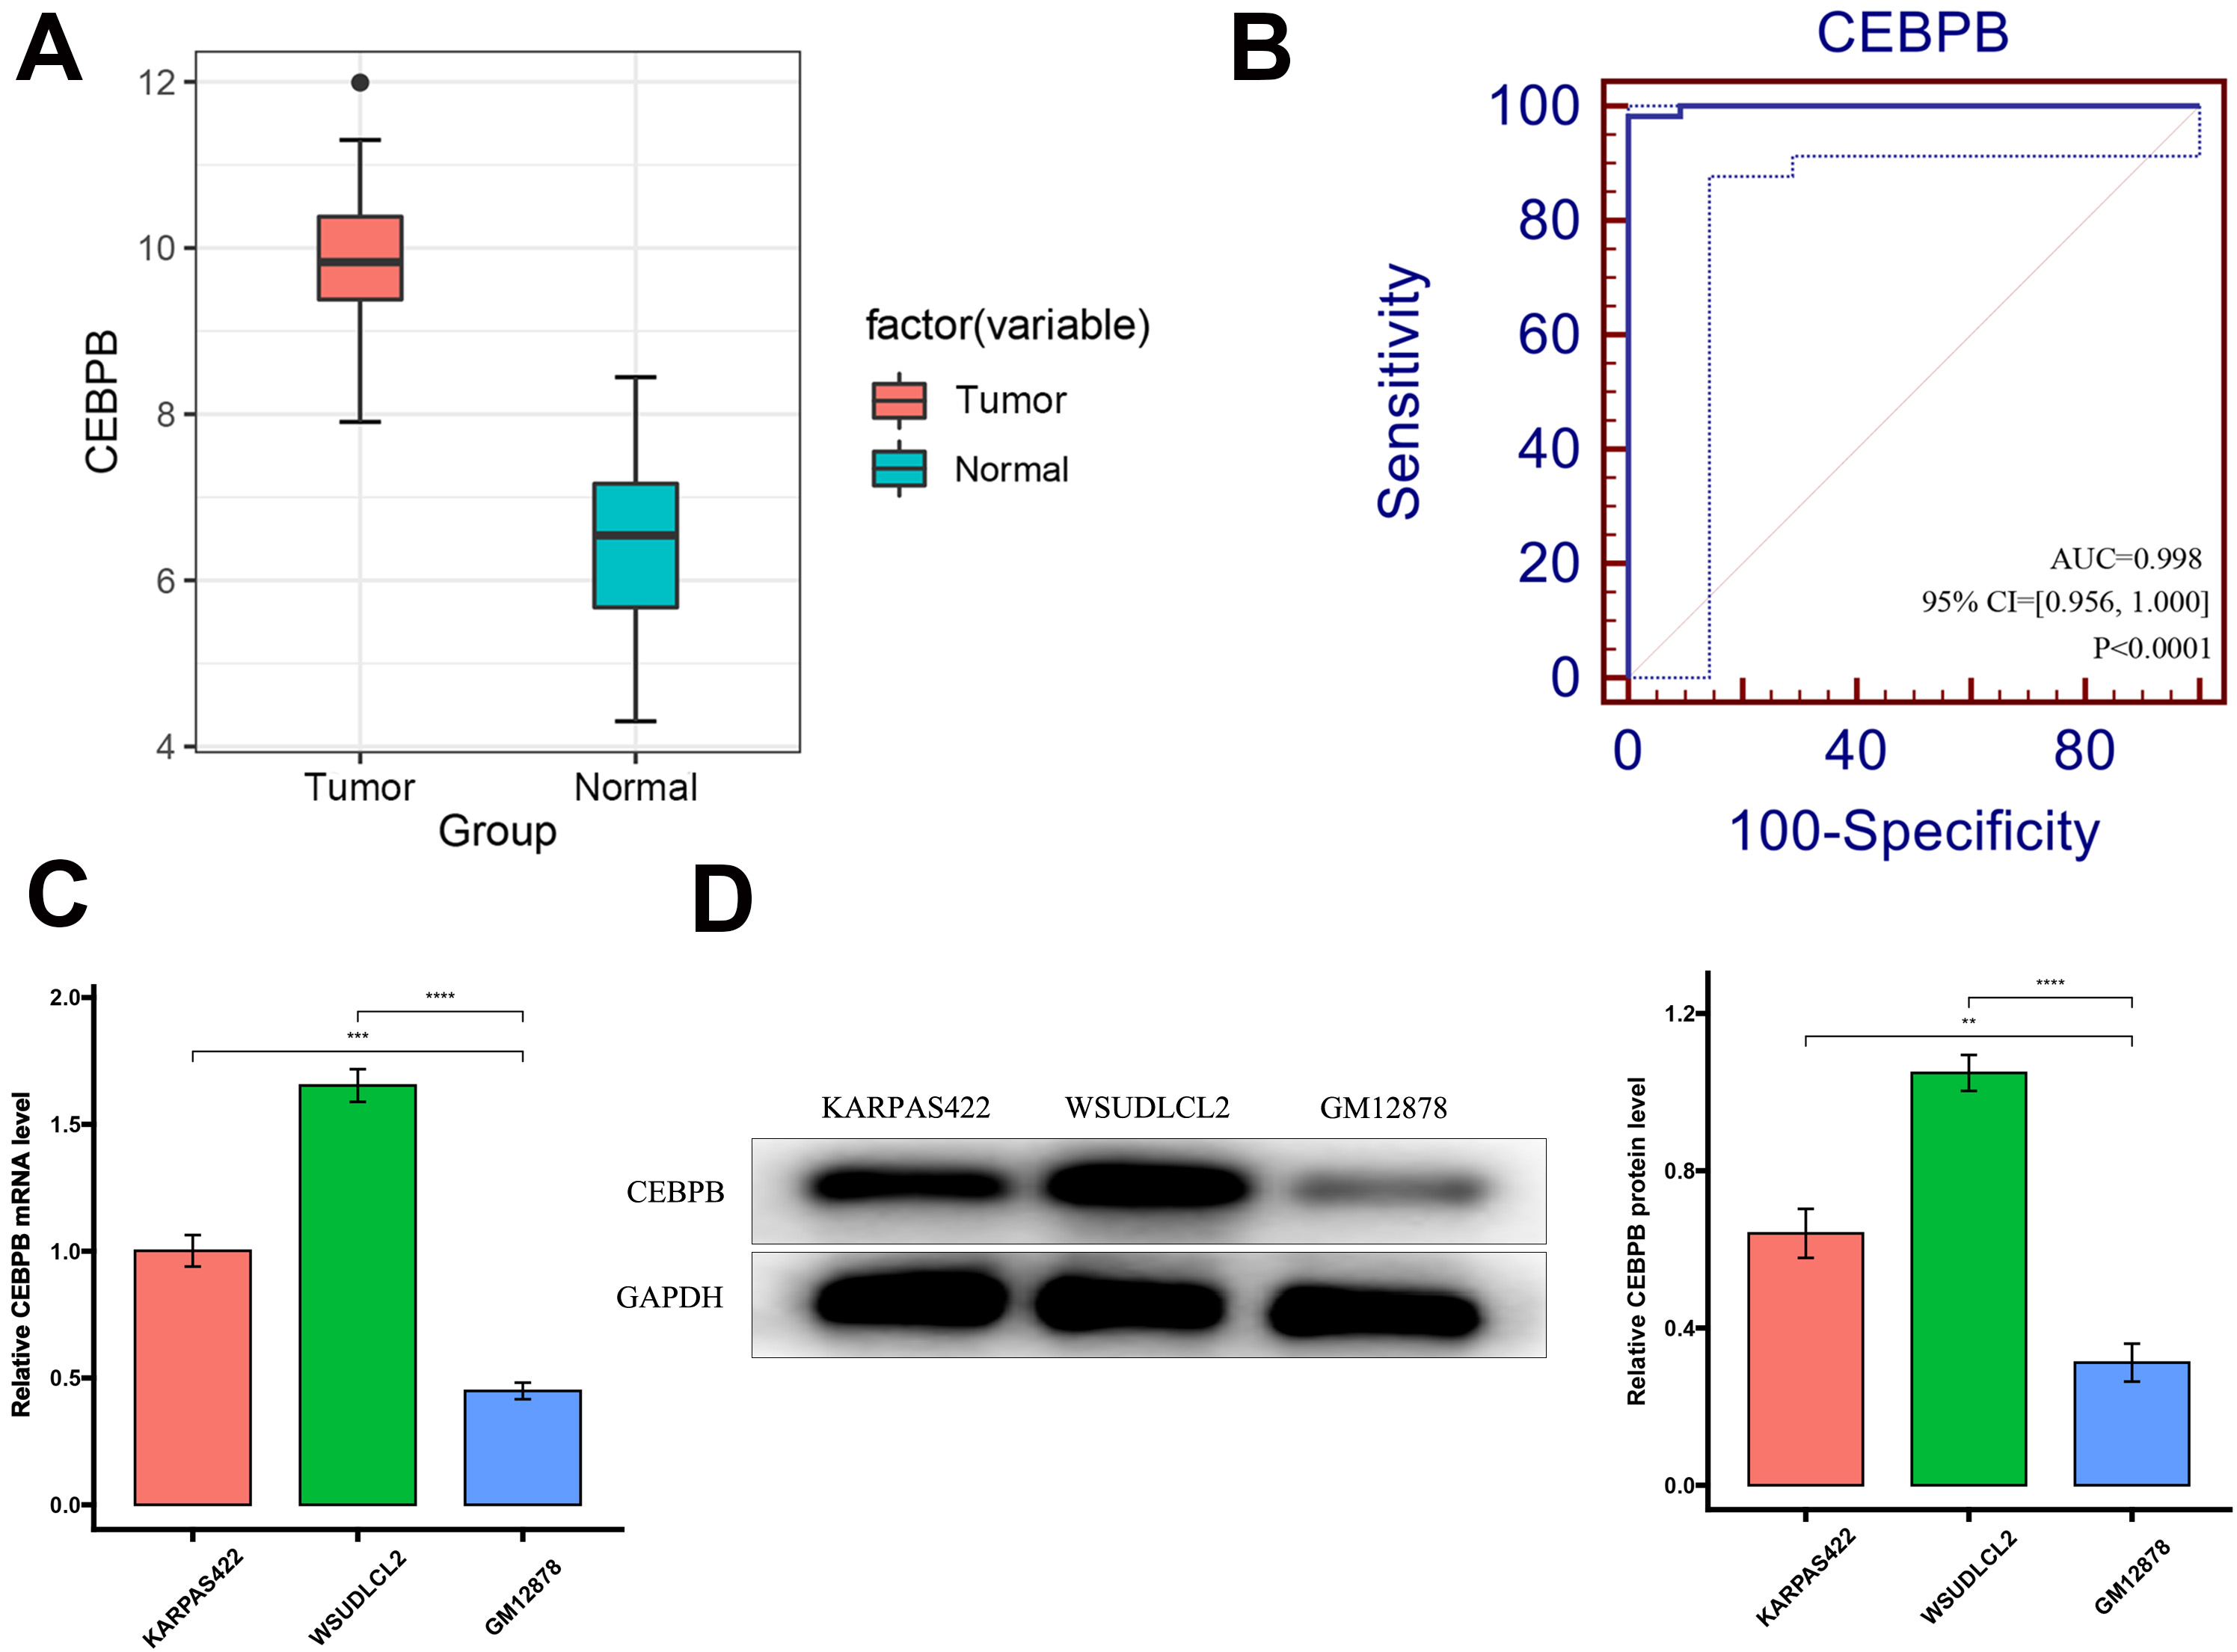 Fig. 1.
High expression of CCAAT/enhancer-binding protein beta (CEBPB) in diffuse large B-cell lymphoma
(DLBCL) and its significance as a diagnostic key gene. (A) Expression levels of
CEBPB in DLBCL cases versus normal tissues.
The survival analysis presented strong evidence of a significant association
between elevated CEBPB expression and unfavorable prognosis in patients
with DLBCL. Within the GSE87371 dataset, it was observed that patients
demonstrating elevated levels of CEBPB expression experienced notably
reduced overall survival (OS) and progression-free survival (PFS) (OS: hazard ratio (HR) = 1.51,
95% confidence interval (CI) = 1.11–2.05, p
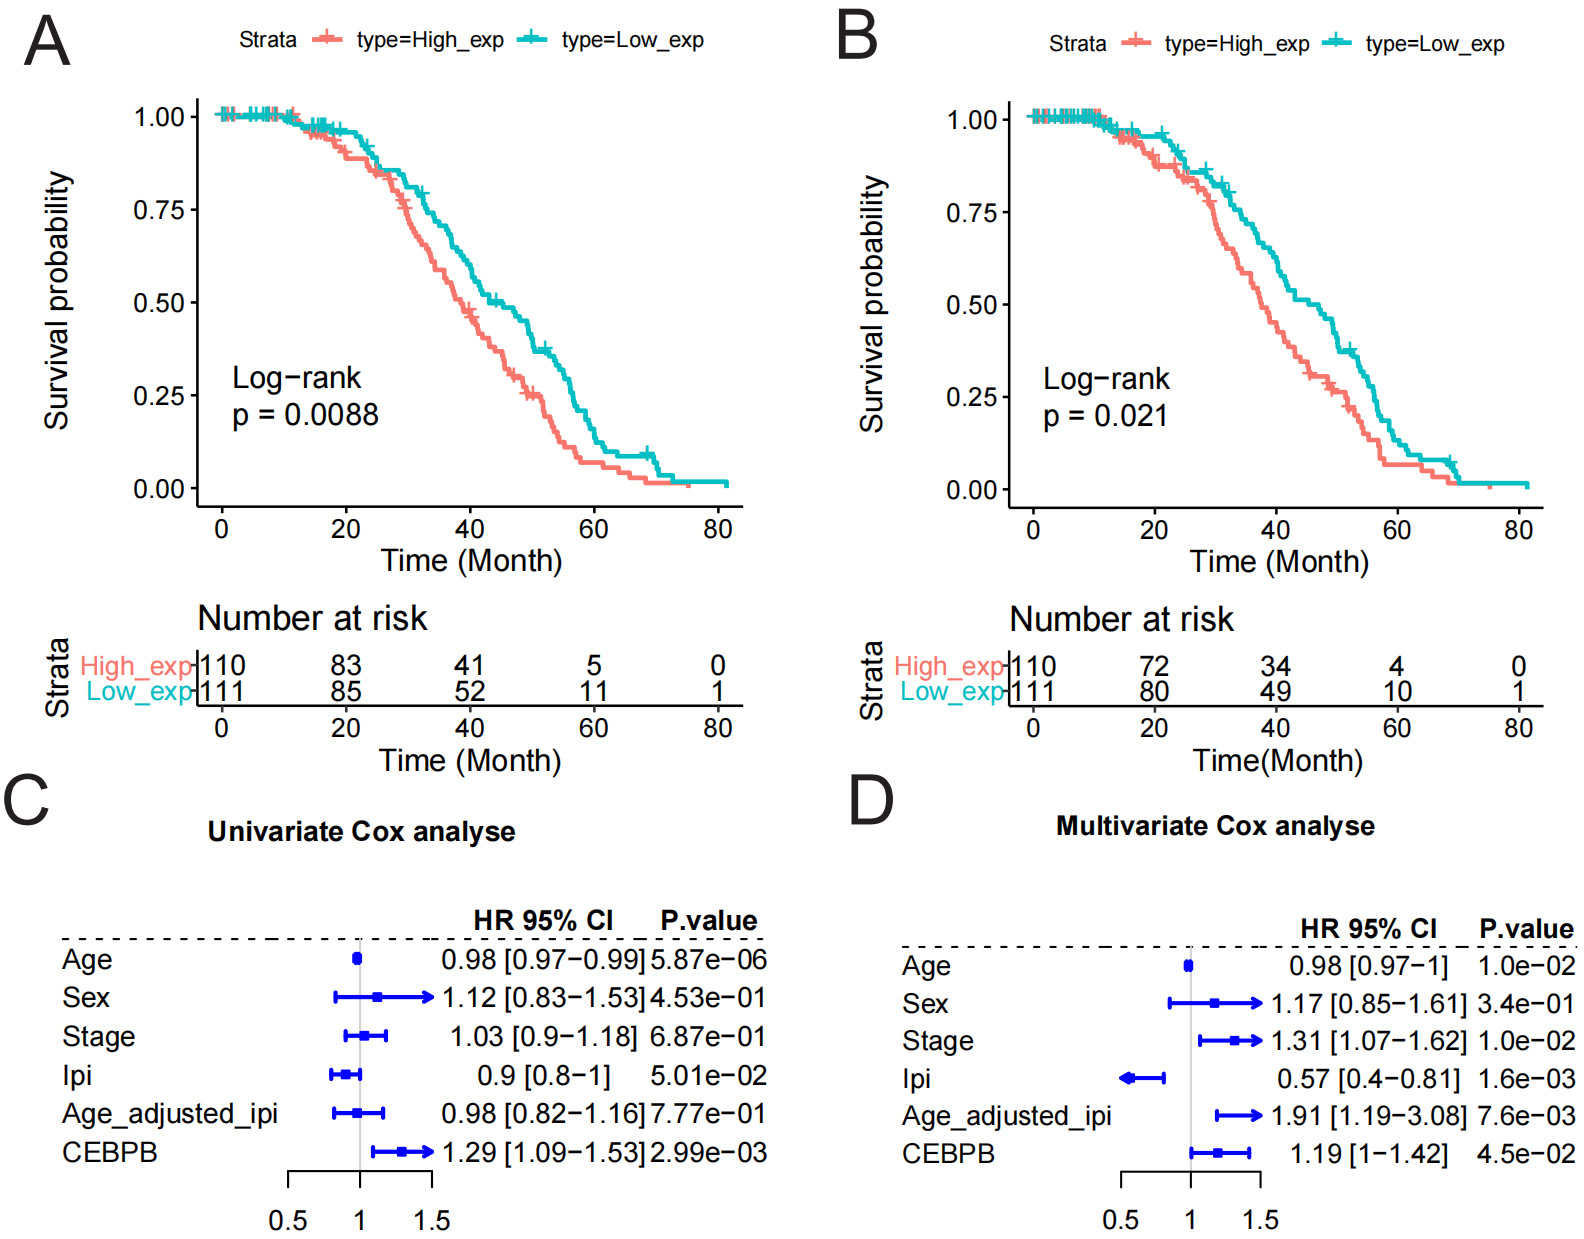 Fig. 2.
Survival analysis of CEBPB in DLBCL. (A,B) Kaplan–Meier survival curves with the x-axis representing time and the y-axis representing survival probability. The red and blue curves show the survival probability over time for high and low CEBPB expression groups, respectively. The hazard ratio (HR) value greater than 1 indicates a higher risk of events in one group than the other, while the HR value less than 1 indicates a lower risk. (C,D) Univariate and multivariate Cox analyses with variables including age, gender, etc., with CEBPB showing higher HR values, indicating an increased risk of DLBCL.
Our cell experiment results further confirmed the functional role of CEBPB in DLBCL. Through shRNA-mediated knockdown of CEBPB, we observed a significant inhibition of DLBCL cell proliferation via qRT-PCR and Western blot analyses (Fig. 3A,B), indicating CEBPB’s key role in promoting cell proliferation. The results of the CCK-8 assay demonstrated a significant inhibition in DLBCL cell proliferation following CEBPB knockdown (Fig. 3C,D). Flow cytometry analysis demonstrated that downregulation of CEBPB resulted in the accumulation of cells at the G0/G1 phase while decreasing the population of cells in the S/G2 phase (Fig. 3E). These results suggest that CEBPB supports the pathophysiological process of DLBCL by influencing the cell cycle, thereby promoting cell proliferation.
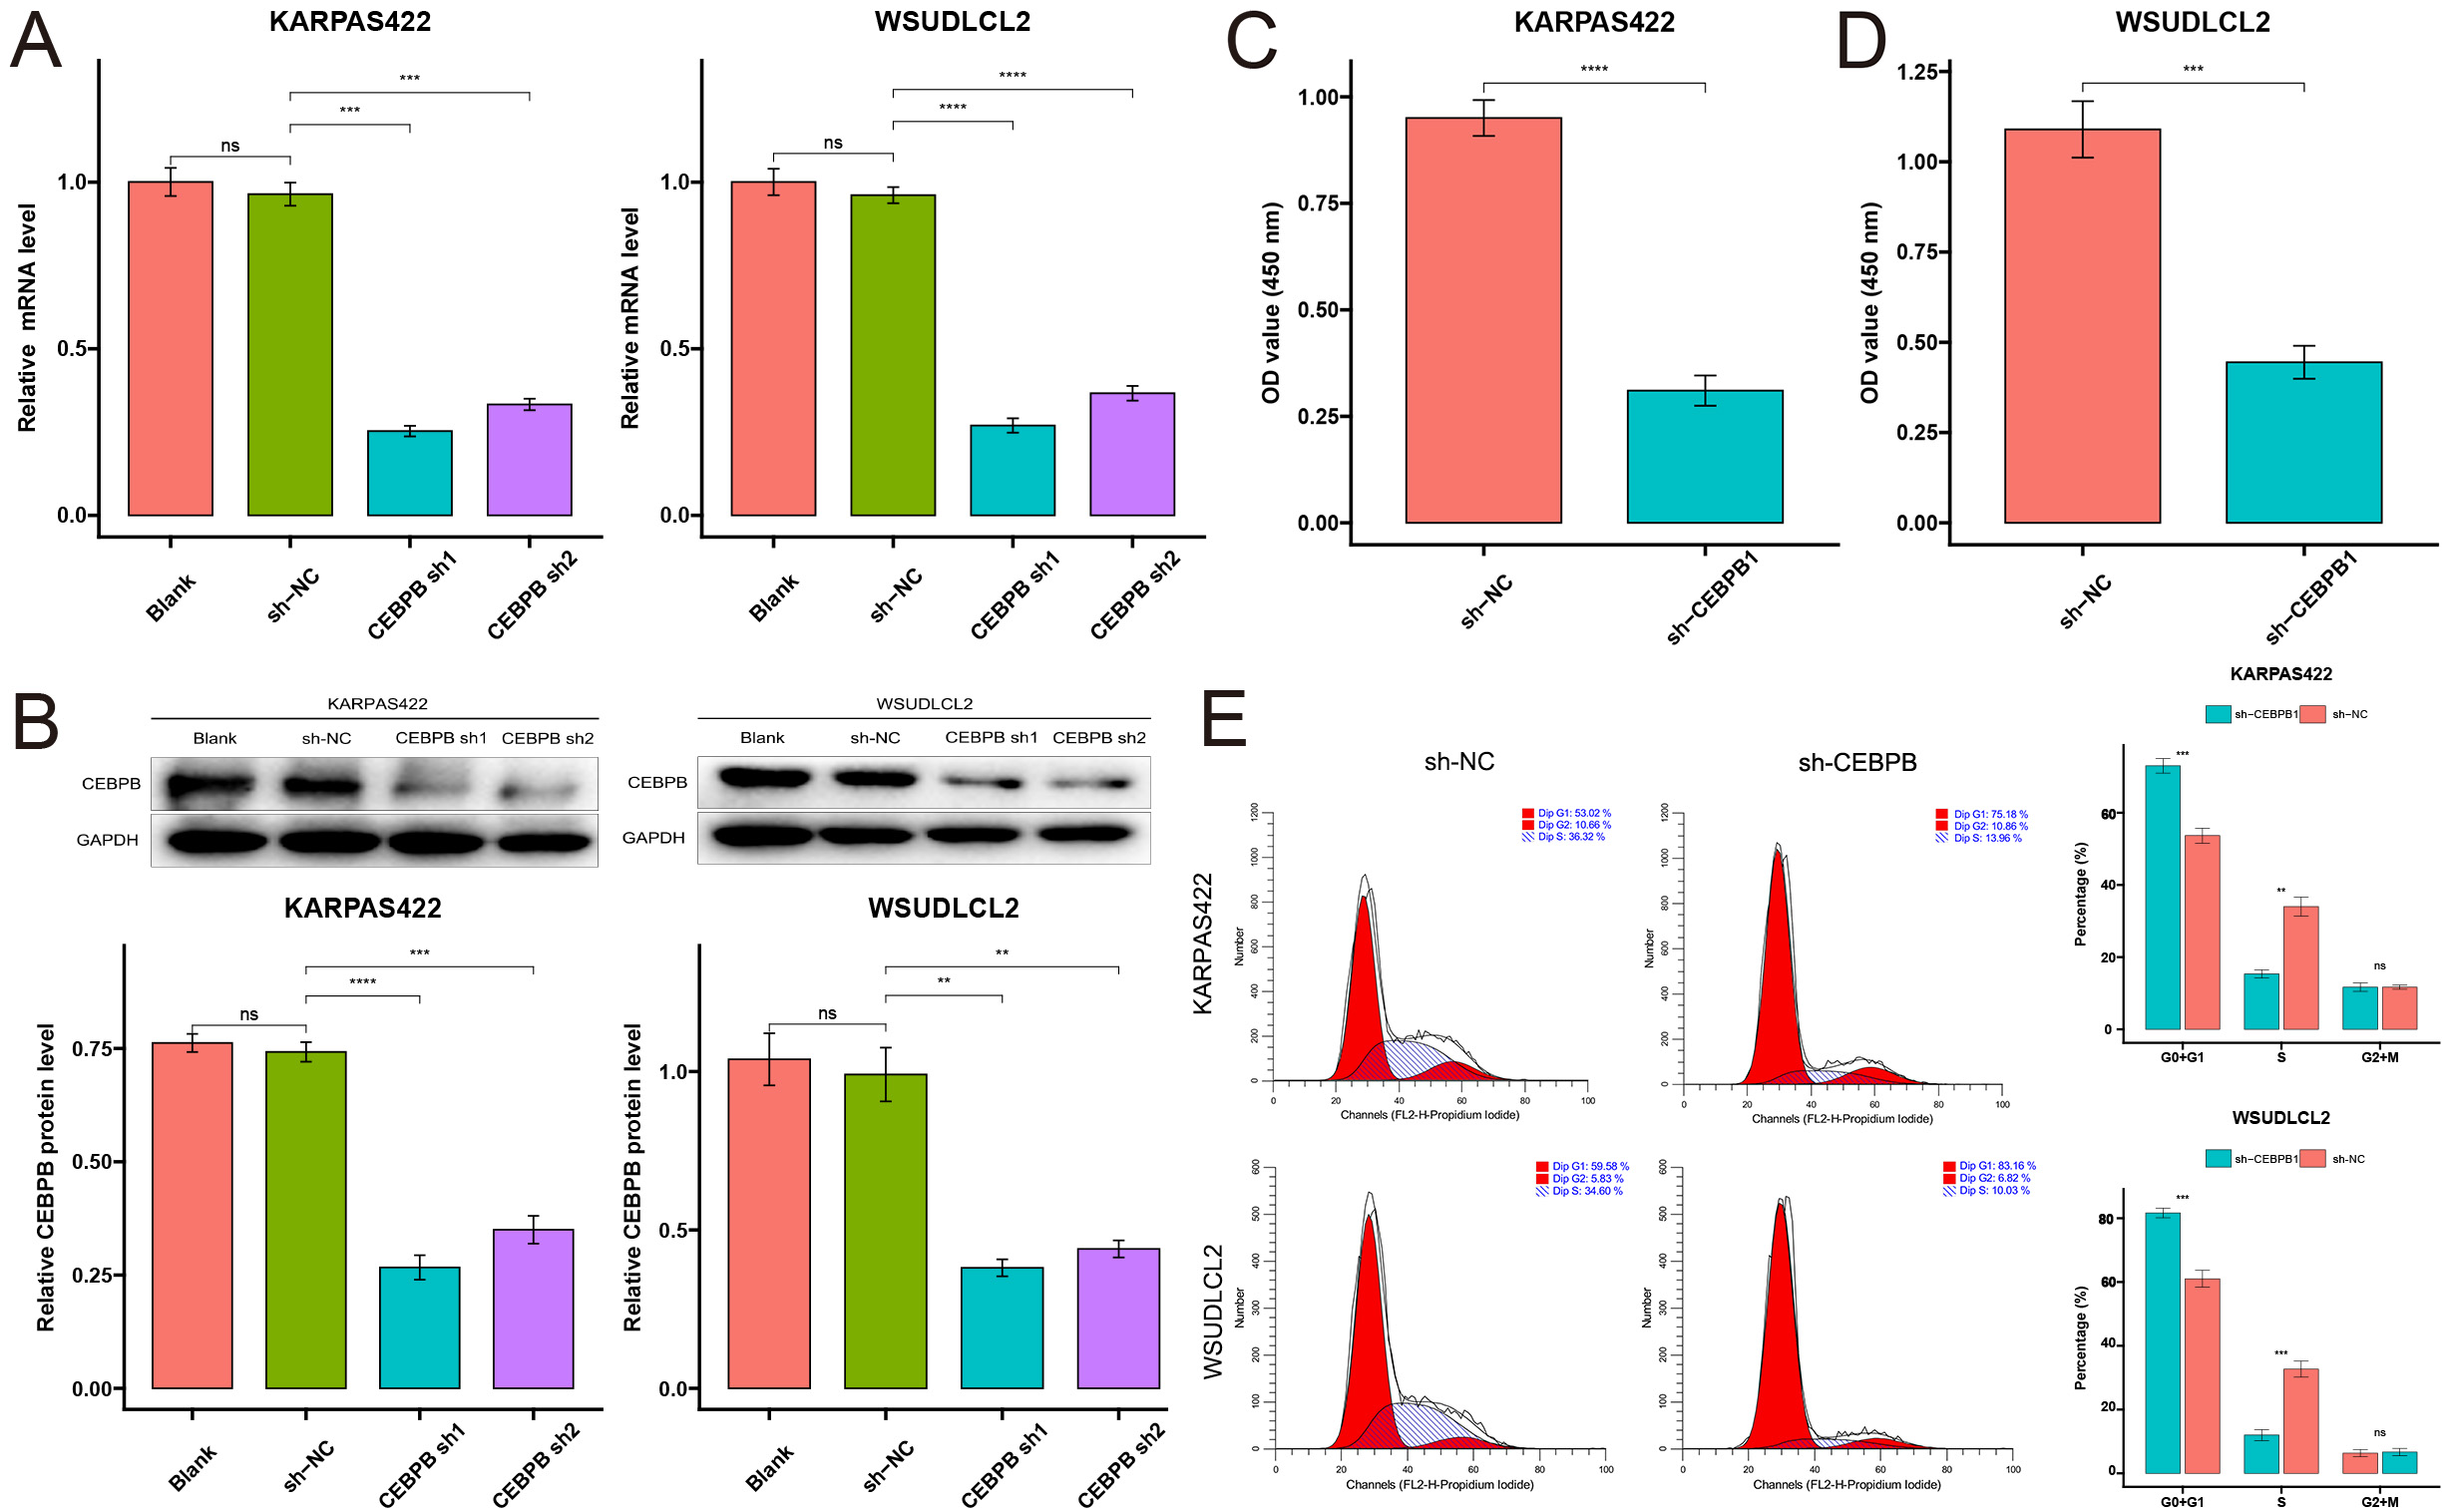 Fig. 3.
CEBPB promotes in vitro proliferation in DLBCL cells.
(A) qRT-PCR analysis of CEBPB gene silencing efficiency in the blank,
control, CEBPB sh1, and CEBPB sh2 groups. (B) Western blot analysis of
CEBPB protein expression levels in the same groups. (C,D)
Cell counting kit-8 (CCK-8) assay results show the absorbance values of the
CEBPB knockdown group compared to the control group, reflecting the rate
of tumor cell proliferation (n = 3). (E) Flow cytometry analysis of cell cycle status in each
group (n = 3). Asterisks denote statistical significance: **p
WGCNA is a biological approach utilized for examining gene expression profiles,
enabling the grouping or organization of genes exhibiting comparable expression
patterns [41]. This method allows for the exploration of the correlation between
gene modules and traits, such as clinical characteristics, particularly when
genes with similar biological functions are clustered within the same module [42, 43]. Utilizing WGCNA, we systematically explored gene expression patterns,
focusing on modules associated with CEBPB. Initially, two outlier
samples were removed from the GSE87371 dataset, ensuring that 221 samples were
included in the WGCNA analysis, successfully identifying gene modules related to
CEBPB (Fig. 4A). A soft-thresholding power
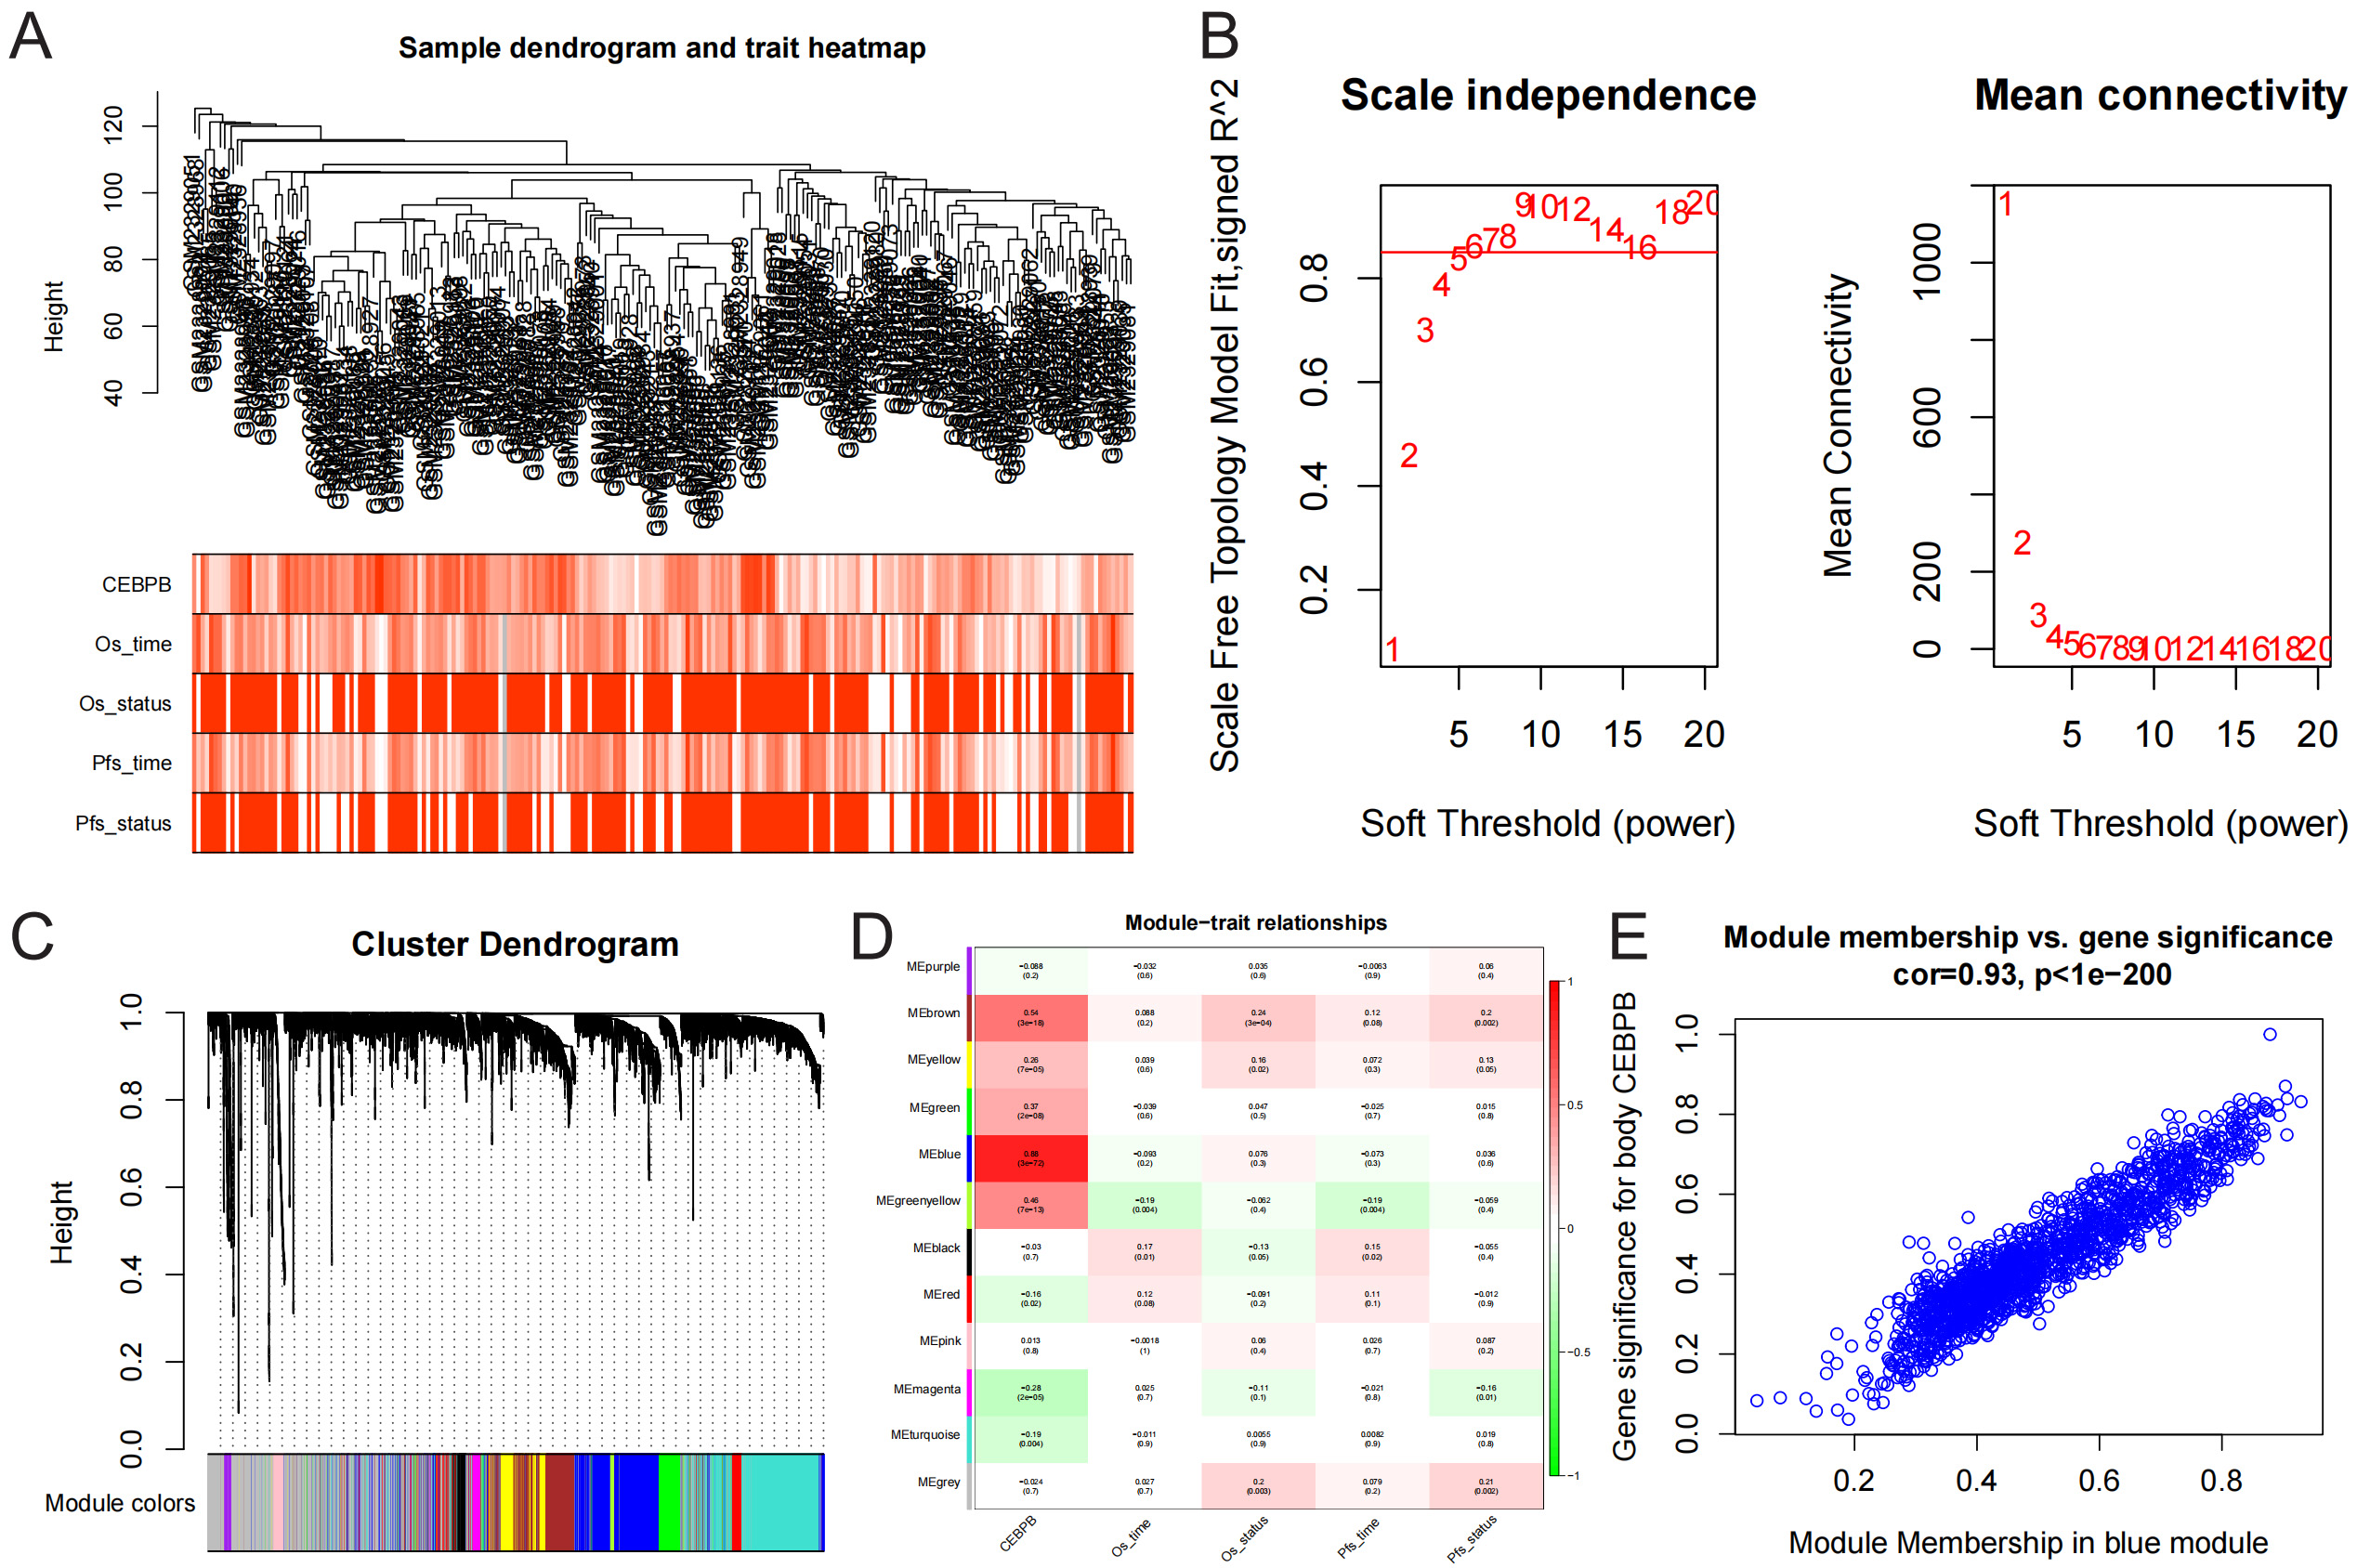 Fig. 4.
Identification of CEBPB target genes. (A) Heatmap of GSE87371
samples and traits. (B) Scale-free fit index analysis results, with a scale-free
R2 = 0.850 at
Initial analysis of IL1B expression in DLBCL patients revealed a
significant upregulation in the GSE56315 dataset (T = 9.49, p = 2.50
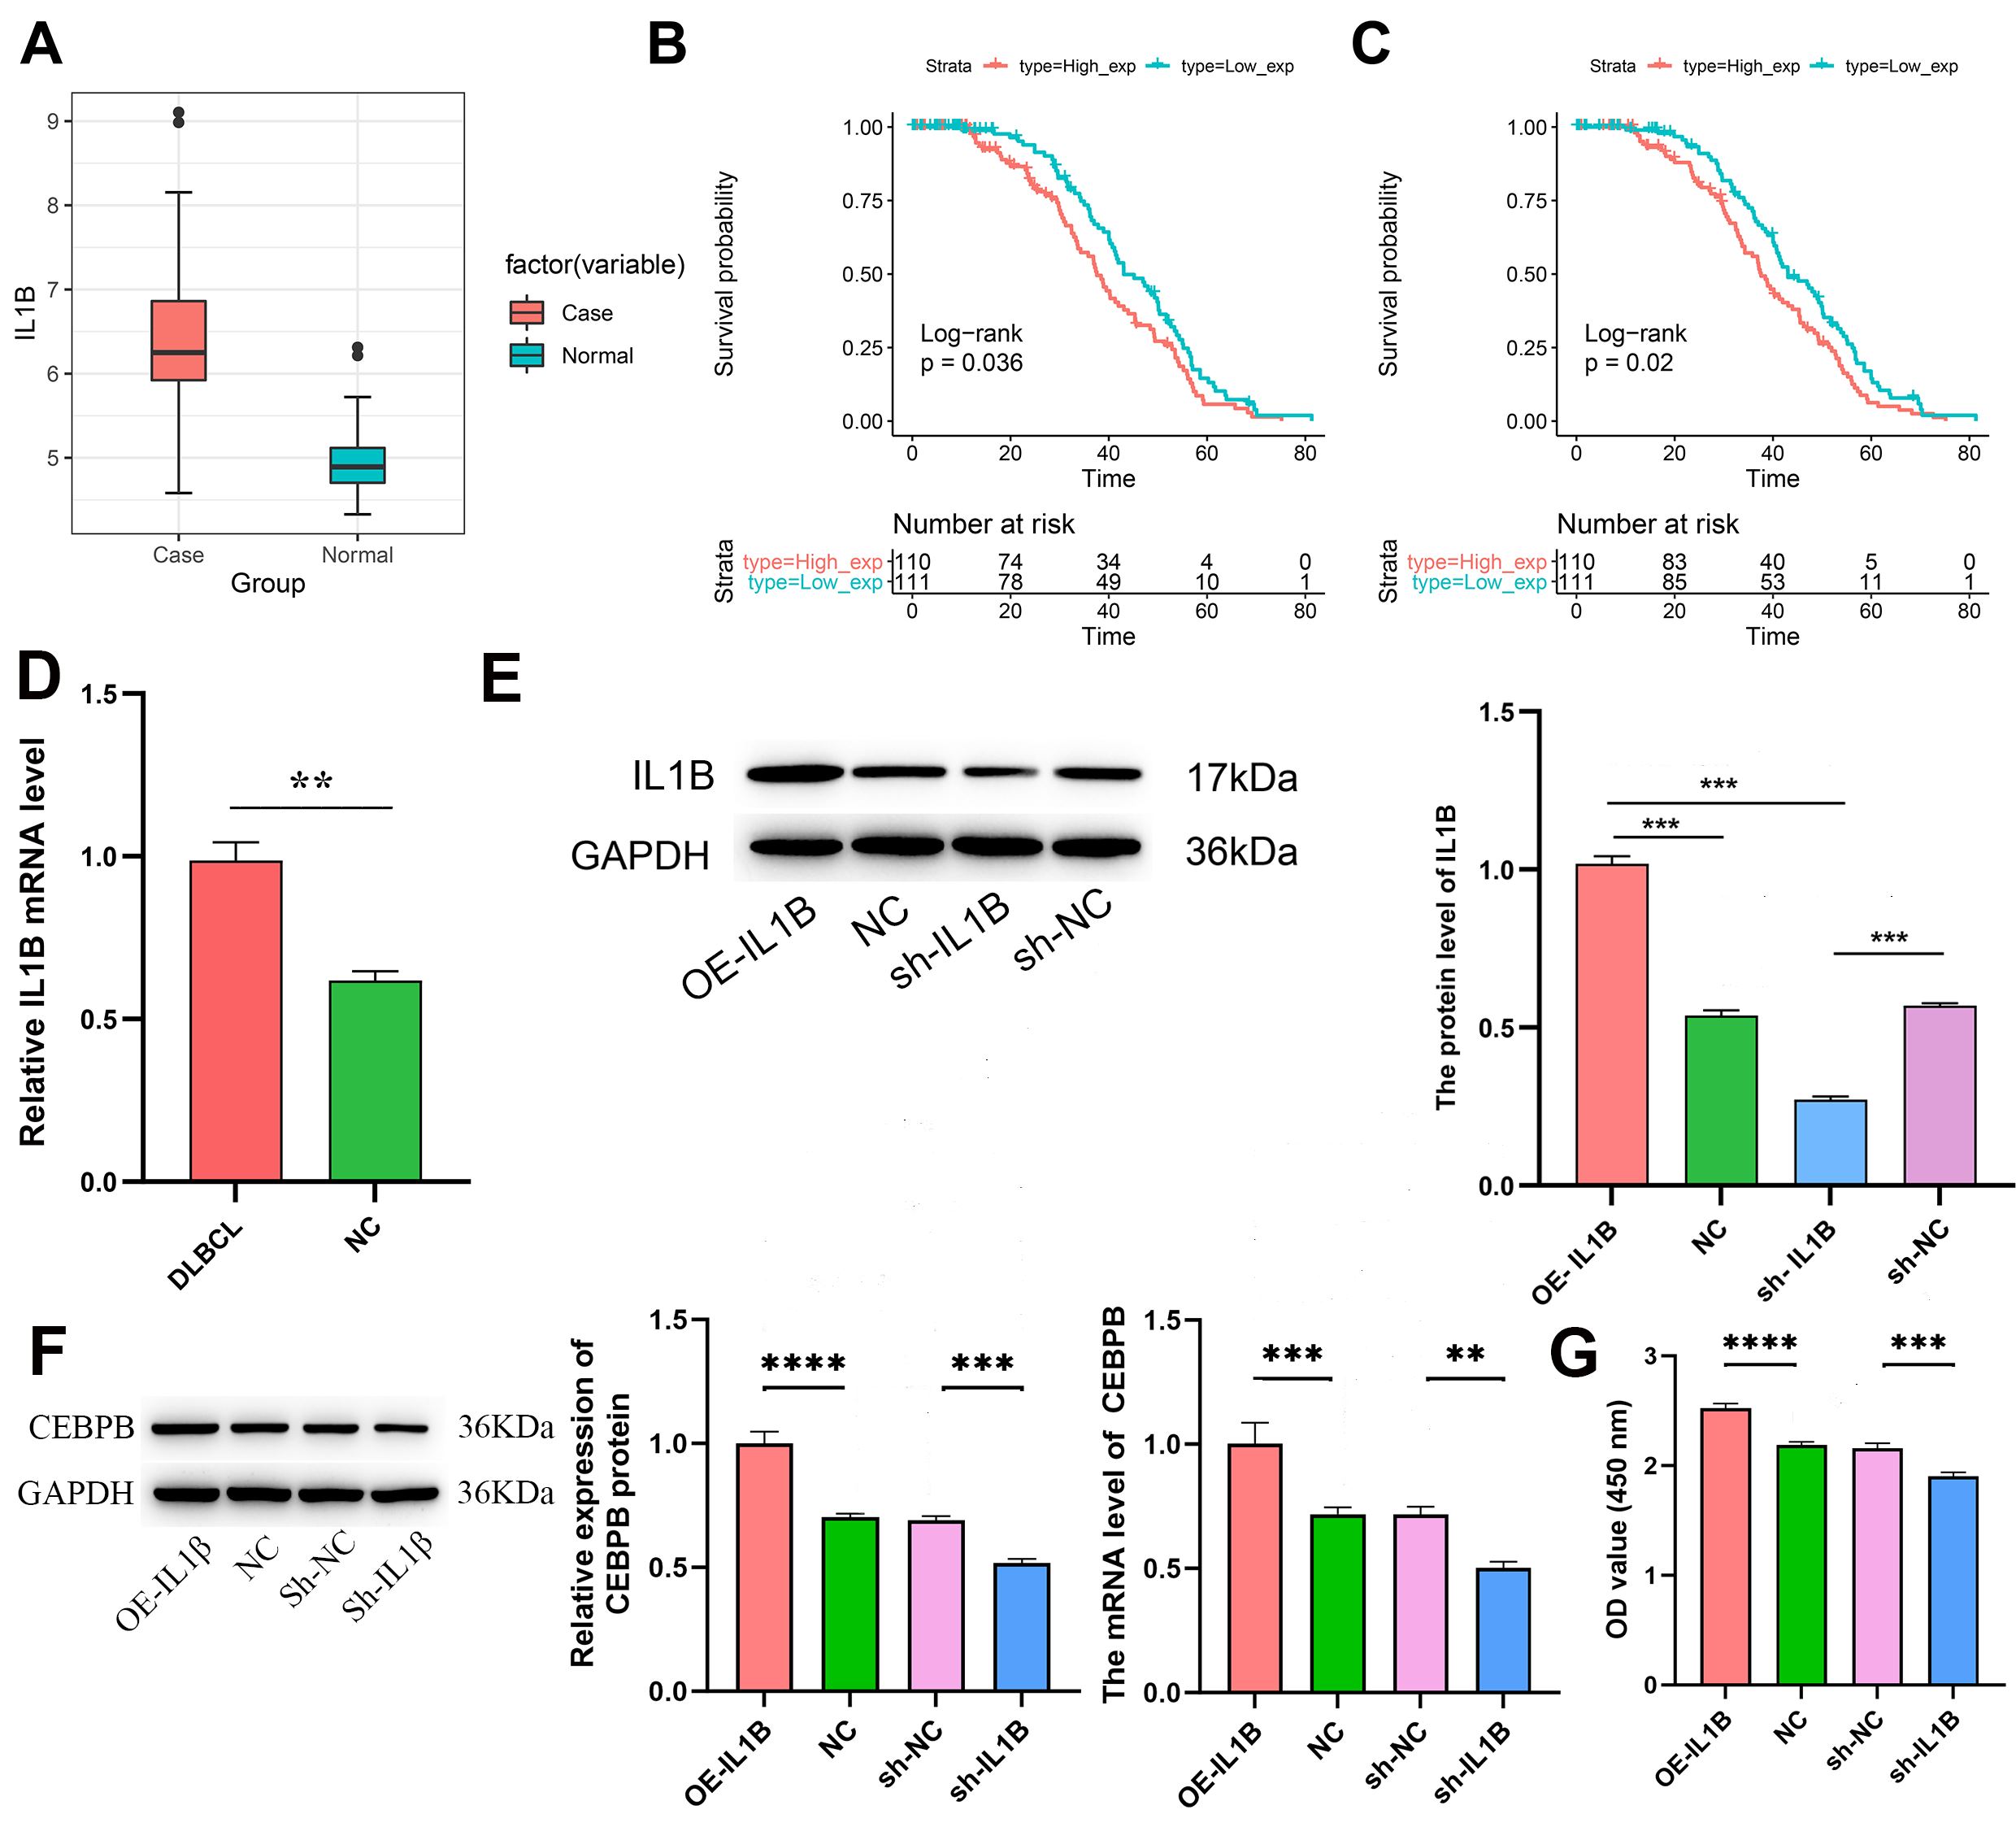 Fig. 5.
IL1B is a target gene of CEBPB. (A) Expression levels of
IL1B in DLBCL cases versus normal tissues.
Assessments were conducted using the CCK-8 assay to evaluate DLBCL cell survival, focusing on KARPAS422 tumor cells. We found that knocking down CEBPB in tumor cells reversed cell proliferation induced by recombinant interleukin 1 beta (Fig. 6A). To explore the therapeutic potential of targeting IL1B in a DLBCL model, we introduced macrophages with silenced IL1B (sh-IL1B macrophages) into the bloodstream of DLBCL-bearing mice and monitored tumor growth. Notably, tumors in mice treated with sh-IL1B macrophages were significantly smaller compared to those in the control group, underscoring the potential of IL1B silencing in macrophages to inhibit tumor growth in DLBCL (Fig. 6B). This strategy showcases the distinct roles wherein the manipulation of CEBPB and IL1B occurs within tumor cells and macrophages, respectively, to exert therapeutic effects against DLBCL.
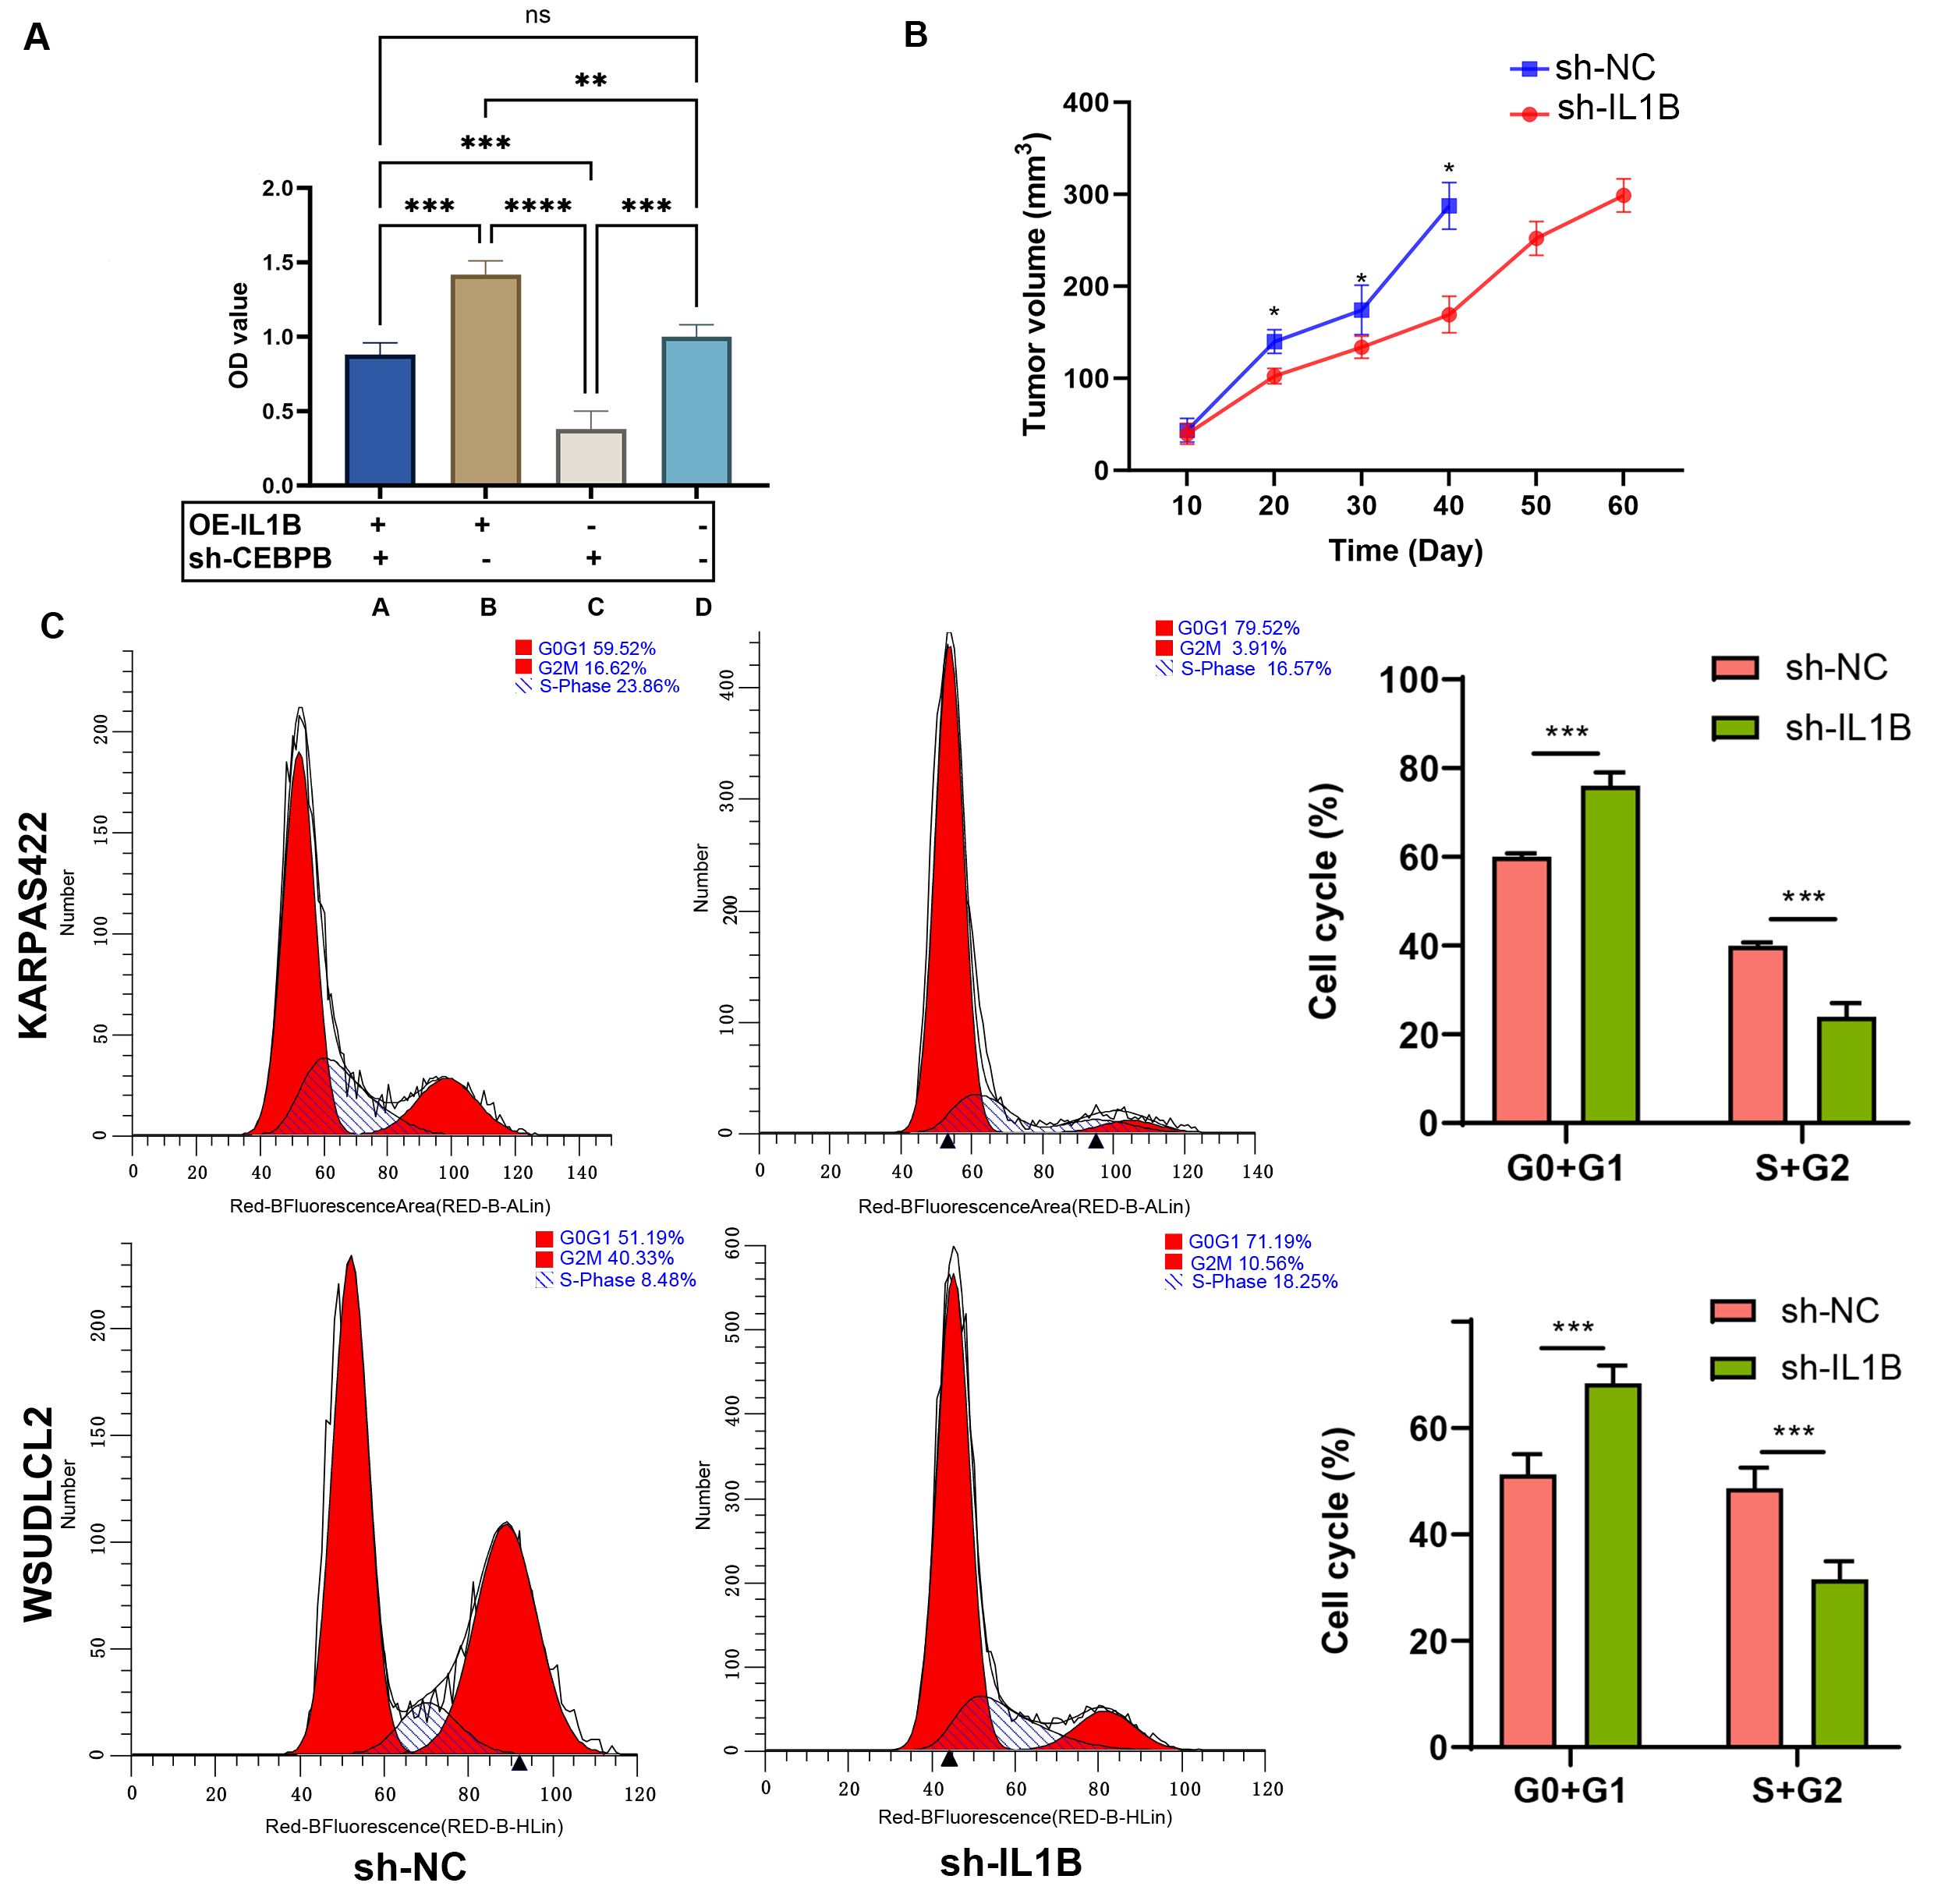 Fig. 6.
CEBPB promotes DLBCL cell proliferation in an IL1B-dependent
manner. (A) CCK-8 assay of tumor cells with and without IL-1B overexpression and CEBPB silencing (A: recombinant IL1B+sh-CEBPB; B: recombinant IL1B+sh-NC; C:
OE-NC+sh-CEBPB; D: OE-NC+sh-NC). (B) Comparison of tumor volumes between sh-NC and
sh-IL1B groups (n = 5). (C) Flow cytometry analysis of cell cycle distribution in sh-NC versus
sh-IL1B groups. *p
Moreover, flow cytometry analysis revealed an elevation in cells at the G0/G1 phase and a reduction in the S/G2 phase cells within the sh-IL1B group, suggesting a deceleration in the cell cycle progression (Fig. 6C). These results support the potential targeting of IL1B in DLBCL treatment, mainly through regulating CEBPB.
Western blot analysis of lymphatic B cells from IL1B-overexpressing mice, control mice, and blank group mice on day 40 revealed that CEBPB protein levels were higher in IL1B-overexpressing mice compared to normal B lymphocytes (Fig. 7A). To further verify IL1B’s potential role in DLBCL treatment, OE-IL1B macrophages were infused into the bloodstream of DLBCL mice, monitoring tumor growth. The tumors in the control macrophage group were smaller compared to those in the OE-IL1B group, suggesting that the overexpression of IL1B enhances the growth of DLBCL tumors (Fig. 7B). This further supports IL1B as a potential therapeutic strategy in DLBCL, mainly through regulating CEBPB.
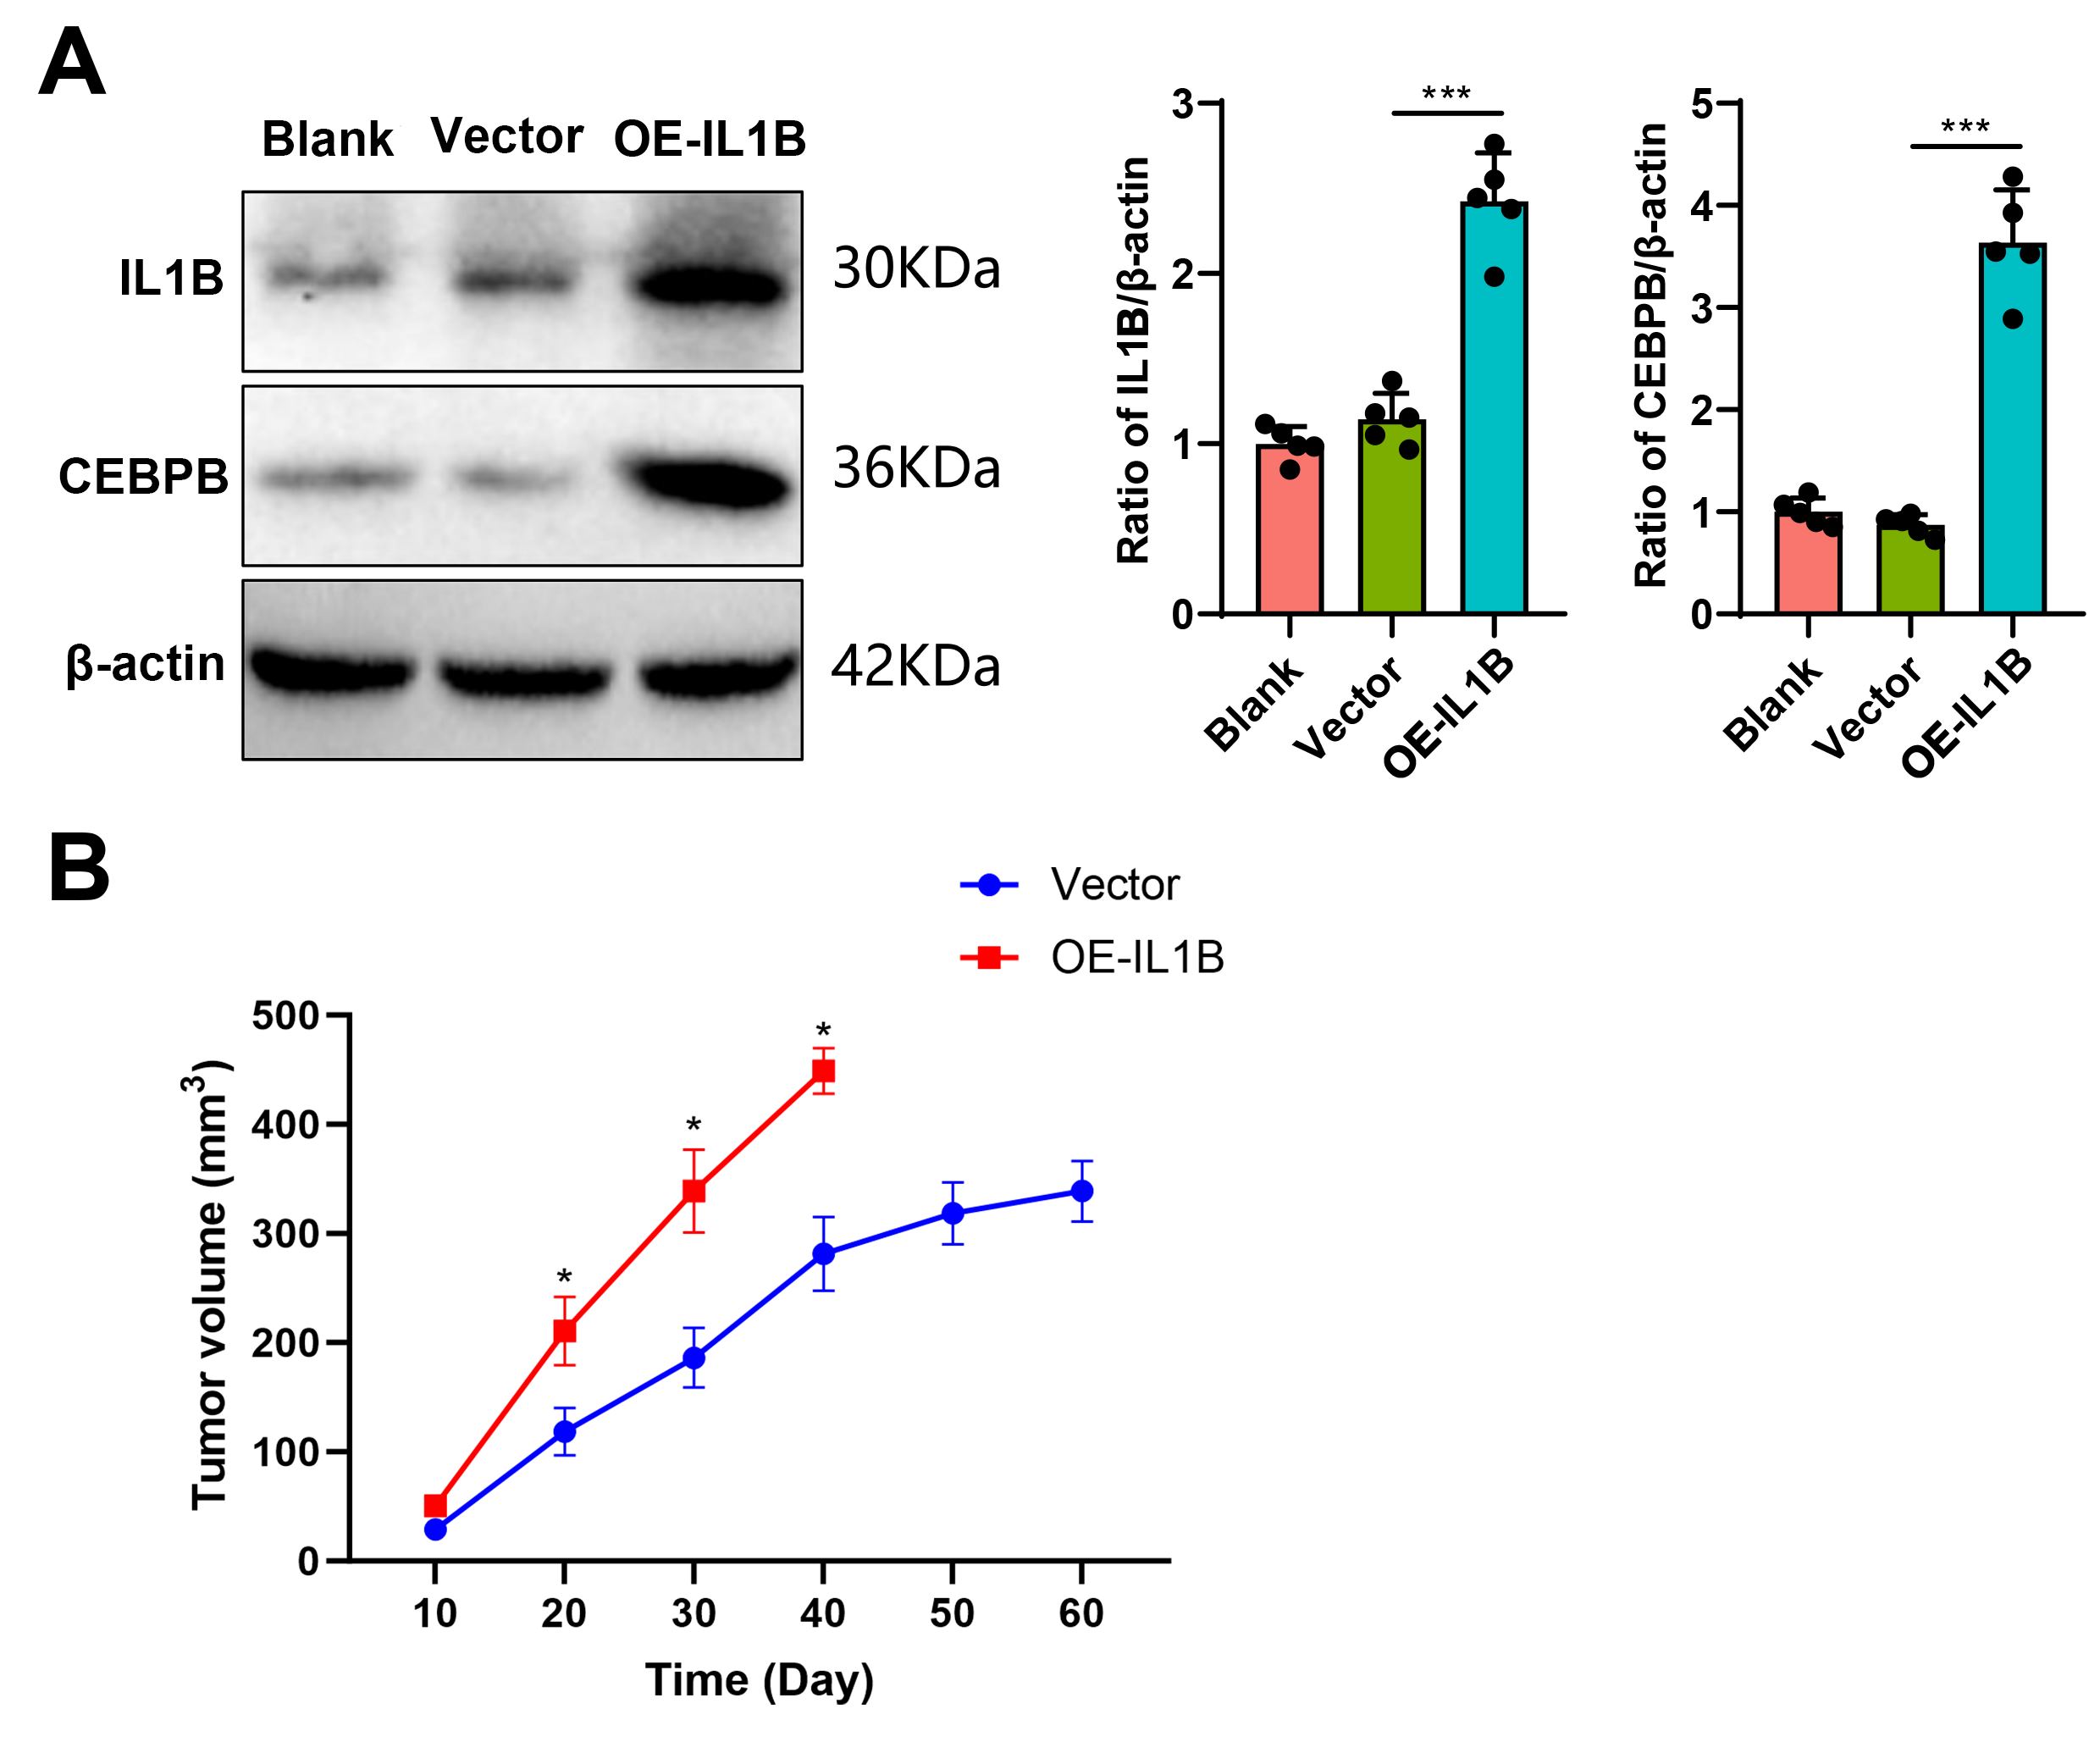 Fig. 7.
IL1B overexpression elevates CEBPB protein levels and promotes
DLBCL tumor growth. (A) Western blot bands and statistical analysis showing CEBPB protein expression in IL1B-overexpressing mice,
interference control mice, and blank mice (n = 5). (B)
Comparison of tumor diameters between IL1B overexpression and vector
control groups (n = 5). *p
DLBCL displays significant heterogeneity, with distinct subtypes categorized
according to the cell of origin [46, 47]. However, approximately 10–15% of
cases remain unclassifiable [2, 48]. The ABC subtype of DLBCL has a poorer
prognosis following immunochemotherapy, primarily due to its reliance on
constitutive activation of NF-
This study focuses on potential oncogenes with diagnostic and prognostic relevance. The GSE dataset analysis revealed that CEBPB and IL1B are overexpressed in DLBCL samples, with elevated expression levels in human aberrant lymphoblastoid B cells. Univariate and multivariate Cox analyses examined whether CEBPB expression constitutes an independent predictive biomarker for OS in DLBCL patients. CCK-8 assays indicated that the knockdown of CEBPB significantly reduced DLBCL cell proliferation. Scatter plots of GS vs. MM in the WGCNA blue module elucidated IL1B as a target gene of CEBPB. Overexpression and knockdown experiments of CEBPB in DLBCL cells confirmed IL1B as its intended target. Finally, rescue experiments demonstrated the regulatory mechanism between CEBPB and IL1B.
Within the IL-1 cytokine family, seven molecules, including IL1B and IL-1A, exhibit antagonistic properties [54, 55]. Evolutionary studies indicate that vertebrates starting from fish possess only a single IL-1 gene [56, 57, 58]. The processing of IL1B requires activation of the inflammasome, a multiprotein complex activated by members of the NOD-like receptor family [59, 60, 61]. Caspase 1 is essential for the cleavage and activating IL1B [62]. As another pro-inflammatory cytokine, IL1B’s expression in primary tumors has been identified and may serve as a biomarker for identifying breast cancer patients more likely to undergo bone metastasis [63, 64]. This research suggests IL1B as a promising biomarker and a potential therapeutic target in DLBCL.
This study reveals the significant roles of CEBPB and IL1B in DLBCL, providing new biomarkers for diagnosing and treating DLBCL. By analyzing the expression patterns of CEBPB and IL1B and their impact on DLBCL cell proliferation, this research not only enhances our understanding of the pathophysiology of DLBCL but also lays a scientific foundation for developing targeted therapeutic strategies against these molecules. Specifically, the expression levels of CEBPB correlate with OS in DLBCL patients, suggesting that CEBPB could be an independent predictor of disease prognosis. Moreover, the role of IL1B underscores the critical involvement of inflammatory pathways in developing DLBCL, offering a theoretical basis for incorporating anti-inflammatory treatment as part of DLBCL therapy. Therefore, the findings of this study promise to improve the clinical management of DLBCL by providing more precise diagnostic tools and targeted treatment approaches to enhance patient survival rates and quality of life.
While this study has made notable contributions by shedding light on the molecular mechanisms of DLBCL and proposing novel therapeutic approaches, it also exhibits several limitations. Firstly, it primarily relies on bioinformatics analysis and in vitro experiments without validation in a large cohort of clinical samples. Thus, the clinical relevance and applicability of the findings require further confirmation in a broader patient population. Secondly, while we explored the roles of CEBPB and IL1B in DLBCL, the interactions between these molecules and the complex pathophysiology of DLBCL likely involve multiple signaling pathways and regulatory networks. Hence, our study might only touch upon a fraction of the molecular mechanisms of DLBCL. Lastly, the study did not thoroughly investigate the safety and efficacy of potential therapeutic strategies targeting CEBPB and IL1B, a crucial step in translating essential research findings into clinical applications.
Future research should focus on overcoming the current study’s limitations and
further exploring the potential applications of CEBPB and IL1B
in DLBCL treatment. Firstly, the amount of IL1B secreted by macrophages
in tumor samples was not properly compared with that of normal macrophages. In
addition, the macrophage medium used in this study should be co-cultured with
tumor cells to monitor the changes in CEBPB, and then the effect of
IL1B and CEBPB co-culture on tumor cells should be evaluated.
Secondly, the reliability and effectiveness of CEBPB and IL1B
as biomarkers need validation in larger clinical samples to strengthen the
clinical relevance of these findings. Thirdly, a deeper understanding of the
mechanisms by which CEBPB and IL1B contribute to DLBCL
pathophysiology, especially their interactions with other signaling pathways and
molecules, will help reveal a more comprehensive picture of DLBCL. Additionally,
developing and testing small molecule inhibitors or antibodies targeting
CEBPB and IL1B to assess the efficacy of these targeted therapy
strategies in animal models and clinical trials is critical to leveraging these
molecules in DLBCL treatment. For the co-expression relationship between
IL1B and CEBPB, this study is relatively shallow, and it needs
to be further verified via tissue immunofluorescence or co-immunoprecipitation
analysis in the future. Finally, exploring the roles of CEBPB and
IL1B in cancers beyond DLBCL may reveal their broader significance in
tumor biology, offering new strategies for a wide range of tumor treatments,
ascertaining whether IL-1
In summary, IL1B regulates CEBPB, which supports the pathophysiological process of DLBCL by influencing the cell cycle and promoting cell proliferation (Fig. 8). Inhibiting the expression of IL1B or CEBPB genes has shown potential to decelerate the advancement of DLBCL in animal models. This identifies CEBPB as an auspicious prognostic marker and a prospective immunotherapeutic target in DLBCL. Our study, integrating and analyzing extensive bioinformatics data and in vitro and in vivo experimental validation, reveals the significant role and potential clinical value of CEBPB in DLBCL. Our discoveries provide a foundation for future investigations on the involvement of CEBPB in additional types of cancer and its suitability as a target for therapy.
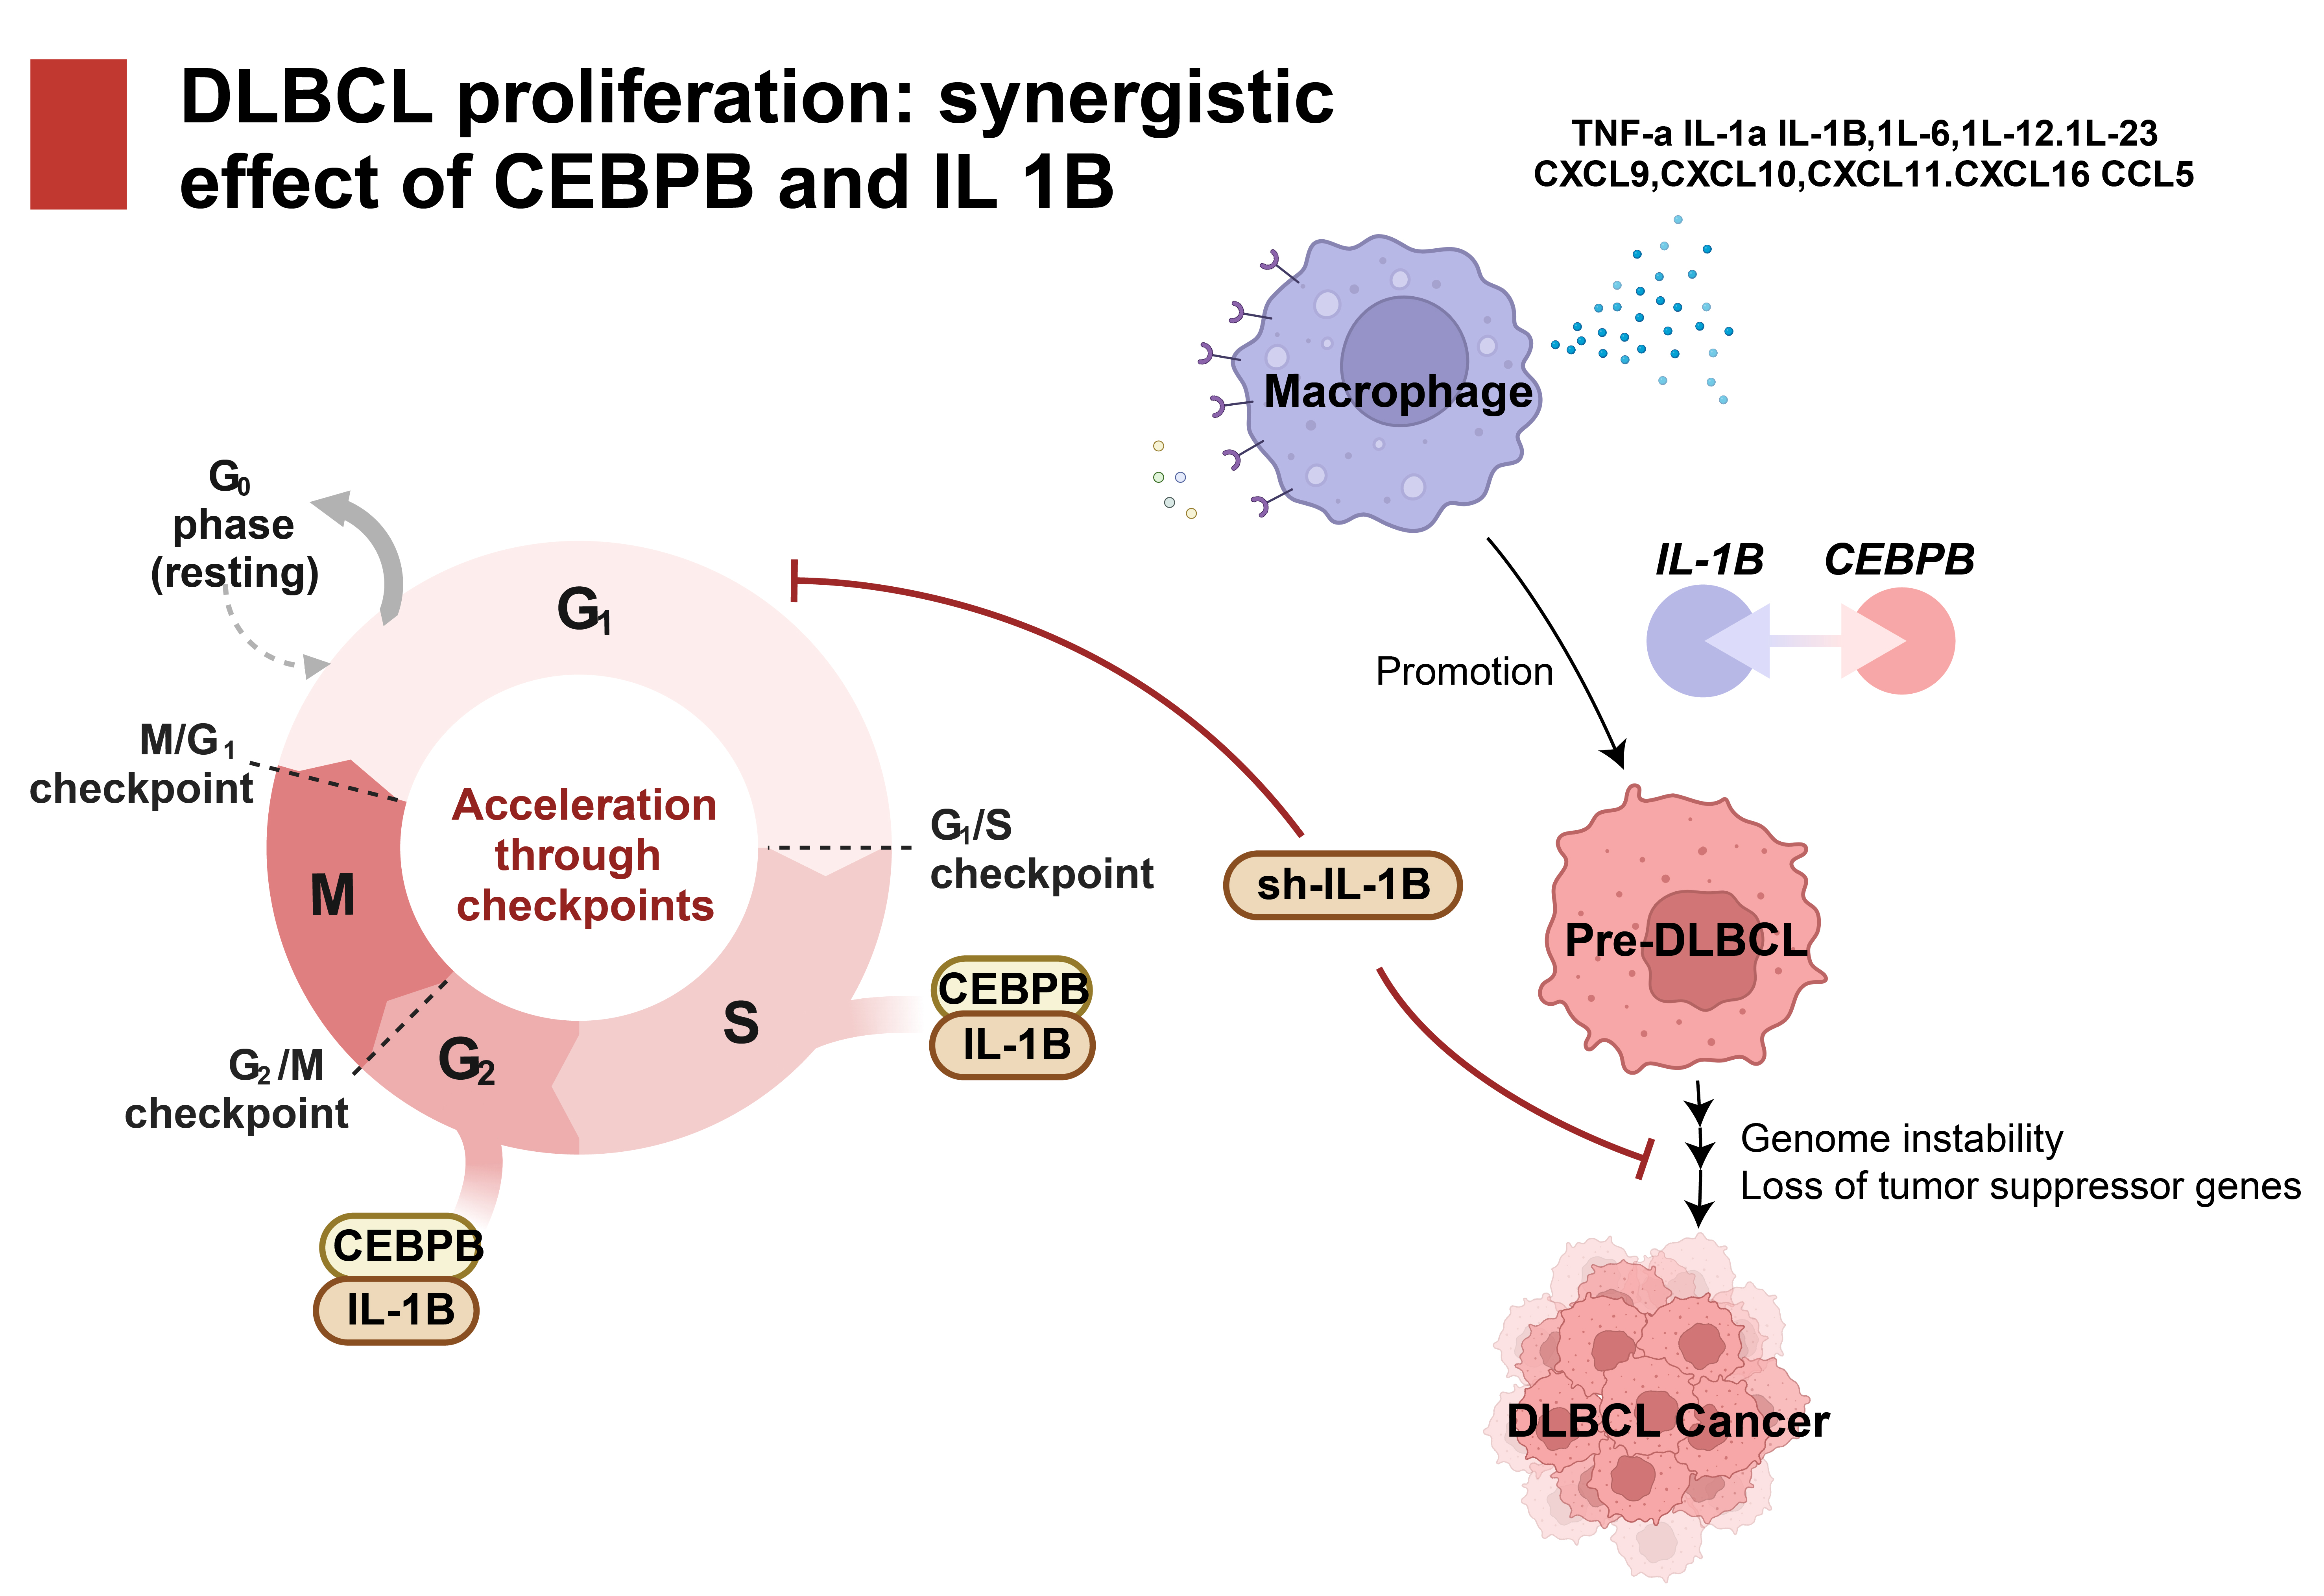 Fig. 8.
The critical role of CEBPB and IL1B in the cell cycle and its impact on DLBCL cell proliferation. TNF, tumor necrosis factor; IL, interleukin; CXCL, CXC chemokine ligand; CCL, CC chemokine ligand.
The datasets generated and/or analyzed during the current study are available in the Gene Expression Omnibus (GEO, http://www.ncbi.nlm.nih.gov/geo/). The original datasets generated and/or analysed during the current study are available from correspondent author.
HW, AL, SZ, CW and MW designed the manuscript. AL provided the administrative support. HW, MW, CW and MJ collected the data. BC, LZ and JX visualized the data. HW, CW, XH and XY analyzed the data. All authors wrote the manuscript. All authors reviewed the manuscript. All authors read and approved the final manuscript. All authors have participated sufficiently in the work and agreed to be accountable for all aspects of the work.
The human and animal experiments involved in this article were approved by the Ethics Committee of the First Hospital of Qiqihar (Approval No. 2023-KY-001). All of the patients or their families/legal guardians signed informed consent.
Not applicable.
This research received no external funding.
The authors declare no conflict of interest.
References
Publisher’s Note: IMR Press stays neutral with regard to jurisdictional claims in published maps and institutional affiliations.