


 , Grzegorz Machnik 2, Christina Linnebacher 3, Michael Linnebacher 3, Katarzyna Stec-Grosman 4, Ewa Obuchowicz 1
1 Department of Pharmacology, Medical University of Silesia, 40-752 Katowice, Poland
2 Department of Internal Medicine and Clinical Pharmacology, Medical University of Silesia, 40-752 Katowice, Poland
3 Department of General Surgery, University Medical Centre Rostock, 18057 Rostock, Germany
4 Laboratorium Medyczne Synevo, Synevo Sp. z o.o., 31-752 Kraków, Poland
Abstract
Malignant gliomas represent a heterogenous group of brain cancers that are characterized by infiltrative growth that lacks a clearly identifiable tumor border. The lack of the possibility of radical surgical resection and targeted therapy results in a poor prognosis. Although Temozolomide (TMZ) is still the leading chemotherapeutic agent in glioma treatment, its efficacy is limited due to the development of tumor resistance. Therefore, there an urgent need to improve the diagnosis and treatment of these tumors. Finding and developing biomarkers that are specific to glioma could be useful for both identifying therapy targets and monitoring treatment as well as for constructing a personalized therapy. However, there are still no reliable markers that would change the quality of glioma treatment.
In this study, differences in the expression of 84 cancer-related proteins in three glioma cell lines were analyzed using the dot-blot method: commercial T98G cells and two patient-derived cell lines. The influence of TMZ on changes in protein expression, cell morphology, and migration was also investigated (Proteome Profiler Human XL Oncology Array, LeviCell System, Microscopic imaging). The lines that were analyzed were characterized by a remarkably different plasticity of protein expression and the proteomic alterations that were induced by TMZ.
A dot-blot analysis revealed ten proteins that were common to all of the lines and five (Cathepsin b, FGF, Survivin, AXL, Osteopontin) that were modulated by the TMZ. As a result of the exposure of TMZ, the proteins that are involved in chemoresistance and invasion (TIE-2, Thrombospondin) were detected in both the HROG02 and T98G cell lines. In the control culture (not exposed to TMZ) of HROG17 cells, the proteins that are involved in metabolism were strongly suppressed.
The presented data sheds new light on the modulatory effect of Temozolomide on the expression of a protein panel: Cathepsin b, fibroblast growth factor (FGF), Survivin, AXL, and Osteopontin that may suggest their potential as therapeutic targets or biomarkers to monitoring therapy effects. However, further high-throughput analysis and detection of the proteins in the body fluids are necessary.
Keywords
- glioma
- glioma biomarkers
- temozolomide
- glioma cell lines
Glioblastoma (isocitrate dehydrogenase (IDH) wild type, World Health Organization (WHO) grade 4) is the most aggressive form of malignant brain cancer that inevitably recurs despite the standard therapy, which consists of surgical resection, radio- and chemotherapy [1]. Only approximately 7% of patients survive more than five years after the initial diagnosis. The constant therapeutic failures imply an incomplete knowledge about the molecular biology of glioblastoma and amplify the necessity of finding new treatment strategies [2]. Glioblastoma was the first cancer to be included in a large-scale genetic analysis by The Cancer Genome Atlas Project (2008) in which common genetic alterations were identified, but now, in order to extend this knowledge, recognizing the proteomic changes, which are the functional consequences of genomic modifications is very important [3, 4, 5]. The utility of proteomics for understanding biology of cancer and the pathogenesis of the central nervous system (CNS) diseases is currently one of the most dynamic research areas in medicine. Although it is difficult to standardize glioblastoma specific markers due to their heterogeneity, identifying their biological signatures by determining their protein profile is a high priority because it enables them to be identified and results in the creation of libraries that show potential clinical biomarkers [6]. Moreover, proteomic analyses can provide unique information based on monitoring the longitudinal response to a treatment or by enabling the design of personalized therapy. All of this is necessary because novel treatment strategies and options, which once seemed to be promising such as the oncogenic signaling pathways including Receptor Tyrosine Kinase (RTK)/Ras/Phosphoinositide 3-Kinase (PI3K) p53 and retinoblastoma protein (pRB) signaling pathways, the vascular endothelial growth factor (VEGF)-targeting monoclonal antibody Bevacizumab, the DNA alkylating agents—lomustine and carmustine implants, and the checkpoint blockade inhibitors, have thus far been underwhelming in treating glioblastoma multiforme (GBM) [7, 8, 9].
Proteomic research on cancer cell lines, especially using the patient-derived lines, is important for identifying their biological markers. Although these preclinical models do not perfectly mimic the tumor microenvironment, patient-specific alterations at the molecular level are retained to a high degree. Today, proteogenomic and metabolomic studies are conducted on cell line models to: (1) develop and screen for novel anticancer drugs, (2) identify any novel mechanisms that are associated with variations in the drug response, (3) understand the mechanisms of action for the drugs that act directly on tumor cells, and (4) predict the clinical response to the drugs [10, 11]. Despite investigations on the mechanisms of GBM invasion in various human samples and preclinical studies, the strong inter/intratumor heterogeneity remains in high demand in the search for novel panels of biomarkers that will better characterize the different invasive glioblastoma phenotypes [12].
Because our previous study, which was performed on commercial T98G and primary (HROG02, HROG17) human glioblastoma cell lines showed differences in the sensitivity of cells to Temozolomide (TMZ) that were induced by changes in the glucose and oxygen concentrations in a culture medium [13], we decided to investigate whether there are differences in the proteome profile of the analyzed glioblastoma lines and, if so, could they be correlated with this effect.
The dot-blot method is a simple technic that is used to detect proteins and may can be used in the first stage of a screening test. It makes it easier to start begin high-throughput research. We compared the effects of TMZ on the protein expression in the commercial T98G cell line, lines that had been derived from a patient who had not been treated after resection (HROG02), and a patient with a recurrent disease (HROG17), all the while looking for common and individual markers. Moreover, we attempted to identify (if one existed) a correlation between the changes that are observed in the protein expression and the cellular migration as a quantifiable feature of cancer malignancy.
Finally, for the first time, we conducted microscopic observations of the prolonged effect of TMZ on: the dynamics of confluence by using the wound healing test, the quality and morphology of the viable glioblastoma cells in all of the lines, after the dead cells that were the result of being exposed to TMZ were removed. This model was designed to mimic the clinical situation when a resistant cellular subpopulation still exists after TMZ administration.
Therefore, the aim of the study was to analysis the influence of temozolomide on changes in glioma-related protein expression, cell morphology, and migration in three cell cultures.
T98G is a commercial, known and widely used glioblastoma cell line of the mesenchymal type that was isolated from the brain of a glioblastoma multiforme White, 61-year-old, male patient. This cell line was deposited by GH Stein and can be used in neuroscience research. T98G cell line was purchased from Sigma Aldrich, St. Louis, MO, USA (cat. no.41106514) that sources a material from the American Type Culture Collection (ATCC): the Global Bioresource Center (Quality control specifications, characteristics, short tandem repeat profiling (STR) profiling, DNA profile, certificate, legal disclaimers and references are availabe in ATCC.
HROG02 (acc. to Cellosaurus-Cell line)—glioblastoma cell line derived from a patient who had undergone two surgical resections for tumor removal (bulk resection followed by the removal of any tumor residues one month later). The development of peritonitis prevented further glioblastoma treatment (radio-chemotherapy), and the patient died seven months after the surgery (CLS Cell Lines Service GmbH, Eppelheim, Germany, CLS cat. no. 300931). Identification of HROG02 glioma cell lines was performed using short tandem repeat (STR) analysis. Mycoplasma test (MycoAlert, Mycoplasma Kit, Lonza, Switzerland) in HROG02 was negative.
HROG17 (acc. to Cellosaurus-Cell line)—cell line of a glioblastoma relapse derived from a patient who received radiotherapy after the recurrence resection who died three months later (CLS Cell Lines Service GmbH, Eppelheim, Germany, CLS cat. no. 300938). Identification of HROG17 glioma cell lines was performed using short tandem repeat (STR) analysis. Mycoplasma test (MycoAlert, Mycoplasma Kit, Lonza, Switzerland) in HROG17 was negative. The two lines HROG02 and HROG17 were originally established in the lab of M. Linnebacher (among the co-authors) and described in detail [14].
The glioblastoma (GBM) cell lines, including T98G, HROG01, and HROG17 were collected and then cryopreserved as described by Mullins et al. [14]. The cell cultures media, gentamicin, and fetal bovine serum (FBS) were purchased from Gibco-BRL (Thermo Scientific, Waltham, MA, USA). The plasticware was purchased from Falcon (Lexington, TN, USA) and Eppendorf (Hamburg, Germany). The temozolomide (TMZ) was obtained from Sigma-Aldrich (Merck, Poznań, Poland).
The experiments were conducted in a HypoxyLab device (Animalab, Poznań, Poland) in order to simulate the hypoxic conditions inside a tumor (2.5% oxygen (Oxford Optronix Ltd, Abington, UK)).
The cells were free of mycoplasma (MycoAlert, Mycoplasma Kit, Lonza, Switzerland). All tests were repeated three times.
For the protein profiling assay, the cells were cultured as described previously
[13]. After achieving approximately 97%, TMZ was added for 24
hrs and the incubation was continued under hypoxic conditions (2.5%
oxygen (Oxford Optronix Ltd, Abington, UK)). Next, the cell cultures were rinsed with cold PBS and collected using an
1
The LeviCell system plus was used to separate the living cells from dead or
dying cells and from the cell debris. For the sepation test, 3
The LeviCell device was used in order to enrich the viable cell fractions.
Some of the [total cells loaded] at [X%] of viability were mixed with a Levitation Agent at a final concentration of 150mM and loaded into a LeviCell cartridge. A total volume of 220 µL was loaded into the inlet well. The cells were allowed to levitate for 20 minutes, after which the viable cells had levitated within the top half of the cartridge chamber, while the dead and dying cells sank towards the bottom half. After 20 minutes, the split line was used to set the cutoff for the live cell compartment, and in this case, was set to [insert split line settings]. The viable cells were recovered from the top outlet well, and their concentration and viability were assessed. Their viability was then increased to [X%].
The cells that were of interest were seeded onto 60 mm cell culture dishes (2
The sequences of representative images were taken automatically using a JuLI Stage Real-Time Cell History Recorder (NanoEntek Inc., Seoul, Korea) from all three lines (T98G, HROG02 and HROG17) simultaneously at intervals of 100 minutes during the entire assay.
To determine the phenotype of a microglia, the GBM cells (T98G, HROG02 and
HROG17) were cultured on 35 mm glass-bottomed dishes (Nunc, Thermo Scientific,
Waltham, MA, USA) (2
Statistical analysis of the data was performed using a two-way ANOVA followed by
the post-hoc Tukey test. Differences were considered as significant when
p
Among the 84 proteins that were detected, the largest number (69) was identified in the commercial T98G cell line followed by HROG02 (31 proteins) and the fewest were identified in the relapse HROG17 glioblastoma (21 proteins). The proteins that were most abundantly expressed in the studied cell lines are presented in Fig. 1. The intensity values are expressed as the mean normalized integrated optical density (IOD).
 Fig. 1.
Protein-protein interaction networks comparison between three analyzed glioma cell lines in control (a) and after Temozolomide exposition (b). The Side circles show proteins specific to each line and common to individual double-cell lines, and the middle circles show proteins common to all analyzed lines in the group (a or b). FGF, Fibroblast Growth Factor; HIF-1α, Hypoxia-Inducible Factor 1-alpha; Dkk-1, Dickkopf-related protein 1; CD, Cluster of Differentiation; VCAM-1, Vascular Cell Adhesion Molecule 1; VEGF, Vascular Endothelial Growth Factor; EGFR, Epidermal Growth Factor Receptor; ErB1, Epidermal Growth Factor Receptor 1 (also known as HER1); HMOX-1, Heme Oxygenase 1; SPARC, Secreted Protein, Acidic, and Rich in Cysteine; CapG, Capping Protein (CapG); M-CFS, Macrophage Colony-Stimulating Factor; FoxO1, Forkhead Box O1; FKHR, Forkhead in Rhabdomyosarcoma (also known as FoxO1); IL-6, Interleukin 6; ICAM-1, Intercellular Adhesion Molecule 1; Axl, Axl Receptor Tyrosine Kinase; MMP-2, Matrix Metalloproteinase 2; PECAM-1, Platelet Endothelial Cell Adhesion Molecule 1; MUC-1, Mucin 1; HNF-3β, Hepatocyte Nuclear Factor 3 beta; VE-Cadherin, Vascular Endothelial Cadherin; MCAF, Monocyte Chemoattractant and Activating Factor.
Moreover, ten common proteins were found in all three lines. These were Secreted Protein Acidic and Rich in Cysteine (SPARC), Osteopontin, Cathepsin B, Cathepsin S, HO-1/Heme Oxygenase 1 (HMOX1), Matrix Metalloproteinase 2 (MMP2), Survivin, fibroblast growth factor (FGF), and Axl as well as u-plasminogen.
Generally, the number of detected proteins in the cell lines that had been exposed to TMZ was similar to that in the cultures that had not been exposed to TMZ. Namely, the number of identified proteins was highest in T98G (60), moderate in HROG02 (41), and lowest (21) in HROG17. The same ten common proteins were detected in the cell lines that had been exposed to TMZ. Moreover, Tyrosine Kinase with Immunoglobulin-like and EGF-like Domains 2 (TIE-2) and Thrombospondin were additionally found in all three cell lines after TMZ exposure. The expression of some proteins such as FGF, cathepsin b, Axl, Survivin, and Osteopontin was strongly modulated by TMZ, whereas some proteins were found at the same levels—in T98G: MMP-2, vascular endothelial (VE)-cadherin, E-cadherin, granulocyte-macrophage colony-stimulating factor (GM-CSF), and Tenascins; in HROG02: capping protein (actin filament) gelsolin-like (CapG), MMP3, hepatocyte growth factor receptor (HGFR), SPARC, cathepsin S, HMO-1, epidermal growth factor receptor (EGFR); and in HROG17: u-plasminogen activator, MUC-1, cathepsin-s (Fig. 1).
In the T98G cells, exposure to TMZ significantly reduced the expression of almost all of the proteins (from a 37% reduction for FGF to a 90% reduction for IL-2Ra) except for Galectin-3, Cathepsin-d, and vimentin for which the expression increased (from a 17% increase for Galectin to a 53.8% for Cathepsin and as much as 170% for Vimentin). TMZ induced the production of two proteins that had not been detected in the untreated cells: TIE-2 and Thrombospondin, but it also caused the complete loss of the expression of many proteins, which were then below the limit of detection: cluster of differentiation 31 (CD-31), Nectin-4, mucin 1 (MUC-1), Kallikrein 5, macrophage stimulating protein (MSP), Prostatin, Mesothelin, Progesterone R 3NR3, Interleukin 8 (Cxcl-8), and platelet-derived growth factor (PDGF).
In the HROG02 cell line, exposure to TMZ led to the detection of ten proteins:
Intercellular Adhesion Molecule 1 (ICAM-1), Platelet-Derived Growth Factor Receptor (PDGFR), Tyrosine Kinase with Ig and EGF-like Domains 2 (TIE-2), Interleukin 6 (IL-6), Snail, p27, Erb-B2 Receptor Tyrosine Kinase 2 (ErbB2), CG
In the relapse glioma cell line, HROG17, TMZ did not trigger the expression of
previously undetected or decrease below the limit of detection of any previously
detected proteins. However, it increased the expression of most of the proteins:
Kallikrein 5 (by 30%), IL-2R
 Fig. 2.
Tables show protein expression induced by Temozolomide and characteristics for glioma cell lines A (T98G), B (HROG02) and C (HROG17) and changes fold in respect to the control line that was not treated with Temozolomide. GM-CSF, Granulocyte-Macrophage Colony-Stimulating Factor; HGF R/c-Met, Hepatocyte Growth Factor Receptor/c-Met; PDGF-AA, Platelet-Derived Growth Factor AA.
 Fig. 3.
Common proteins and their functions in cancer cell.
After exposure to cytotoxic TMZ concentrations [1 mM], the viable cells were separated from dead cells using a LeviCell device and were subsequently seeded into six-well plates. We observed that the TMZ-pretreated cells from two lines, HROG02 and T98G, reached confluency more quickly (after five vs. eight days, respectively) than the matching control cells (xy vs. yx days, respectively). By contrast, TMZ exposure of the surviving cells from HROG17 did not reach confluency before day 12. Moreover, the HROG 17 cells were characterized by a completely different phenotype than the other lines. These cells were spindle-shaped with long processes and no round, activated cells were observed.
Each line reached full confluency at its own pace despite any prior TMZ exposure. After three weeks, the cells of all of the lines did not detach from the bottom of the plate as they should have when a culture is conducted for a long time; however, they did form multi-layer compact structures (Fig. 4a–c).
 Fig. 4.
Separation test. Viable cells separated from dead cells after exposition to cytotoxic Temozolomide (TMZ) concentrations showed differences in the rate of dynamic confluence. Viable cells from two lines: primary HROG02 (b) and commercial T98G (a) line reached confluence faster (after 5 vs. 8 days, respectively). In contrast remaining viable cells from HROG17 (c) did not reach a confluence before day 12. Moreover, HROG 17 cells were characterized by completely different phenotype than other lines. These cells were spindle-shaped with long processes and round, activated cells were not noticed. Each line reached full confluence at its own pace despite prior TMZ exposure. After 3 weeks, cells of all lines did not detach from the plate bottom as it should be when culture is conducted for long time but they formed multi-layer compact structures. Scale bar: 50 µm.
We used classical wound healing assays to measure the influence of TMZ on the migratory activity of the three cell lines. The migration potential of the T98G and HROG02 cells was similar. The time that was needed for a wound to heal, which is considered to be the index of cell migration, was about 30 hours for the T98G and HROG02 cells and about 15 hours for the HROG17 cells. We observed that in cultures of the HROG02 and T98G cells, the round cells with the phenotype of activated microglia were abundant shortly before the wound line was completely closed. Conversely, these cells were not as frequent in the HROG17 cultures (Fig. 5).
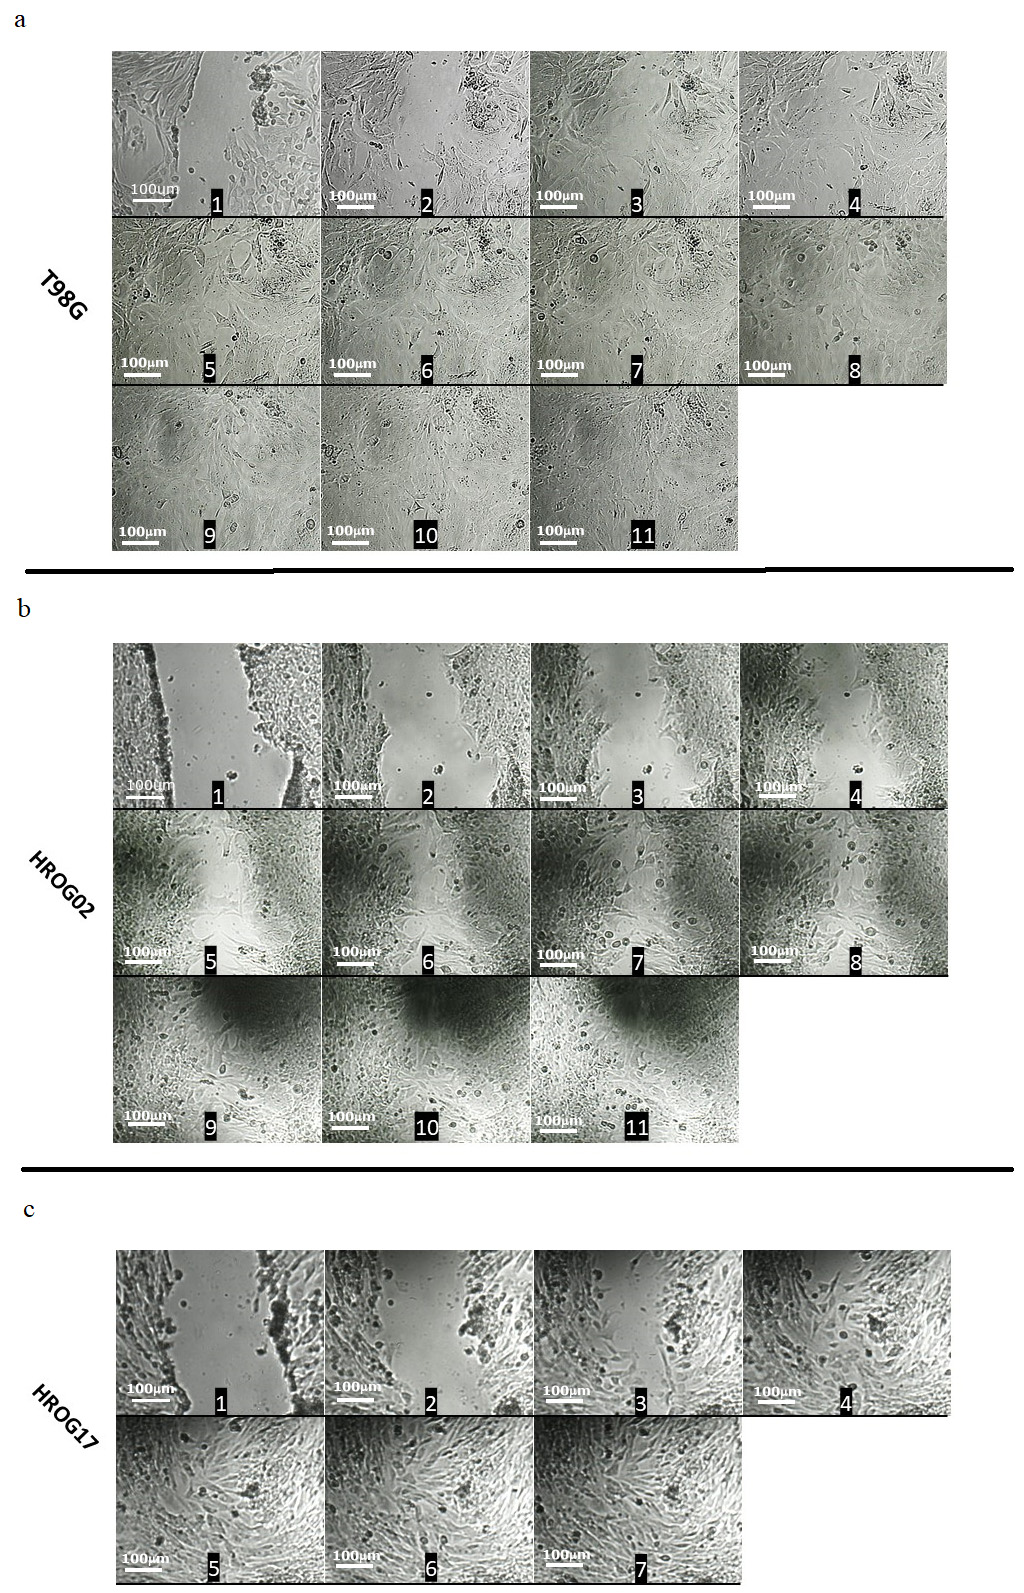 Fig. 5.
Migration of cells in wound healing test. A sequence of representative images at an interval of 100 minutes in our wound healing assay that was carried out in three cell lines: T98G (a: 1–11), HROG02 (b: 1–11) and HROG17 (c: 1–7) using July stage cell analyzer. Migration of T98G and HROG02 cells was similar. Time needed for wound healing, considered as an index of cell migration, was about 30 hours for T98G and HROG02 cells and 15 hours for HROG17 cells. In cultures of HROG02 and T98G cell lines, shortly before the wound was completely closed, round cells with the phenotype of activated microglia appeared. Such cells were not present in HROG17 cultures. Scale bar: 100 µm.
Microscopic observations after the Ricinus communis agglutinin treatment showed significant differences in the morphology among the GBM microglia cells, especially between the relapse HROG17 and the HROG02 or T98G lines. In the relapse line, as opposed to the other two lines, cells in the resting phase with numerous processes were visible. T98G and HROG02 had rounded soma cells and presented an M1-activated phenotype (area = 3385 and 3776 µm2 in the T98G and HROG02 lines, respectively, vs. 133 µm2 in the HROG17 line) (Fig. 6).
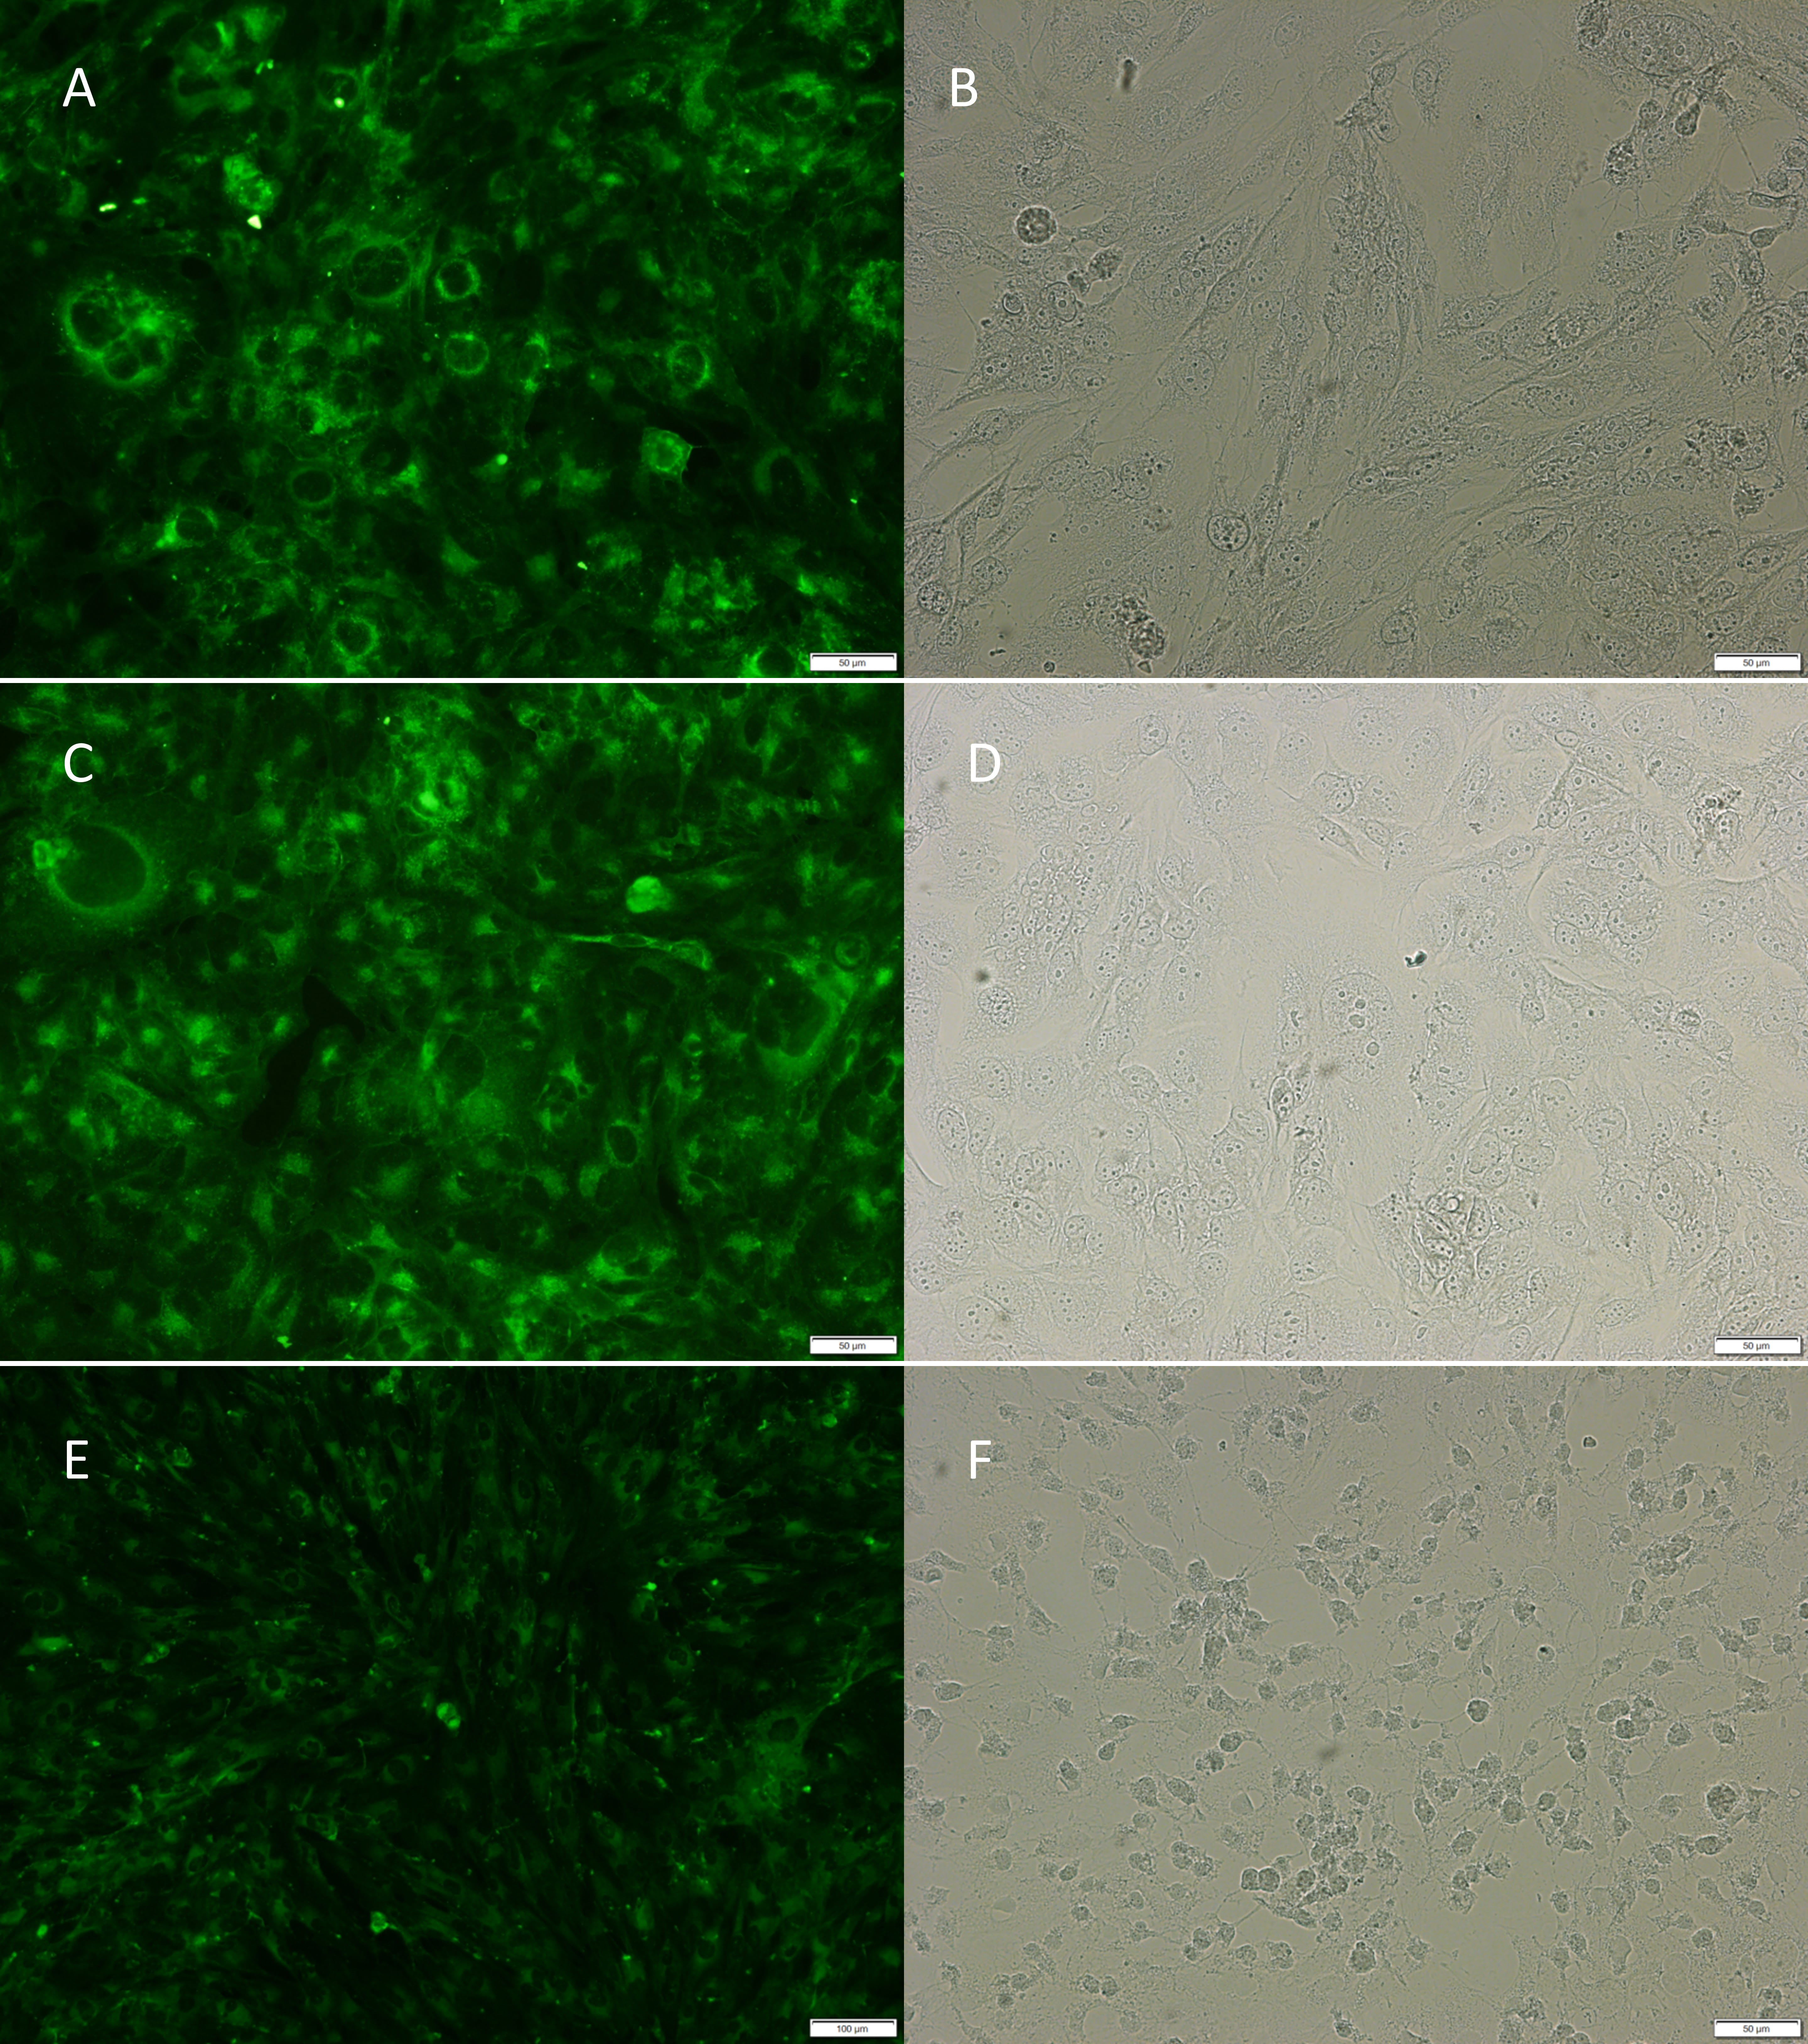 Fig. 6.
Microglia phenotype. Microscopic observations using agglutinin
Ricinus communis showed significant differences in morphology of glioblastoma (GBM) microglia
cells especially between relapse HROG17 (E,F) and HROG02 (C,D)/T98G lines (A,B).
In the relapse line, as opposed to the other two, cells in the resting phase with
numerous processes were visible. In commercial and primary HROG02 line, some
cells were round and presented M1 activated phenotype (area = 3385 and 3776
µm2 in T98G and HROG02 line, respectively; and
133 µm2 in HROG17) (OlympusBX43 Microscope and 20
In this study, the profile of 84 proteins in three glioma (grade 4) lines were analyzed: the commercial T98G, the primary HROG02 (derived from a treatment-naive patient) and HROG17 (derived from the relapse lesion) after exposure to TMZ, the first line alkylating drug that is used in patients with GBM. Despite the identical histopathological diagnosis—glioblastoma (but of different status relapse/treatment), our proteomics analysis revealed a unique protein signature for each line. However, in addition to this strong plasticity, ten proteins were found ubiquitously in all of the cases both with and without treatment: FGF, Survivin, Axl, SPARC, u-plasminogen, HO-1, Osteopontin, MMP-2, Cathepsin S, and Cathepsin B. The main functions of these proteins are related to proliferation, migration, pluripotency, immunosuppression, intercellular interactions, and extracellular matrix degradation [16, 17, 18, 19].
Altered metabolism, which promotes tumor survival and drives recurrence, is one of the prominent malignancy features of glioblastoma. In a previous study, we showed a strong functional link between the oxygen concentration/glucose availability, TMZ sensitivity and the intensification of the malignant features of glioblastoma cells, and the relationship between serum glucose and the glioblastoma cell Ki-67 expression in retrospectively analyzed clinical samples [20]. The data of the current proteomic analysis similarly identified the expression of the proteins that are involved in metabolism and their modulation by TMZ in the models from treatment-naive patients (commercial T98G and primary HROG02), but a quite different picture emerged in the glioblastoma relapse model, HRGO17.
Glioblastoma is also termed a “glioneuronal” tumor due to the expression of the neuronal antigens on the surface of cells that make up its mass [21]. Neuronal markers are aberrantly expressed in glioblastoma cells. One of them is Enolase—an essential enzyme that is involved in the glycolysis-metabolism pathway and that is elevated in many cancers including glioblastoma [22]. Physiologically, this enzyme is found in neurons and neuroendocrine cells. A role in the adaptation to cellular stress that is induced by treatment, hypoxia or a lack of nutrients has been suggested [22]. Although the enolase expression of glioblastoma is associated with a shorter survival time, the more general role of neuronal markers in glioblastoma is still open to discussion and their relevance must still be unraveled [23]. According to a single study, glioblastoma is able to create electrical synapses with the surrounding neurons that help drive glioblastoma invasion. Furthermore, glioblastoma cells can be reprogrammed into different subtypes of neurons (with a 20–40% neuronal efficacy) while losing tumorigenic capacity at the same time [24]. This kind of ability to transition microglia into neuron-like cells was reported earlier by our team as a mode of action of imipramine, an antidepressant drug. Conversion of glioma cells into neuron-like cells might, therefore, represent a promising novel therapeutic strategy and could open a new chapter in the treatment of this highly devastating cancer [25, 26].
Therefore enolase, which is a multifunctional protein, might be important in maintaining the glioblastoma malignant potential. Further support for this hypothesis comes from a study that has shown that enolase is a critical element in the adaptation to cellular stress and that it interacts with cathepsins. Moreover, when taking the important role of enolase in tumor immunology into account, there might also be a link between the glioblastoma metabolism and immunological pathways [27]. As a result, the immunometabolic profile of glioblastoma supports the development of an immunosuppressive tumor microenvironment, which ultimately results in an immunologically “cold tumor”. Not only a glioblastoma relapse but cerebral metastases also remodel the brain tissue and, in doing so, trigger inflammatory responses. These, in turn, stimulate growth, especially in the case of glioblastoma migration and further invasion [28].
Osteopontin, u-plasminogen, HO1-HMOX1, Cathepsins, and MMP proteins were detected as the common proteins in all three of the analyzed glioblastoma cell lines both in the group of “control conditions” and in the group after “TMZ exposure”. As a result, their constant expression (independent of an exposure to TMZ) can generate the potential for the degradation of the extracellular matrix (especially Cathepsins, MMP) and thus favor a recurrence. However, the “top” proteins, which were dominant in the relapsed HROG17 glioblastoma profile seem to dot the i’s and cross the t’s when determining the invasiveness strength (Kallikrein 5 and Thrombospondin). Osteopontin (OPN) also seems to be an attractive target for the immunomodulation of microglia. In our analysis, although this protein was detected at a moderate level in all of the studied glioblastoma lines, TMZ exposure did not influence it [29]. Based on the Human Protein Atlas, it is known that the highest expression in 17 of the analyzed cancers was OPN [30]. This glycophosphoprotein modulates multiple mechanisms of tumor-mediated immune suppression and has a pivotal role at the crossroads of inflammation and tumor progression. OPN also plays an important role in tumor repair, the processes of remodeling the extracellular matrix after injury, and is also responsible for the protumorigenic reprogramming of TAM [31]. In experimental study, an OPN deficiency was associated with a reduced immune-suppressive activity of M2 macrophages and a decrease in OPN/CD44 signaling, which can lead to the promotion of aggressive tumor growth as a consequence of the enhancement of the cancer stem cell activity in the glioma perivascular niche [31]. Moreover, elevated OPN levels in patients have been shown to correlate with a poor prognosis [32].
In experimental models, the serine protease Kallikrein-5 has been shown to
accelerate migration and increase the invasion of cancer cells without affecting
their proliferation capacity [33]. Moreover, it has the ability to sever
extracellular matrix components (Collagen type I, II, III, and IV, Fibronectin,
and Laminin) and the adhesion molecules (Fibrinogen and Vitronectin); both of
which are critical qualities for modulating tumor invasion and metastasis [34].
The study of several cancer types including glioblastoma have emphasized
the importance of Thrombospondin in modulating the immune responses and
vascularization. Moreover, this multifunctional glycoprotein has a close
association with the activation of transforming growth factor beta (TGF-
The up-regulation of the above-mentioned proteins is in agreement with our microscopic observations. In the analysis of the cells that had survived the exposure to TMZ, significant differences in the morphology and dynamic growth of the cells originating from the three studied GBM lines were observed. In the relapse glioblastoma cells, HROG17, a cellular phenotype with a weak proliferation, there was a strong plasticity of the cell morphology and a significant elongation of the soma cells, thus indicating the search for cell-to-cell contacts. However, the T98G and HROG02 cells behaved in quite the opposite manner and reached confluence twice as quickly and represented a growth-oriented phenotype.
However, in the wound healing test, it was observed that in an assay that mimicked the situation that occurs after tumor resection and around the resection margins, the HROG17 relapse glioblastoma cell line healed the wound twice as quickly as the primary cell models. Moreover, the HROG17 cells presented themselves with a long soma and had a higher morphological plasticity. Morphologically, the cells resembled the resting M2 anti-inflammatory form of microglia (ameboid). The T98G and HROG02 cultures were dominated by round microglia cells with an active M1 proinflammatory phenotype.
Because the response to central nervous system (CNS) damage or glioblastoma surgery is reactive gliosis, angiogenesis, and inflammation, the explanation of the observed differences between the analyzed three glioblastoma lines could also concern the microglia and its critical role in gliomagenesis and recurrence. Resident microglia and macrophages, which are known as tumor-associated macrophages, account for 30% to 50% of the tumor mass, which builds an immunosuppressive glioblastoma microenvironment and prevents a higher infiltration of functional antitumoral T and Natural Killer (NK) cells [36]. Tumor resection stimulates microglia activation, which is characterized by changes in the morphology, polarization, proliferation, and migration toward the inflicted injury [19]. Glioma cells that remain after the initial resection have been shown to transform incoming microglia cells into tumor-promoting cells, despite their normal role as executors of the innate immune response and sensing and eliminating abnormal cells [19].
TMZ, the monofunctional DNA alkylating agent and drug of first choice in glioblastoma therapy exerted different and mostly individual effects on each of the analyzed glioblastoma lines. Possibly, the most interesting effect was the appearance of TIE-2 and thrombospondin in the recurrent HROG17 line, but not in the primary glioblastoma cell lines. These proteins can shape and convert the glioblastoma profile to a more malignant form through their roles in the communication between glioma cells and the cells of the tumor microenvironment, thereby inducing chemoresistance by increasing the expression of ATP-binding cassette transporters, intensifying immunosuppression, and, similarly, triggering an escape from the immune surveillance [37, 38]. Among the “top” 10 proteins that were commonly expressed in all of the lines, we found that TMZ modulated 5 of them in different directions, namely: FGF, Cathepsins, Cathepsin b, Survivin, Axl and Osteopontin. Although these proteins have a wide range of functions, all of them are engaged in the immune response and create favorable conditions for the cellular processes such as the degradation of type IV collagen and the extracellular matrix, chromosomal instability, self-renewal, impaired cell-to-cell interactions, motility and proliferation, or the cell cycle. These proteins are also closely associated with the hyperactivation of the mitogen-activated protein kinase (MAPK) kinase pathway, which probably stimulates glioblastoma malignancy and has recently been suggested to be involved in glioblastoma relapse [39].
The complexity of glioblastoma disease and the results of our analysis of the cancer-related protein profiles after exposure of three glioblastoma cell lines to TMZ, suggest the need to look more deeply into several issues that can shape the malignant character of glioblastoma. Dynamic changes in the proteins expression were observed before and after the exposure to TMZ, thus demonstrating the impossibility of identifying a single protein that is responsible for glioblastoma development. Since proteins work as an interconnected net, we suggest that comprehensive protein profiles and protein panels have a greater credibility than even the most promising results of experimental studies that are dedicated to single proteins. Therefore identification of five proteins common to all of the lines: Cathepsin b, FGF, Survivin, AXL, Osteopontin that were modulated by TMZ suggests their potential as therapeutic targets or biomarkers to monitoring therapy effects.
Data are available upon reasonable request by contacting the corresponding author.
Study design: AMBW analyzed and collected data; GM performed statistical analysis; GM, KSG performed data interpretation; CL and ML made cell lines available and helped in preparing manuscript; EO analyzed data. All authors contributed to editorial changes in the manuscript. All authors read and approved the final manuscript. All authors have participated sufficiently in the work and agreed to be accountable for all aspects of the work.
Not applicable.
We would like to express our sincere thanks to Mrs. Edyta Golińska, Mrs. Anna Rynkowska, Mrs. Amy Hamilton, and Mr. Alexander Jurkowitsch for permitting us to use the LeviCell equipment and for their support in executing and analyzing the cell separation experiment.
This work was supported by a Grant from the School of Medicine, Medical University of Silesia, Katowice, Poland (KNW-1-121/N/9/0).
All authors have reported no conflicts relevant to the contents of this paper to disclose. Katarzyna Stec-Grosman is consultant of Laboratorium Medyczne Synevo, the judgments in data interpretation and writing were not influenced by this relationship.
References
Publisher’s Note: IMR Press stays neutral with regard to jurisdictional claims in published maps and institutional affiliations.