


1 Department of Neurosurgery, Xijing Hospital, Air Force Medical University of PLA, 710000 Xi’an, Shaanxi, China
2 Department of Medical Administration, The Third People’s Hospital of Chengdu, 610014 Chengdu, Sichuan, China
3 Department of Neurosurgery, Xi’an People’s Hospital, 710000 Xi’an, Shaanxi, China
†These authors contributed equally.
Abstract
Glioblastoma (GBM) is an aggressive primary brain tumor. The HOX gene family has been implicated in the pathogenesis of different types of tumors. This research aimed to examine the impact of homeobox D9 (HOXD9) in GBM under hypoxic conditions, as well as to elucidate its underlying molecular mechanisms.
The study assessed the differential expression of nine HOXD genes in GBM using the Mann-Whitney U test and identified genes with high correlation with the cancer genome atlas (TCGA)-GBM dataset using receiver operating characteristic (ROC) curves. Prognostic genes of GBM patients were identified through a combination of prognostic Kaplan-Meier (KM) curve and Cox analysis. In vitro experiments were conducted using U87-MG and U251-MG cells, and an animal GBM model was constructed. The study also measured the secretion level of high mobility group box 1 (HMGB1) using enzyme-linked immunosorbent assay (ELISA). Glucose uptake and lactate production levels in cells and tissues were analyzed using kits. The expressions of HOXD9 and 6-phosphofructo-2-kinase/fructose-2,6-bisphosphatase 3 (PFKFB3) were detected by immunofluorescence, and chromatin immunoprecipitation (ChIP) validated their relationship.
HOXD9 was identified as the target gene, showing a significant correlation between HOXD9 expression and prognostic clinical outcomes. Overexpression of HMGB1 enhanced cell proliferation, migration, and the expression levels of HOXD9 and PFKFB3 and promoted HMGB1 secretion, glucose uptake, and lactate generation. HOXD9 bound to the PFKFB3 promoter region in U87-MG and U251-MG cells. Furthermore, PFKFB3 overexpression partially counteracted the suppressive effects of HOXD9 silencing on tumor formation.
HOXD9 promoted hypoxia-induced HMGB1 secretion and glycolysis in GBM through the transcriptional activation of PFKFB3, which in turn promoted tumorigenesis.
Keywords
- HOXD9/PFKFB3
- HMGB1
- glioblastoma
- hypoxia induction
- glycolysis
Glioblastoma (GBM), a highly aggressive primary brain tumor with a poor clinical prognosis, presents significant challenges in terms of treatment efficacy [1, 2]. Despite advances in understanding the molecular and genetic changes that drive tumorigenesis, current treatments have had limited impact on improving the prognosis of GBM patients. The 5-year survival rate is less than 5%, which is one of the lowest survival rates among all cancer types [3]. Therefore, there are still opportunities and challenges in finding more effective treatments for GBM.
Transcription factors of the homeobox (HOX) family play important roles in early embryonic development and cellular processes. They also act as tumor oncogenes or suppressors which play key roles in tumorigenesis [4]. HOX family genes have been reported in various types of tumors, such as lung cancer [5, 6], breast cancer [7], ovarian cancer [8, 9], prostate cancer [10], and colon cancer [11]. It has been reported that HOX family genes are closely associated with gliomagenesis. In the context of glioma, inhibiting the expression of homeobox D9 (HOXD9) using specific small interfering RNA (siRNA) in the glioma cell line U87-MG resulted in decreased cell proliferation, cell-cycle arrest, and the induction of apoptosis [12]. Additionally, researchers found that mRNA expression of HOXD10 was upregulated, and the level of protein expression was noticeably downregulated in GBM compared with normal brain tissue [13]. The study of HOX family genes in GBM is not yet complete, so further exploration of the molecular mechanisms of HOX family genes involved in GBM development is necessary.
It is important to note that the pathological features of GBM include angiodysplasia or necrosis, which are closely associated with rapid tumor growth and invasion, often caused by a hypoxic microenvironment [14, 15]. A study by Chédeville AL et al. [16] highlighted changes in glycolysis in GBM under hypoxic conditions, characterized by an increase in the expression of 6-phosphofructo-2-kinase/fructose-2,6-bisphosphatase 3 (PFKFB3). PFKFB3 is a glycolytic enzyme that is highly expressed in GBM, and targeting these enzymes has been considered as a potential approach for tumor therapy [17]. Previous study has shown that in lung cancer, HOXD9 can directly bind to the promoter region of PFKFB3, enhancing its transcription [18]. However, the role of HOXD9/PFKFB3 in hypoxia-induced glycolytic changes in GBM is not yet understood. Additionally, lactate produced from glycolysis mediates the lactylation of high mobility group box 1 (HMGB1), promoting its secretion into exosomes [19, 20]. Hypoxia also enhances HMGB1 expression and secretion in glioma stem cells [21]. Oxamic acid (OA) and PFKFB3 inhibitor 3-(3-pyridinyl)-1-(4-pyridinyl)-2-propen-1-one (3PO) have been found to inhibit HMGB1-induced proliferation and glycolysis in fibroblasts [22]. Therefore, it is hypothesized that HOXD9-mediated enhancement of PFKFB3 transcription may be involved in hypoxia-induced HMGB1 secretion and glycolytic processes in GBM.
In this study, in order to explore the molecular mechanism of HOX family genes involved in the development of GBM, we screened the significance of HOX family transcription factors in the prognosis of GBM by bioinformatics analysis and screened to obtain the HOXD9 gene. In further delving into the specific mechanism, we constructed an animal model of GBM using U87-MG and U251 cells to further investigate the effect of HOXD9-mediated enhancement of PFKFB3 transcription in HMGB1 secretion and glycolysis in GBM under hypoxic conditions. Our findings will provide a new theoretical basis for the GBM treatment.
We acquired the gene expression matrix of the GBM dataset from the Cancer Genome Atlas (TCGA) database (https://www.cancer.gov/) [23]. The dataset included 174 samples of GBM, with clinical information available for all samples. This comprised tumor tissues from 169 GBM patients (Tumor) and partially matched paracancerous tissues from 5 GBM patients (Normal). The count sequencing data of these samples were normalized to Fragments Per Kilobase per Million (FPKM) format. By integrating clinical data with sequencing data and excluding incomplete clinical information, this study obtained complete progression-free survival clinical data for 168 GBM patients.
In addition, the GBM dataset of TCGA combined with Genotype-Tissue Expression (GTEx) (TCGA-GTEx-GBM) was uniformly processed into the Transcripts Per Kilobase of exon model per Million mapped reads (TPM) format. This study used 1323 samples, including 1152 normal samples from the GTEx dataset, 5 paraneoplastic samples, and 166 tumor samples from the TCGA-GBM dataset. These datasets were utilized to conduct differential expression analysis of the HOX family genes and perform receiver operating characteristic (ROC) curve analysis.
To investigate how HOXD family genes work in GBM and their related biological features and pathways, we used the Mann-Whitney U test (Wilcoxon rank sum test) to compare expression differences between the Tumor and Normal groups in the GBM dataset. We visually presented the results using subgroup comparative plots. Additionally, we analyzed the prognosis of the HOXD gene family in GBM using the TCGA-GBM dataset. We presented the results using the Kaplan-Meier (KM) survival curves to show the relationship between HOXD gene expression and patient survival in GBM. To further confirm the correlation between the HOXD family gene expression in GBM and different groups within the GBM dataset, we used the Gene Expression Profiling Interactive Analysis (GEPIA) tool [24]. GEPIA is an online platform offering diverse analytical functionalities utilizing data from TCGA and GTEx. In this study, GBM data from TCGA and GTEx were utilized within the GEPIA website to investigate the distinct expression patterns of the HOX family genes in tumor and non-tumor samples, and to evaluate their association with prognosis. Overall survival and Disease specific survival were chosen as the prognostic endpoints, and the correlation between gene expression levels and prognosis was assessed through hazard ratio (HR) analysis.
We used the survival ROC package (version 1.80.0) in R software (version 4.1.2, R Foundation for Statistical Computing, Vienna, Austria) to create ROC curves that show the connection between the expressions of the HOXD family genes and the survival time and status of GBM patients. We then calculated the Area Under Curve (AUC) to evaluate how well the expression of HOXD family genes can predict the survival outcomes of GBM patients.
Initially, the genes in the TCGA-GBM dataset were divided into high and low
phenotypic relevance groups based on their correlation. Following this,
enrichment analysis of all differential genes from both high and low phenotypic
relevance groups was carried out using the cluster Profiler package (version 4.12.6). The GSEA was
performed using the following parameters (Table 1). For enrichment analysis, we
used the c2.cp.v7.2.symbols gene set from the Molecular Signatures Database
(MSigDB). Significant enrichment was determined based on the criteria of
p
| Description | Size | Enrichment score | NES | p-value | p.adjust |
| REACTOME_RNA_POLYMERASE_II_TRANSCRIPTION_TERMINATION | 66 | 0.60608 | 2.14134 | 0.00108 | 0.09601 |
| WP_MRNA_PROCESSING | 126 | 0.54749 | 2.07086 | 0.00103 | 0.09601 |
| REACTOME_TRANSPORT_OF_MATURE_TRANSCRIPT_TO_CYTOPLASM | 84 | 0.53642 | 1.96475 | 0.00105 | 0.09601 |
| REACTOME_MRNA_SPLICING | 188 | 0.49679 | 1.94513 | 0.00101 | 0.09601 |
| REACTOME_PRESYNAPTIC_DEPOLARIZATION_AND_CALCIUM_CHANNEL_OPENING | 11 | 0.77012 | 1.94174 | 0.00130 | 0.09601 |
| REACTOME_PROCESSING_OF_CAPPED_INTRON_CONTAINING_PRE_MRNA | 242 | 0.48370 | 1.92504 | 0.00100 | 0.09601 |
| WP_NEURAL_CREST_DIFFERENTIATION | 100 | 0.51287 | 1.91269 | 0.00104 | 0.09601 |
| KEGG_SPLICEOSOME | 126 | 0.50352 | 1.90454 | 0.00103 | 0.09601 |
| REACTOME_SUMOYLATION_OF_DNA_METHYLATION_PROTEINS | 16 | 0.65811 | 1.83026 | 0.00377 | 0.09601 |
| REACTOME_TRNA_MODIFICATION_IN_THE_NUCLEUS_AND_CYTOSOL | 43 | 0.54037 | 1.80710 | 0.00224 | 0.09601 |
| REACTOME_MITOTIC_SPINDLE_CHECKPOINT | 111 | 0.48003 | 1.80392 | 0.00104 | 0.09601 |
| REACTOME_TRNA_PROCESSING | 108 | 0.47901 | 1.79826 | 0.00104 | 0.09601 |
| BIOCARTA_CPSF_PATHWAY | 10 | 0.73045 | 1.78109 | 0.00398 | 0.09601 |
| REACTOME_SUMOYLATION_OF_RNA_BINDING_PROTEINS | 47 | 0.52658 | 1.77711 | 0.00222 | 0.09601 |
| REACTOME_INTERACTIONS_OF_REV_WITH_HOST_CELLULAR_PROTEINS | 37 | 0.54667 | 1.77687 | 0.00343 | 0.09601 |
Notes: GSEA, Gene Set Enrichment Analysis; TCGA, the cancer genome atlas; GBM, glioblastoma; NES, normalized enrichment score.
We conducted univariate Cox regression analysis to evaluate the expression of key genes in the GBM dataset. Following this, we employed a multivariate Cox regression analysis that encompassed all the identified key genes to construct strong multivariate Cox regression models. Finally, we utilized the R package ggDCA (version 1.1) [25] to produce a decision curve analysis (DCA) plot, enabling us to assess the predictive performance of the nomogram model on survival outcomes for GBM patients.
The human microglia cell line HMC3 (AW-CNH003, Abiowell, Changsha, China), human glioma cell lines U87-MG (AW-CCH001, Abiowell, Changsha, China), U251-MG (AW-CCH034, Abiowell, Changsha, China) and LN229 (AW-CCH094, Abiowell, Changsha, China) were acquired from Changsha Abiowell Biotechnology Co., Ltd. HMC3 cells were cultured in Minimum Essential Medium (MEM) medium containing 10% fetal bovine serum (FBS; 10099141, Gibco, Grand Island, NY, USA) and 1% penicillin-streptomycin (SV30010, Beyotime, Shanghai, China). U87-MG, U251-MG, and LN229 cells were cultured in a Dulbecco’s modified Eagle’s medium (DMEM) medium containing 10% FBS and 1% penicillin-streptomycin. All cell lines were validated by short-tandem repeat (STR) profiling and tested negative for mycoplasma. Cells were all cultured in a humidified incubator at 37 °C and 5% CO2.
Cells in logarithmic phase were transfected using Lipofectamine 2000 (11668019, Invitrogen, Carlsbad, CA, USA) as per the kit instructions after cell adhesion. The cells were transfected or co-transfected with the following: overexpressing negative control plasmid (oe-NC; LV-NC01, Honorgene, Changsha, China), HMGB1 overexpressing plasmid (oe-HMGB1; HG-HO002128, Honorgene, Changsha, China), oe-HOXD9 (HG-HO014213, Honorgene, Changsha, China), si-NC (LV-shNC, Honorgene, Changsha, China), si-HOXD9 (HG-HS014213, Honorgene, Changsha, China), oe-PFKFB3 (HG-HO004566, Honorgene, Changsha, China). The si-HOXD9 target sequence was 5′-GACTCTGTATTTGCTCGTTTA-3′.
The in vitro experiments in this study were divided into the following 8 groups, with U87-MG and U251-MG cells serving as controls for each other: Control, Hypoxia, Hypoxia+si-NC, Hypoxia+si-HOXD9, NC, HMGB1, HMGB1+3PO, HMGB1+si-HOXD9. In the Control group, cells were cultured normally. In the Hypoxia group, cells were cultured under hypoxic conditions (1% O2 and 5% CO2) at 37 °C for 48 h [21]. In the Hypoxia+si-NC group, cells were transfected with si-NC under hypoxic conditions for 48 h. In the Hypoxia+si-HOXD9 group, cells were transfected with si-HOXD9 under hypoxic conditions for 48 h. In the NC group, cells were transfected with si-NC under hypoxic conditions for 48 h. In the HMGB1 group, cells were transfected with oe-HMGB1 under hypoxic conditions for 48 h. In the HMGB1+3PO group, cells were transfected with oe-HMGB1 and treated with 10 mM PFKFB3 inhibitor under hypoxic conditions for 48 h [22]. In the HMGB1+si-HOXD9 group, cells were transfected with oe-HMGB1 and si-HOXD9 under hypoxic conditions for 48 h.
In accordance with the protocol of Total RNA Extraction (Trizol; 15596026, Thermo, Waltham, MA, USA), total RNA was isolated from tissues and cells. Subsequently, the absorbance readings of the total RNA were assessed using an ultraviolet spectrophotometer. The following procedures proceeded once the OD260/OD280 ratio fell within the range of 1.8–2.0. RT-qPCR analysis was conducted utilizing the SYBR method on a Quantstudio1 (ABI, Foster, CA, USA). The primer sequences are shown in Table 2.
| Targets | F (5′-3′) | R (5′-3′) |
|---|---|---|
| H-HOXD9 | TTCGCCTCGTGTAGTTTTGCC | TCCATCCAGGAGCGCACGTA |
| H-PFKFB3 | CCCCACAAAAGTGTTCAACGTC | CCTTCTTTCGCCAGGTAGCTT |
| H-HMGB1 | CTATATTACGGTTTGCCCCTT | ACTGGCACTTTAAGAAAACGAT |
| H- |
ACCCTGAAGTACCCCATCGAG | AGCACAGCCTGGATAGCAAC |
The cells were washed with chilled PBS buffer and subsequently treated with
radioimmunoprecipitation assay (RIPA) lysate (AWB0136, Abiowell, Changsha, China)
for lysis. Following the determination of protein concentration using a
bicinchoninic acid (BCA) kit (AWB0104, Abiowell, Changsha, China), the
appropriate amount of protein was combined with a 5
We used an enzyme-linked immunosorbent assay (ELISA) kit (CSB-E08223h, Cusabio,
Wuhan, China) to measure HMGB1 secretion levels. In short, cells were cultured at
a density of 2
Cell viability was assessed using a CCK-8 kit (NU679, Dojindo, Kumamoto, Japan).
Cells in the logarithmic growth phase were seeded at 1
First, remove the fixed overnight sample. To remove ethanol, add 1 mL of PBS to resuspend the cells. Centrifuge the suspension at 800 rpm for 5 min to collect the cells. Then, add 150 µL of propidium iodide (PI) working solution (MB2920, Meilunbio, Dalian, China) to the cells and stain them for 30 min at 4 °C while shielding them from light. Finally, transfer the cells to a flow-through detector tube and analyze them using the FACSCanto Flow Cytometer (A00-1-1102, Beckman Coulter, Indianapolis, IN, USA).
In the Transwell chamber (3428, Corning Inc., Corning, NY, USA), fill the lower
layer with 500 µL of complete medium. After the cells were digested
with trypsin to form individual cells, the serum-free medium was resuspended to 2
We used the Glucose kit (A154-1-1, Njjcbio, Nanjing, China) to measure the glucose content in tissue and cell supernatants. After sample processing, 2.5 µL the sample and 250 µL of working solution were added to the 96-well plate. The absorbance value was then detected at a wavelength of 505 nm.
Additionally, we utilized the Lactic Acid assay kit (A019-2-1, Njjcbio, Nanjing, China) to detect the lactate levels in tissue and cell supernatants. The test sample of 0.02 mL, enzyme working solution of 1 mL, and 0.2 mL chromogen were mixed, followed by the addition of 2 mL termination solution. The absorbance was detected at a wavelength of 530 nm.
After fixing the slides, we permeated them with 0.3% Triton X-100 for 30 min. Subsequently, we added 5% BSA-PBS to the block for 60 min. We then added the primary antibodies HOXD9 (1:50; sc-137134, Santa, Dallas, TEX, USA) and PFKFB3 (1:50; ab181861, Abcam, Cambridge, MA, USA), and incubated them overnight at 4 °C. 4′,6-diamidino-2-phenylindole (DAPI) staining solution (AWI0429, Abiowell, Changsha, China) was applied, and the samples were observed using fluorescence microscopy. HOXD9 exhibited red fluorescence, PFKFB3 showed green fluorescence, and DAPI displayed blue fluorescence.
In this study, we followed the ChIP Assay Kit (ab500, Abcam, Cambridge, MA, USA) protocol. We used a final concentration of 1.1% formaldehyde to crosslink the DNA and proteins in the cells. Then, we fragmented the crosslinked DNA into smaller pieces using ultrasonication. We added antibodies of interest or positive control (ab1791, Abcam, Cambridge, MA, USA) were added to the supernatant for immunoprecipitation. Finally, we used the eluted and purified DNA as a template to amplify the fragment region of the PFKFB3 promoter region prediction site by RT-qPCR with PFKFB3-specific primer set, forward primer (5′-GTGGGGAGGCAGAGCTGCAGG-3′) and the reverse primer (5′-TGCTGGGTACGAGGAGG-3′), yielding a product of 273 bp.
We obtained 40 healthy male nude mice (4 weeks of age) from Hunan Slaike Jingda
Experimental Animal Co., LTD (Changsha, China). After one week of adaptive
feeding, we injected U87-MG and U251-MG cells (1
For data processing and analysis, we used R software (version 4.1.2) and
conducted statistical analysis using GraphPad Prism 8.0 software (GraphPad
Software, Inc., San Diego, CA, USA). Wilcoxon rank-sum tests were used to
determine the differential expression of nine HOXD family genes between
the Tumor group and the Normal group. If the data followed a normal distribution,
we performed pairwise comparisons between the two groups using the
T-test. Comparisons between multiple groups were performed using the
one-way or two-way ANOVA test, and then Tukey’s multiple comparisons test was
used. We considered results with a p
In our investigation of the possible mechanism and associated biological features and pathways of the nine HOX family genes in GBM, we analyzed their expression differences in GBM using the Mann-Whitney U test. As depicted in Fig. 1A, except for HOXD1, the expressions of the other eight HOX family genes were highly statistically significant.
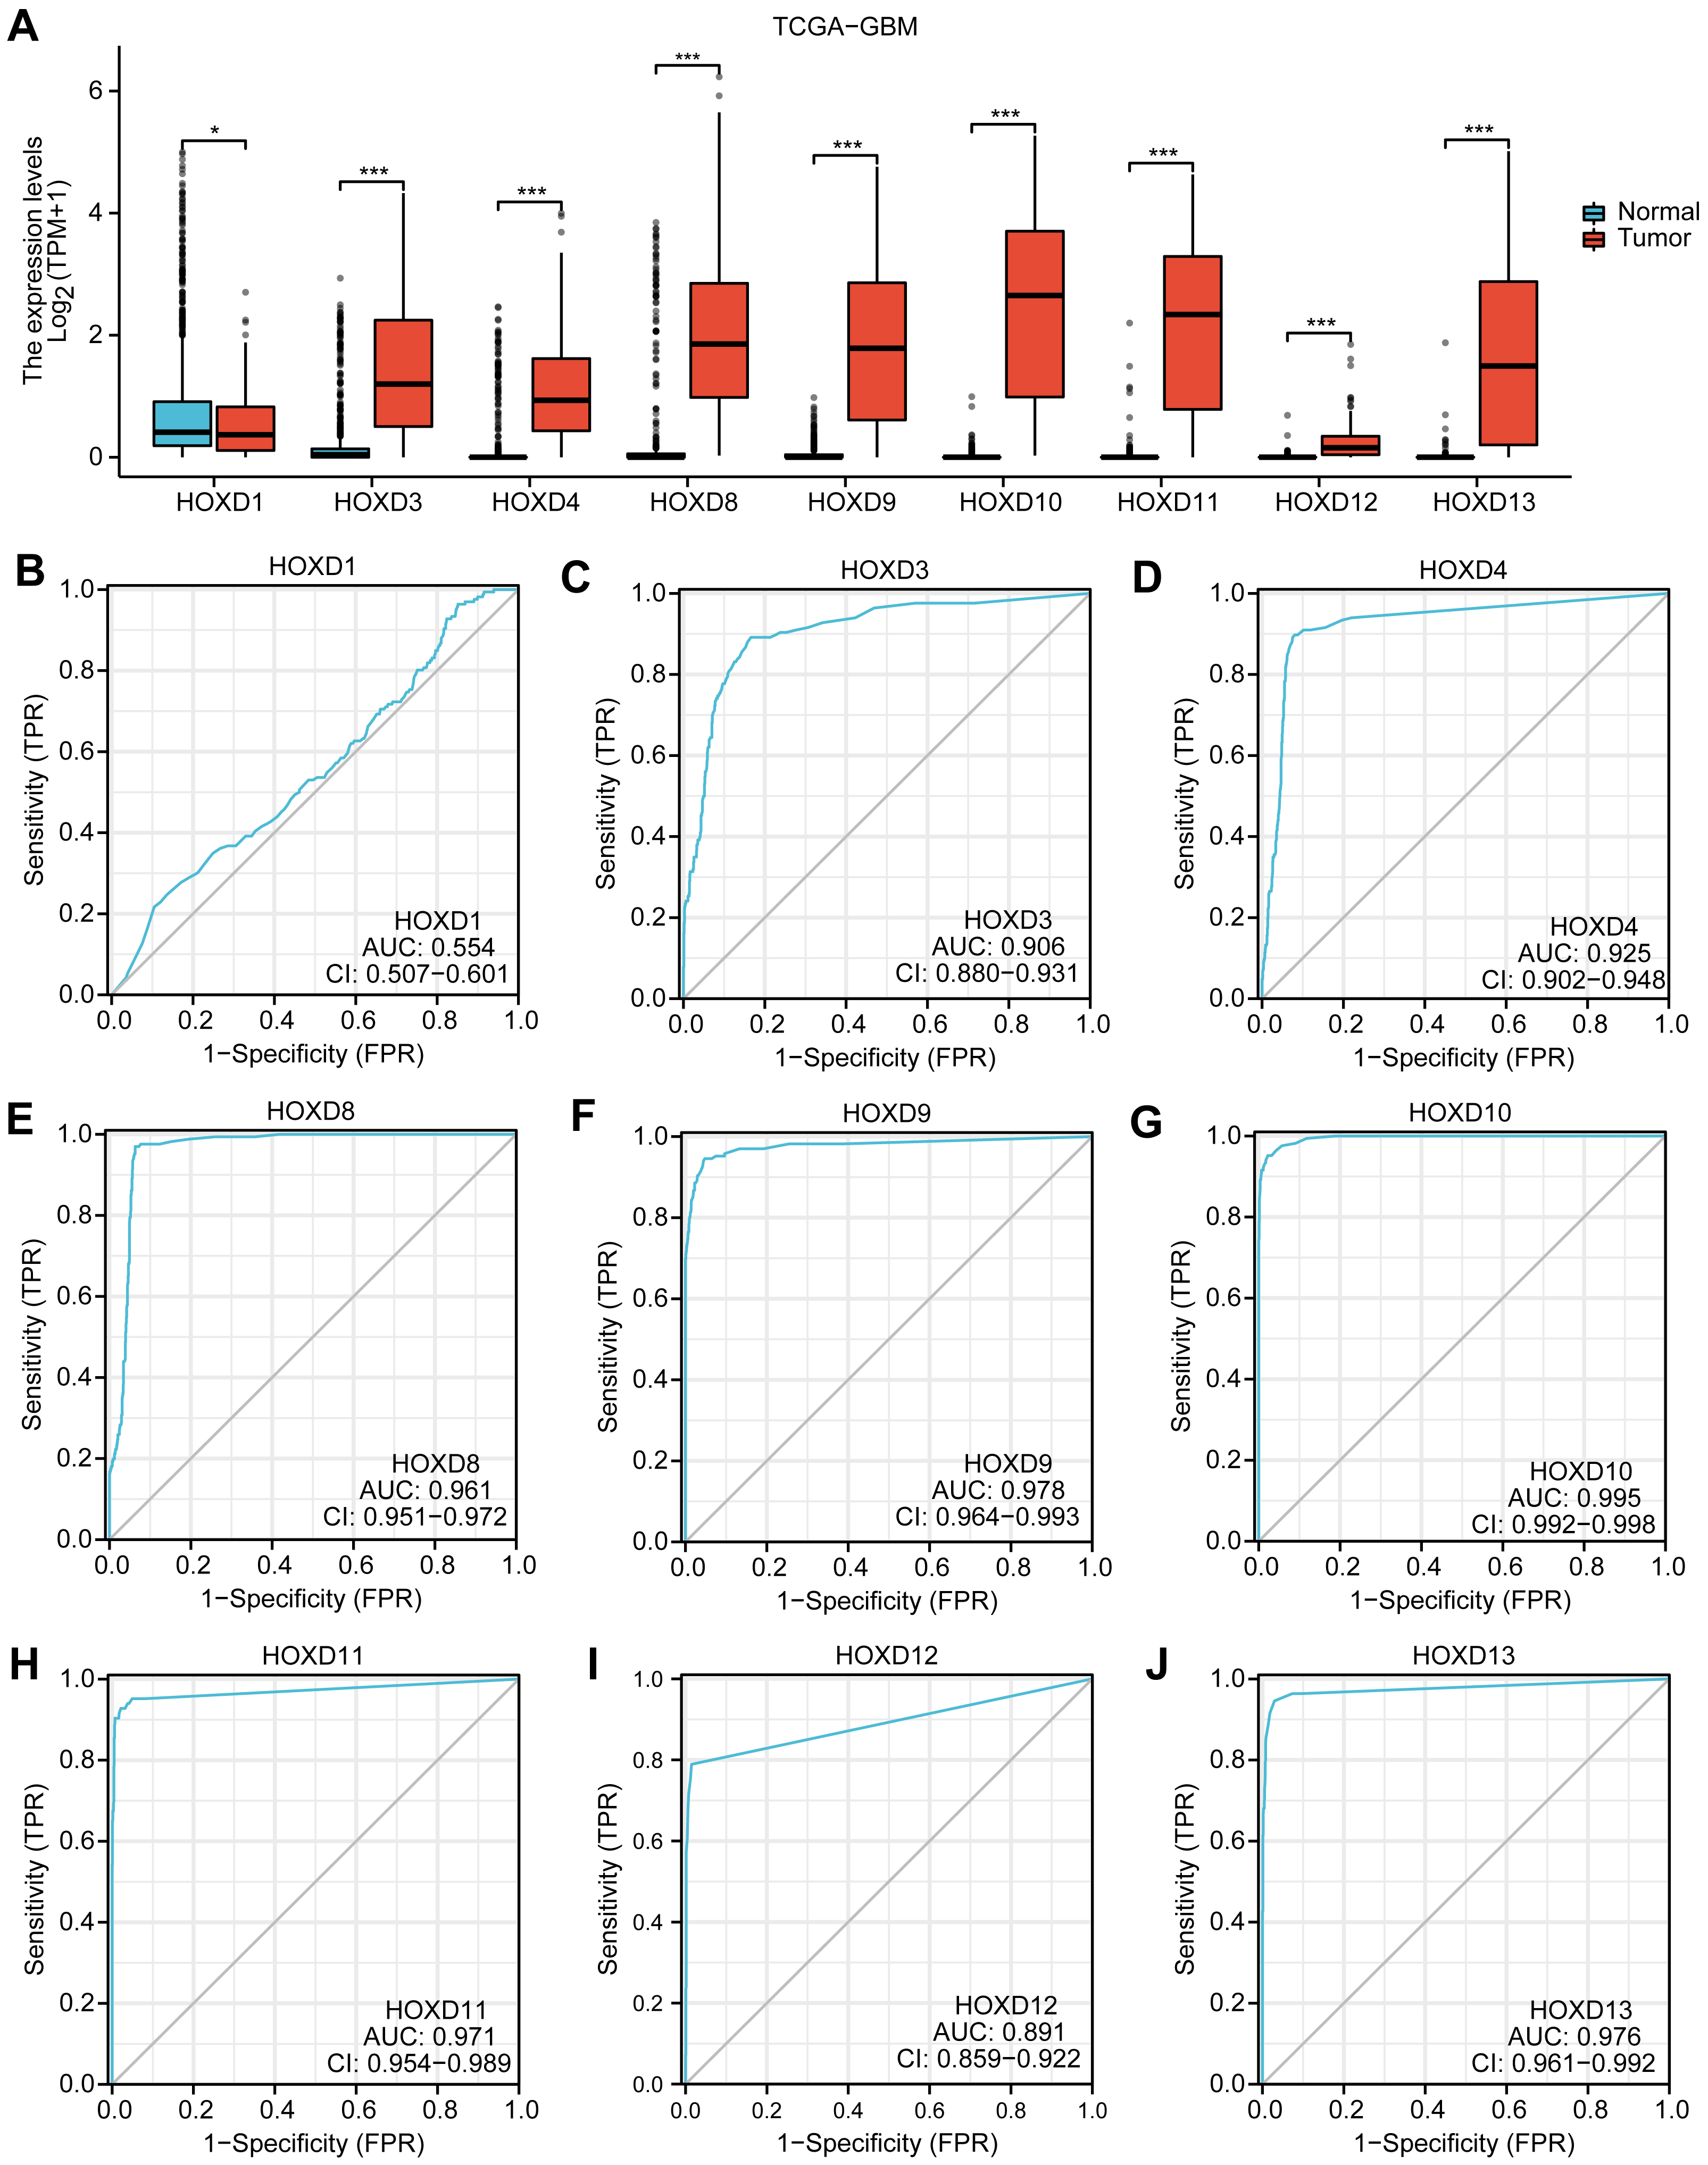 Fig. 1.
Differential expression analysis of HOX family genes in
the TCGA-GBM dataset. (A) The comparative grouping figure displayed the
expression difference analysis results for the HOXD gene family in the TCGA-GBM
dataset. (B–J) The ROC curve represented the gene expressions of HOXD1,
HOXD3, HOXD4, HOXD8, HOXD9, HOXD10,
HOXD11, HOXD12, and HOXD13 in the TCGA-GBM dataset. *p
Subsequently, the ROC curve revealed that the expression level of HOXD1 (AUC = 0.554) had a low correlation between the Tumor and Normal groups. On the other hand, the expression level of HOXD12 (AUC = 0.891) demonstrated a certain correlation in the GBM dataset. Additionally, the expression of HOXD3 (AUC = 0.906), HOXD4 (AUC = 0.925), HOXD8 (AUC = 0.961), HOXD9 (AUC = 0.978), HOXD10 (AUC = 0.995), HOXD11 (AUC = 0.971) and HOXD13 (AUC = 0.976) in TCGA-GTEx-GBM exhibited a high correlation between the Tumor and Normal groups (Fig. 1B–J). Consequently, we identified seven candidate genes by plotting the ROC curves.
We analyzed the clinical information from GBM samples and created survival
curves for nine HOX family genes in the TCGA-GBM dataset (FPKM format).
These curves depict overall survival (OS) and disease-specific survival (DSS)
outcomes. Our findings revealed that only HOXD9 (p = 0.028),
HOXD10 (p = 0.042), and HOXD12 (p = 0.048)
exhibited statistically significant correlations with the overall survival of GBM
patients, based on their expression levels (p
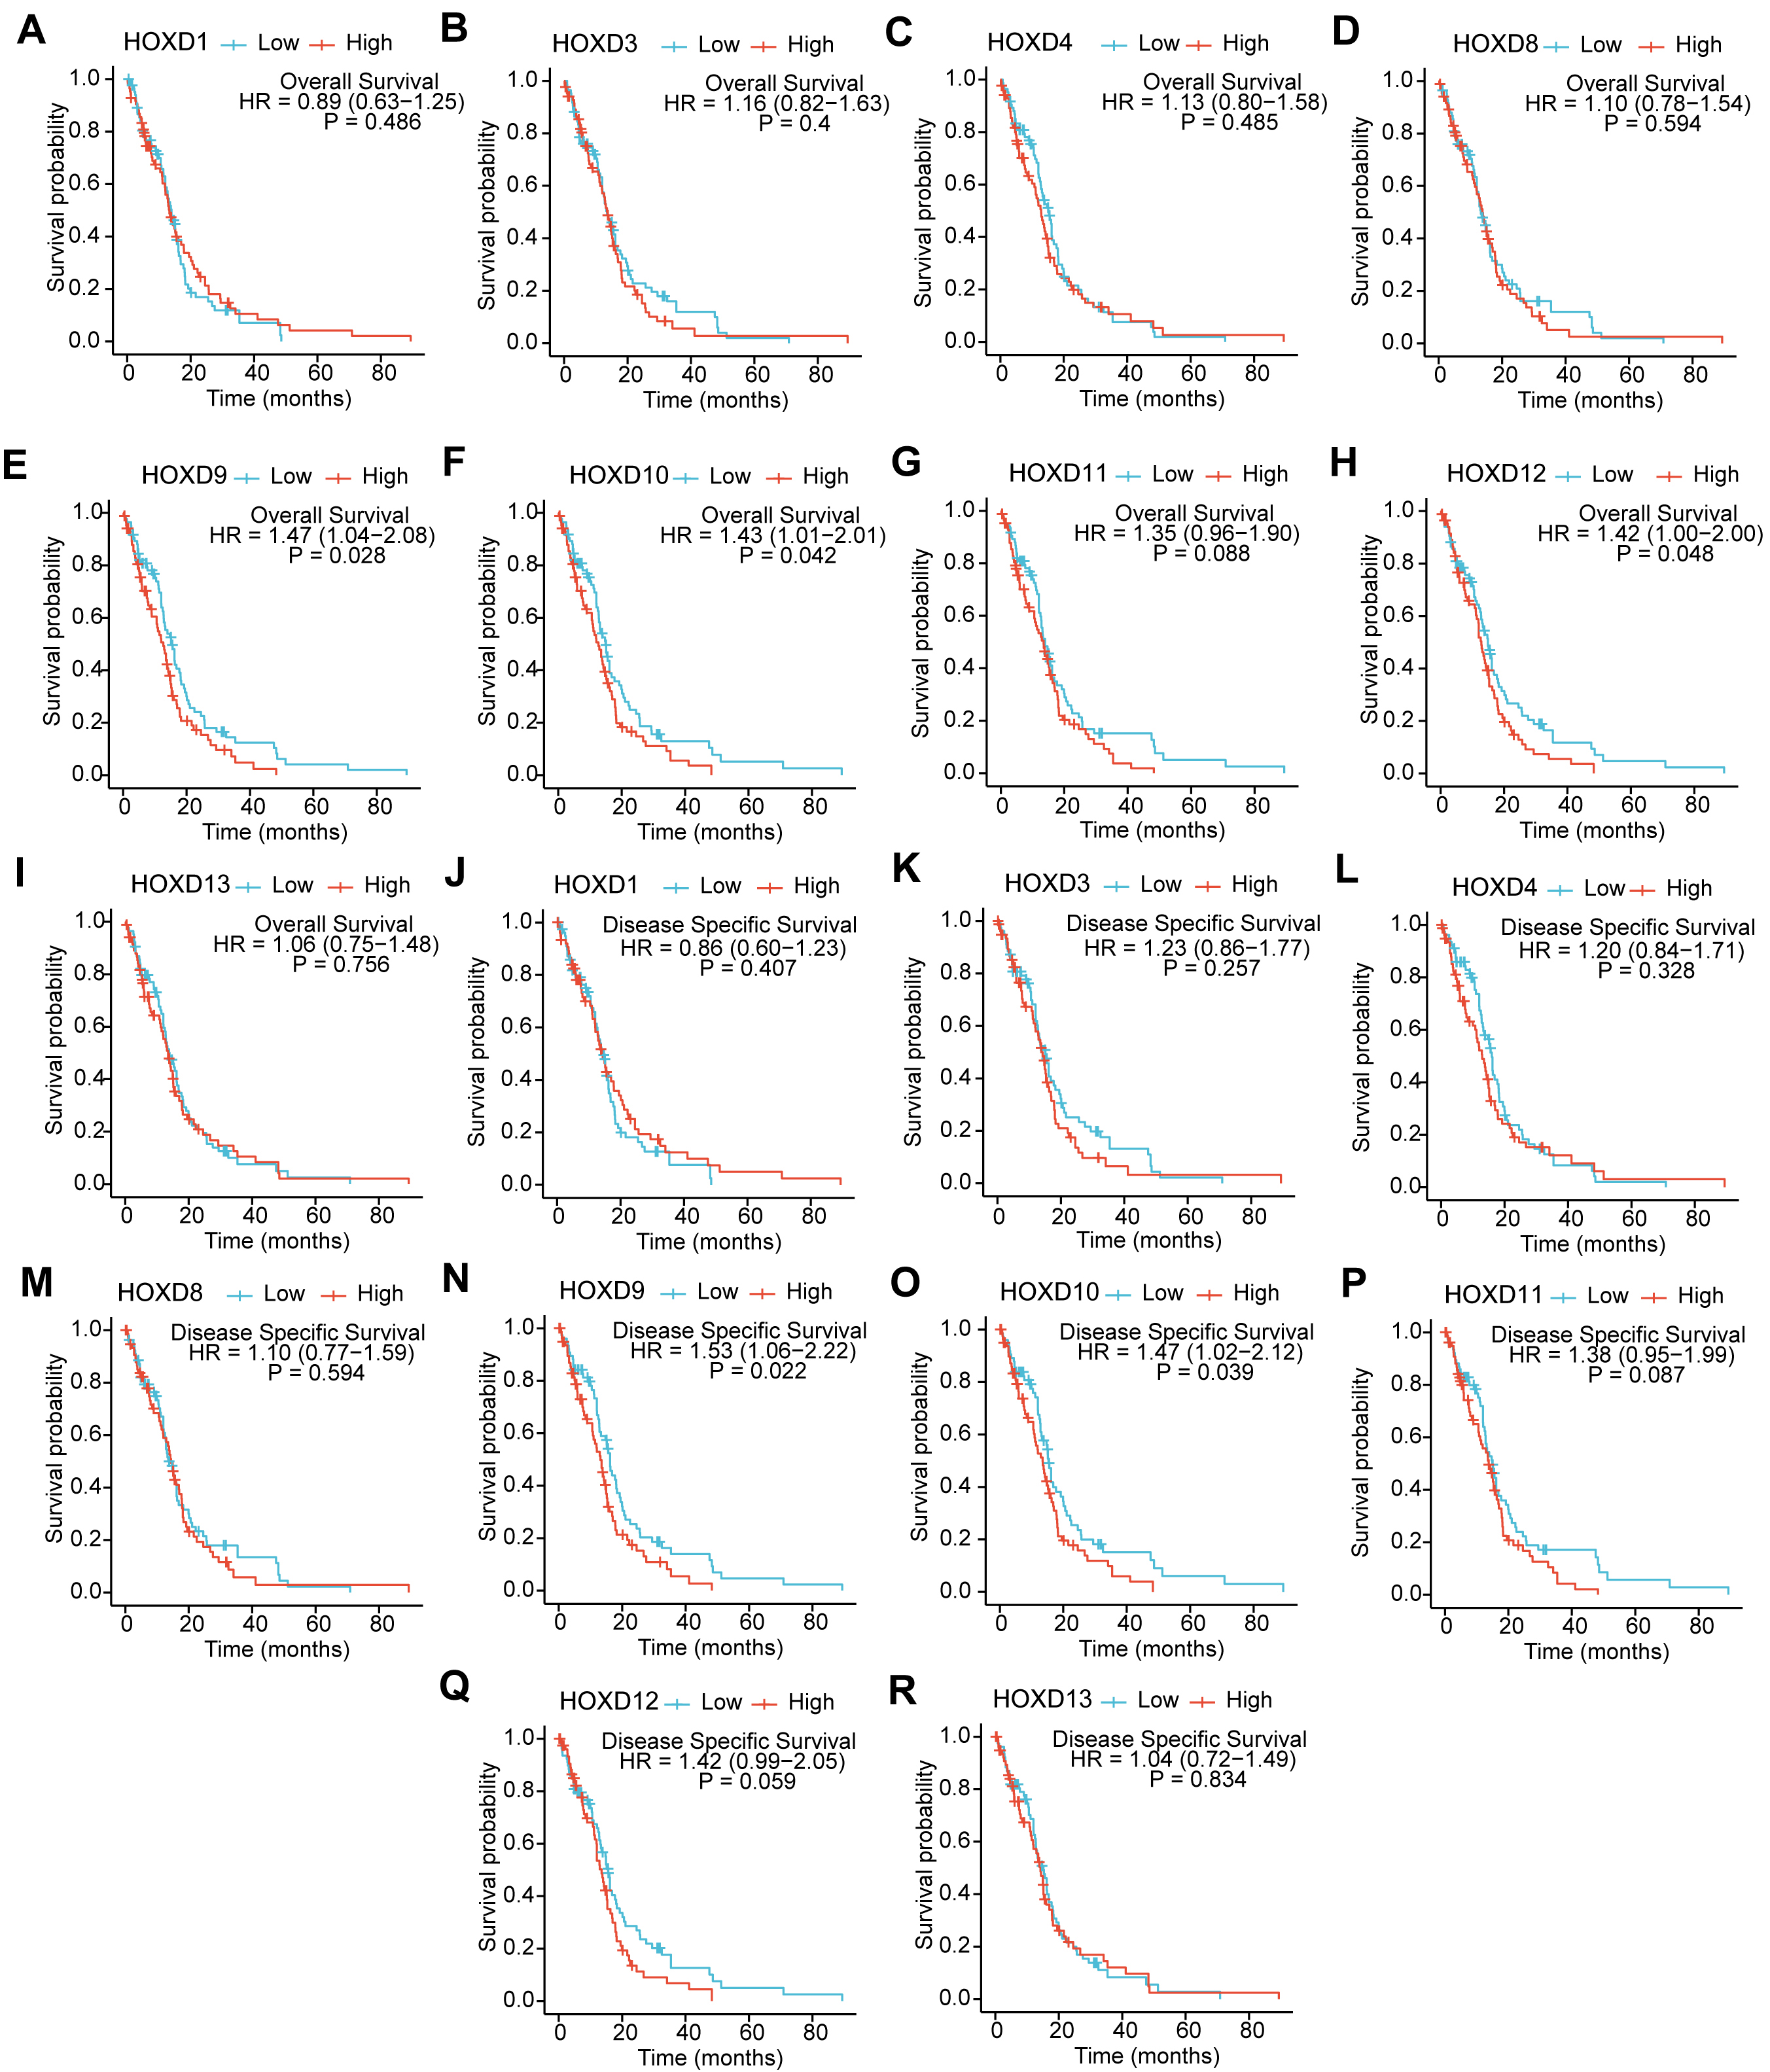 Fig. 2.
Prognostic KM curve analysis of HOX family genes. (A–I) The OS analysis curves in the TCGA-GBM dataset. (J–R) DSS analysis curves from the TCGA-GBM dataset. Each point on the curve represents the survival rate of patients at that specific time point. The “+” symbol on the curve represented censored data. HOX, homeobox; TCGA, the Cancer Genome Atlas; GBM, Glioblastoma; KM, Kaplan-Meier; OS, overall survival; DSS, disease specific survival; HR, hazard ratio.
The DSS KM curves of the HOXD gene family in the FPKM format TCGA-GBM
dataset indicated that the expression levels of HOXD9 (p =
0.022) and HOXD10 (p = 0.039) were significantly associated
with the disease-specific survival of GBM patients (p
To delve deeper into the correlation between the expression levels of
HOX family genes in GBM and various subgroups within the GBM dataset, we
conducted an online analysis using the GEPIA. The TCGA-GTEx-GBM dataset on the
GEPIA website includes 163 samples from the tumor group (T) and 207 samples from
the normal group (N). The analysis revealed that all nine gene expressions in the
tumor group were higher in the GBM dataset. However, the expression differences
of HOXD1, HOXD4, and HOXD12 in GBM did not show
statistical significance (p
Furthermore, we performed a prognostic KM
curve analysis to assess the relationship between the expression levels of the 9
HOX family genes in GBM and the OS of GBM patients. The analysis
revealed that the expressions of HOXD1, HOXD3, HOXD4,
HOXD8, HOXD11, and HOXD13 did not exhibit
statistically significant correlations with the prognosis of GBM patients
(p (HR)
We selected nine genes from the HOXD family based on the results of the
above differential analysis and prognostic KM curve analysis. We then summarized
the results of our analyses, including differential analysis (Fig. 1A) and ROC
curve analysis (Fig. 1B–J) in the GBM dataset of TCGA combined with GTEx, as
well as the results of differential analysis of the expression of the
HOXD family genes in the GBM dataset on the GEPIA website
(Supplementary Fig. 1A–I) and then plotting a Venn diagram (Fig. 3A).
As depicted in Fig. 3B, the outcomes of the prognostic survival KM curves for OS
(Fig. 2A–I) and DSS KM curves (Fig. 2J–R) of the nine genes of the
HOXD family in the TCGA-GBM dataset, as well as the results of the
prognostic KM curves analysis of the HOXD family genes in the GBM
dataset from the GEPIA website (Supplementary Fig. 1J–R) were also
summarized in the form of a Venn diagram for presentation. The results showed
that six of the nine HOXD family genes showed statistically significant
(p
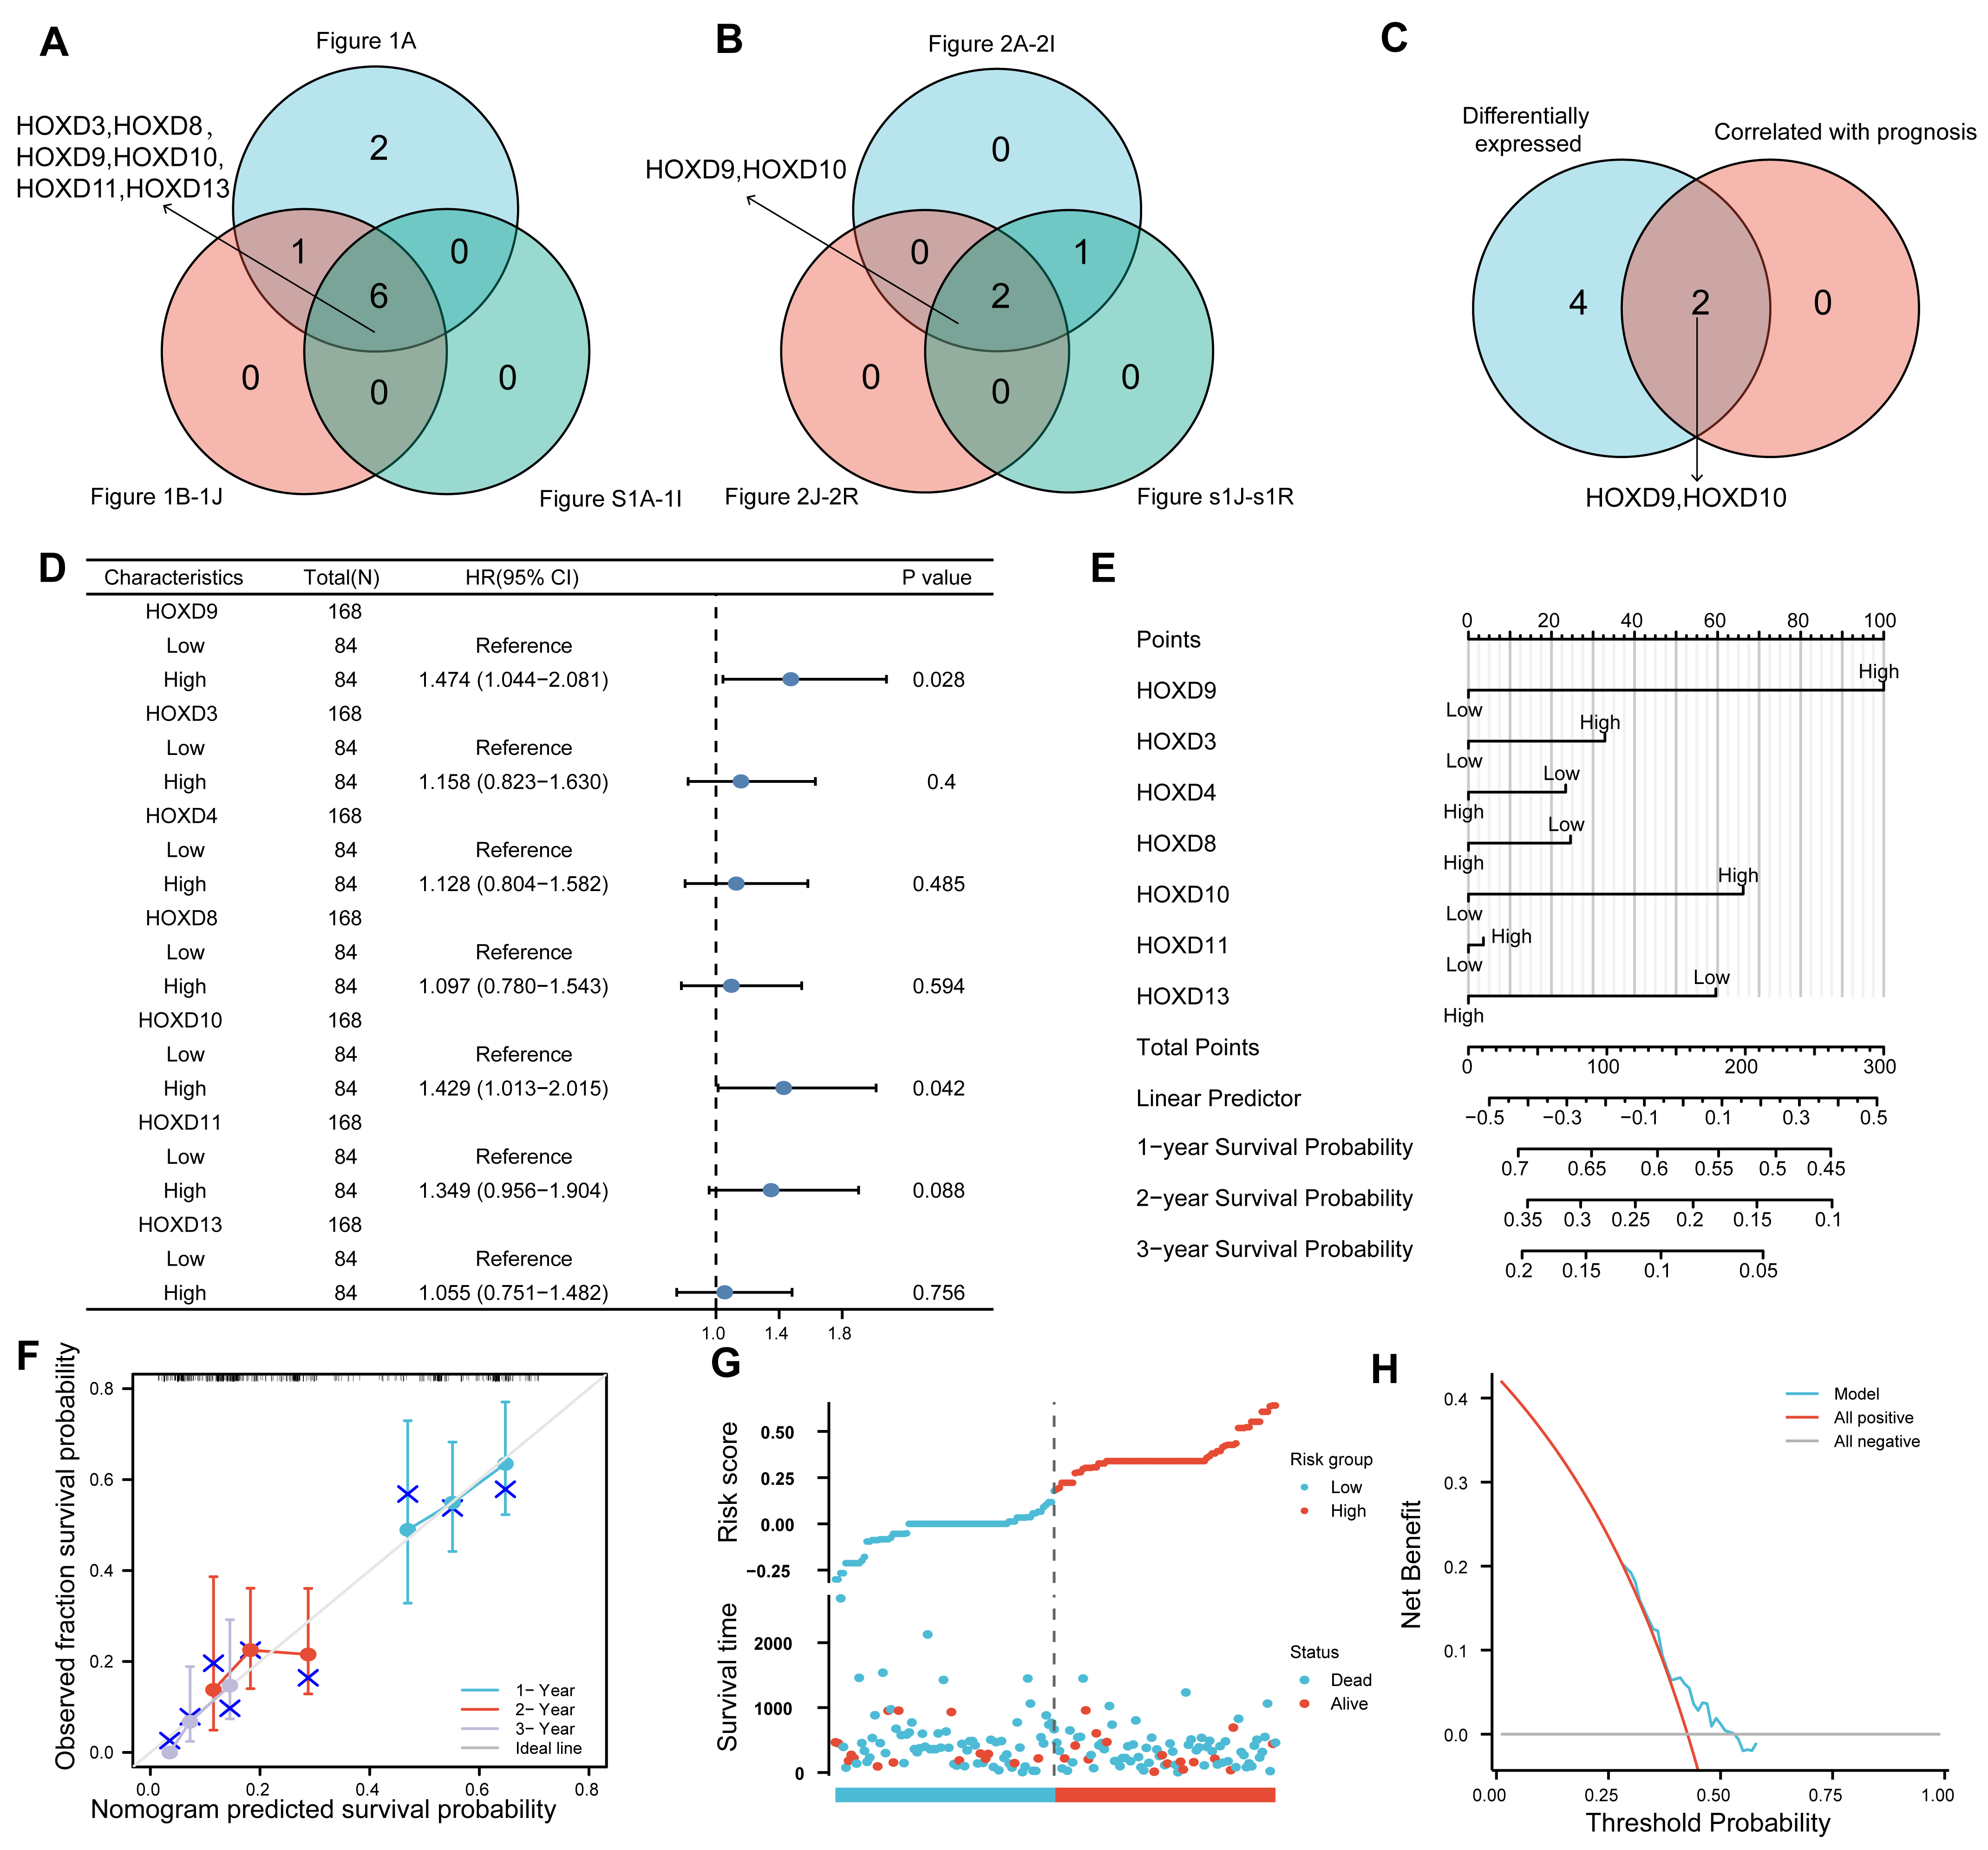 Fig. 3.
Target gene screening and single gene co-expression analysis. (A) This Venn diagram depicted the results of the differential analysis performed on the TCGA_GTEx-GBM dataset, as well as the results obtained from the ROC curve analysis and GEPIA analysis of the HOX family genes in the GBM dataset. (B) A Venn diagram was used to summarize and illustrate the prognostic survival KM curves for both OS and DSS of the 9 HOX family genes in the TCGA-GBM dataset (FPKM format). Additionally, the Venn diagram included the prognostic KM curve analysis results for OS of the HOX family genes in the GBM dataset from the GEPIA website. (C) The Venn diagram results of the difference analysis and prognostic KM curve were summarized. (D) The forest plots showed the results of both the univariate and multivariate Cox regression analyses. (E) Nomogram analysis was used to evaluate the predictive ability of the Cox regression model. (F) Prognostic Calibration analyses were performed at 1, 2, and 3 years for variables in both univariate and multivariate Cox regressions. (G) Plotting the risk factors of the Cox regression prognostic model. (H) This study utilized DCA to assess how well the nomogram model predicts survival for patients with GBM. TCGA, the Cancer Genome Atlas; GTEx, Genotype-Tissue Expression; GBM, Glioblastoma; ROC, Receiver operating characteristic; HOX, homeobox; KM, Kaplan-Meier; OS, overall survival; DSS, disease specific survival; FPKM, Fragments Per Kilobase per Million; DCA, decision curve analysis; HR, hazard ratio; CI, confidence interval.
To further validate the association between HOXD gene expression levels and GBM occurrence, univariate and multivariate Cox regression analyses were conducted using the TCGA-GBM dataset. The results indicated a significant correlation between the expression levels of HOXD9 and HOXD10 and the clinical prognosis of GBM patients (Fig. 3D). The clinical information of GBM patients is displayed in Supplementary Table 1. To assess the prognostic potential of the Cox regression model, we constructed a prognostic nomogram to predict the 1-, 2-, and 3-year overall survival of GBM patients (Fig. 3E). HOXD9 was the largest contributing factor and the most significant predictor of GBM. Furthermore, prognostic calibration analyses were performed for 1, 2, and 3-year time points, and calibration curves were plotted for the variables in both univariate and multivariate Cox regressions (Fig. 3F). The calibration curve demonstrated that the prognostic nomogram was reliable and accurate. At the same time, a risk factor diagram was used to visualize the grouping of risk factors in the Cox regression model (Fig. 3G,H).
Taken together, the significance of HOXD9 and HOXD10 was relatively similar in
the expression difference analysis. However, in the prognostic survival analysis,
HOXD9 (p = 0.028, Fig. 2E)
PFKFB3, an isoform of fructose-6-phosphate-2 kinase (PFK2) and a regulatory
glycolytic enzyme, is overexpressed in GBM, and selective inhibition of these
enzymes has emerged as a new avenue for tumor therapy [17]. HOXD9 is known to
bind directly to the promoter region of PFKFB3, thereby enhancing its
transcription [18]. Hypoxia also promotes HMGB1 expression and secretion in
glioma stem cells [21]. The lactate dehydrogenase inhibitor oxamic acid (OA) and
the PFKFB3 inhibitor 3PO block HMGB1-induced fibroblast proliferation and
glycolytic processes [22]. Importantly, the HOXD9-PFKFB3-glycolysis axis was
found in non-small cell lung cancer (NSCLC) [18]. It is believed that
HOXD9-mediated enhancement of PFKFB3 transcription may be involved in
HMGB1 secretion and glycolytic process in hypoxia-induced GBM. To confirm the
functional expression of HOXD9 in GBM cells, we assessed the expression of HOXD9,
HMGB1, and PFKFB3 in human normal glial cells and glioma cell lines using RT-qPCR
and western blotting analysis. We found a significant upregulation of HOXD9,
HMGB1, and PFKFB3 in U87-MG and U251-MG cells compared to HMC3 cells, but no
significant changes were observed in LN229 cells (Fig. 4A,B). Based on these
findings, we selected the glioma cell lines U87-MG and U251-MG for further
experiments. Subsequently, we exposed the cells to hypoxic conditions to
investigate the role of HOXD9 in hypoxia-induced glycolytic changes in GBM. The
results from RT-qPCR indicated a significantly elevated expression level of HOXD9
in the Hypoxia group compared with the Control group (Fig. 4D). To evaluate the
regulatory role of HOXD9 on hypoxia-induced HMGB1 secretion and glycolysis, we
transfected HOXD9 siRNA to GBM cells to silence HOXD9 expression and screened the
targets with the highest silencing efficiency (Fig. 4C). As expected, HOXD9
expression in the Hypoxia+si-HOXD9 group was significantly lower than that in the
Hypoxia+si-NC group, confirming the successful transfection (Fig. 4D). Notably,
the knockdown of HOXD9 counteracted the hypoxia-induced upregulation of HOXD9,
HMGB1, PFKFB3, and HIF-1
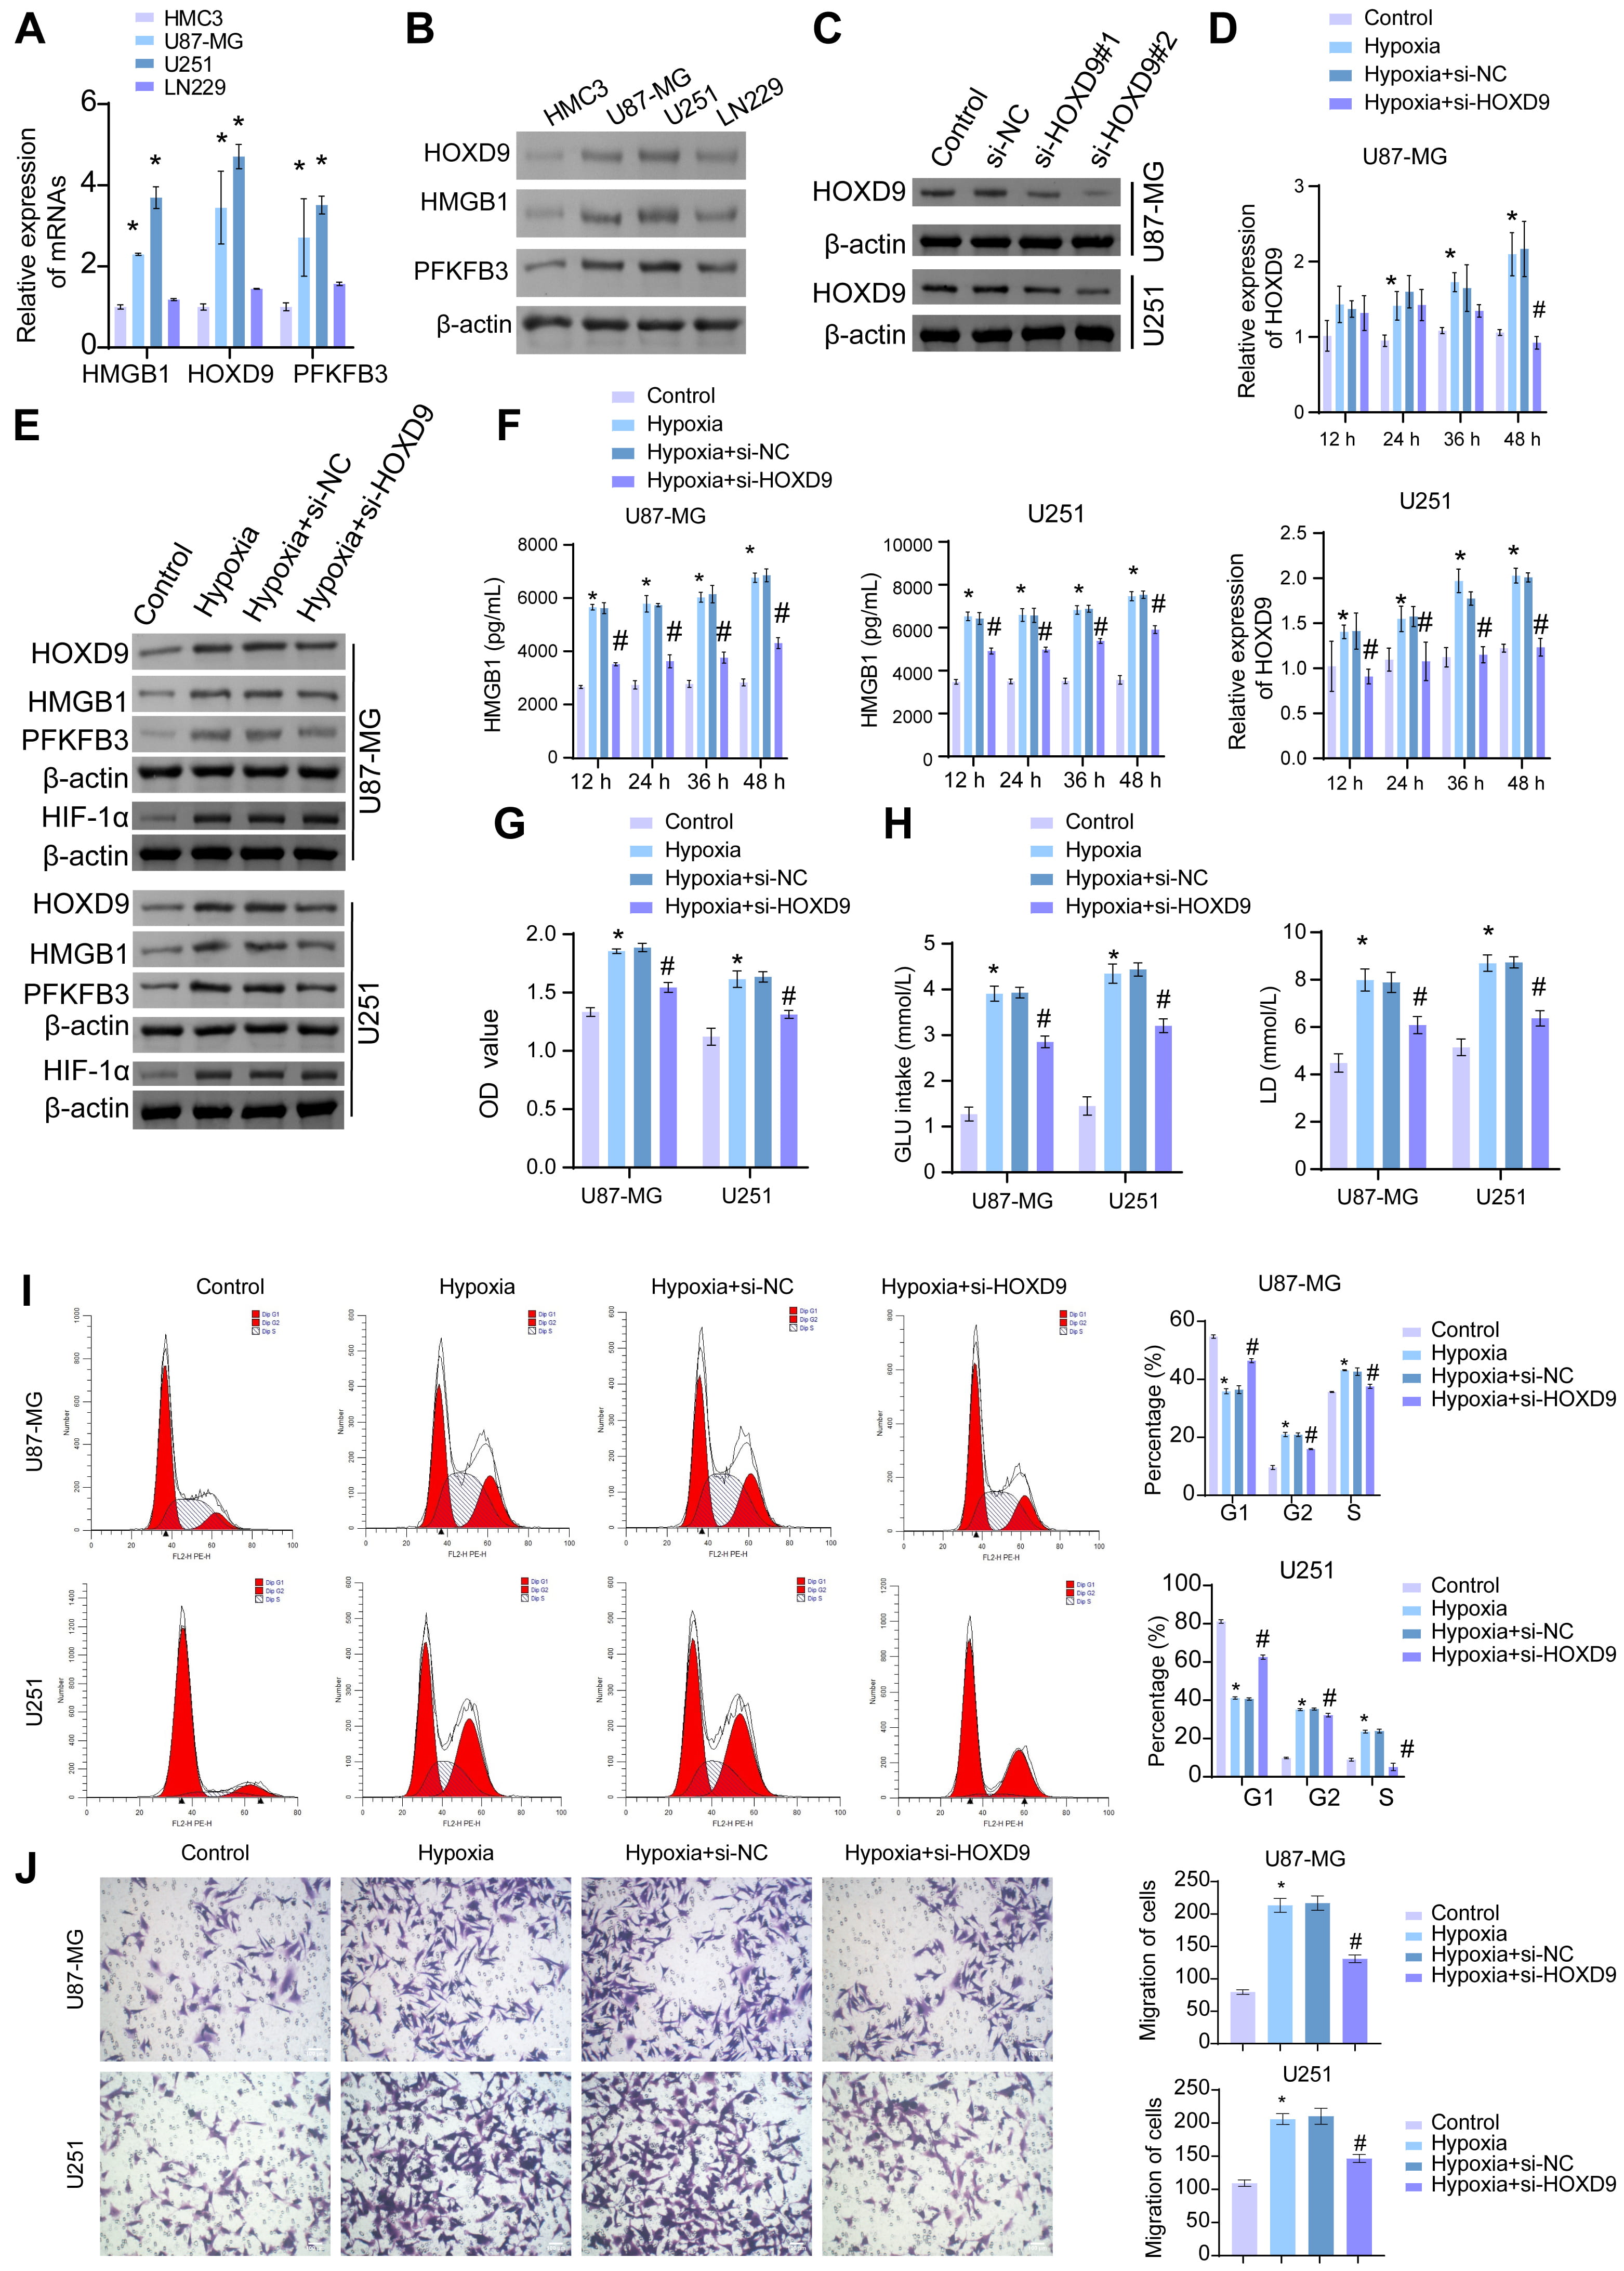 Fig. 4.
Silencing HOXD9 inhibited HMGB1 secretion and glycolysis in GBM
cells under hypoxic conditions. (A,B) RT-qPCR and western blotting were
used to detect the expression of HOXD9, HMGB1, and PFKFB3 in HMC3, U87-MG,
U251-MG, and LN229 cells. (C) The HOXD9 expression was examined using western
blotting. After hypoxia induction, (D) HOXD9 mRNA expression level in U87-MG and
U251-MG cells was detected by RT-qPCR. (E) Western blotting was used to analyze
HOXD9, HMGB1, PFKFB3, and HIF-1
Subsequently, to explore the effect of HOXD9 on hypoxia-induced HMGB1 secretion, we quantified the levels of HMGB1 in the cells through ELISA. The results revealed a significant increase in HMGB1 levels in the Hypoxia group r compared to the Control group. Furthermore, reducing the expression of HOXD9 led to a significant decrease in HMGB1 levels (Fig. 4F). Based on these findings, we chose U87-MG and U251-MG cells for further experiments, maintaining them under hypoxic conditions for 48 h. In the Hypoxia group, cell viability, as measured by the CCK-8 assay, exhibited a significant increase compared to the Control group. However, knocking down HOXD9 significantly reduced cell viability (Fig. 4G). Additionally, we assessed glucose uptake and lactate production levels in U87-MG and U251-MG cells. This finding revealed a significant increase in both glucose uptake and lactate production levels in the Hypoxia group compared to the Glucose uptake and Lactate production groups. Conversely, knocking down HOXD9 significantly decreased these levels (Fig. 4H). We also examined the proliferative and migratory abilities of the cells. Flow cytometry analysis revealed a notable decrease in the number of cells in the G1 phase in the Hypoxia group compared to the Control group. Interestingly, silencing HOXD9 led to a significant increase in cell count. In the G2 and S phases, the cell number significantly increased after hypoxia induction compared with the Control group, while the cell number significantly decreased after silencing HOXD9 (Fig. 4I). Transwell assays demonstrated a significant elevation in migration levels in the Hypoxia group compared to the Control group. However, knocking down HOXD9 significantly reduced these levels (Fig. 4J). In summary, these findings suggest that HOXD9 may enhance the proliferative activity and migratory capability of glioma cells under hypoxic conditions while promoting HMGB1 secretion and glycolysis in these cells.
We conducted the following verification to investigate further the potential regulation of the functional phenotype of GBM cells under hypoxic conditions through PFKFB3. Our RT-qPCR and western blotting results showed a significant increase in the expression of HOXD9, PFKFB3, and HMGB1 in the HMGB1 group compared to the NC group. After the intervention of PFKFB3 inhibitor 3PO, we did not observe significant changes in the levels of HOXD9 and HMGB1. Silencing of HOXD9 led to a significant reduction in the expression of both HOXD9 and PFKFB3, while the expression of HMGB1 remained unchanged in the HMGB1 group (Fig. 5A,B). In order to detect the regulatory role of HOXD9/PFKFB3 on HMGB1 secretion, ELISA was used to detect the secretion level of HMGB1 in U87-MG and U251 cells. As shown in Fig. 5C, HMGB1 overexpression significantly upregulated the secretion level of HMGB1 in GBM cells. However, there was no significant change in the secretion level of HMGB1 upon inhibition of HXOD9 or inhibition of PFKFB3. This may therefore be due to the fact that HMGB1 enhances the sequence-specific DNA-binding activity of the HOXD9 protein in vitro and its transcriptional activation in vivo in a dose-dependent manner [29]. The downregulation of HOXD9 resulted in a decrease in the uptake of HMGB1, and at the same time, the promotion of HMGB1 secretion by HOXD9/PFKFB3 was inhibited. The two phases resulted in no significant change in HMGB1 levels in GBM cell supernatants. The HMGB1 group exhibited increased cell viability, changes in cell cycle distribution, and enhanced migration levels compared to the NC group. However, following intervention with the 3PO inhibitor and si-HOXD9, the cell viability and migration levels decreased significantly, and there was an increased percentage of cells in the G1 phase of the cell cycle (Fig. 5D–F). These results suggested an interaction between HMGB1 and HOXD9. We verified the expression of HOXD9 and PFKFB3 using IF double staining, which showed a significant increase in the expression levels after HMGB1 overexpression. Notably, PFKFB3 inhibitors did not significantly affect HOXD9 expression, but silencing HOXD9 inhibited the expression of PFKFB3 (Fig. 5G and Supplementary Fig. 2). Furthermore, in U87-MG and U251-MG cells under hypoxic conditions, the HMGB1 group exhibited significantly elevated levels of glucose uptake and lactic acid production. However, in the HMGB1+3PO and HMGB1+si-HOXD9 groups, the levels were significantly lower than those observed in the HMGB1 group (Fig. 5H). ChIP results showed that HOXD9 was bound to the PFKFB3 promoter region (Fig. 5I). As displayed in Fig. 5J, transfection of HOXD9 overexpression plasmid resulted in a significant increase of HOXD9 mRNA and protein levels in U87-MG and U251 cells. Overexpression of HOXD9 was observed by ChIP-qPCR data to significantly enhance the ability of HOXD9 to bind to the promoter region of PFKFB3 (Fig. 5K). These findings suggest that HOXD9 could promote cell proliferation and migration by activating PFKFB3 transcription and participating in HMGB1 secretion and glycolysis in glioma cells under hypoxic conditions. Conversely, HMGB1 could promote the expression of HOXD9.
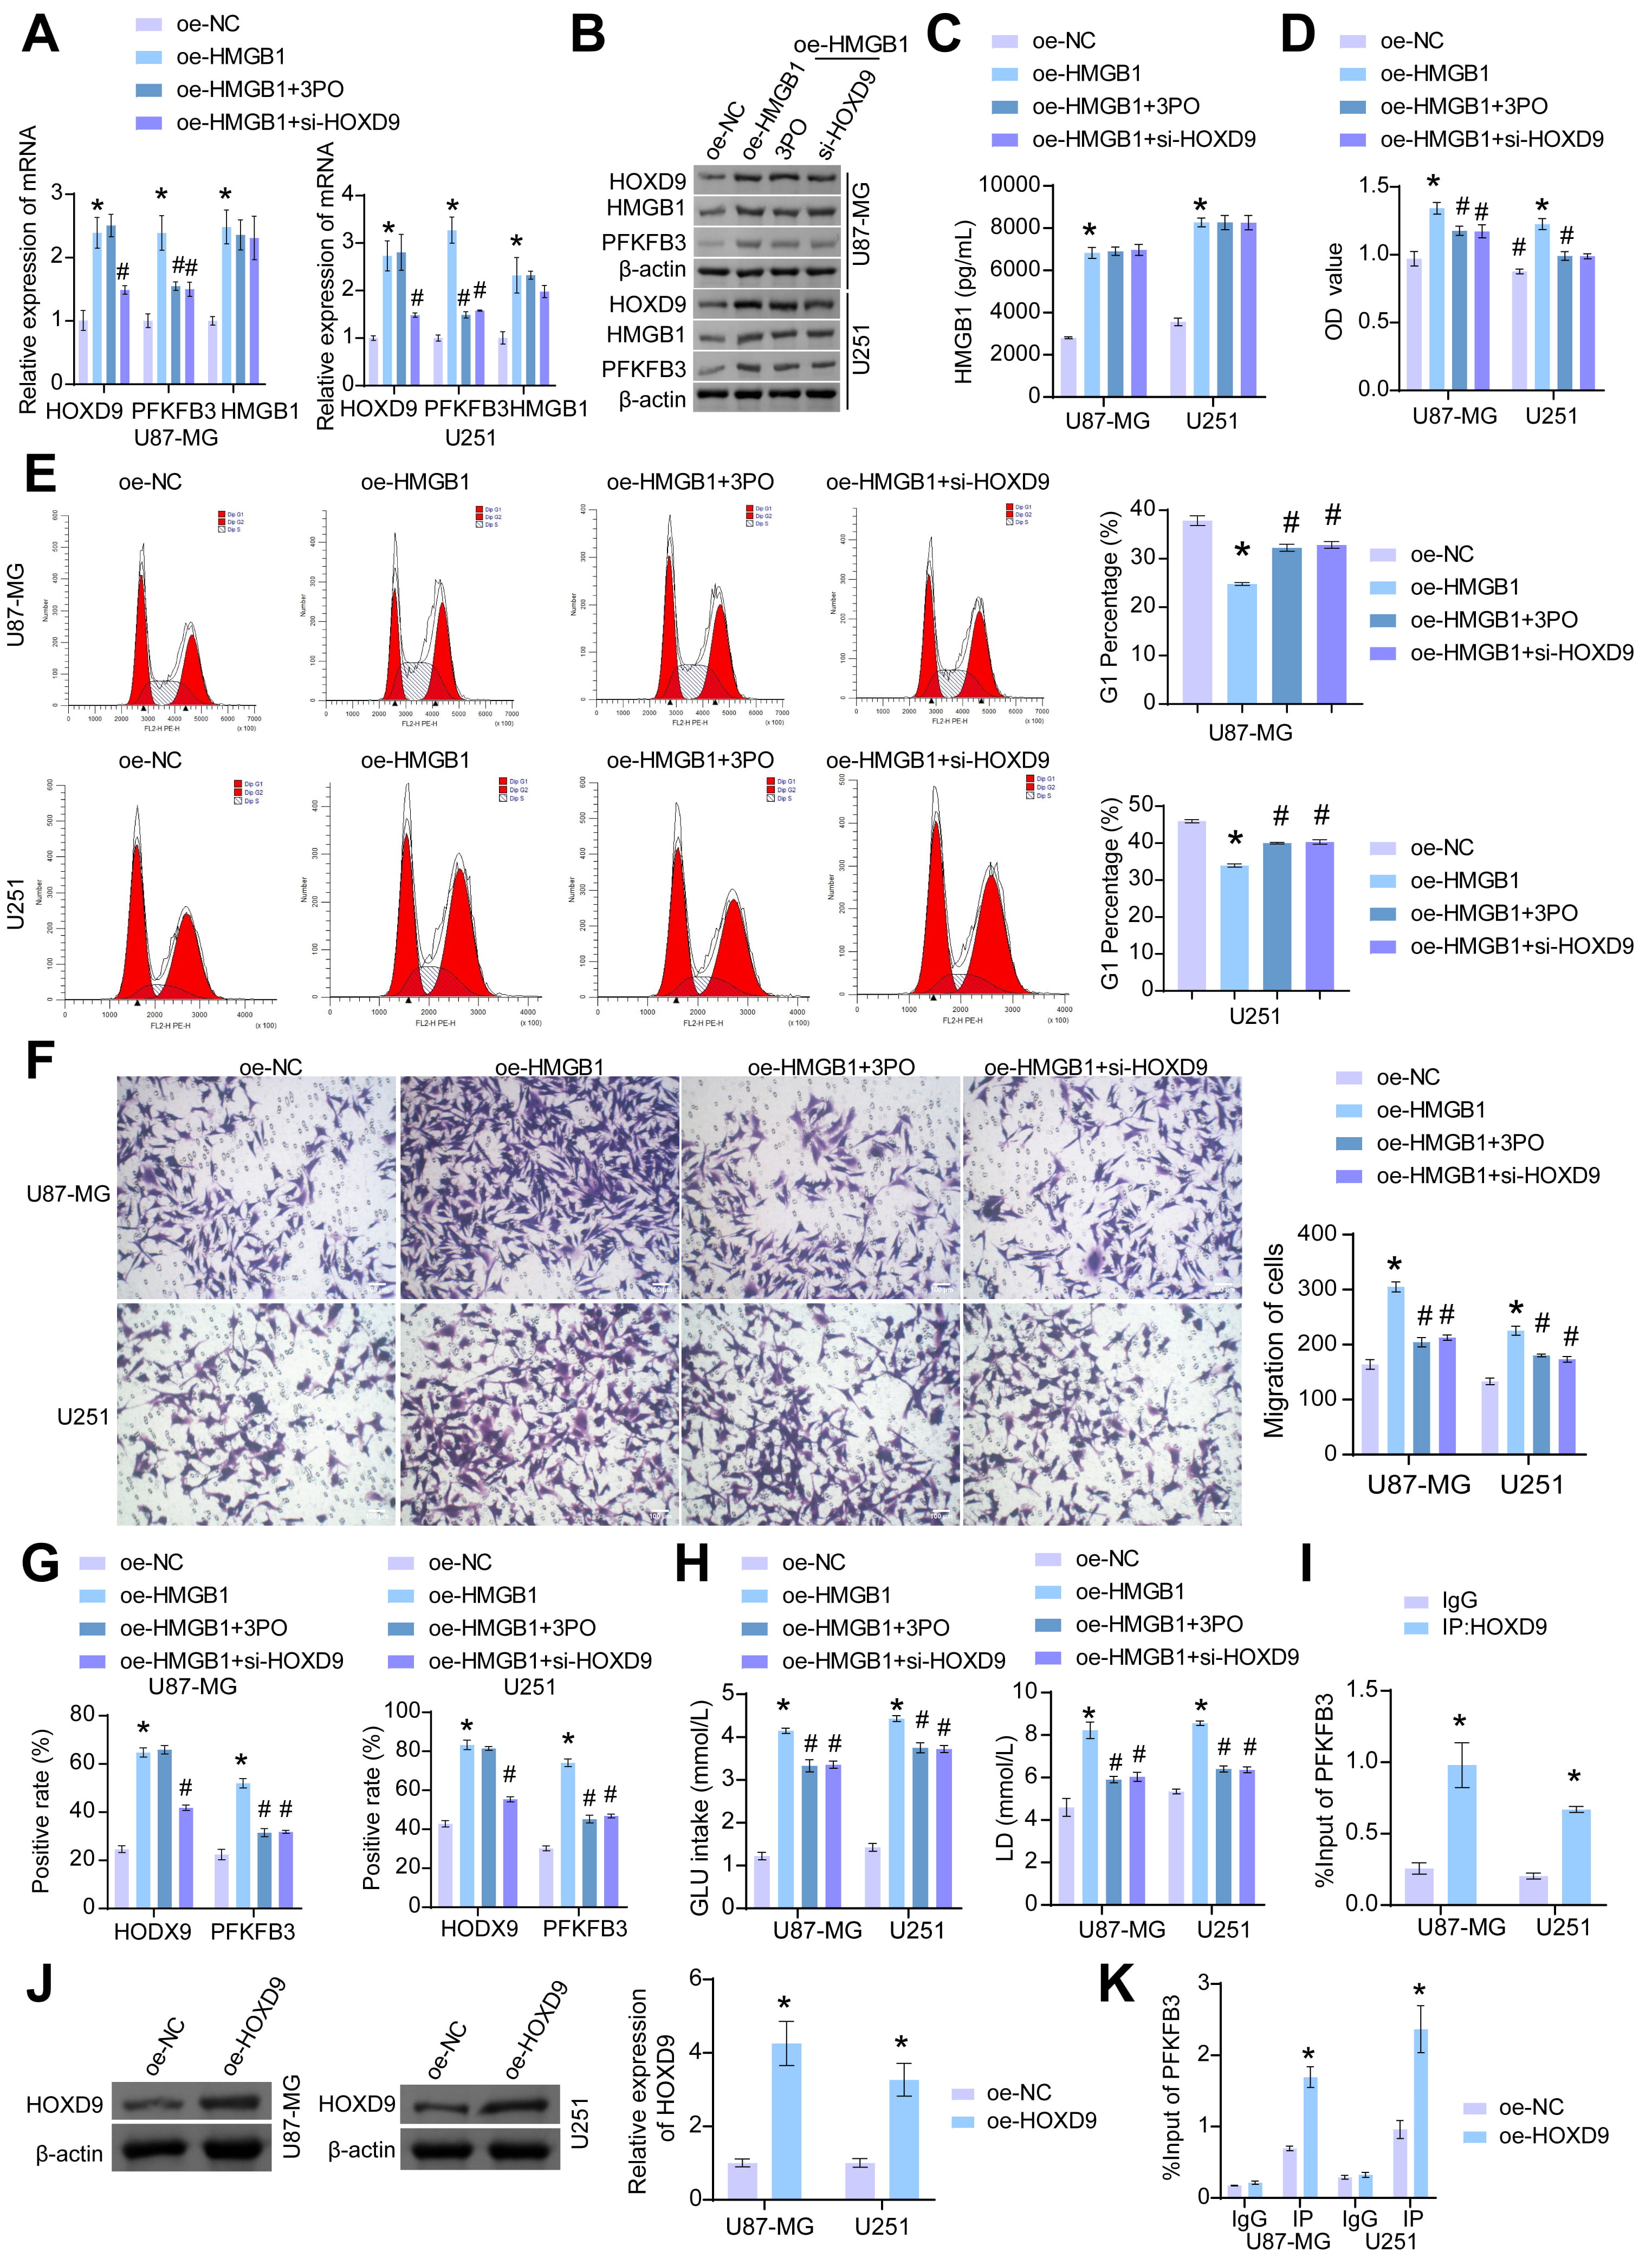 Fig. 5.
HOXD9 promoted HMGB1 secretion and glycolysis in GBM cells under
hypoxic conditions by transcriptional activation of PFKFB3. (A,B) The
expression levels of HMGB1, HOXD9, and PFKFB3 were determined using RT-qPCR and
western blotting. (C) The levels of HMGB1 secretion were evaluated by ELISA. (D)
The viability of the cells was measured by CCK-8 assay. (E) Flow cytometry was
performed to detect the distribution of two types of GBM cells in cell cycle
stages after different treatments. (F) The migration abilities of the cells were
evaluated using a transwell assay. Scale bar = 100 µm. (G) The expression
of HOXD9 and PFKFB3 was detected using IF. (H) Relevant kits were used to measure
the cells’ GLU intake and LD production levels. (I) ChIP was used to analyze
HOXD9 binding to the PFKFB3 promoter region. (J) The mRNA and protein
levels of HOXD9 were evaluated in U87-MG and U251 cells. (K) ChIP was utilized to
analyze HOXD9 binding to the PFKFB3 promoter region. *p
To further investigate the role of HOXD9 in GBM formation, we conducted tumor formation experiments in nude mice. The results showed a significant reduction in both tumor volume and mass in the si-HOXD9 group compared to the Control group. Conversely, overexpression of PFKFB3 led to a significant increase in tumor volume and mass (Fig. 6A,B). Subsequently, we detected the expression of HOXD9, PFKFB3, and HMGB1 in tumor tissues. Compared to the Control group, the expressions of both HOXD9 and PFKFB3 were significantly decreased in the si-HOXD9+oe-PFKFB3 group, while the expressions in the si-HOXD9+oe-NC group were higher. Overexpression of PFKFB3 partially counteracted the inhibitory effect of silencing HOXD9 on HMGB1 protein expression (Fig. 6C,D). In addition, the silencing of HOXD9 in tumor tissues led to a considerable increase in residual glucose levels and a significant decrease in lactic acid production levels. In comparison to the si-HOXD9+oe-NC group, the residual glucose level was significantly reduced in the si-HOXD9+oe-PFKFB3 group, while the level of lactic acid production was significantly increased (Fig. 6E). Our findings suggest that the HOXD9/PFKFB3 pathway promoted HMGB1 secretion, glycolysis process, and tumor formation in GBM under hypoxic conditions.
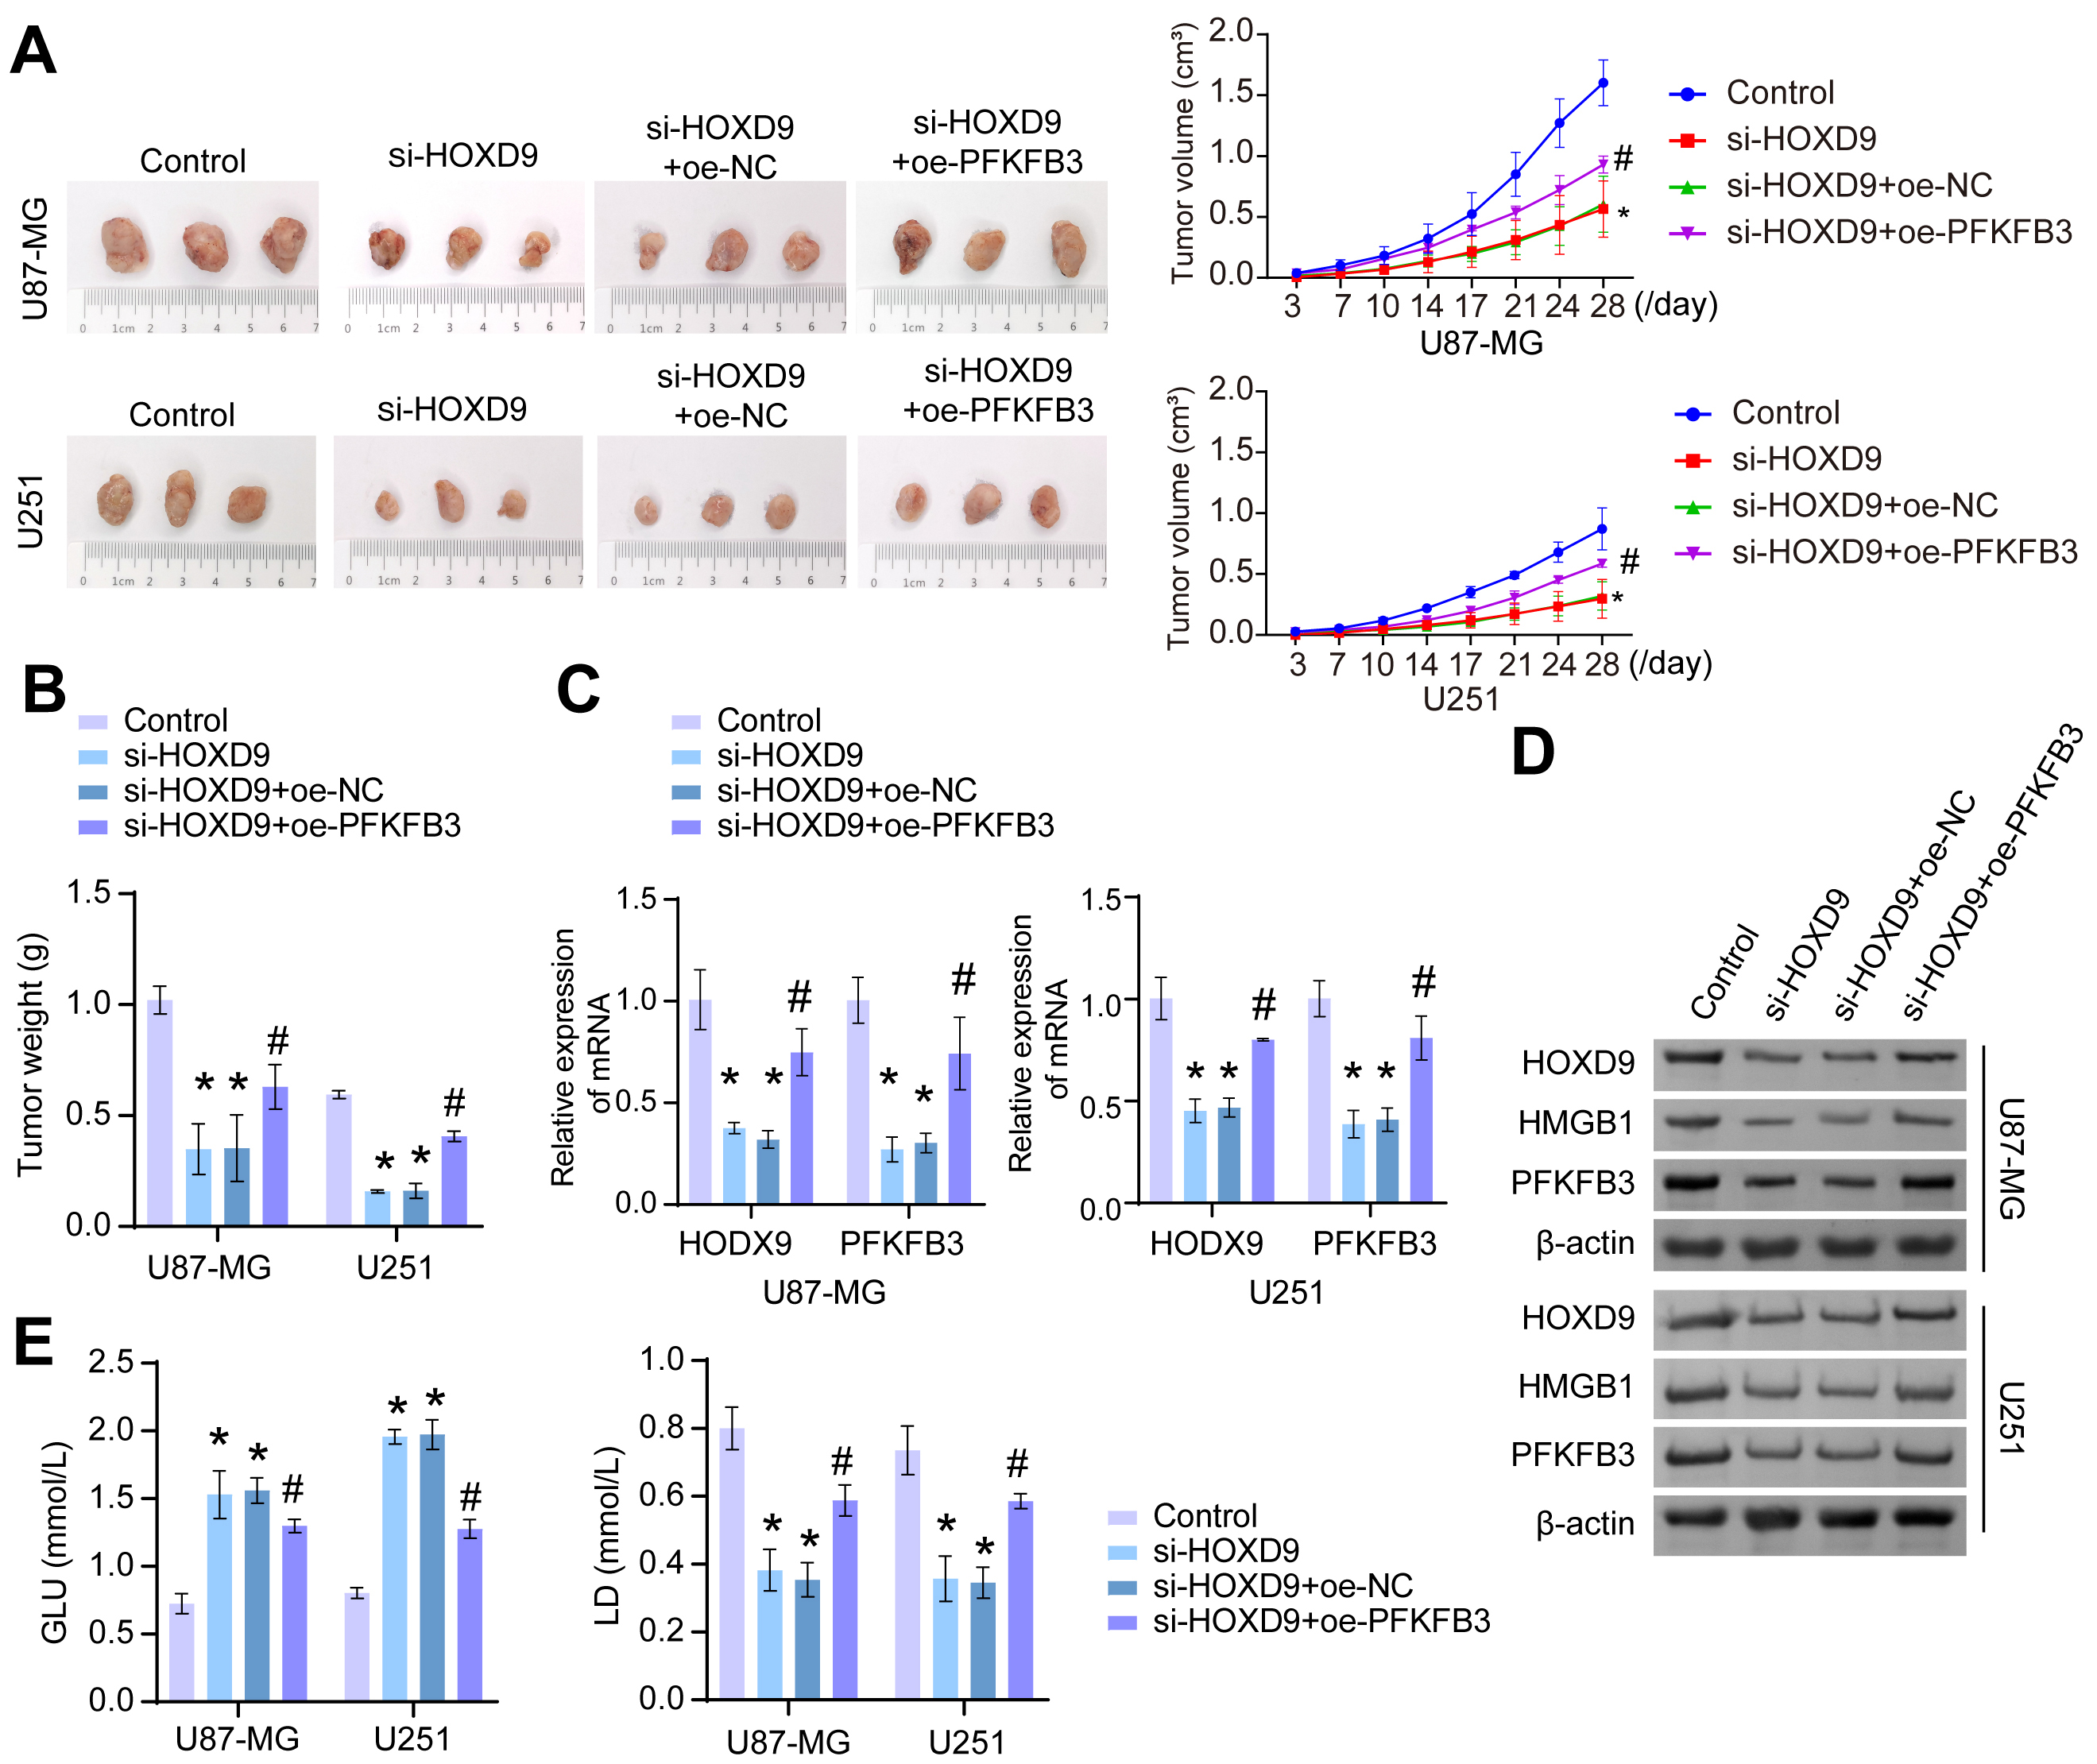 Fig. 6.
HOXD9/PFKFB3 promoted tumor formation by promoting HMGB1
secretion and glycolysis in GBM under hypoxic conditions. (A,B) After
the tumor formation experiment in nude mice, the changes in tumor volume and mass
were photographed and recorded. (C) RT-qPCR was used to determine the mRNA levels
of HOXD9 and PFKFB3 in tumor tissues. (D) The protein expression of HOXD9, HMGB1,
and PFKFB3 in tumor tissues was detected using western blotting. (E) The levels
of GLU and LD in tumor tissue were measured. *p
The Warburg effect is a well-known phenomenon in cancer cells. It involves the generation of energy through glycolysis, which is abnormal proliferation that contributes to malignant development [30]. In hypoxic conditions, cancer cells undergo metabolic reprogramming to ensure their energy production and survival [14]. It was shown that hypoxia increases the passage of glucose into glycolysis [31]. Mucaj V et al. [32] found that glioma cells preferentially rely on glycolysis and produce high levels of lactate. Under hypoxic conditions, linking hypoxia to malignant progression and poor prognosis in GBM patients [33, 34]. Our study found a significant association between elevated expression of the HOXD9 gene and poor prognosis among GBM patients. Functional expression experiments and an animal model of GBM were conducted to investigate the role of HOXD9 in hypoxia-induced glycolytic changes in GBM. Our results reveal that both HOXD9 may serve as a biomarker for predicting prognosis of GBM patients and imply an important role in GBM development and progression.
To examine the expression variations of nine genes in the HOX family within GBM, the Mann-Whitney U test was performed. Seven genes showed a strong correlation between two groups in the TCGA-GTEx-GBM dataset, as identified by plotting ROC curves. HOXD9 and HOXD10 were found to be statistically significant genes in the differential analysis and prognosis KM curve analysis of the GBM dataset through the combination of differential analysis Venn diagram and prognosis KM curve Venn diagram results. Through univariate and multivariate Cox analysis, HOXD9 was identified as a key gene for the prognosis of GBM patients. Recent research has highlighted the potential of HOXD9 as a promising prognostic biomarker, suggesting its role in influencing the immune microenvironment of neuroglial tumors [35]. Moreover, reports suggested a close association between HOXD9 and both metastasis rate and poor prognosis in cervical cancer [36], pancreatic cancer [37], and breast cancer [38] patients. Thus, these researches indicated the crucial role of HOXD9 in tumor development.
HOXD9 is a promising transcription factor that has been shown to regulate both coding genes and non-coding RNA in previous studies [39, 40]. These studies have demonstrated that HOXD9 plays a crucial role in inducing epithelial-mesenchymal transition (EMT) in tumor cells, thereby supporting their invasive characteristics [41]. It has been observed that HOXD9 significantly influences the proliferation and survival of glioma cells [12]. Consistent with these results, our study successfully demonstrated elevated expression levels of HOXD9 not only in glioma cells but also in tumor tissues. Furthermore, we selected U87-MG and U251-MG cells for in vitro functional validation. Our data suggest that HOXD9 promotes cell viability, cell cycle progression, and migration of glioma cells under hypoxic conditions. Additionally, the tumor formation experiments showed a significant decrease in tumor volume and mass upon silencing of HOXD9. These results indicated that HOXD9 promotes the development of GBM. Considering the vital involvement of HOX transcription factors in normal developmental processes, Le Boiteux et al. [42] proposed a compelling hypothesis suggesting that the upregulation of HOX genes played a contributory role in the occurrence of gliomas. Therefore, other members of the HOX gene family, including HOXA1, HOXA5, HOXA6, HOXA7, and HOXA10, were also reported to have oncogenic effects in gliomas. Notably, these HOX genes demonstrated the ability to enhance cell viability and migration while simultaneously inhibiting cell death in GBM cell lines [43, 44]. Regarding the role of the remaining HOXD family genes, such as HOXD10, it is worthwhile to explore further in subsequent studies.
Recent study has shown that HOXD9 can bind to the promoter region of PFKFB3 in non-small cell lung cancer [18], leading to the upregulation of PFKFB3 transcription. This demonstrates the important role of HOXD9 in regulating the expression of this gene. We confirmed this interaction between HOXD9 and PFKFB3 in glioma cells. After treating glioma cells with the PFKFB3 inhibitor 3PO, we did not observe significant changes in the expression levels of HOXD9. Our data suggests that HOXD9 is involved in the functional expression of hypoxia-induced U87-MG and U251-MG cells by activating PFKFB3 transcriptionally. Additionally, PFKFB3 plays a crucial role in the glycolysis process by generating fructose-2,6-bisphosphate (F2,6P2) and activating 6-phosphofructo-1-kinase (PFK1) [45]. PFKFB3 has kinase activity, directing glucose towards the glycolytic pathway, and is often overexpressed in various types of cancer [46]. This study, both in vitro and in vivo, validated that activating PFKFB3 effectively promotes HMGB1 secretion and glycolysis progression. Ye et al. [21] demonstrated high expression of HMGB1 in human GBM samples, and tumor cells under hypoxic conditions release HMGB1, promoting tumor development. This was consistent with our research findings. Our data indicated that overexpressing PFKFB3 partially reversed the suppression effect of silencing HOXD9 on HMGB1 protein expression, while overexpressing HMGB1 significantly increased the expression levels of HOXD9. This suggests a potential interaction between HOXD9 and PFKFB3. However, whether this interaction is direct or indirect still needs to be further explored. Future studies could focus on elucidating the regulatory relationship between glycolysis and the interaction between HOXD9 and PFKFB3.
This study further extends previous articles on glycolysis and HOXD9 in GBM by revealing the clinical significance of HOXD9 overexpression and its complex relationship with HMGB1 and PFKFB3, which provides a new strategy for individualized treatment of GBM patients. Our results suggest that high expression of HOXD9 in GBM patients is an independent predictor of poor prognosis, and HOXD9 increases glycolysis in GBM by regulating the transcription of PFKFB3. Therefore, HOXD9 is a useful biomarker and a promising therapeutic target for GBM. Investigating potential therapeutic interventions targeting the HOXD9 pathway could provide new treatment strategies for GBM patients. This may include exploring small molecule inhibitors or gene therapy approaches to modulate HOXD9 expression or activity in GBM. In future studies and in vivo experiments, identification of proteins and downstream signaling pathways interacting with HOXD9 is essential to elucidate its function. Targeting the HOXD9-PFKFB3 axis could provide a novel strategy to disrupt the glycolytic pathway in GBM cells, thereby potentially inhibiting tumor growth and progression.
It is important to note that this study had some limitations. First, the sample size in our study was relatively small, which may limit the generalizability of the results. Further studies should aim to validate the role of HOXD9 in other syngeneic GBM models to strengthen the evidence of its involvement in GBM development and progression. Furthermore, the use of human cell lines in our experiments may not fully recapitulate the complex tumor microenvironment present in patients. Moreover, in our study, investigating the role of HOXD9/PFKFB3 in the regulation of HMGB1 secretion by HMGB1 overexpression did not allow us to distinguish between intracellular HMGB1 and extracellular HMGB1. This could be further clarified in future studies by using an HMGB1-neutralising antibody.
The research highlighted the potential of HOXD9 as a prognostic biomarker in the context of GBM. We emphasized its importance in tumor development by examining the HOXD9/PFKFB3 axis on hypoxia-induced HMGB1 secretion and glycolysis in GBM. This study provided a scientific basis and molecular target for diagnosing and treating GBM.
GBM, Glioblastoma; HOX, Homeobox; HOXD9, homeobox D9; siRNA, small interfering RNA; PFKFB3, 6-phosphofructo-2-kinase/fructose-2,6-bisphosphatase 3; HMGB1, high mobility group box 1; OA, Oxamic acid; 3PO, 3-(3-pyridinyl)-1-(4-pyridinyl)-2-propen-1-one; TCGA, Cancer Genome Atlas; FPKM, Fragments Per Kilobase per Million; GTEx, Genotype-Tissue Expression; TCGA-GTEx-GBM, GBM dataset of TCGA combined with GTEx; TPM, Transcripts Per Kilobase of exon model per Million mapped reads; ROC, Receiver operating characteristic; KM, Kaplan-Meier; GEPIA, Gene Expression Profiling Interactive Analysis; HR, hazard ratio; AUC, Area Under Curve; GSEA, Gene Set Enrichment Analysis; MSigDB, Molecular Signatures Database; FDR, False discovery rate; DCA, Decision curve analysis; DMEM, Dulbecco’s modified Eagle’s medium; STR, short-tandem repeat; oe-NC, overexpressing negative control plasmid; oe-HMGB1, HMGB1 overexpressing plasmid; RT-qPCR, Real-time quantitative polymerase chain reaction; RIPA, radio immunoprecipitation assay; BCA, bicinchoninic acid; PBST, phosphate buffered saline with Tween-20; ELISA, enzyme-linked immunosorbent assay; OD, optical density; CCK-8, Cell Counting Kit-8; PI, propidium iodide; IF, Immunofluorescence; ChIP, Chromatin immunoprecipitation; NSCLC, non-small cell lung cancer.
The datasets used and analyzed during the current study are available from the corresponding author upon reasonable request.
All authors contributed to the study conception and design. Material preparation, experiments, data collection, and analysis were performed by GX, JS, LW, XY, FH, and WL. The first draft of the manuscript was written by GX and JS, and all authors commented on previous versions of the manuscript. All authors read and approved the final manuscript. All authors have participated sufficiently in the work and agreed to be accountable for all aspects of the work.
All experimental procedures and animal handling were performed with the approval of the Welfare and Ethics Committee of Laboratory Animal Center of Fourth Military Medical University (No. IACUC-20240014), in accordance with the National Institutes of Health Guide for the Care and Use of Laboratory Animals, and studies involving laboratory animals follows the ARRIVE guidelines.
Not applicable.
This work was supported by Major Instrument Project of National Natural Science Foundation of China (No. 81627806).
The authors declare no conflict of interest.
Supplementary material associated with this article can be found, in the online version, at https://doi.org/10.31083/j.fbl2910341.
References
Publisher’s Note: IMR Press stays neutral with regard to jurisdictional claims in published maps and institutional affiliations.