


 , Biao Xu 1,*
1 Department of Cardiology, Affiliated Drum Tower Hospital, Medical School, Nanjing University, 210008 Nanjing, Jiangsu, China
2 Department of Medical Laboratory, Affiliated Drum Tower Hospital, Medical School, Nanjing University, 210008 Nanjing, Jiangsu, China
3 Department of Medical Imaging, Affiliated Drum Tower Hospital, Medical School, Nanjing University, 210008 Nanjing, Jiangsu, China
†These authors contributed equally.
Abstract
Background: Obesity is primarily a consequence of food addiction. Drugs have been confirmed effective for weight loss more or less related to the functional connectivity in neural networks and metabolic patterns. Recent studies have shown that some anti-diabetic drugs, such as Metformin and Dapagliflozin have similar weight loss effects, however, their mechanisms are unclear. We hypothesized that the functional connectivity and energy metabolism might be associated with the mechanisms. Methods: Male ob/ob mice were fed with high-fructose-fat-diet (HFFD) for 4 weeks to esteblish obesity model. Then mice were divided into normal saline (NS, as control), Metformin (Metformin, 50 mg/kg/day by gavage), and Dapagliflozin (Dapagliflozin, 10 mg/kg/day by gavage) groups. Functional connectivity amplitude of low-frequency signal fluctuations and regional cerebral blood volume (rCBV) quantification were statistically analyzed in the linear mixed model, meanwhile, metabolic pattern of intestinal cells (IECs) were also tested. Results: Our results showed that Blood Oxygen on Level Depending (Bold) signaling responses, functional connectivity, and rCBV quantification tended to be attenuated in the Metformin group compared to the control and Dapagliflozin groups. While only Dapagliflozin prevented HFFD induced hyper survival of intestinal cells and hypertrophy of intestinal villus by reducing glycolysis levels. Both Metformin and Dapagliflozin are effective for weight loss. Conclusions: Our findings showed that Dapagliflozin and Metformin may inhibit bulimia induced obesity with different mechanisms. We speculate that Metformin may affect appetite regulation, while Dapagliflozin can affect the survival and metabolic patterns of intestinal cells, thus significantly affecting the absorption of nutrients. So, combining Metformin and Dapgliflozin may be more beneficial for clinical improvement in bulimia induced obesity.
Keywords
- obesity
- Metformin
- Dapagliflozin
- neural networks
- metabolic patterns
- intestinal villus
Obesity is a growing global health problem, with more and more people dying from being overweight rather than underweight [1, 2]. Even though obesity is preventable, its prevalence rate sustainedly rises, associated with increased risk of cardiovascular disease, diabetes and cancer [3, 4]. To combat obesity with appropriate treatment, it is necessary to get more insights into the different mechanisms of reasons underlying the development of overweight. Previously reported, the neural transmissions involved between multiple brain areas are associated with the regulation in disorders [5]. Wright and colleagues [6] have reported that the measurement of resting-state functional magnetic resonance imaging (rs-fMRI) indicated that the fasting and satiation are associated with changes in functional connectivity of insula and hypothalamus [6, 7]. Avery et al. [7] has also reported that starvation is associated with a significant functional connectivity of the left orbitofrontal cortex (OFC) to limbic regions [8, 9, 10, 11, 12]. According to these studies, brain areas are functionally implicated in the regulation of bulimia [13, 14, 15, 16, 17, 18, 19, 20, 21, 22, 23, 24, 25].
Fructose has been proven to be associated with bulimia and the consumption has also been reported to be associated with increased global morbidity and mortality leading by obesity and cancer. Dietary fructose is transported by glucose transporter type 5 (GLUT5), and then phosphorylated to form fructose 1-phosphate (F1P) in the epithelium of small intestine. When F1P accumulating to a high level, it may enhance the survival of intestinal cells and increase the length of intestinal villus in mouse models [26, 27]. As villus length increases, the surface area of nutrition and lipid absorption in the intestine expands, leading to obesity in mice.
Glycolysis is an important metabolic pathway to produce adenosine-triphosphate (ATP) under stress. It has been reported that when glycolysis is inhibited, Pentose phosphate pathway (PPP) is upgraded and its function of anti-reactive oxygen species (anti-ROS) also upregulated. Fructose metabolism is distinct from glucose, which is uniquely metabolized to F1P, then F1P can be subsequently metabolized to glucose metabolism pathway. Previous studies have indicated that fructose promotes hypoxic cell survival in the intestine. The structure of F1P is similar to fructose 1,6-bisphosphate (FBP), the endogenous regulator of Pyruvate kinase isozymes M2 (PKM2), therefore, F1P competitively binds to the active site and stabilizes PKM2 in an inactive state which improves cell survival by continuously downregulating glycolysis and activating PPP to alleviate ROS [28].
Diabetes is a major risk factor for heart disease, stroke, renal failure, blindness and amputations. As reported, nearly 90% of individuals with Type 2 diabetes (T2D) are overweight or obese [2]. Although not all obese individuals develop T2D and not all individuals with T2D are obese, the current increase in the prevalence of obesity has been associated with an increase in the prevalence of T2D [3, 4]. The metabolic abnormalities exacerbated in T2D, such as hyperinsulinemia, hyperglycemia, and dyslipidemia increases insulin resistance and glucose intolerance which also increase the risk of obesity, thus some anti-diabetic drugs can alleviate metabolic abnormalities while with the additional functions of reducing weight, such as Metformin, sodium-glucose transporter 2 inhibitor (SGLT2i) and GLP-1 receptor (GLP-1R) agonists (GLP-1RAs) what we already know [22, 23].
Metformin is the first-line glucose-lowering medication recommended by almost all international guidelines [29]. Several studies have demonstrated that Metformin has a positive impact on body weight by reducing appetite with consequent decreased caloric intake [29, 30, 31].
The sodium-dependent glucose cotransporter proteins 1 and 2 (SGLT1/2) are in the proximal renal tubule of the kidney and regulate renal glucose reabsorption. SGLT2 transporter has been reported to induce approximatively the 90% of reabsorption, while the remaining 10% is reabsorbed by SLGT1 transporter [32]. Through inhibiting these co-transporters, such as using Dapagliflozin, a large amount of glucose, ranging from 50 to 100 g daily, and the corresponding caloric equivalent (200–400 kcal/diet) are pharmacologically forced into urinary excretion. The whole-body metabolism must undergo adaptive changes involving glucose fluxes, hormonal responses, fuel selection, and energy expenditure which induces an increasing in the glucagon/insulin ratio to result in an increased lipid mobilization [33, 34].
In our study, we designed a modified bulimia induced obesity mouse model to explore more detailed mechanisms in anti-diabetic drugs that inhibit bulimia induced obesity by rs-fMRI studies and metabolomics.
All male ob/ob (Leptin, Lep) mice were purchased from Shanghai Model Organisms
Center and divided into three groups at random. All mice were fed with HFFD
(D09100310 Rodent Diets with 40 kcal% Fat-Palm Oil 20 kcal% Fructose and 2%
Cholesterol), free access to food and water for 4 weeks to establish obesity
model. Then mice were divided into normal saline (NS, by gavage, as control),
Metformin (Metformin, 50 mg/kg/day by gavage), and Dapagliflozin (Dapagliflozin,
10 mg/kg/day by gavage) groups. Functional connectivity amplitude of
low-frequency signal fluctuations and rCBV quantification were statistically
analyzed in the linear mixed model, meanwhile, energy metabolism of intestinal
cells was also tested after another 4 weeks of anti-diabetic drugs treatments.
All mice were kept in a temperature (22
We performed in vivo Magnetic Resonance Imaging (MRI) measurements using a Bruker 9.4T BioSpec 94/30 animal MRI (USR Bruker 9.4 T horizontal bore Magnetic Resonance system, Karlsruhe, Germany) equipped with a 100 mT/m gradient coil (Agilent, Palo Alto, CA, USA).
Non-uniformity correction was performed on anatomical images using n3, and brain masks were obtained by applying the Brain Extraction Tool to anatomical images, both provided by FSL (FMRIB’s Software Library, www.fmrib.ox.ac.uk/fsl, version 5.0.9, Oxford, UK).
All rs-fMRI images were corrected for subject motion using MCFLIRT (FMRIB Software Library, https://www.semanticscholar.org/topic/FMRIB-Software-Library-FSL, Oxford, UK), and image intensity non-uniformity correction was performed using n3 (solely for registration purposes).
The rs-fMRI data were band-pass filtered between 0.01 and 0.1 Hz using 3dFourier as provided by AFNI (Functional Neuroimages Analysis, Version Debian-16.2.07, https://afni.nimh.nih.gov/, Milwaukee, WI, USA).
Functional connectivity matrices were obtained from the Fisher-transformed z’ of Pearson correlation coefficients between ROIs using FSL and MATLAB (version R2014a, MathWorks Inc., Natick, MA, USA).
As a measure of the magnitude of brain activity, we assessed the fractional amplitude of low-frequency fluctuations (fALFFs), calculated from the rs-fMRI Blood Oxygen on Level Depending (Bold) signals as the ratio of the power of each frequency in the low-frequency range (0.01–0.1 Hz) to that of the entire frequency range. The fALFF has been shown more sensitive than ALFF and can also correct for physiological noise.
Regional fMRI responses to the medicine treatments were quantified in the form of rCBV in regions of interest as Galbusera et al. [29] previously described.
Scanned H&E images of small intestine from each trial were downloaded as .svs files (Aperio eSlide Manager, https://www.medicalexpo.com.cn/prod/leica-biosystems/product-95735-653613.html, Shanghai, China) and divided into separate files for duodenum, proximal jejunum, distal jejunum and ileum.
Immunohistochemistry and TUNEL staining were performed on formalin-fixed, paraffin-embedded tissues. Hypoxyprobe, HP1-100Kit (Cat no.HP1-100 kit, Hypoxyprobe, Inc., Burlington, MA, USA) was used for Pimonidazole staining.
For the measurement of hepatic triglyceride and serum triglyceride, liver and serum were measured using calorimetric assay (Cat no. OSR60118 kit, Beckman Coulter Life Science Inc., Indianapolis, IN, USA).
80% methanol (including 1000 ng/mL phenylalanine-d5, 3-chloro-D-phenylalanine and octanoic-d15 acid internal standard) was added to the sample, which was then placed in an ice water bath and subjected to five “sonication 1 min - stop 1 min” cycles. After standing at –40 °C) for 30 min, the mixture was centrifuged at 15000 g at 4 °C) for 15 min. The supernatant fluid was evaporated to dryness under mild nitrogen and reconstituted in 10% methanol prior to performing UHPLC-HRMS/MS analysis. A quality control (QC) sample was obtained by isometrically pooling all the amino acid. Chromatographic separation was performed on a Thermo Fisher Ultimate 3000 UHPLC system. The raw data of UHPLC-HRMS/MS were first transformed to mzXML format using Proteo Wizard and then processed using the XCMS (peak picking, alignment and retention time correction) and CAMERA (annotations of isotope peak, adducts, and fragments with default parameters) packages in the R software platform. The final data were exported as a peak table file, including observations (sample name), variables, and peak areas. Data on peak areas were normalized to internal standards before performing univariate or multivariate statistical analysis. The R platform was used for heatmap analysis and the Metabo Analyst for pathway analysis.
At least three independent experiments were presented as mean
To explore the effects of Metformin and Dapagliflozin treatment in vivo, we quantified and compared the Bold signal responses in control group, Metformin group and Dapagliflozin group (Fig. 1). Firstly, we tested the Bold signal responses of glucose absorption after feeding glucose by gavage. According to the change of Bold signal, we determined that obvious changes of the % BOLD appeared around three time points 10mins, 20mins and 30mins in certain brain areas as labeled, so we choose those three time points as check points (Fig. 2A). The Bold signal responses across cortico-limbic regions of control group and Dapagliflozin group were significantly stronger than Metformin groups, no matter quantified either at voxel-level or in volumes of interests (Fig. 2B). Our results suggested that Metformin treatment decreased Bold signal responses among prefrontal cortex (PFC), hypothalamus (Hypo), ventral tegmental area (VTA), and ventral hippocampus (vHPC) areas compared to control and Dapagliflozin groups, so Metformin may functionally associate with the regulation of bulimia by reducing the reward system of cortico-limbic region within brain.
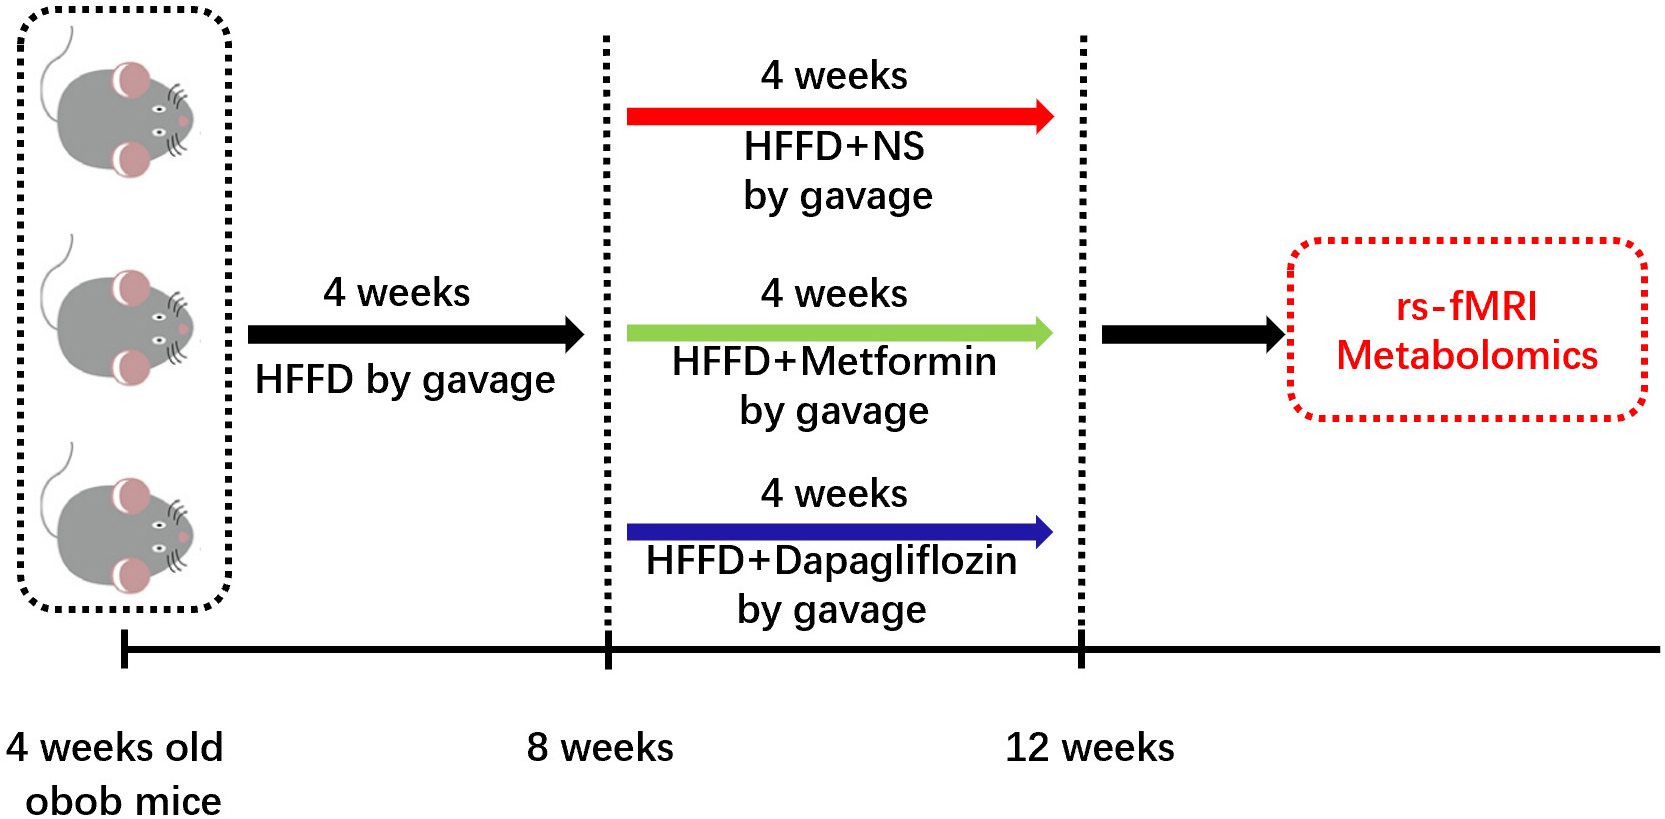 Fig. 1.
Timeline for our experiments. Male ob/ob mice, aged 4 weeks, were fed with high-fructose-fat-diet (HFFD) (D09100310 Rodent Diets With 40 kcal% Fat (Palm Oil) 20 kcal% Fructose and 2% Cholesterol Formulated by: Research Diets, Inc.) for 4 weeks to establish the obesity model. Then mice were divided into normal saline (NS, by gavage, as control), Metformin (Metformin, 50 mg/kg/day by gavage), and Dapagliflozin (Dapagliflozin, 10 mg/kg/day by gavage) groups, 5 mice per each group, for different medical treatment for another 4 weeks. Then functional connectivity amplitude of low-frequency signal fluctuations and rCBV quantification were statistically analyzed in the linear mixed model, meanwhile, metabolic pattern of IECs was also tested.
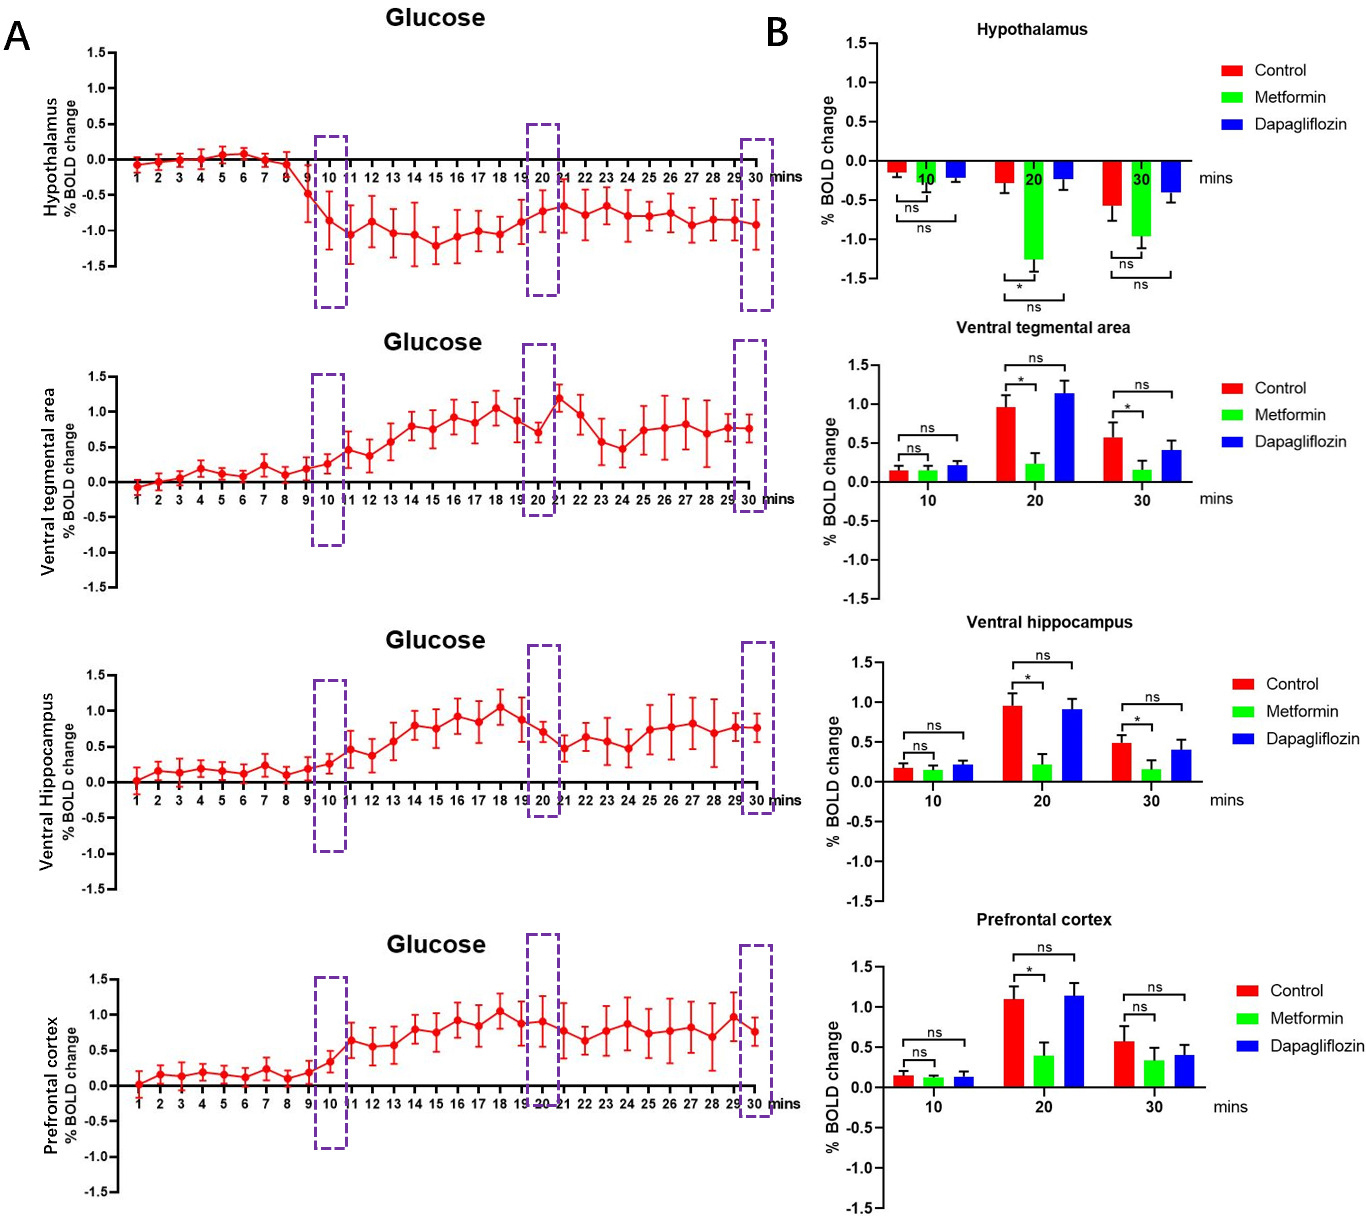 Fig. 2.
Bold signal responses of different treatments. (A) The Bold
signal responses after treated with glucose by gavage of control group were used
for define the responding time of neural network system then three check points
10 mins, 20 mins and 30 mins were chosen, n = 5. (B) The Bold signal responses
across cortico-limbic region in Metformin group showed lower among PFC, Hypo,
VTA, and vHPC areas compared to control, Metformin and Dapagliflozin groups,
for each group, n = 5. *p
To map the neural network among the three groups, we performed covariance-based
inter-regional rCBV mapping within representative cortical and subcortical areas
using voxel-wise seed-based correlations [17]. After probing the functional
connectivity among the three groups, our analysis revealed a significant
decreasing functional connectivity among PFC, Hypo, VTA, vHPC, OFC, Thal and Nac
areas in Metformin group compared to control and Dapagliflozin groups. In
details, the functional connectivity mapping of Hypo showed a low connectivity to
VTA, vHPC and Nac (t-test, p
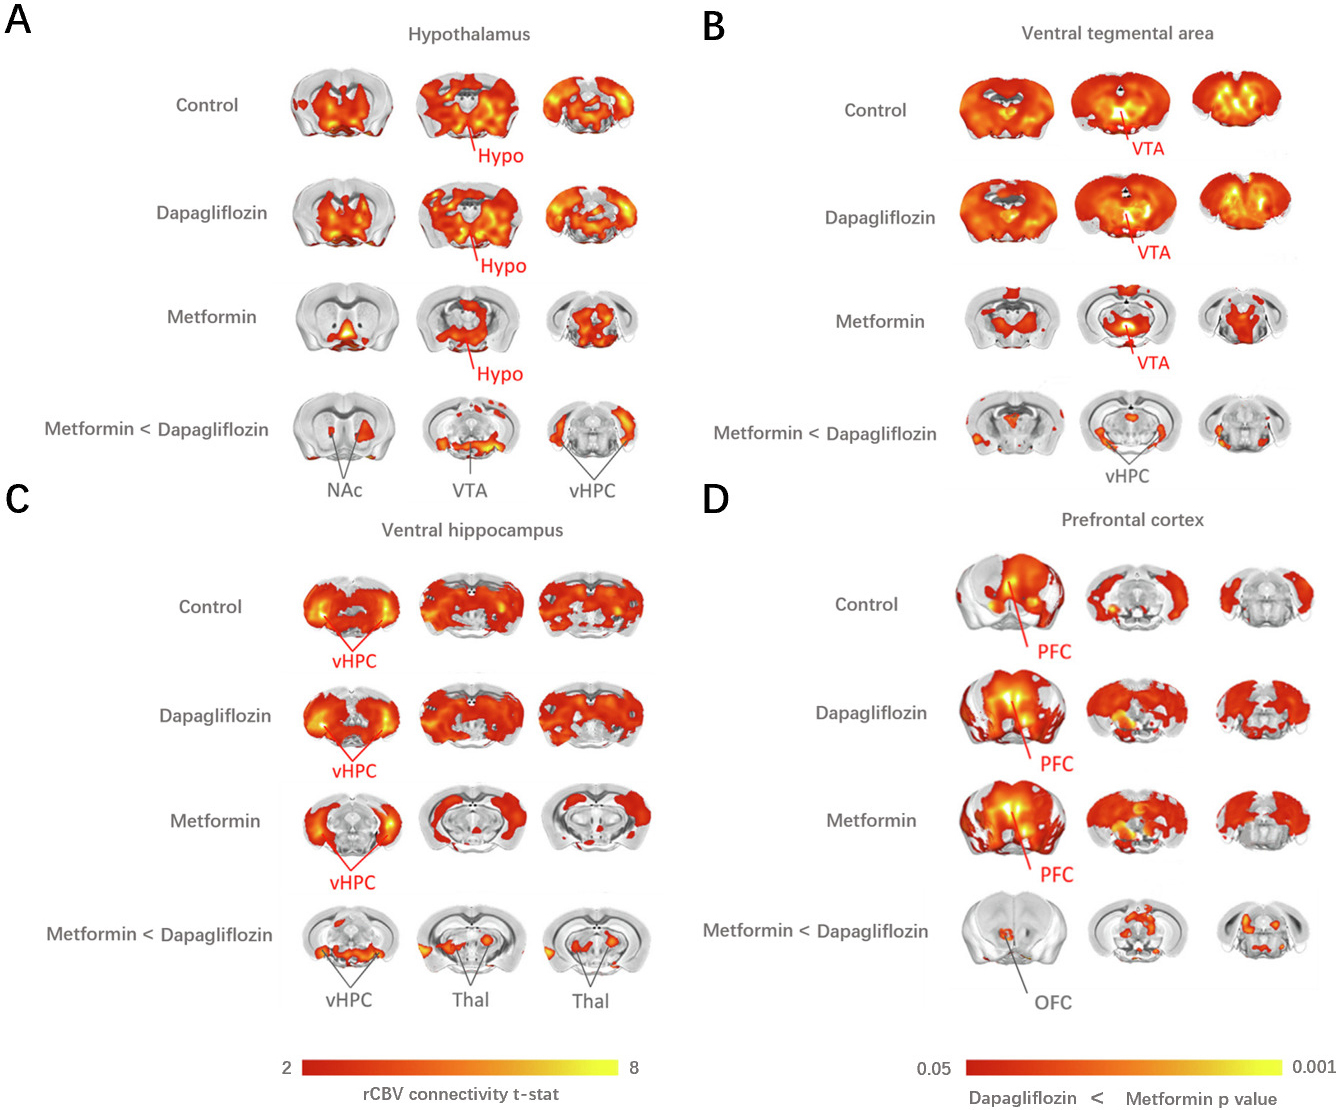 Fig. 3.
The covariance-based inter-regional rCBV mapping within
representative cortical and subcortical areas using voxel-wise seed-based
correlations (Schwarz et al. [18]) revealed a significant
decrease in functional connectivity among PFC, Hypo, VTA, vHPC, OFC, Thal and NAc
areas in Metformin group compared to the control and Dapagliflozin groups.
(A) Functional connectivity mapping of the Hypo showed a decreased coupling with VTA,
vHPC and NAc (t-test, p
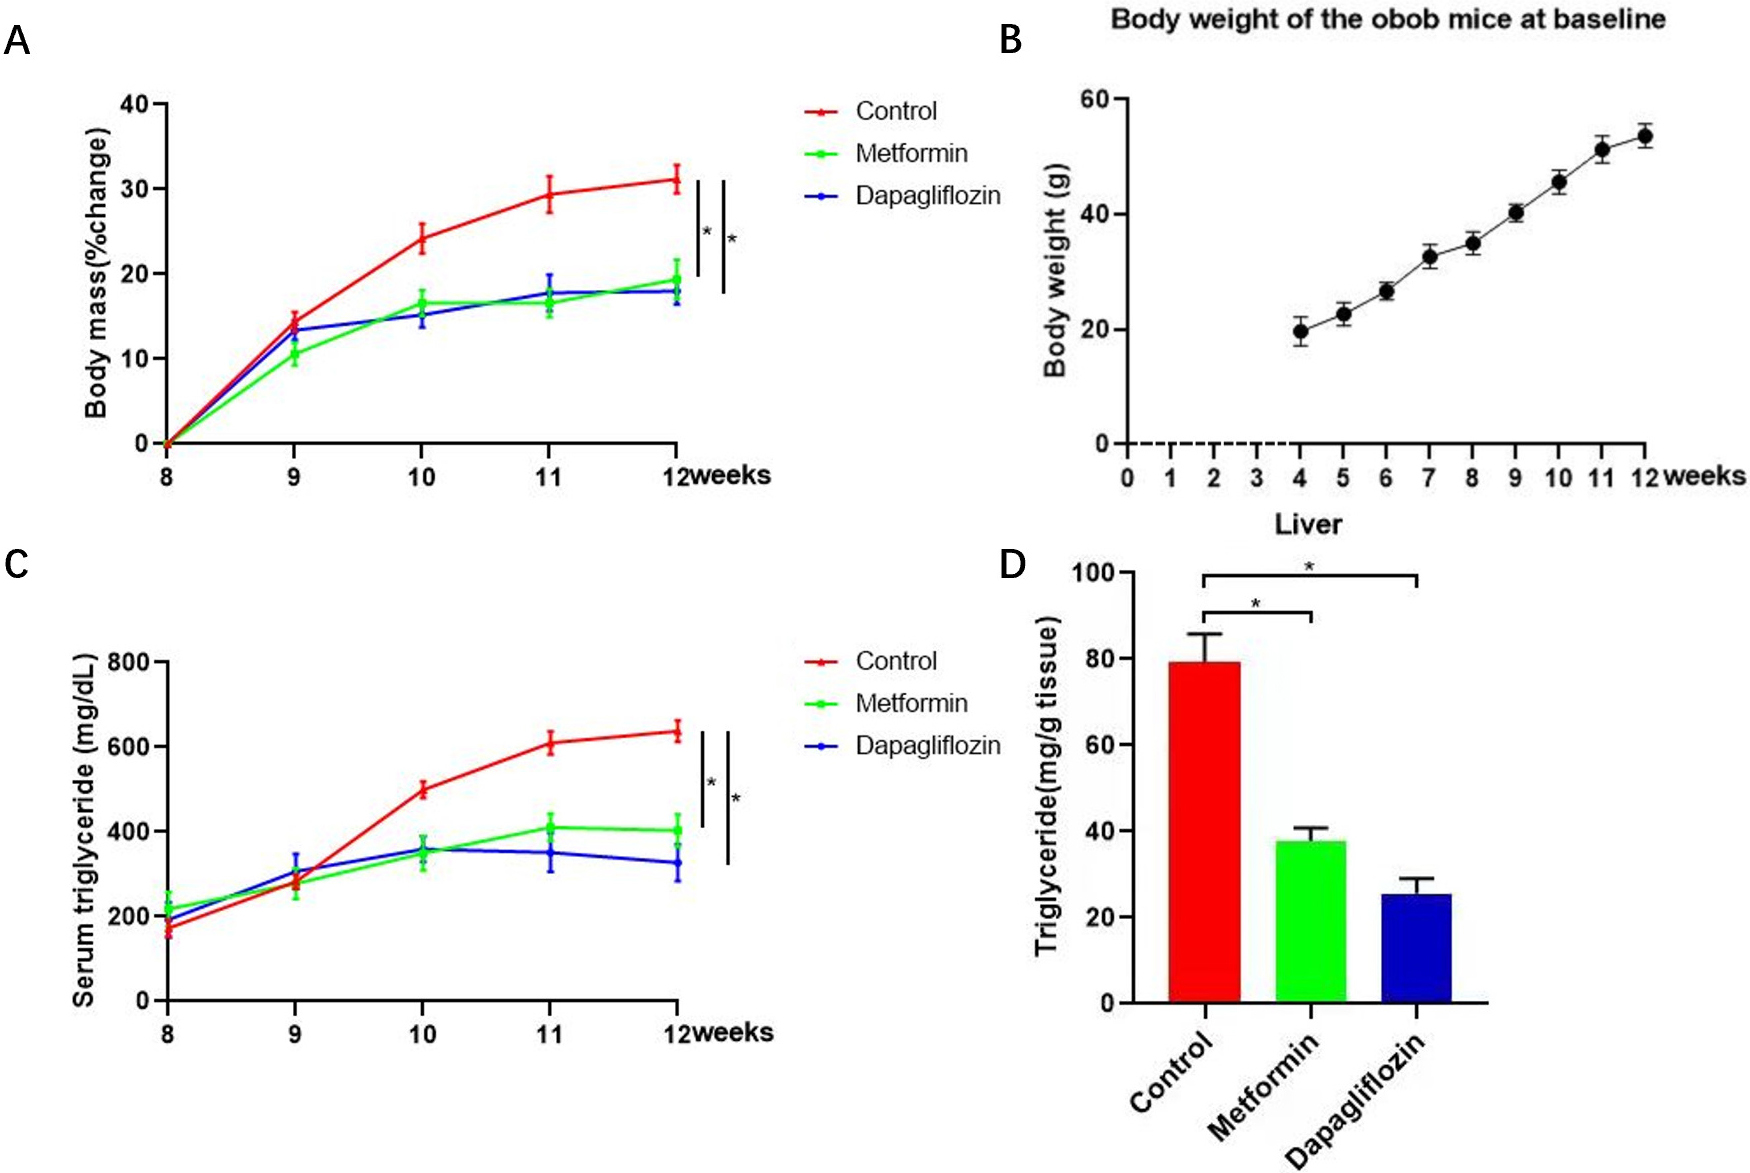 Fig. 4.
Triglyceride (TG) and change percentage of body weight for each
mouse from Metformin, Dapagliflozin and control groups were tested to evaluate
the level of weight loss. (A) Change percentage of body weight for each mouse from Metformin, Dapagliflozin and control groups were tested to evaluate the level of weight loss. (B) Baseline of body weight for each mouse every weeks from the time we bought-week four. (C,D) Triglyceride (TG) of both live tissues and serum from Metformin, Dapagliflozin and control groups were tested to evaluate the level of TG. TG of both live tissues and serum increased significantly in control group while the upward trend was curbed in Metformin group accompanied by reducing functional connectivity within cortico-limbic region. The changes of weight gain and lipid level showed by TG in lives tissues and serum, for each group, n = 5, *p
Previously reported, fructose promotes IECs longer survival through altering the metabolic pattern of IECs [26, 31, 32, 33]. To determine whether the anti-diabetic drugs inhibit obesity is related to influence of the IECs, mean length of intestinal villus was quantified using a high-throughput, unbiased image-segmentation-based approach in H&E staining slides separately in control, Metformin and Dapagliflozin groups. After analysis, our results showed that the intestinal villus in the duodenum and proximal jejunum were longer (Fig. 5) and less apoptosis were found in Metformin group and control group compared to Dapagliflozin group (Fig. 6). The lipid level and weight of each mouse was also tested and the results indicated that the TG in both live tissue and serum decreased significantly in not only Metformin but Dapagliflozin group compared to the control group (Fig. 4). So, our results indicated that the intestinal villi of Metformin group were similar to control group, which were twice longer than Dapagliflozin group and the longer intestinal villi may associate with increased weight and lipid absorption.
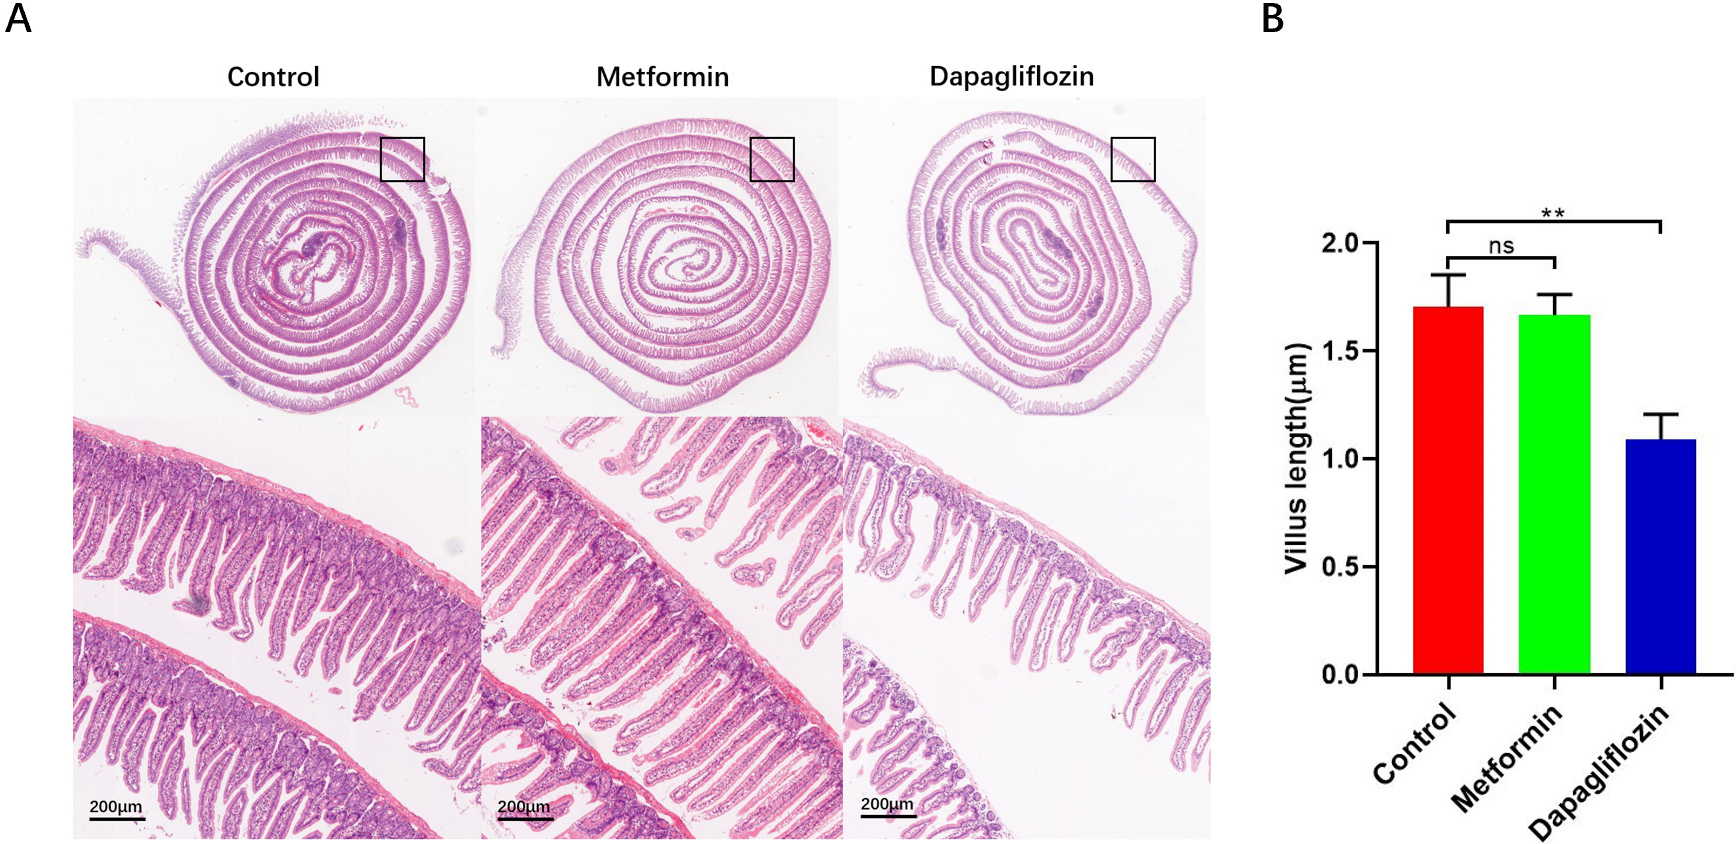 Fig. 5.
Stain-normalized H&E images of Swiss-rolled intestines were
loaded into image-analysis software to manually measure the length of the gut
section. (A) Stain-normalized H&E images of Swiss-rolled intestinal villus. (B) Metformin group and control group showed an increasing in intestinal villus length in the duodenum and proximal jejunum compared to Dapagliflozin group, for each group, n = 5, **p
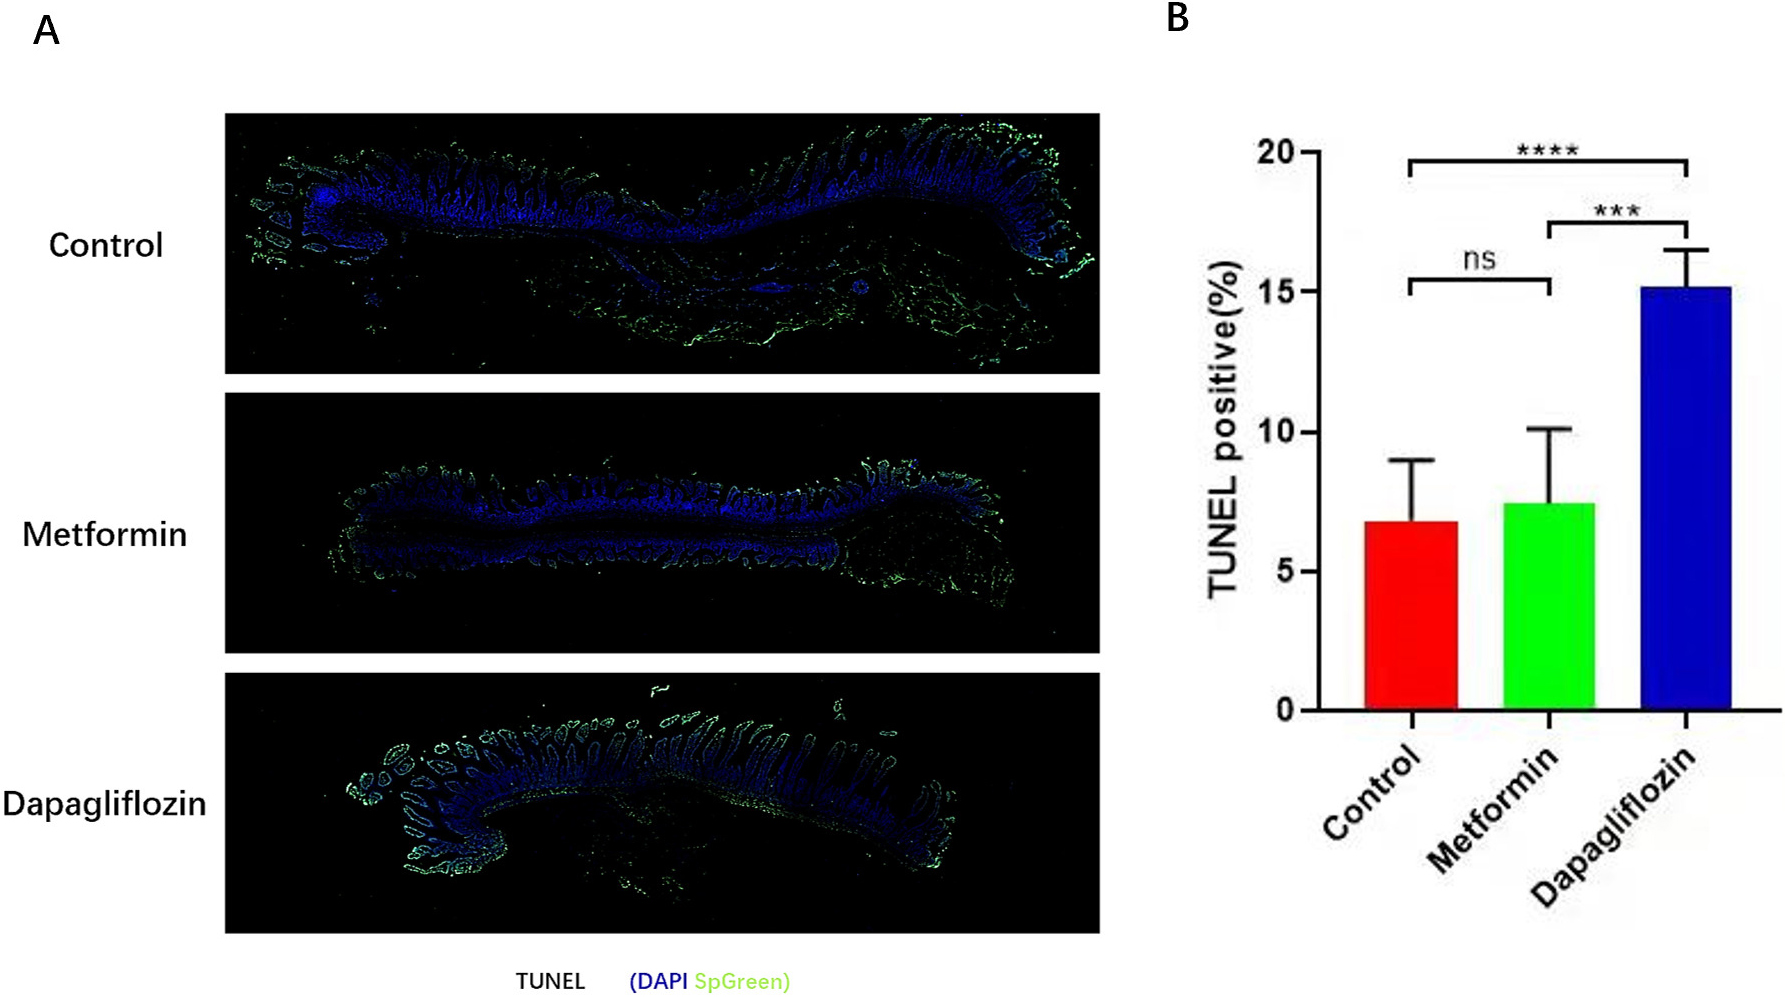 Fig. 6.
Apoptosis of intestinal tissues were tested by
TUNEL. (A) TUNEL of intestinal cells (IECs) apoptosis. (B) More IECs apoptosis was showed in Dapagliflozin group than Metformin and control group, scale bars, 200
As previous study, Dapagliflozin was related to metabolic reprogramming. So, we
performed metabolomics in the three groups. The results indicated that ratio of
pyruvate to phosphoenolpyruvate (PEP) which indirectly reflected the activity of
PKM2 increased while F1P decreased in Dapagliflozin group. Simultaneously, the
abundances of intermediate metabolites related to glycolysis increased. As the
hallmark metabolite of glycolysis, lactate was obviously increased compared to
the other two groups (Fig. 7). Pimonidazole staining which indicated the hypoxic
areas (O
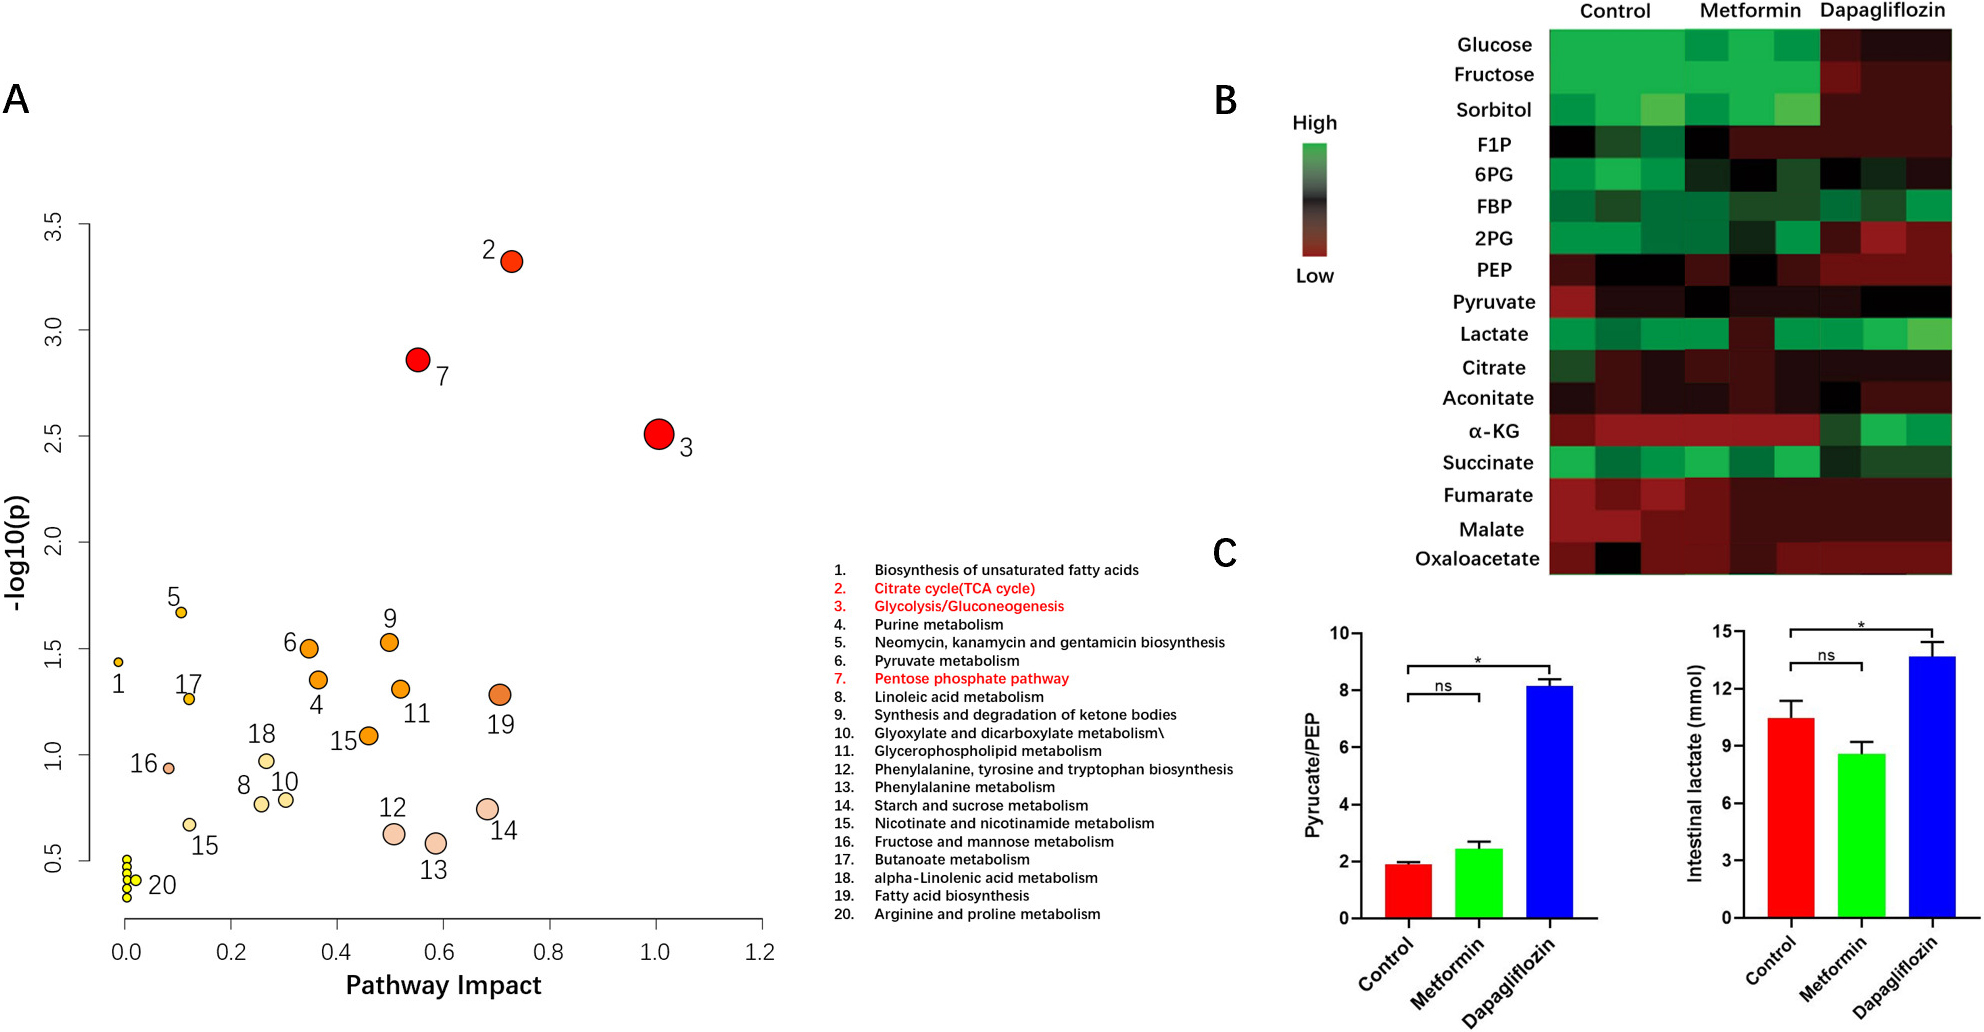 Fig. 7.
Metabolic pattern of intestinal cells. (A) Pathway Analysis. The metabolites Analysis resulted in a metabolome overview map. The vertical coordinate [–log (p)] of the metabolome view represents the correlation between the metabolic pathway and the grouping (inter-group differences),The redder the color, the greater the correlation; Path impact value based on path topology, indicating that this pathway affects the occurrence of this , the greater the circle, the greater the importance. All the results showed that metabolic pathway of glycolysis, tricarboxylic acid cycle (TCA) and pentose phosphate pathway (PPP) changed obviously in Dapagliflozin group compared to the other two groups. (B,C) Heatmap Analysis indicated the ratio of pyruvate to PEP and abundances of lactate increased in Dapagliflozin group than the other two groups, for each group, n = 5, *p
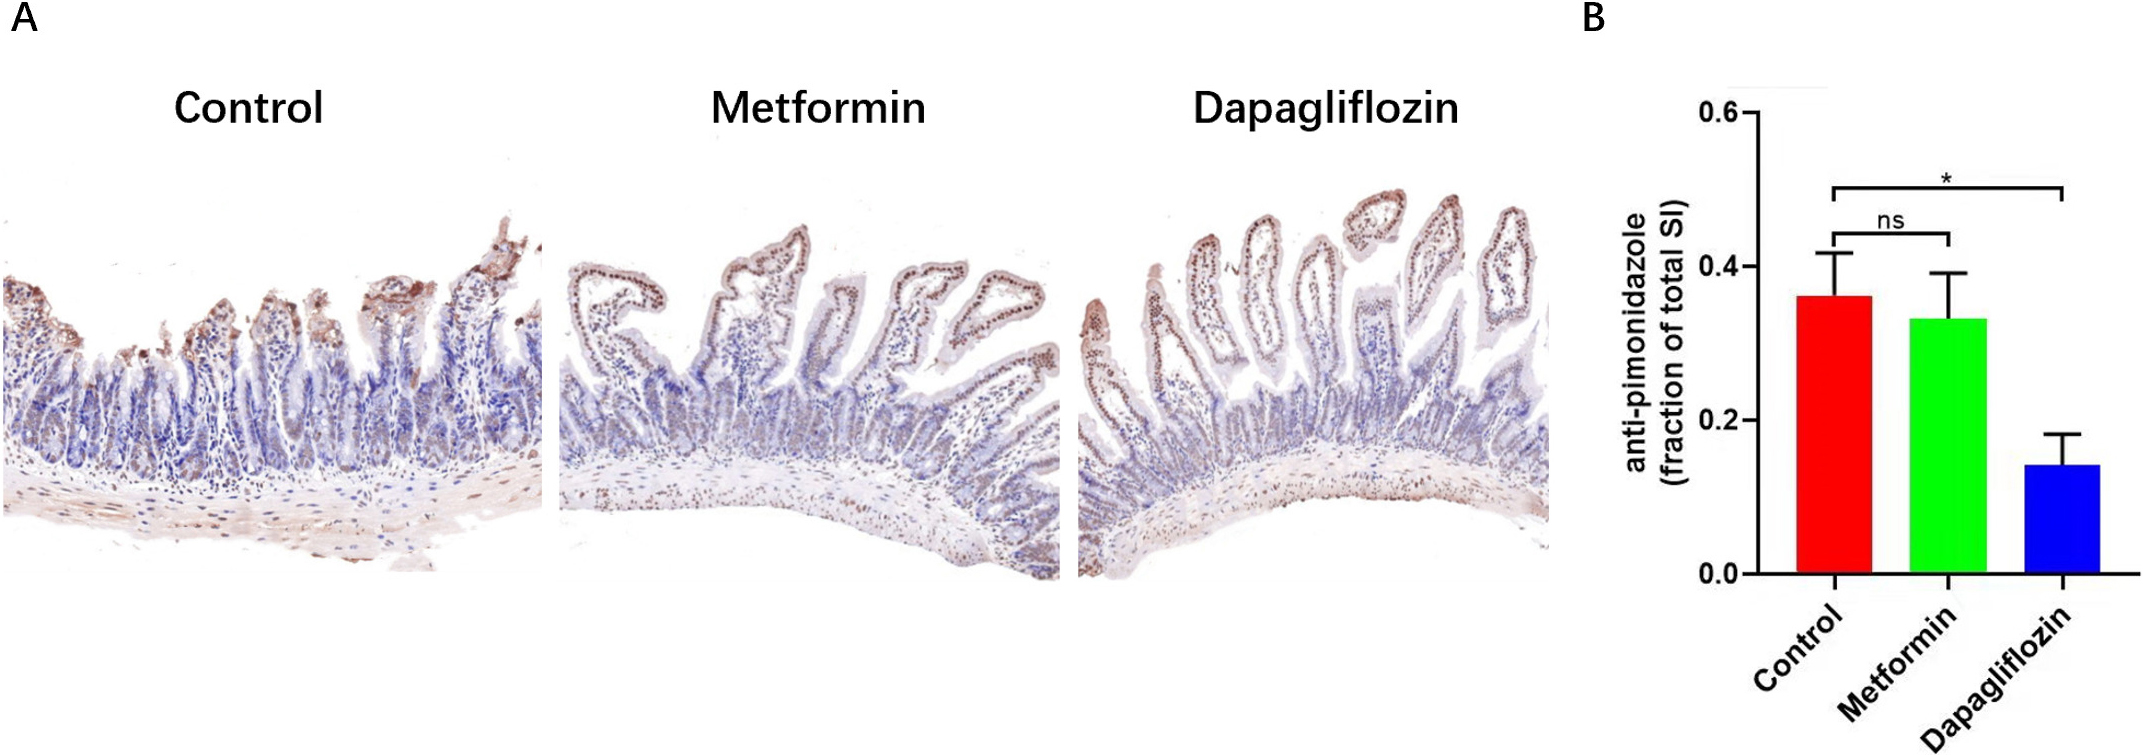 Fig. 8.
The pimonidazole staining was used to label tissue hypoxia
areas. (A) Intestines were fixed and examined for pimonidazole intensity by IHC (with percentage of O2 less than 20%). (B) The less percentage of Pimonidazole staining indicated the less hypoxic areas within intestinal tissue of Dapagliflozin group, Scale bars: 500
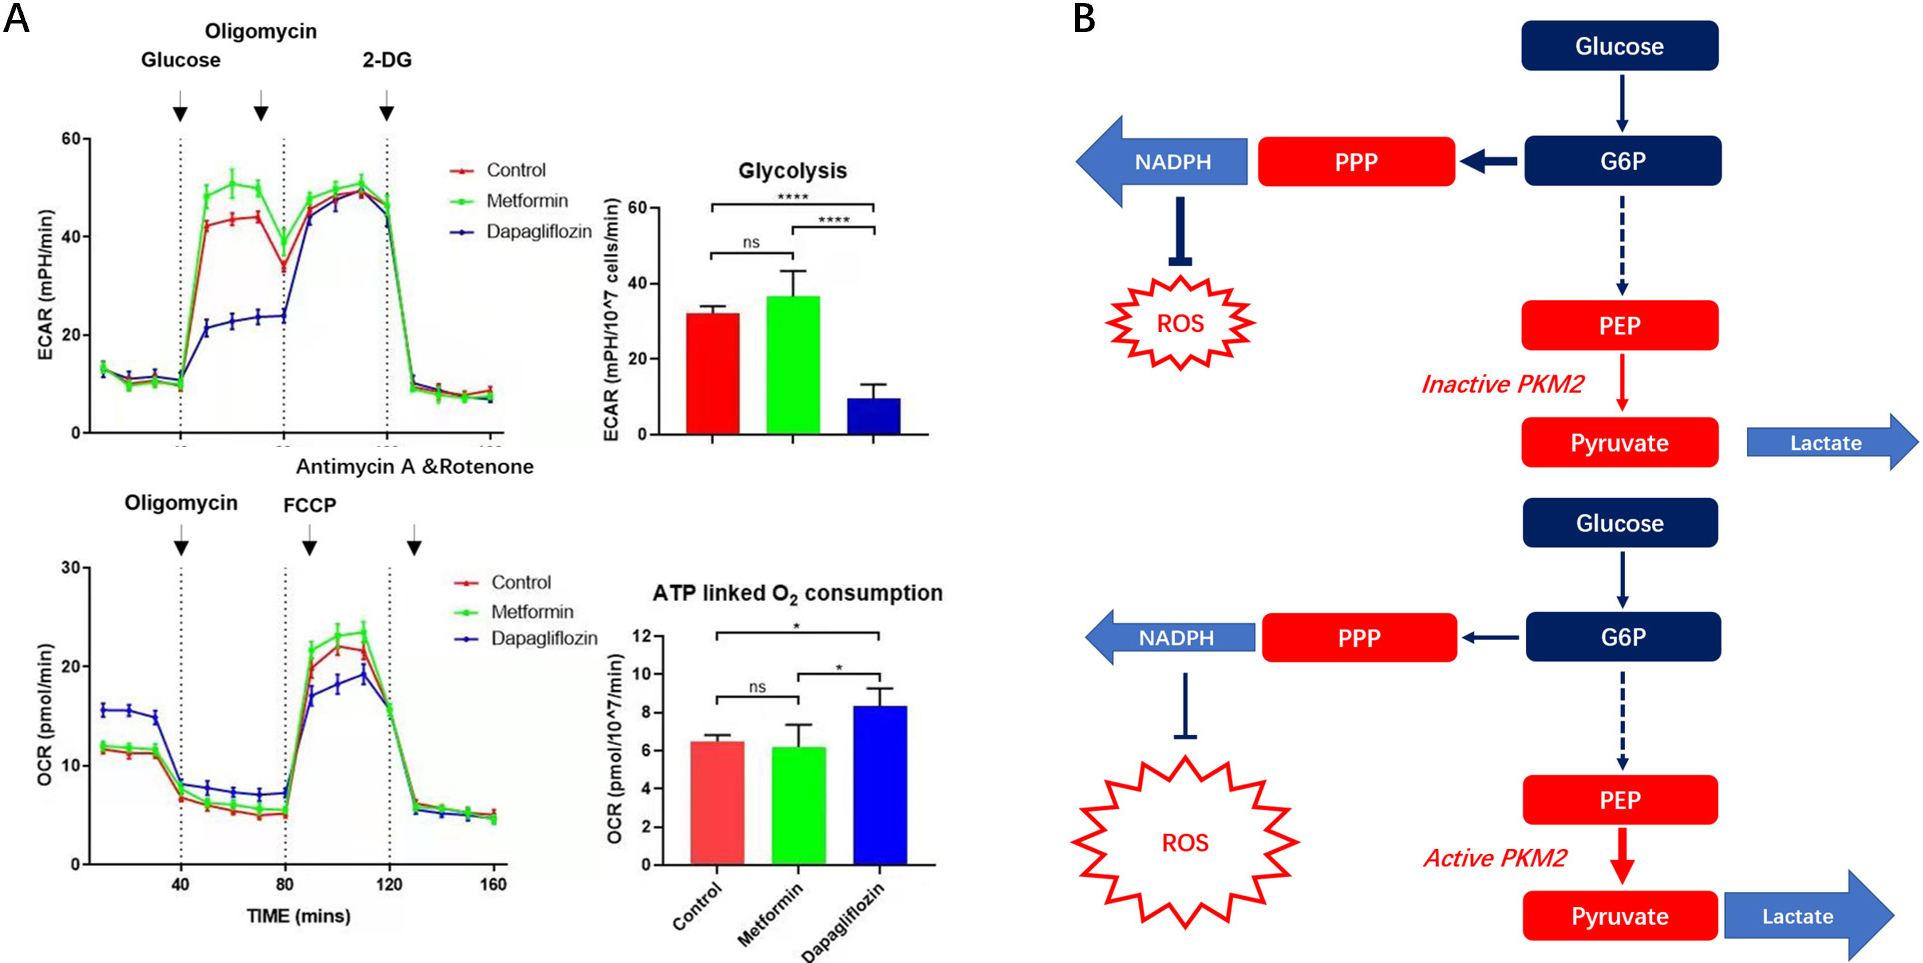 Fig. 9.
OCR and ECAR of IECs in Dapagliflozin, Metformin and control
groups and relationship between glycolysis and PPP pathway showed by metabolic
pathway. (A) OCR and ECAR of IECs in Dapagliflozin, Metformin and control groups were tested. The outcomes indicated more glycolysis and less ATP linked respiration were in Dapagliflozin treatment group than the other two groups. (B) Graphical abstract of metabolic changes. The OCR&ECAR of IECS in three groups, for each group, IECs numbers,
Obesity is a growing global health problem, more and more people die from over-weight than under-weight, so, a multidisciplinary clinic was established for the treatment of severe obesity and its related comorbidities. The treatment of obesity includes lifestyle modification, surgery and pharmacological intervention, as several anti-obesity drugs have been approved in recent years. Among anti-obesity drugs, some (GLP1-RA) have already been used in the treatment of T2D, while other drugs approved specifically only for the treatment of T2D have shown beneficial effects on body weight (e.g., Metformin, SGLT2-i) and are therefore to be preferred in patients with obesity and T2D [34].
For a long time, the primary approach to treat obesity is lifestyle modification
that support people to modify their diet, and increase physical activity [34].
Pharmacological intervention is recommended as adjunctive therapy if the target
weight loss has not been reached through diet and exercise alone [26]. For
pharmacological intervention, Naltrexone/bupropion is licensed, as an adjunct to
a reduced-calorie diet and increased physical activity, for the management of
weight in adults who are obese (BMI
Metformin is the first-line glucose-lowering medication recommended by almost all international guidelines [38]. Several studies have demonstrated that Metformin has a positive impact on body weight by reducing appetite with consequent decreased caloric intake. The impact on appetite regulation depends on the directly central effect of the drug and indirectly on its gastrointestinal side effects, such as nausea, bloating, diarrhea and dysgeusia [30]. Dapagliflozin, discharges a large amount of glucose, ranging from 50 to 100 g daily and the corresponding caloric equivalent (200–400 kcal/diet) are pharmacologically forced into urinary excretion, therefore the whole-body metabolism must undergo adaptive changes involving glucose fluxes, hormonal responses, fuel selection and energy expenditure. These two anti-diabetes drugs can reduce weight while avoiding the adverse drug reaction of Naltrexone/bupropion. However, the weight-loss mechanism of Metformin has not been deeply studied with respect to which regions in brain and the connections between them. As for the weight loss mechanism of Dapagliflozin, there is no research related to IECS metabolism at present.
In our results, Metformin treatment may functionally associate with the regulation of bulimia by reducing the reward system within cortico-limbic region and the functional connectivity between limbic and prefrontal regions within brain compared to control and Dapagliflozin groups. Along with the reduction of the TG and rate of weight gain, we think Metformin may has a positive impact on body weight loss by reducing appetite with consequent decreased caloric intake. When metabolites F1P accumulates to a high level in IECS, they competitively bind to the active site and stabilizes PKM2 in an inactive state because of its similar structural to FBP [14, 15, 16]. So, F1P continuously activates PPP pathway by downregulating glycolysis [28]. PPP pathway is carried out in the cytoplasm to convert glucose into ribose 5-phosphate and generate NADPH at the same time. Ribose is used for the synthesis of nucleic acid and some coenzymes, while NADPH is called reducing power which is used for biosynthesis and anti-oxidation, such as ROS. Therefore, more IECS survive longer and increase length of intestine villus in mouse models by protection of more NADPH [26]. As the length of intestinal villus increases, the surface area for nutrient and lipid absorption expands in the intestine. For Dapagliflozin treatment, more glycolysis and less PPP pathway were found than the other two groups, therefore, we considered that Dapagliflozin may reduce the longer survival of IECs caused by HFFD through similar mechanisms.
GLP1-RAs, which have been widely reported to act on satiety and cause weight
loss have been approved by the FDA for the treatment of obesity in obese
non-diabetic patients. We believe that it should be excellent in management of
weight in mouse model, however, in GLP1-RAs group (Liraglutide, 150
Our study reveals the possible mechanism on how Dapagliflozin and Metformin inhibit bulimia induced obesity, however, few clinical data can support our explorations till now. Meanwhile, the effects of anesthesia on intrinsic functional connectivity and amplitude were inevitable in our study when process the fMRI, even we combined use of medetomidine and isoflurane recommended by Joanes Grandjean et al. [29].
In conclusion, our findings showed the possible mechanism on how Dapagliflozin and Metformin inhibit bulimia induced obesity. Therefore, we consider that use Dapagliflozin and Metformin in combination might be more beneficial in improving bulimia induced obesity because of their different mechanisms. Moreover, because Dapagliflozin has a special effect on revoking increasing absorption induced by fructose, it may be especially useful for those obese people who are addicted to sweets.
All the data and materials are available from the corresponding author on reasonable request.
ZL, LK and BX: substantial contributions to conception and design of the work; ZL: drafting the work; ZL, JJ, HH, SQ and QZ: acquisition of data; ZL, JJ, HH, XZ, YQ, XS, KW, RG: analysis and interpretation of data; All authors contributed to revising the work critically for important intellectual content; All authors review and approved the final manuscript to be published; All authors have participated in integrity of any part of the work are appropriately investigated and resolved. All authors agreed to be accountable for all aspects of the work in ensuring that questions related to the accuracy.
All protocols in this study were approved by the Committee on the Ethics of Animal Experiments of Nanjing University Medical School Affiliated Nanjing Drum Tower Hospital (Approval No. 20011141), in compliance with the Guide for the Care and Use of Laboratory Animals published by the US National Institutes of Health (Eighth Edition).
Not applicable.
This work was supported by the grants from the Natural Science Foundation of China (grant number 82070366), and the Key Project supported by Medical Science and Technology Development Foundation, Nanjing Department of Health (grant number ZKX20018).
The authors declare no conflict of interest.
References
Publisher’s Note: IMR Press stays neutral with regard to jurisdictional claims in published maps and institutional affiliations.