


 , Mincai Li 1,2,*
1 Hubei Key Laboratory of Diabetes and Angiopathy, Medicine Research Institute, Xianning Medical College, Hubei University of Science and Technology, 437100 Xianning, Hubei, China
2 School of Basic Medical Sciences, Xianning Medical College, Hubei University of Science and Technology, 437100 Xianning, Hubei, China
3 School of Pharmacy, Xianning Medical College, Hubei University of Science and Technology, 437100 Xianning, Hubei, China
4 The Central Hospital of Xianning, Hubei University of Science and Technology, 437100 Xianning, Hubei, China
†These authors contributed equally.
Abstract
Background: Neuromedin B (NMB) is a neuropeptide that plays a key role in many physiological processes and is involved in the pathology of various diseases. Increased levels of NMB have been reported in solid tumors. Therefore, we investigated the prognostic value of NMB in glioblastoma (GBM). Methods: Expression profiles of NMB mRNA were investigated in GBM and normal tissues using data from the cancer genome atlas (TCGA). NMB protein expression was obtained using data from the Human Protein Atlas. Receiver operating characteristic (ROC) curves were evaluated in GBM and normal tissues. The survival effect of NMB in GBM patients was evaluated using the Kaplan-Meier method. Protein-protein interaction networks were constructed using STRING, and the functional enrichment analyses were performed. The relationship between NMB expression and tumor-infiltrating lymphocytes was analyzed using the Tumor Immune Estimation Resource (TIMER) and the Tumor-Immune System Interaction database (TISIDB). Results: NMB was overexpressed in GBM relative to normal biopsy specimens. The ROC analysis showed that the sensitivity and specificity of NMB in GBM were 96.4% and 96.2%, respectively. Kaplan-Meier survival analysis showed that GBM patients with high NMB expression had a better prognosis than those with low NMB expression (16.3 vs. 12.7 months, p = 0.002). Correlation analysis showed that NMB expression was associated with tumor-infiltrating lymphocytes and tumor purity. Conclusions: High expression of NMB was associated with increased GBM patient survival. Our study indicated that the NMB expression may be a biomarker for prognosis and that NMB may be an immunotherapy target in GBM.
Keywords
- glioblastoma
- neuromedin B
- prognosis
- tumor-infiltrating lymphocytes
- ROC
- survival analysis
Glioblastoma (GBM) is the most common primary brain tumor in the world and the most aggressive malignant tumor of the central nervous system [1, 2]. GBM still presents with significantly high mortality and morbidity rate, which has increased in recent years [3]. Although many therapeutics have been developed to treat GBM, the 5-year overall survival (OS) rate remains at about 5.6% [2, 4]. With the rapid development of high-throughput sequencing technologies, many GBM molecular biomarkers have recently been reported in the literature. Therefore, it is imperative to identify new biomarkers to predict the prognosis of GBM.
NMB is a neuropeptide and growth factor widely distributed in the brain and gastrointestinal tract. As an autocrine growth factor, NMB plays a significant role in many physiological functions, such as energy metabolism and memory. In addition, NMB is a potent mitogen and a proangiogenic factor that regulates diverse physiological processes in normal epithelial cells. It has been reported that high level of NMB is associated with an unfavorable prognosis in colon and prostate cancers [5]. However, the prognostic value of NMB in GBM has not been reported.
The roles of tumor-infiltrating leucocytes in GBM patients remain unknown. The correlation between immune infiltrates in GBM and the prognostic value of NMB is not well understood. Given the upregulated NMB expression in most cancers, we hypothesized that the increased NMB expression was correlated with the survival in GBM. To explore this hypothesis, we assessed the prognostic role of NMB based on data from The Cancer Genome Atlas (TCGA) and analyzed NMB expression and its correlation with increased survival and immune infiltrates in GBM.
Transcriptional expression data of NMB and corresponding clinical information were downloaded from TCGA official website [6]. The 18 enrolled cancer types and the RNA-Seq gene expression data were converted to log2 conversion for further studies. Because all the data were obtained from TCGA, this study was not required to provide the approval from the Ethics Committee.
The RNA-Seq expression data of NMB in GBM was obtained from TCGA. Then 166 GBM
and 5 normal brain tissue data were captured for analysis. The mRNA expression
data were presented as the mean values with standard deviation (mean
UALCAN (http://ualcan.path.uab.edu/) [7], a publicly available web resource for analyzing cancer data, was used to perform the analysis of NMB protein expression from Clinical Proteomic Tumor Analysis Consortium (CPTAC) in our study.
The Human Protein Atlas (HPA) includes tumor and normal tissues information regarding the acquisition and expression profiles for protein level of human genes [8]. We performed HPA to compare the protein expression of NMB between normal brain and GBM samples in our study.
The STRING database can retrieve the protein networks online [9] (version 11.0,
http://string-db.org/). In this study, we performed STRING to search for
co-expression genes and to build the protein-protein interaction (PPI) networks
with an interaction score
TIMER database is a user-friendly online resource for systematic analysis of
immune infiltrates about amount of cancer types [10]. We conducted TIMER to
verify the relationship between NMB expression in GBM and six immune cells
(CD4
TISIDB is an interactive online web resource integrated repository portal for tumor-immune system interaction [11]. We performed TISIDB to verify the expression of NMB and tumor-infiltrating lymphocytes (TILs) among human cancers. According to the gene expression profile, the relative abundance of TILs was speculated through gene set variation analysis. The correlations of NMB and TILs were calculated by Spearman’s test.
The PrognoScan is a very powerful online database to assess the correlation between gene expression and survival rates for all types of cancers [12]. We used PrognoScan to analyze the correlation between NMB gene expression and overall survival in two different datasets (GSE4412_GPL96 and GSE4271_GPL96).
The U-87 MG GBM cells were cultured in DMEM containing 10% fetal bovine serum
(FBS) and 1% penicillin, and 1% streptomycin in 5% CO
All statistical analyses were applied with R (V 4.1.0, R Foundation for Statistical Computing, Vienna, Austria) and R package was performed to visualize the expression differences. Paired t-test and Mann-Whitney U-test were performed to examine the differences between GBM and normal brain tissues. ROC curve was applied to verify the cutoff value of NMB using the pROC package [13]. Kaplan-Meier and log-rank tests were performed to assess the effect of NMB on survival rates.
To assess the mRNA expression of NMB in different cancer types, we obtained 19 cancer types from the analysis datasets that contained at least five samples in the control group. As shown in Fig. 1, NMB mRNA expression was significantly increased in 14 of the 19 cancer types compared with the control group. Compared with the control group, NMB mRNA expression was significantly decreased in breast invasive carcinoma (BRCA), kidney renal clear cell carcinoma (KICH) and lung squamous cell carcinoma (PRAD) cancers. The result showed that NMB mRNA expression was abnormal in all cancer types.
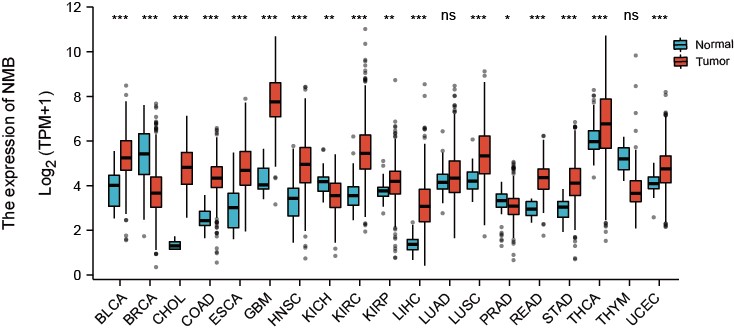 Fig. 1.
Pan-cancer expression pattern of NMB. The mRNA expression of
NMB was increased in 14 of 19 cancer types compared with normal tissues.
*p
To verify NMB mRNA expression in GBM, we analyzed NMB expression in TCGA
database. The characteristics of GBM patients were analyzed from TCGA and Table 1
lists the baseline characteristics. Unpaired data analyses demonstrated that
NMB mRNA expression in GBM (n = 169) significantly increased
compared with control tissues (n = 5) (as shown in Fig. 2A, 2.565
| Characteristic | Total | Low expression of NMB | High expression of NMB | p-value | |
|---|---|---|---|---|---|
| N (%) | N (%) | N (%) | |||
| Gender | 0.747 | ||||
| Female | 59 (35.2%) | 31 (18.5%) | 28 (16.7%) | ||
| Male | 109 (64.8%) | 53 (31.5%) | 56 (33.3%) | ||
| Race, n (%) | 1.000 | ||||
| Asian | 5 (3%) | 2 (1.2%) | 3 (1.8%) | ||
| Black or African American | 11 (6.6%) | 6 (3.6%) | 5 (3%) | ||
| White | 150 (90.8%) | 75 (45.2%) | 75 (45.2%) | ||
| Age, n (%) | 0.757 | ||||
| 84 (51.8%) | 45 (26.8%) | 42 (25%) | |||
| 81 (48.2%) | 39 (23.2%) | 42 (25%) | |||
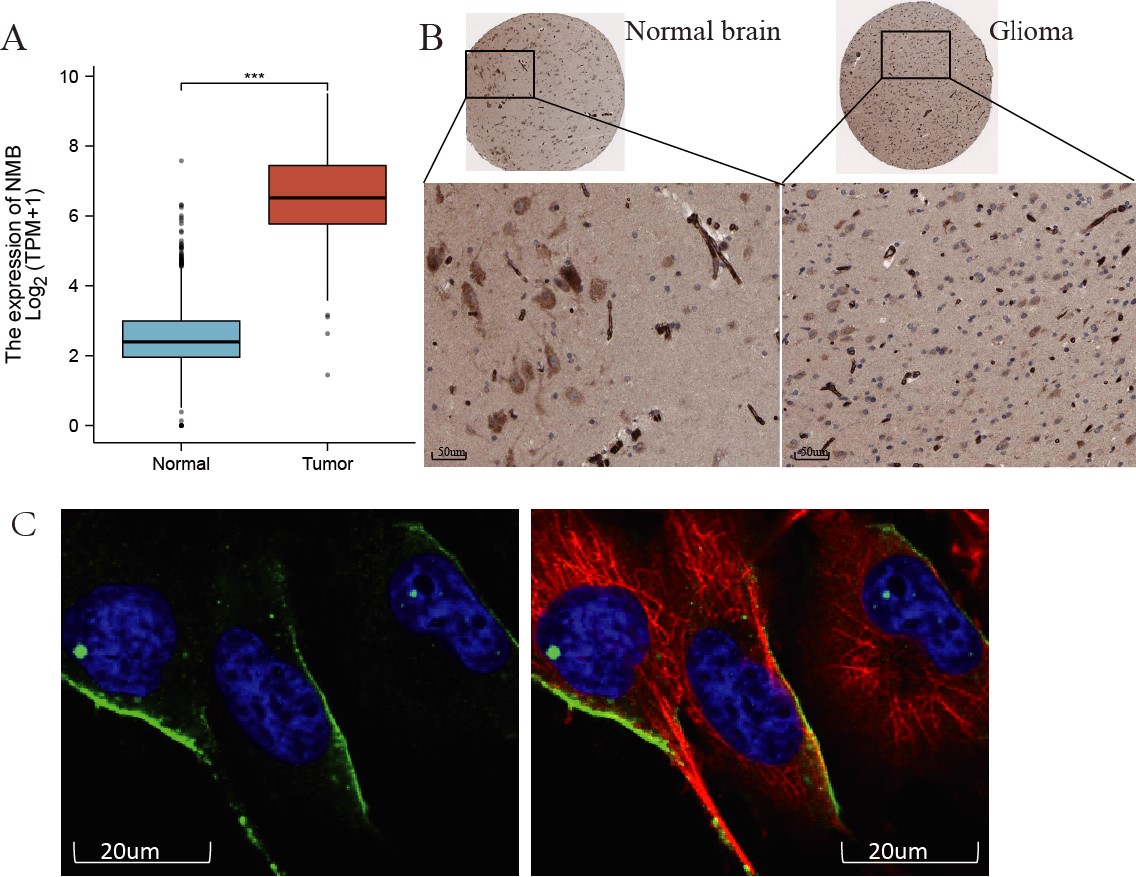 Fig. 2.
The mRNA and protein expression of NMB in GBM. (A) The mRNA
expression levels of NMB in 169 GBM samples and five normal samples.
***p
Next, we examined NMB protein expression in GBM using the HPA database. As shown in Fig. 2B,C, NMB expression, evaluated with immunohistochemical staining, was enhanced in GBM (Fig. 2C) compared with normal brain (Fig. 2B). NMB protein expression located in the cytoplasm and membrane of U-251 MG cells (Fig. 2D) using immunofluorescence staining. These results showed that both NMB mRNA and protein expression were increased in GBM patients.
To obtain a NMB value for distinguishing GBM from normal brain samples, we conducted ROC curve analysis. As shown in Fig. 3A, by analyzing the ROC curve was determined that the AUC value of NMB was 0.984 (95% CI: 0.971–0.997). At the 4.490 cutoff, the specificity and sensitivity of NMB expression were 96.2% and 96.4%, respectively. The positive and negative predictive values were 78.4% and 99.5%, respectively. The 4.490 cutoff was beneficial in distinguishing high NMB expression from low NMB expression in GBM patients. These results demonstrated that NMB expression could be a prospective biomarker for differentiating GBM patients from healthy individuals.
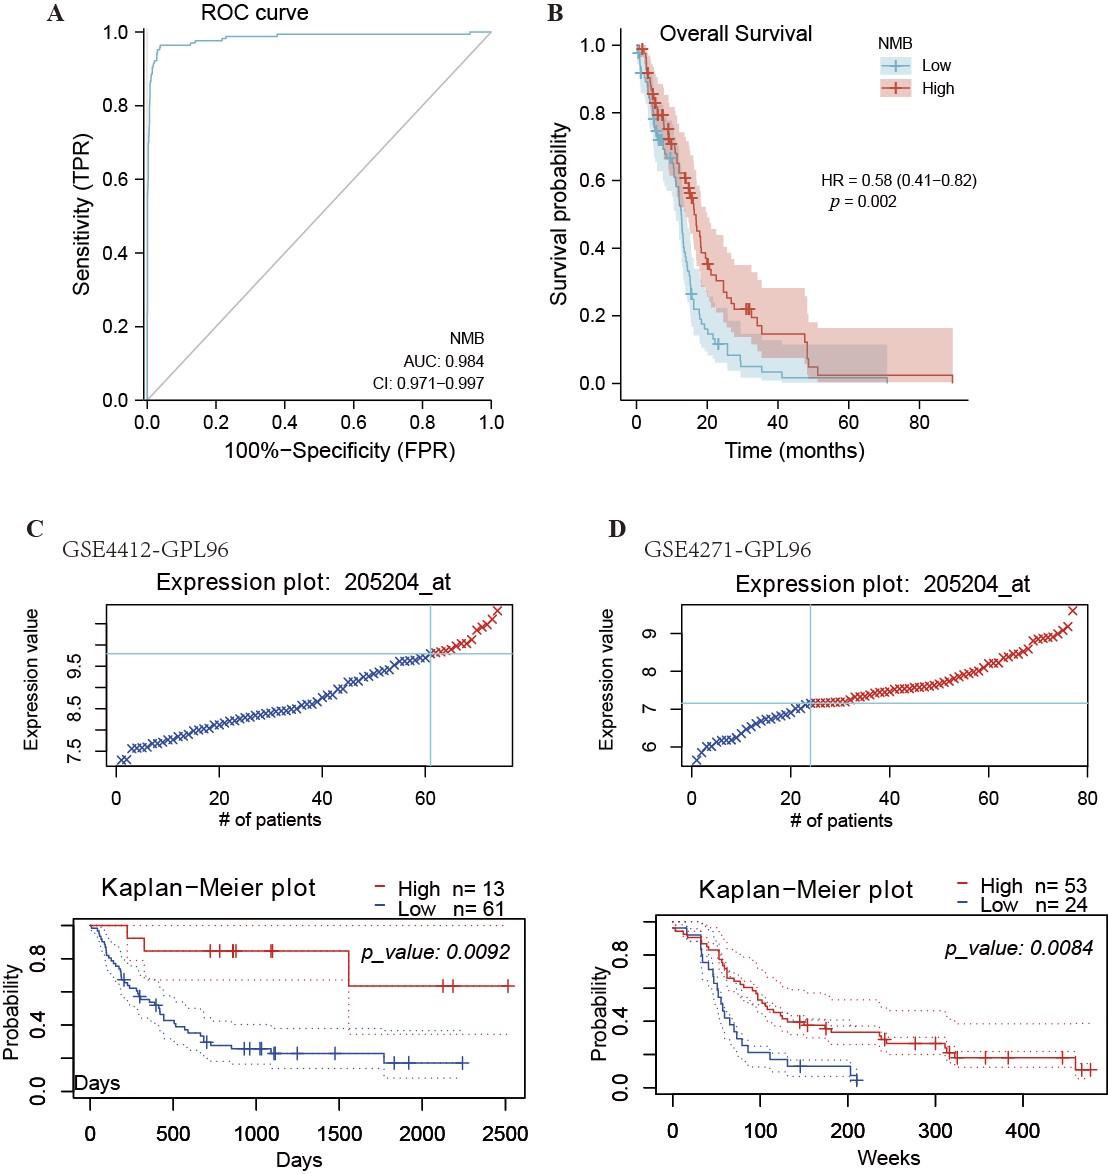 Fig. 3.
ROC and Kaplan-Meier curves for NMB. (A) ROC curve showed that NMB had an AUC value of 0.984 to discriminate GBM from healthy control tissues. With a cutoff of 4.490, the sensitivity and specificity were 96.4% and 96.2%, respectively. (B) Kaplan-Meier survival curves indicated that GBM patients with a high level of NMB mRNA expression had a long OS compared with those with low-level of NMB expression (16.3 vs. 12.7 months, p = 0.002). Low expression of NMB was associated with poor overall survival in datasets GSE4412_GPL96 (C) and GSE4271_GPL96 (D) analyzed using PrognoScan. HR, Hazard Ratio.
To determine the relationship between NMB expression and relative OS in GBM patients, Kaplan-Meier curves were constructed, and the PrognoScan database was applied to the analysis OS. As shown in Fig. 3B, the OS in GBM patients with higher expression levels of NMB was significantly longer than the OS in those with lower expression levels (12.7 vs. 16.3 months, p = 0.002). These results shown in Fig. 3C,D, also demonstrated that high NMB expression was associated with longer OS in GBM patients using two different datasets (GSE4412 and GSE4271). These results indicated that low NMB expression is one of the biomarkers of poor prognosis in GBM patients.
To construct the PPI networks of NMB and the relative functional annotations, we used the STRING database to construct the PPI network, and performed GO analysis and KEGG pathway analysis. As shown in Fig. 4A, the NMB PPI network was constructed including its 10 co-expression genes. Fig. 4B shows that these biological processes of NMB were associated with neuroactive ligand-receptor interactions, receptor ligand activity, and neuropeptide signaling pathways. Functional annotations showed that these genes participated in the axon initial segment and neuronal cell body, as well as in hormone activity. As shown in Fig. 4C,D, the correlation coefficients were significant between NMB expression and co-expressed genes in GBM patients.
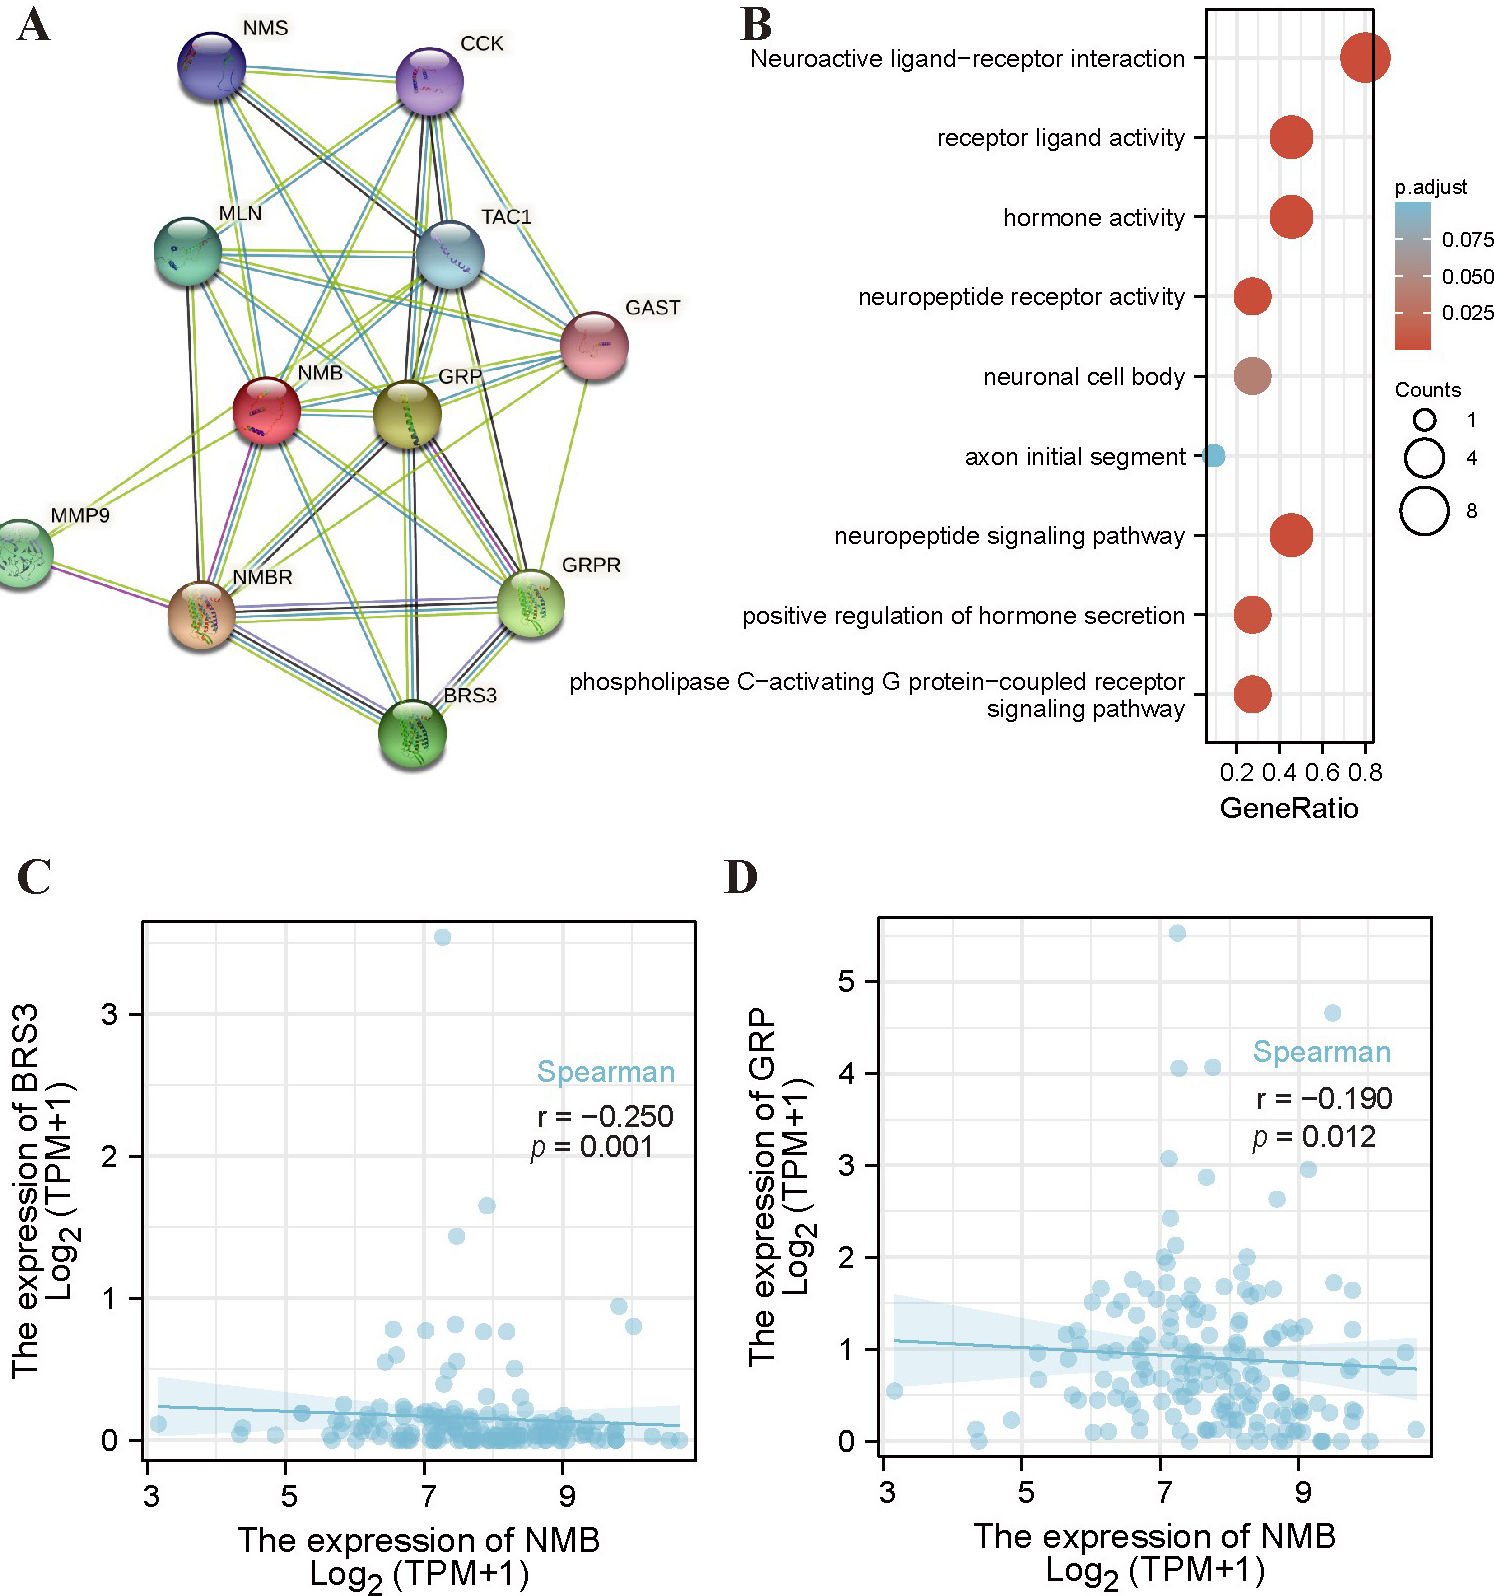 Fig. 4.
PPI networks and functional enrichment analyses of NMB. (A) A network of NMB and its co-expression genes. (B) Functional enrichment analyses of 11 involved genes. NMB was associated with actin filament organization, regulation of actin filament-based process, and actin cytoskeleton organization. These genes were involved in purine ribonucleoside binding, GTP Binding, and GTPase Activity. (C,D) The correlation analyses between the expression of NMB and co-expressed genes in GBM. BRS3, bombesin receptor subtype 3; GRP, gastrin releasing peptide.
We performed a correlation analysis between NMB expression and TILs using the
TIMER database. Fig. 5A shows that NMB expression was correlated with tumor
purity (r = 0.105, p = 3.1
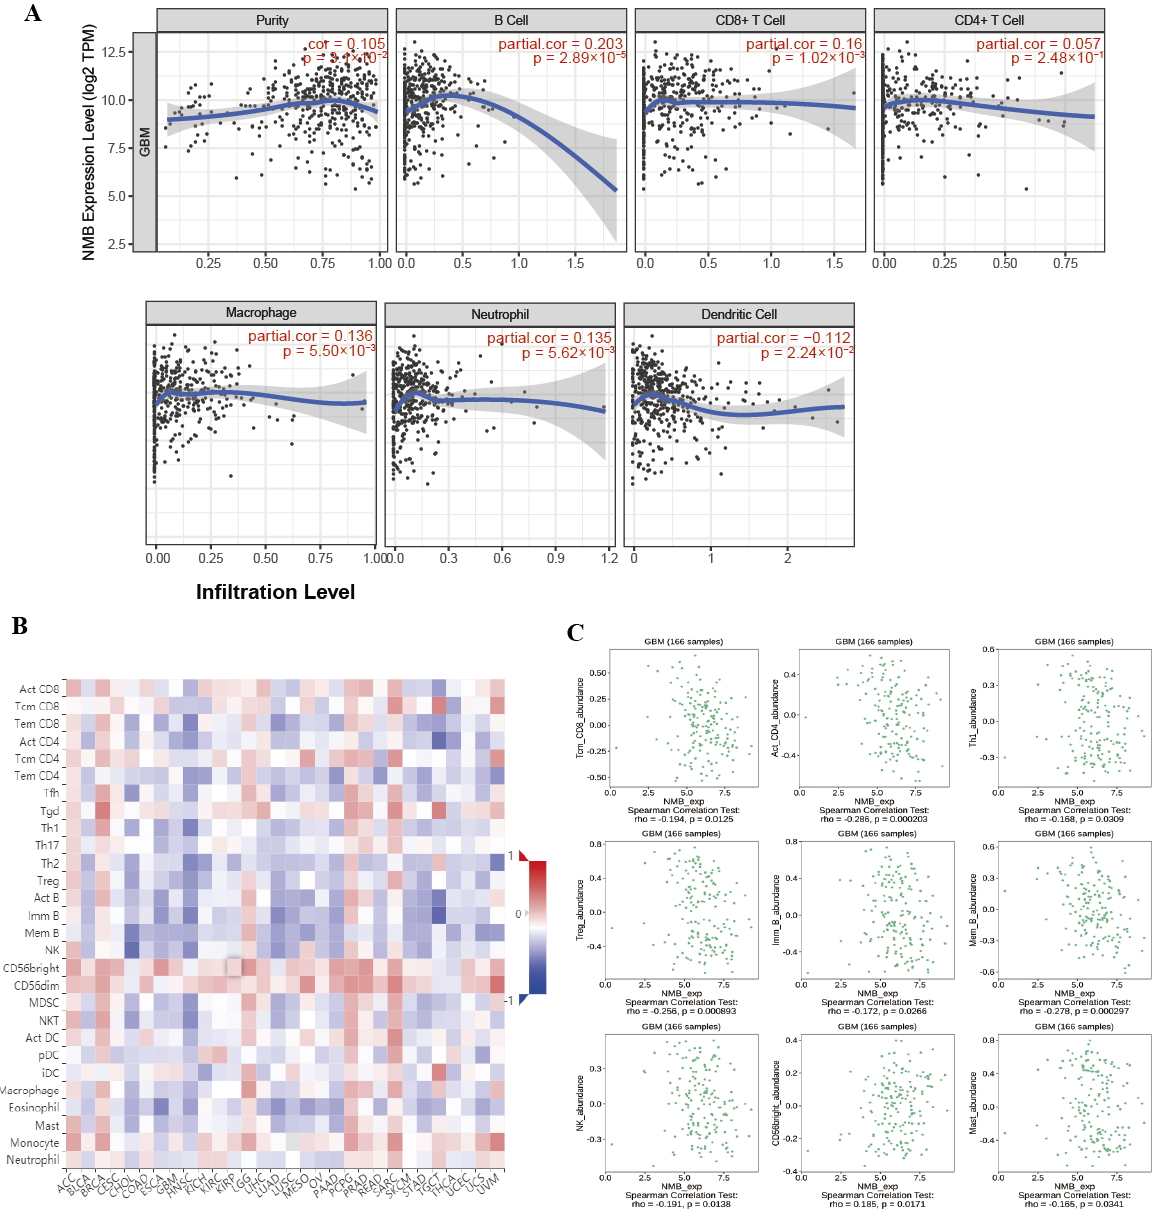 Fig. 5.
Correlation of NMB expression with TILs. (A) NMB expression is
negatively related to tumor purity and is correlated with B cells, CD8
We measured the proliferation effect of NMB on glioblastoma using the CCK8
assay. U-87 MG cells are treated with 0-, 10-, 50-, and 100
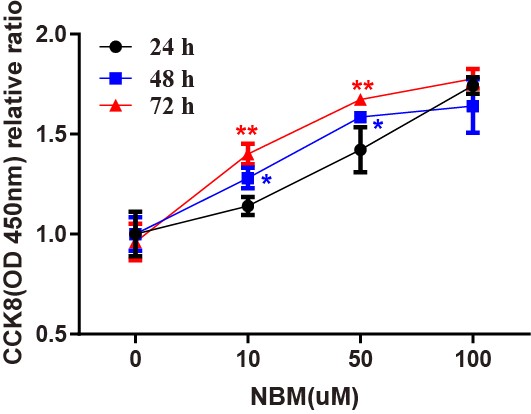 Fig. 6.
The proliferation effects of NMB on glioblastoma cells. The
proliferative effects of varying concentrations of NMB (10 uM, 50 uM, 100 uM) in
U-87 MG cell lines were performed by the CCK8 assay. Untreated cells at 24-, 48-,
and 72-h were used as a negative control (100% viability). The relative ratios
of cell viability are given as mean
In this study, we proved that NMB expression increased in GBM compared with normal brain tissues. The analysis of ROC curve indicated that NMB might be used to distinguish GBM from healthy brain tissue. According to the Kaplan-Meier curves and the univariate analysis, we found that low expression of NMB mRNA was correlated with poor OS and that NMB expression could be regarded as a potential biomarker for poor prognosis in GBM patients. Furthermore, NMB expression plays an important role in TILs of GBM patients.
NMB is a member of bombesin (BN)-like peptide family in mammals that has various autocrine and paracrine functions. Several studies have reported that NMB regulated tumor cell proliferation in several cancer cells [14, 15, 16]. According to our pan-cancer analysis, the expression of NMB mRNA was abnormal in various cancers. Our results are consistent with those studies. We demonstrated that NMB expression was significantly upregulated in GBM patients.
The functions of NMB in tumors have been previously reported. Previous studies
suggested that NMB may induce proliferation of porcine Leydig cells and ATDC5
cells [17, 18]. Neurotensin-like peptides were a target for suppressing the
proliferation and growth of colon and prostate cancer cells [5]. NMB could
regulate IL-6 and COX-2 expression via the NF-
NMB interacts with its receptor NMBR, which was a G-protein coupled receptor with seven trans-membrane regions, and through that interaction all its potent biological actions are mediated. Some studies reported that NMBR was expressed in various normal tissues and overexpressed in some solid tumors [14, 15, 16]. In breast cancer, an NMBR antagonist inhibited tumor angiogenesis and tumor growth [21]. The NMBR antagonist PD168368 inhibited the growth of MDA-MB-231 breast cancer cells by inducing cell cycle arrest and apoptosis [21]. Yang reported that BIM-23127, an NMBR antagonist, could potentially inhibit cellular proliferation [22] and induce the death of the medulloblastoma cell line DAOY [23].
Given that NMBR antagonist suppresses tumor angiogenesis and tumor growth [21], we hypothesized that NMB was involved in the GBM proliferation. According to Kaplan-Meier curves and log-rank test, GBM patients with low NMB mRNA expression had lower survival rates than those with high NMB expression levels. We hypothesized that the reduced NMB is a potential biomarker for determining poor prognosis of GBM.
The relationship between immune cell infiltrates and the prognosis of GBM patients remains debatable. The increased levels of immune cell infiltration are present in GBM patients. Ge reported that the overexpression level of CD163+macrophages was found in GBM, but not in normal brain specimens [24]. Tumor-associated macrophage activation is involved in promoting tumor aggressiveness and is associated with outcome. González-Tablas [25] reported that the overall survival of GBM patients with mixed myeloid and T-lymphoid infiltrates was significantly shorter. M Hajj [26] reported that GBM patients with high expression of activated natural killer cells and M2 macrophages excluded long survivors. The infiltration of immune cells has attracted attention as a potential novel immunotherapeutic option for GBM.
Many reports about the possible role of NMB in tumor cell infiltration have
emerged in recent years. Yang reported that NMB and NMBR may be involved in the
spontaneous actin polarization of transformed CD8 T cells [22]. However, the
correlation analysis of NMB expression and TILs has not been reported in GBM
patients. By TIMER analysis, we demonstrated that some TILs (such as macrophages,
B cells, CD8
NMB is structurally related to the gastrin-releasing peptide (GRP), which is a member of the BN-like peptide family in mammals. Three types of related receptors make up the BN receptor family: the 390-amino acid NMB-preferring receptor (NMBR), the 384-amino acid GRP-preferring receptor (GRPR) and the 399-amino acid orphan receptor named BN-receptor subtype 3 (BRS3 receptor). The co-expression analyses demonstrated that NMB expression was significantly associated with GRP and BRS3. NMBR regulates EGF receptor transactivation by a mechanism dependent on the activation of metalloprotease and the production of reactive oxygen species [23]. Given these findings, we considered that the upregulation of NMB expression would involve these pathways, and that NMBR antagonism may be an alternative treatment for GBM. However, this hypothesis should be investigated in future experiments.
Our study had some limitations. First, NMB expression and prognostic analysis were performed using online public databases; further research using clinical samples is required to validate these findings. Secondly, additional experiments should be conducted to investigate the potential mechanisms related to the effect of NMB on TILs in GBM patients.
In the current study, our findings showed that the expression of NMB mRNA was increased in GBM patients. The increased NMB expression might be regarded as a potential biomarker that could be used to identify GBM patients with good prognosis. Furthermore, NMB expression was correlated to TILs and played an important role in patients with GBM.
All data generated or analyzed during this study are included in this published article. The experimental data analyzed and displayed in the present manuscript are available from the corresponding author upon reasonable request.
ML and CL designed the study. SuqL, QL, and ShiL analyzed the data. FL and WL performed the experiments. HX, LY, and CO contributed to the writing of the manuscript. All authors read and approved the final manuscript.
Not applicable.
Not applicable.
This work was supported by a grant from the National Natural Science Foundation of China (No. 82073852), the fund of the Science and Technology Department of Hubei Province (ZX2021F007) and the found of Hubei University of Science and Technology (2018xzy02, 2019xz01, 2019-21GP12).
The authors declare no conflict of interest.
References
Publisher’s Note: IMR Press stays neutral with regard to jurisdictional claims in published maps and institutional affiliations.