1. Introduction
Silicon dioxide (SiO) and titanium dioxide (TiO) are the most widely
used food additive particles and have been widely applied to the food industry as
an anti-caking and a coloring agent, respectively [1, 2, 3]. SiO is used in
confectionary, powdered mixtures, and seasonings to prevent ingredients from
clumping together. TiO is mainly added in confectionary including
chocolates, candies, bakeries, snacks, and chewing gums due to its whitening
pigment property. In the Unites States, the Food and Drug Administration
recommends that the amounts for SiO and TiO are below 2% and 1% by
weight of the food, respectively [1, 2]. In the European Union (EU), SiO
and TiO were registered as E551 with maximum levels at 1% in dried
powdered foods and as E171 with no maximum level specified, respectively [4, 5].
Current regulations do not specify the particle size range or size distribution
of food additive SiO and TiO. Rapid development of nanotechnology may
lead to manufacture nano-sized SiO and TiO particles, which have
large specific surface area to volume ratio, high reactivity, and different
biological responses compared with bulk-sized particles [6, 7]. Indeed, recent
studies demonstrate that nanoparticles (NPs) ranged from 1 to 100 nm are present
in commercially available food additive SiO and TiO, raising concerns
about their potential toxicity [8, 9, 10, 11].
Food additives are utilized in processed foods where thermal, mixing, and
agitating treatments are often applied, which can cause the formation of
aggregates or dissolution of particles [4, 12]. Moreover, the interactions
between food additives and food components can occur, which can also affect the
fates of food additive particles [13, 14, 15, 16]. Determining whether SiO and
TiO are present as intact particles, aggregates, or dissolved forms is
important to understand and predict their potential toxicity. Orally taken
SiO is generally considered to be not toxic at actual usage levels [17, 18, 19].
However, some contradictory results were also reported, showing its potential
toxicity in terms of oxidative stress, inflammation response, and intestinal
barrier dysfunction, although most studies were performed using in vitro
systems [20, 21, 22]. In the EU, food additive TiO (E171) is considered no
longer safe due to uncertainty of its genotoxicity [23]. TiO is known to
induce reactive oxygen species (ROS), which is critical to cause oxidative
stress-related diseases [15, 24]. Recently studies demonstrated that food-grade
TiO can be involved in the intestinal barrier dysfunction, colorectal
cancer, and development in offspring rodents [22, 25, 26]. Hence, the information
about the fates of SiO and TiO will be necessary and useful to answer
the question as whether their toxicity is related to particle or ionic fates.
Most studies on the fate determination of NPs have applied harsh conditions such
as acid and heat treatments to digest organic matrices, which can surely alter
their dissolution and particle fates [15, 27]. A detergent-based cloud point
extraction (CPE) was used for the detection of ions in matrices and environments
after filtering, acid treatment, and dry-ashing [28, 29]. In the previous study,
we developed a Triton X-114 (TX-114)-based CPE method to separate zinc oxide
(ZnO) particles as intact forms from commercial foods and biomatrices without
pre-treatments [14]. The CPE approach was also developed for SiO in
biomatrices and its fates were determined in cell lines and tissues [17]. In this
study, the CPE method was further optimized for the most widely applied food
additive particles, SiO and TiO, in food matrices to determine their
dissolved, aggregated, or particle fates in commercial food products.
Furthermore, the physicochemical properties of separated SiO and TiO
particles from commercial foods by the CPE were characterized in terms of
constituent particle size, crystalline phase, and solubility.
2. Materials and Methods
2.1 Materials
Food additives SiO and TiO particles were purchased from Evonik
Industries AG (Essen, Germany) and Tioxide Europe S.R.L (Varese, Italy),
respectively. TX-114, casein, humic acid (HA, sodium salt), Si standard solution,
and Ti standard solution were provided by Sigma-Aldrich (St. Louis, MO, USA).
Nitric acid (HNO), hydrogen peroxide (HO), hydrofluoric acid
(HF), sodium chloride (NaCl), sodium hydroxide (NaOH), and ethyl alcohol were
supplied by Samchun Pure Chemical Co., Ltd. (Pyeongtaek, Gyeonggi-do, Republic of
Korea). Powdered sugar was purchased from Samyang Co. (Seoul, Republic of Korea).
Conical-bottom glass centrifuge tubes (15 mL) were obtained from Daeyoung Science
(Seoul, Republic of Korea). Commercial products containing SiO (candy,
powder, coffee mix, milk tea, and snacks) or TiO (candy, powder, sauces,
chocolate, and snacks) as food additives were purchased from supermarkets located
in Seoul, Republic of Korea in 2022.
2.2 Characterization
Particle size and shape of SiO or TiO were analyzed by field
emission transmission electron microscope (FE-TEM; JEM-2100F, JEOL, Tokyo, Japan)
equipped with energy-dispersive X-ray spectroscopy (EDS). The particles were
dispersed in distilled and deionized water (DDW) and the suspensions (0.1 mg/mL)
were prepared in ethyl alcohol solution and sonicated for 15 min (160 W,
Bransonic 5800, Branson Ultrasonics, Danbury, CT, USA). The suspensions (5
L) were dropped on a carbon-coated copper grid (200 mesh,
PELCO® TEM Grids, Ted Pella Inc., Redding, CA, USA). After drying
at room temperature, TEM images were acquired at an accelerating voltage of 200
kV. The average particle sizes and size distributions of SiO or TiO
particles were determined using ImageJ software (version 1.53k, National
Institutes of Health, Bethesda, MD, USA).
Crystal structure of SiO or TiO was determined by powder X-ray
diffraction (XRD) patterns using X-ray diffractometer (SmartLab, Rigaku Co.,
Tokyo, Japan) with Ni-filtered CuK radiation ( =
1.5418Å, a voltage of 40 kV, a current of 40 mA, a scan range of
5–80° with a step size of 0.02°, and a scanning rate of
3°/min).
Hydrodynamic diameters and zeta potentials of SiO or TiO were
measured by dynamic light scattering (DLS) and electrophoretic light scattering
(ELS), respectively, using a Zetasizer Nano System (Malvern Instruments,
Worcestershire, UK). SiO or TiO suspension (0.1 mg/mL) was prepared
in DDW or humic acid (HA) solution (10 g/mL) and stirred for 30 min. After
further sonication for 15 min, the suspensions (1 mL) were immediately put in
plastic cuvettes and the measurements were carried out at room temperature.
2.3 Optimizations of CPE for SiO and TiO
CPE method for SiO and TiO was optimized with SiO or TiO
dispersions (0.1 mg/mL) in DDW or HA solution (10 g/mL), respectively.
After stirring for 30 min and sonication for 15 min at room temperature, the
suspensions (7 mL) were transferred to bottom glass centrifuge tubes (15 mL) and
the pH was adjusted to 3.0 and 4.0 for SiO and TiO, respectively,
with NaOH or HNO solution. Next, TX-114 (0.5 mL of 5% (w/v)) and NaCl
(0.75 mL of 0.2 M) solutions were added in the suspensions and diluted to 10 mL
with DDW. The mixed solutions were incubated for 30 min at 45 °C to
promote phase separation and centrifuged at 2500g for 5 min at 25
°C. The precipitates and the supernatants where particles and ions were
present, respectively, were digested for inductively coupled plasma-atomic
emission spectroscopy (ICP-AES) analysis (JY2000 Ultrace, HORIBA Jobin Yvon,
Longjumeau, France) as described in “2.7. Digestion of Organic Materials,
Microwave digestion, and ICP-AES Analysis”.
2.4 CPE Application for SiO and TiO in Food Matrices
The CPE developed for SiO or TiO was applied by spiking SiO or
TiO into representative food matrices, powdered sugar or casein. The
contents of SiO and TiO were adjusted to be 2% (w/w) and 1% (w/w)
based on FDA recommendations, respectively. SiO suspension (0.1 mg/mL) was
spiked into 0.1 g of powdered sugar or casein at the concentration of 2% (w/w)
and dispersed in DDW (7 mL). TiO (0.1 mg/mL) was spiked into 0.1 g of food
matrices at the concentration of 1% (w/w) and dispersed in HA solution (7 mL).
After stirring for 30 min and sonication for 15 min, the same procedure was
applied as described in “2.3. Optimizations of CPE for SiO and
TiO”.
2.5 Fate Determination of SiO and TiO in Commercial
Foods
Commercial foods (10 g), such as candy, powder, coffee mix, milk tea, chocolate,
sauce, and snacks, containing SiO or TiO as a food additive on
product labeling were homogenized in an agate mortar. Homogenized commercial
products were dispersed in 7 mL of DDW and 7 mL of HA solution for the
determination of SiO and TiO, respectively. After stirring for 30 min
and sonication for 15 min, the same procedure was applied as described in “2.3.
Optimizations of CPE for SiO and TiO”.
2.6 Dissolution Properties of SiO and TiO in Food
Matrices and Commercial Foods
Dissolution properties of SiO and TiO in food matrices were
evaluated in powdered sugar or casein, spiked with SiO (2% (w/w)) or
TiO (1% (w/w)). Commercial foods (10 g) containing SiO or TiO
as a food additive indicated on product labeling were homogenized in an agate
mortar. Food matrices (0.1 g) or homogenized commercial products (0.1 g) spiked
with SiO and TiO were dispersed in 10 mL of DDW and HA, respectively,
and stirred for 30 min, followed by sonication for 15 min at room temperature.
Further incubation was carried out for 30 min at 45 °C, as described in
“2.3. Optimizations of CPE for SiO and TiO”. The suspensions were
then centrifuged at 16,000g for 15 min to collect the supernatants
containing dissolved Si or Ti. The Si and Ti concentrations in the supernatants
were determined by ICP-AES analysis after pre-digestion with HNO and
HO as described in “2.7. Digestion of Organic Materials, Microwave
digestion, and ICP-AES Analysis”.
2.7 Digestion of Organic Materials, Microwave Digestion, and ICP-AES
Analysis
Si or Ti concentrations were quantified by measuring total Si or Ti contents
using ICP-AES analysis, with Si or Ti standard solutions of different
concentrations based on our previous reports [15, 30]. It was reported that the
amount of SiO and TiO in commercial foods are ranged from 1.5 to 7
mg/g and 0.2 to 10 mg/g, which are enough to be detected by ICP-AES [15, 31, 32].
Organic materials in the supernatants obtained after dissolution or CPE
experiments were digested with 10 mL of ultrapure HNO and 1 mL of
HO at 180 °C until the solution was colorless and entirely
evaporated. The precipitates containing SiO or TiO particles after
CPE application were digested in perfluoroalkoxy microwave digestion vessels
using a microwave system (ETHOS EASY, Milestone Srl, Sorisole, Italy). Briefly,
SiO particles were digested with 6 mL of 70% HNO and 1 mL of 40%
HF. TiO particles were digested with 6 mL of 70% HNO and 2 mL of
40% HF [33, 34]. The samples were digested for 55 min at 1600 W by irradiation
at 120, 160, and 210 °C for 15, 10, and 30 min, respectively, followed
by holding for 1 min. After digestion, all samples were diluted to suitable
volumes with DDW, shaken up and down, and analyzed by ICP-AES. Method blanks were
determined by performing the same procedure in the absence of Si or Ti samples.
Instrument operating conditions are described in Supplementary Table 1.
2.8 Statistical Analysis
Results were presented as means standard deviations. One-way analysis of
variance with Tukey’s test was performed using the SAS Ver.9.4 (SAS Institute
Inc., Cary, NC, USA) to determine the significances of intergroup differences.
Statistical significance was accepted for p values of 0.05.
3. Results and Discussion
3.1 Optimization of CPE for SiO and TiO
To optimize TX-114-based CPE methods for SiO and TiO, commercially
available food-grade SiO and TiO were purchased and the
characterization of each particle was carried out. Supplementary Fig.
1A,B show that the constituent particle sizes of SiO and TiO by TEM
analysis were 14 4 nm and 109 35 nm, respectively. Zeta potential
values of SiO and TiO under different pH conditions are presented in
Supplementary Fig. 1C, showing isoelectric points (IEP) of the former
and the latter were pH 1.9 and 3.1, respectively. It was reported that the
electrostatic repulsion of particles is minimized at pH close to the IEP due to
reduction of Brownian motion, and thus, the pH where zeta potentials are close to
zero is optimal for the formation of NPs captured in TX-114-based micelles [35, 36]. But, the addition of NaCl during the CPE process elevated zeta potential
values of NPs. Hence, the pH values for the CPEs were set at higher pHs than IEP
values, 3.0 and 4.0 for SiO and TiO, respectively. As a consequence,
particles can be captured in TX-114-based micells as precipitates, whereas
ionized forms are present in supernatants after phase separation using CPE
followed by centrifugation.
Table 1 demonstrates the changes in hydrodynamic diameters and zeta potentials
before and after CPE application. The hydrodynamic diameters of SiO
suspension in DDW were statistically same to those obtained by CPE, whereas
SiO in HA solution had increased hydrodynamic diameters after CPE
application (Table 1). In case of TiO, no increase in hydrodynamic
diameters after CPE was found when it was dispersed in HA solution. It is worth
noting that particles captured in TX-114 micelle by CPE must have the same
particle size distribution compared with pristine particles without aggregation
or dissolution, which is critical for fate determination as intact forms. Hence,
SiO and TiO were dispersed in DDW and HA solution, respectively, for
CPE application. This result also suggests that the CPE process can capture
SiO and TiO as intact forms without aggregate formation or
degradation. On the other hand, Table 1 shows that the zeta potential values of
both SiO and TiO changed to less negative charges after CPE, probably
resulted from NaCl addition during the CPE process.
Table 1.Hydrodynamic diameters and zeta potentials of pristine food
additive SiO and TiO under different CPE conditions.
| Dispersant type |
Hydrodynamic diameters (nm) |
Zeta potentials (mV) |
| Before CPE |
After CPE |
Before CPE |
After CPE |
| SiO in DDW |
229 3 |
226 18 |
–37 1 |
–27 4 |
| SiO in HA |
466 66 |
708 170 |
–42 1 |
–23 2 |
| TiO in DDW |
304 4 |
838 22 |
–23 1 |
–11 1 |
| TiO in HA |
337 11 |
354 7 |
–32 2 |
–14 1 |
| Different upper-case letters (A,B) indicate significant differences between
different CPE dispersion conditions (p 0.05). Different lower-case
letters (a,b) indicate significant differences between before and after CPE steps
(p 0.05). Abbreviation: CPE, cloud poidnt extract; DDW, distilled
and deionized water; HA, humic acid. |
Total recoveries of SiO and TiO were about 92.8% and 97.5%,
respectively, and only 0.6% and 0.1% of SiO and TiO were detected
as Si and Ti ionic forms, respectively, after CPE application (Fig. 1A,B).
Meanwhile, the solubility of pristine SiO and TiO was assessed under
the CPE conditions, showing 0.5% and 0.2% solubilities for the former and the
latter, respectively, without significant differences between solubility and
ionic fates (Fig. 1B). These results clearly indicate that SiO and
TiO particles can be obtained as intact particle forms by CPE approaches.
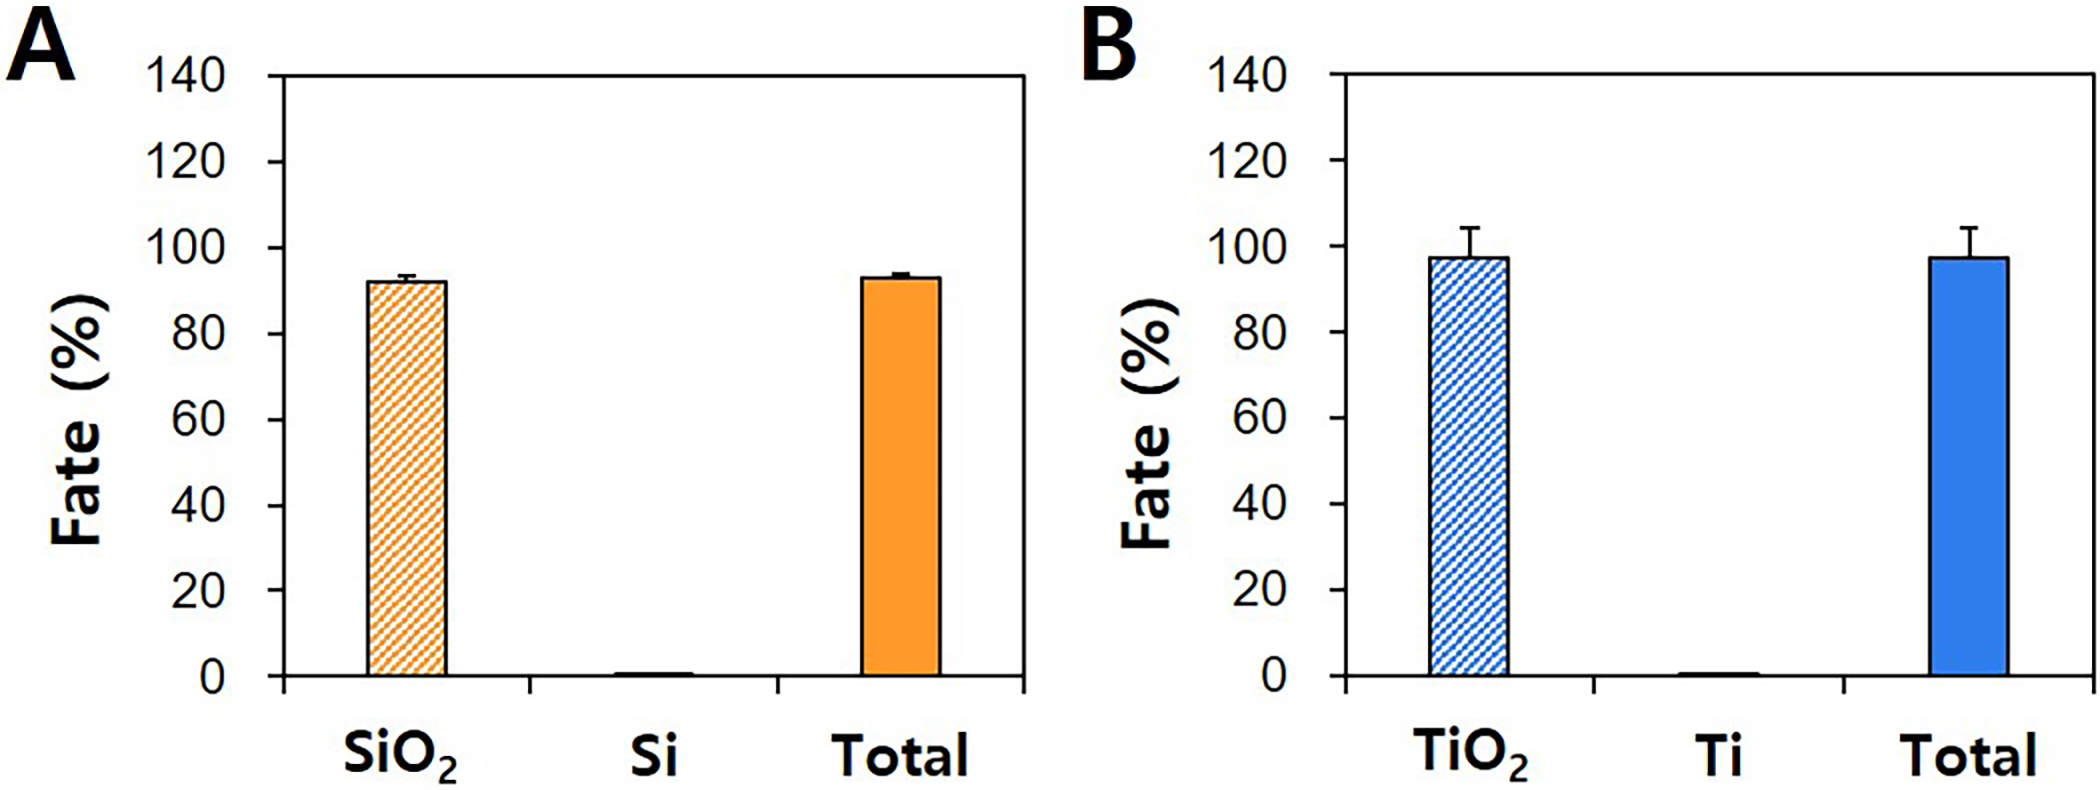 Fig. 1.
Particle or ionic fates and total recoveries of pristine food
additive (A) SiO and (B) TiO by CPE.
3.2 CPE Application for SiO and TiO in Food Matrices
Representative food matrices such as powdered sugar and casein were spiked with
SiO or TiO, and the CPE methods optimized were applied. Powedered
sugar and casein were chosen as food matrices due to their frequent usage in
confectionary. Fig. 2A shows that there were no statistical changes in
hydrodynamic diameters between pristine SiO or TiO and particles
recovered from particles-spiked powdered sugar or casein by CPE application,
suggesting that the CPE methods can recover SiO and TiO particles
from food matrices as intact forms without aggregation or dissolution. The
recoveries of SiO and TiO in powdered sugar or casein as particle
forms were ranged from 93.2% and 102.6% (Fig. 2B,C). Only
~0.7% and 0.1% of SiO and TiO were detected as
ionic forms, respectively, regardless of matrix type. Total recoveries of both
particles and ions were 93.3%–103.3% for all cases, implying reliability of
the results. All the results suggest that SiO and TiO added in food
matrices can be separated as intact particle forms by applying the CPE.
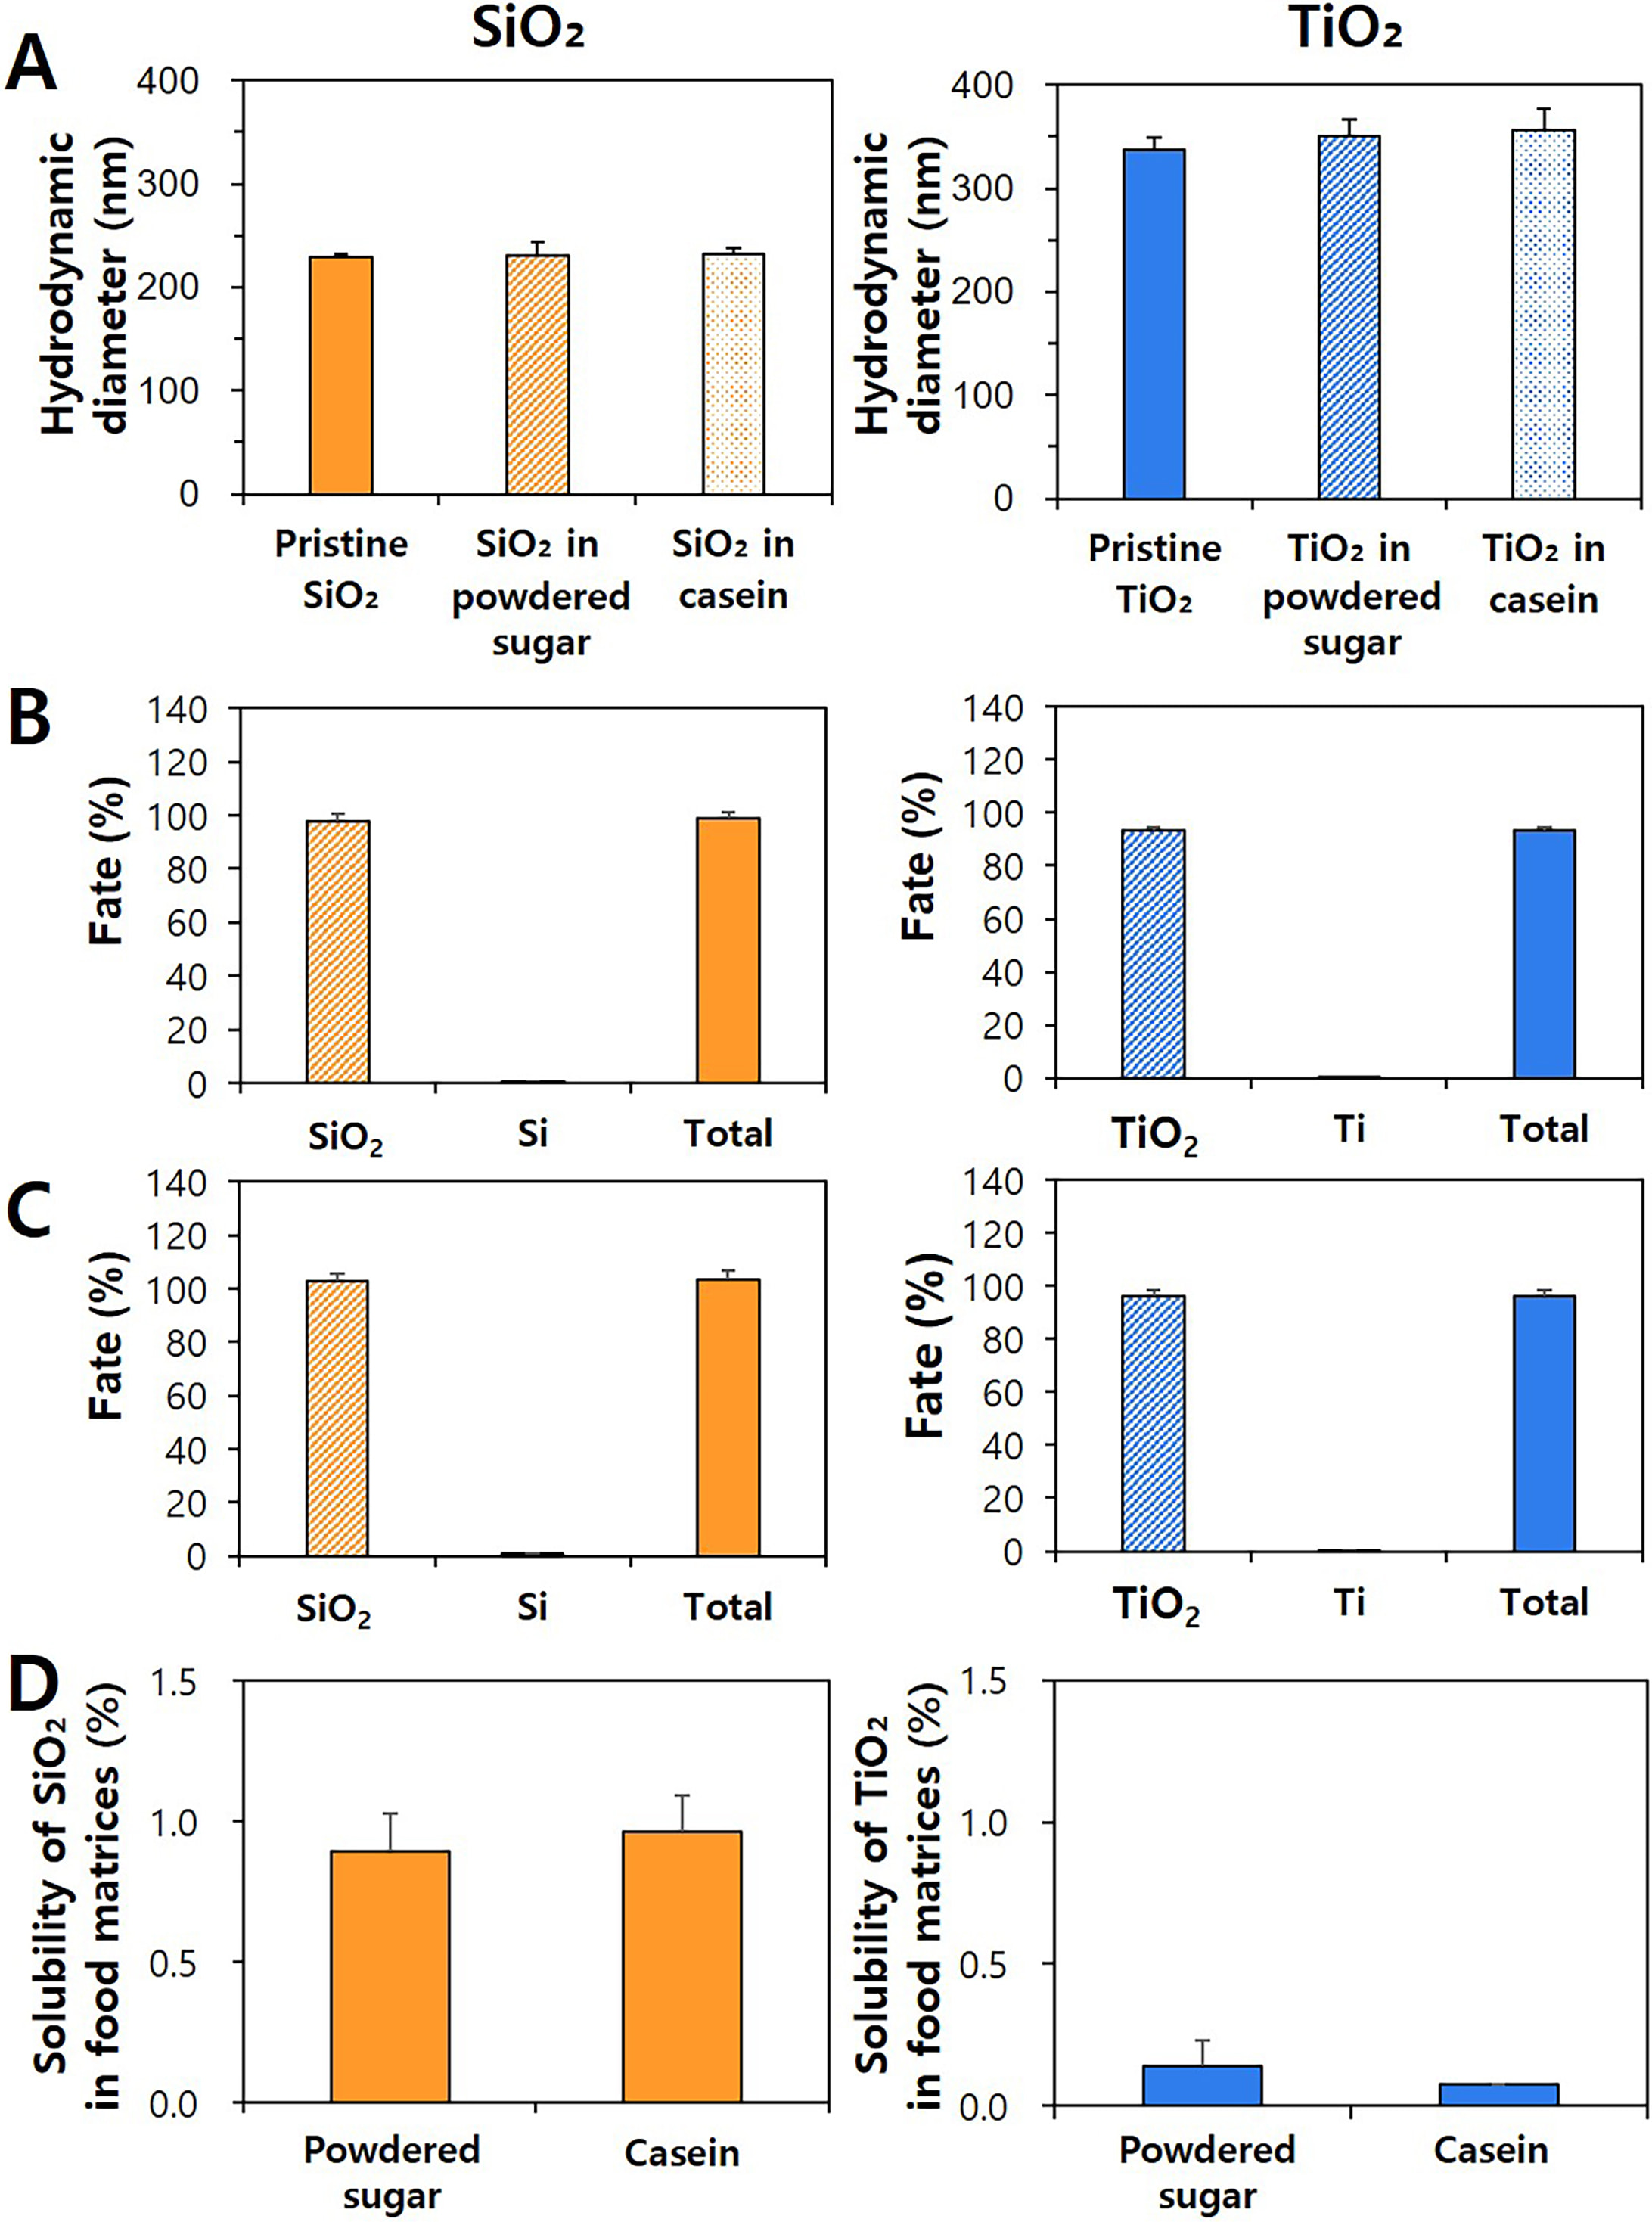 Fig. 2.
Hydrodynamic diameters, fates, and solubility of SiO and TiO
particles in food matrices. (A) Hydrodynamic diameters of SiO and
TiO in food matrices before (pristine) and after CPE. No significant
differences between before and after CPE were found (p 0.05).
Particle or ionic fates and total recoveries of pristine food additive SiO
and TiO in (B) powdered sugar and (C) casein by CPE. (D) Dissolution
properties of food additive SiO and TiO in food matrices.
On the other hand, the solubility of SiO and TiO was also evaluated
because particles can dissolve to some extent in food matrices. As shown in Fig. 2D, the solubilities of SiO and TiO were ~0.9% and
0.1%, respectively, without significant differences compared with ionic forms
(%) obtained by CPE (Fig. 2B,C). This result clearly supports that the CPE
methods can separate particles from ionic forms in food matrices.
3.3 Validation of Analytical Methods for SiO and TiO in
Food Matrices
Quantitative analytical methods using acid digestion in a microwave system were
validated by calculating recovery (%), linearity (coefficient of determination
values, R), accuracy (relative error, RE), precision (coefficient of
variation, CV), limit of detection (LOD), and limit of quantification (LOQ).
Table 2 shows that the recoveries of pristine SiO and TiO or
SiO- and TiO-spiked powdered sugar or casein were range from 90.18%
to 108.32%. The CV and RE values for all the cases were 0.40%–9.69% and
–9.82% to 8.32%, respectively. Fig. 3 demonstrates a good linearity for
pristine particles and particles-spiked in food matrices. All the results
indicate reliable analytical parameters for SiO and TiO in food
matrices, which is consistent with other previous reports [15, 30, 37, 38].
Table 2.Recovery, coefficient of variation (CV), relative error (RE),
limit of detection (LOD), and limit of quantification (LOQ) of quantitative
analytical procedure for food additive SiO and TiO.
| Samples |
Validation parameters |
Concentrations (g/mL) |
| 0.5 |
1 |
5 |
10 |
| Pristine |
SiO |
Recovery (%) |
98.63 1.77 |
92.61 1.06 |
90.18 3.10 |
91.38 0.77 |
| CV (%) |
1.80 |
1.14 |
3.43 |
0.84 |
| RE (%) |
–1.37 |
–7.39 |
–9.82 |
–8.62 |
| LOD (g/mL) |
0.04 |
| LOQ (g/mL) |
0.11 |
| TiO |
Recovery (%) |
96.26 1.47 |
93.53 1.33 |
96.58 0.38 |
95.38 1.02 |
| CV (%) |
1.53 |
1.43 |
0.40 |
1.07 |
| RE (%) |
–3.74 |
–6.47 |
–3.42 |
–4.62 |
| LOD (g/mL) |
0.01 |
| LOQ (g/mL) |
0.03 |
| Powdered sugar |
SiO |
Recovery (%) |
107.54 8.33 |
105.94 10.27 |
108.32 2.66 |
101.16 5.90 |
| CV (%) |
7.74 |
9.69 |
2.45 |
5.83 |
| RE (%) |
7.54 |
5.94 |
8.32 |
1.16 |
| LOD (g/mL) |
0.10 |
| LOQ (g/mL) |
0.30 |
| TiO |
Recovery (%) |
93.58 0.62 |
99.71 1.47 |
102.61 1.55 |
103.98 2.81 |
| CV (%) |
0.67 |
1.48 |
1.51 |
2.70 |
| RE (%) |
–6.42 |
–0.29 |
2.61 |
3.98 |
| LOD (g/mL) |
0.06 |
| LOQ (g/mL) |
0.18 |
| Casein |
SiO |
Recovery (%) |
97.63 6.92 |
105.32 4.36 |
105.71 1.64 |
106.43 1.23 |
| CV (%) |
7.09 |
4.14 |
1.56 |
1.16 |
| RE (%) |
–2.37 |
5.32 |
5.71 |
6.43 |
| LOD (g/mL) |
0.03 |
| LOQ (g/mL) |
0.10 |
| TiO |
Recovery (%) |
96.95 0.98 |
100.61 1.53 |
100.02 2.33 |
104.49 4.89 |
| CV (%) |
1.01 |
1.52 |
2.33 |
4.68 |
| RE (%) |
–3.05 |
0.61 |
0.02 |
4.49 |
| LOD (g/mL) |
0.13 |
| LOQ (g/mL) |
0.38 |
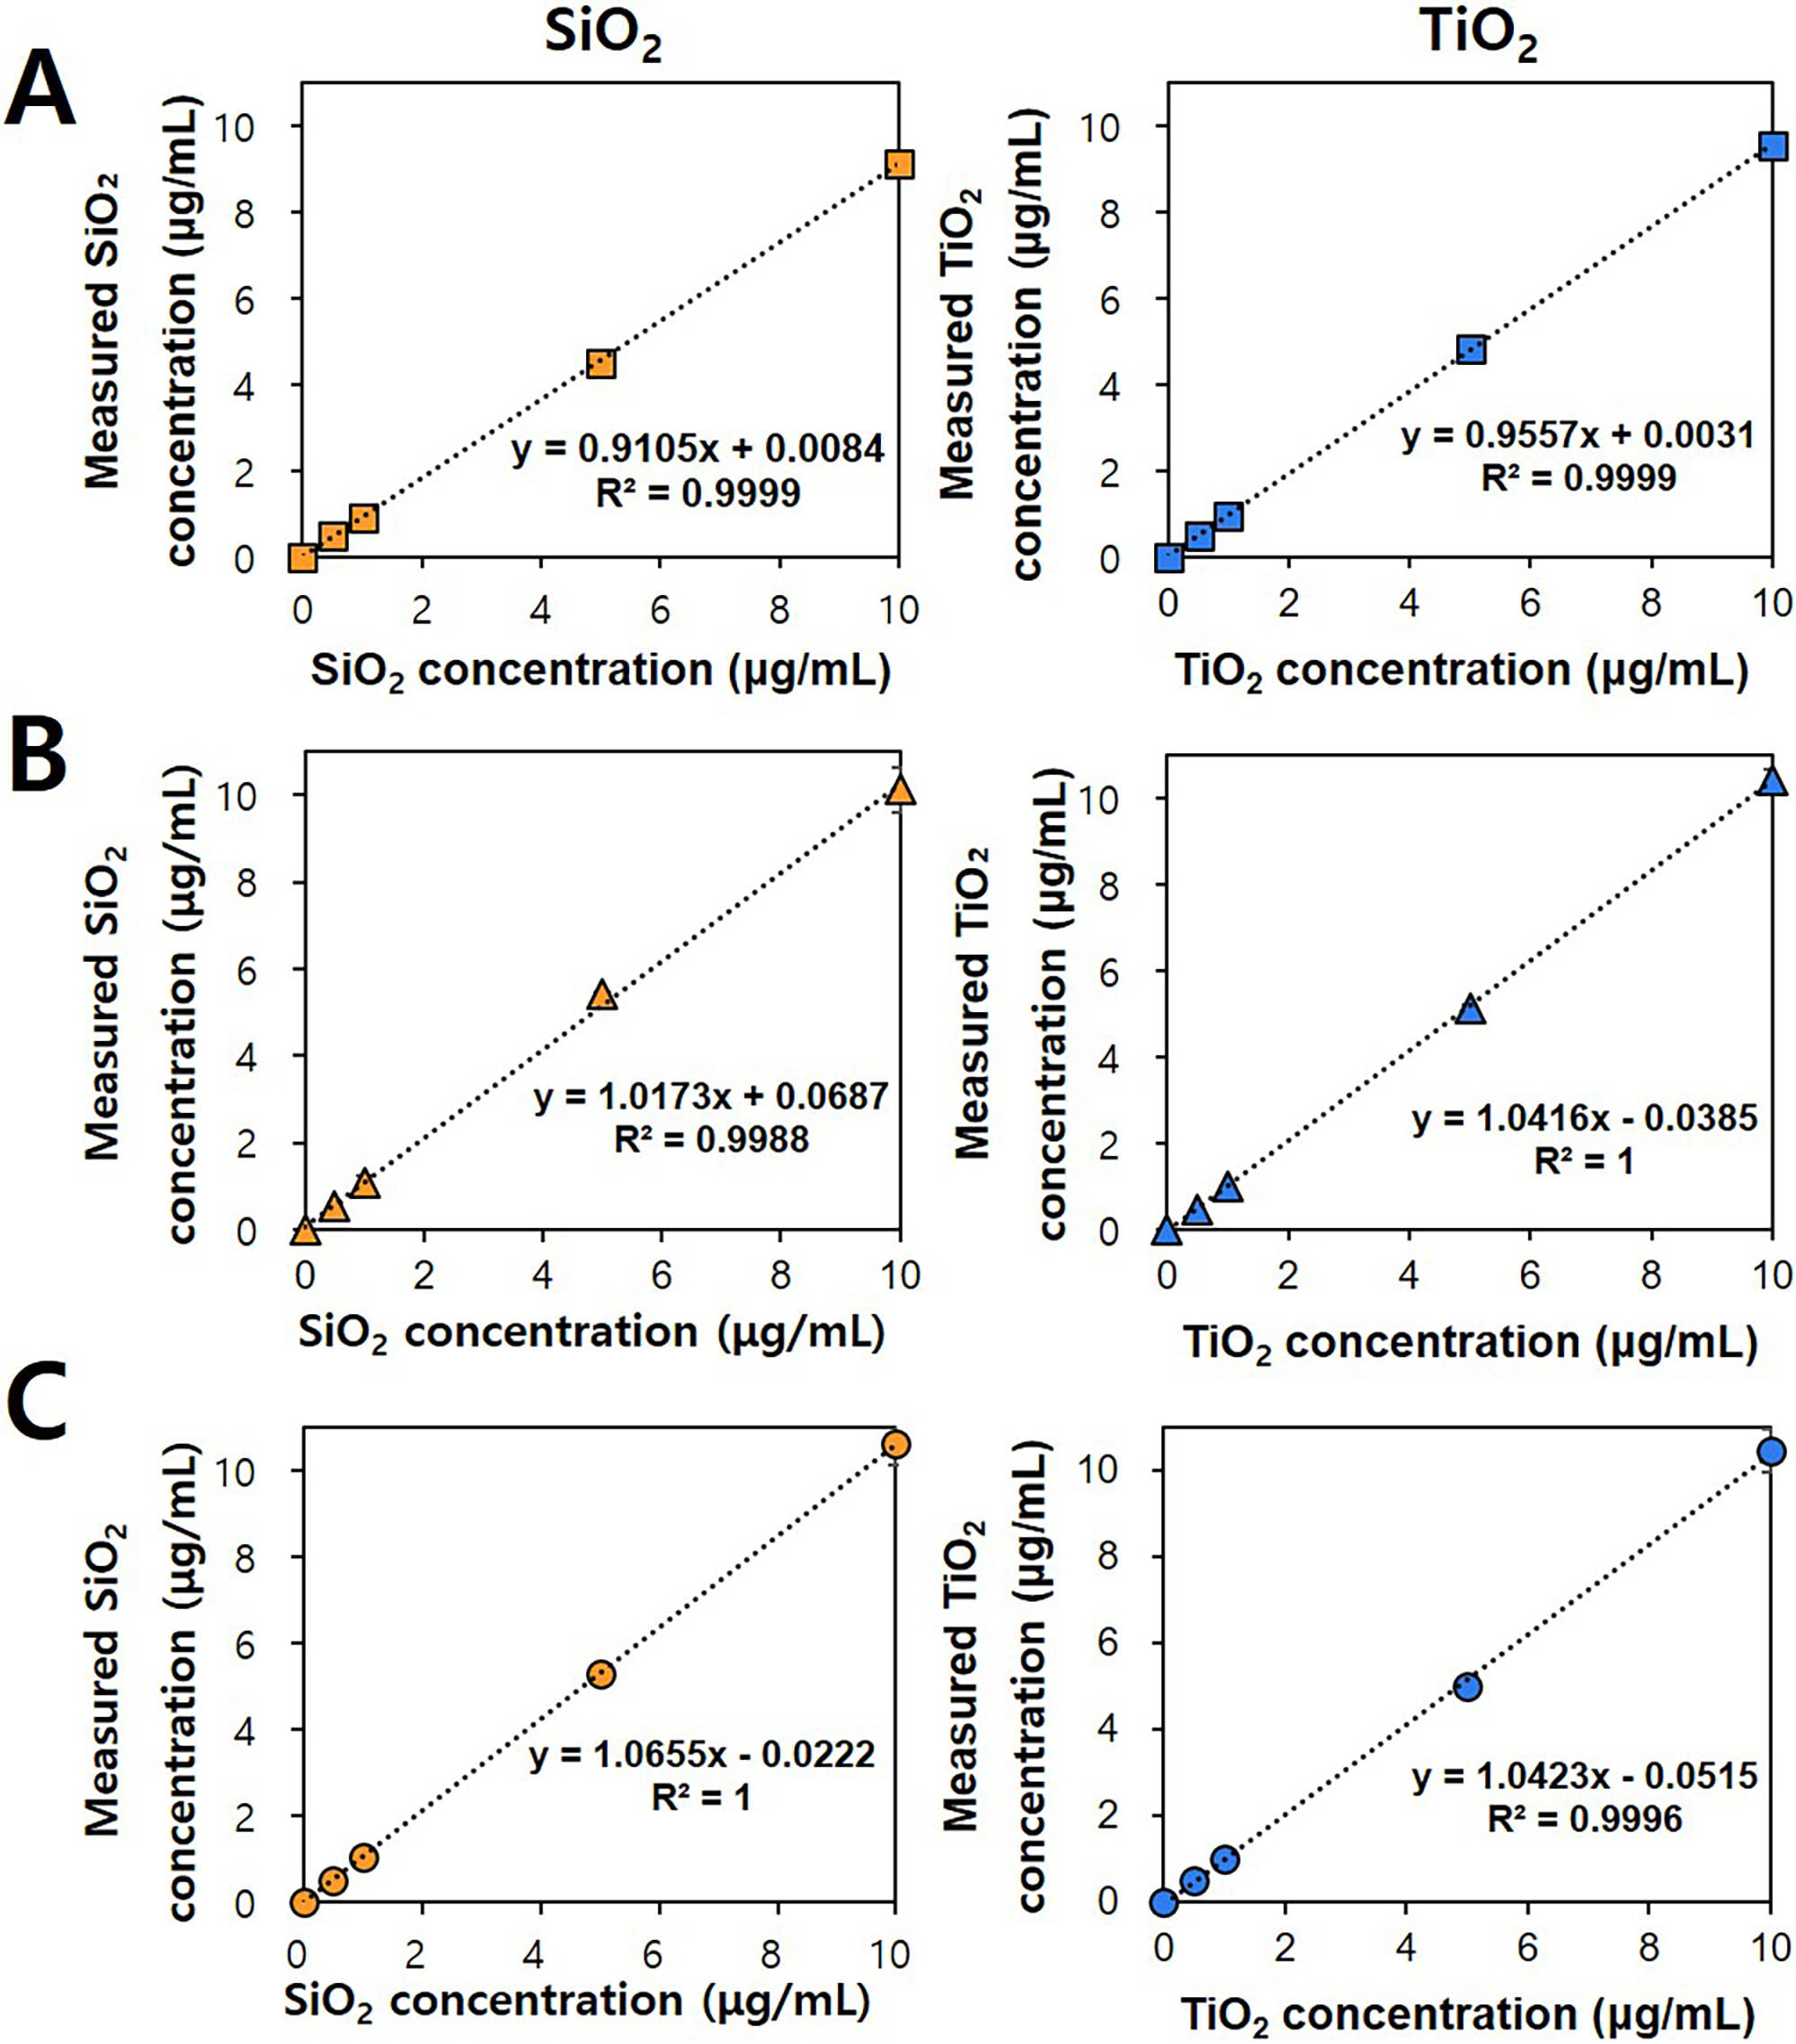 Fig. 3.
Quantitative analysis of SiO and TiO. Standard curves for (A)
pristine food additive SiO and TiO, (B) powdered sugar spiked with
SiO or TiO, and (C) casein spiked with SiO or TiO
obtained by acid digestion in a microwave system, followed by inductively coupled
plasma-atomic emission spectroscopy (ICP-AES) analysis.
On the other hand, the LOD and LOQ values were 0.03–0.10 g/mL and
0.10–0.30 g/mL for SiO, and 0.01–0.13 g/mL and 0.03–0.38
g/mL for TiO, respectively. These are similar or lower values
compared with those obtained by other results, showing that the LOD and LOQ were
0.07 g/g and 0.20 g/g for SiO, and 0.03–0.34 g/mL and
0.09–1.04 g/mL for TiO, respectively [15, 31]. Sensitively low LOQ
and LOD values were obtained, suggesting that the analytical methods by acid
digestion in a microwave system are effective and reliable.
3.4 Separation of SiO and TiO from Commercial Foods and
Their Fate Determination
The CPE methods were applied to eight commercial products available on the
market indicating SiO or TiO as a food additive on product labelling.
Fig. 4 shows that 90.9%–101.8% of SiO were present as particle forms,
only 0.02%–7.3% ionized forms were detected. When total recovery percentage
(91.3%–108.3%) of both SiO particles and Si ions from products was
considered, about 93.5%–99.9% of added SiO were found as intact
particles. In case of TiO, particle forms were detected in the range of
92.4% to 105.9%, whereas ionic forms were only found at 0.1%–0.9% (Fig. 5).
Based on total recovery (93.3%–106.3%) of both TiO particles and Ti
ions, about 99.1%–99.9% of added TiO were detected as intact particle
forms. The results demonstrate that most of food additive SiO and TiO
are not degraded and present as particles, and these two additives have low
solubility in food matrices. When detected ionic forms were compared, higher Si
ions than Ti ions were found, probably indicating high solubility of the former
than the latter. Indeed, it was reported that the solubility of SiO was
higher than TiO [4, 39, 40], which is in good agreement with our results.
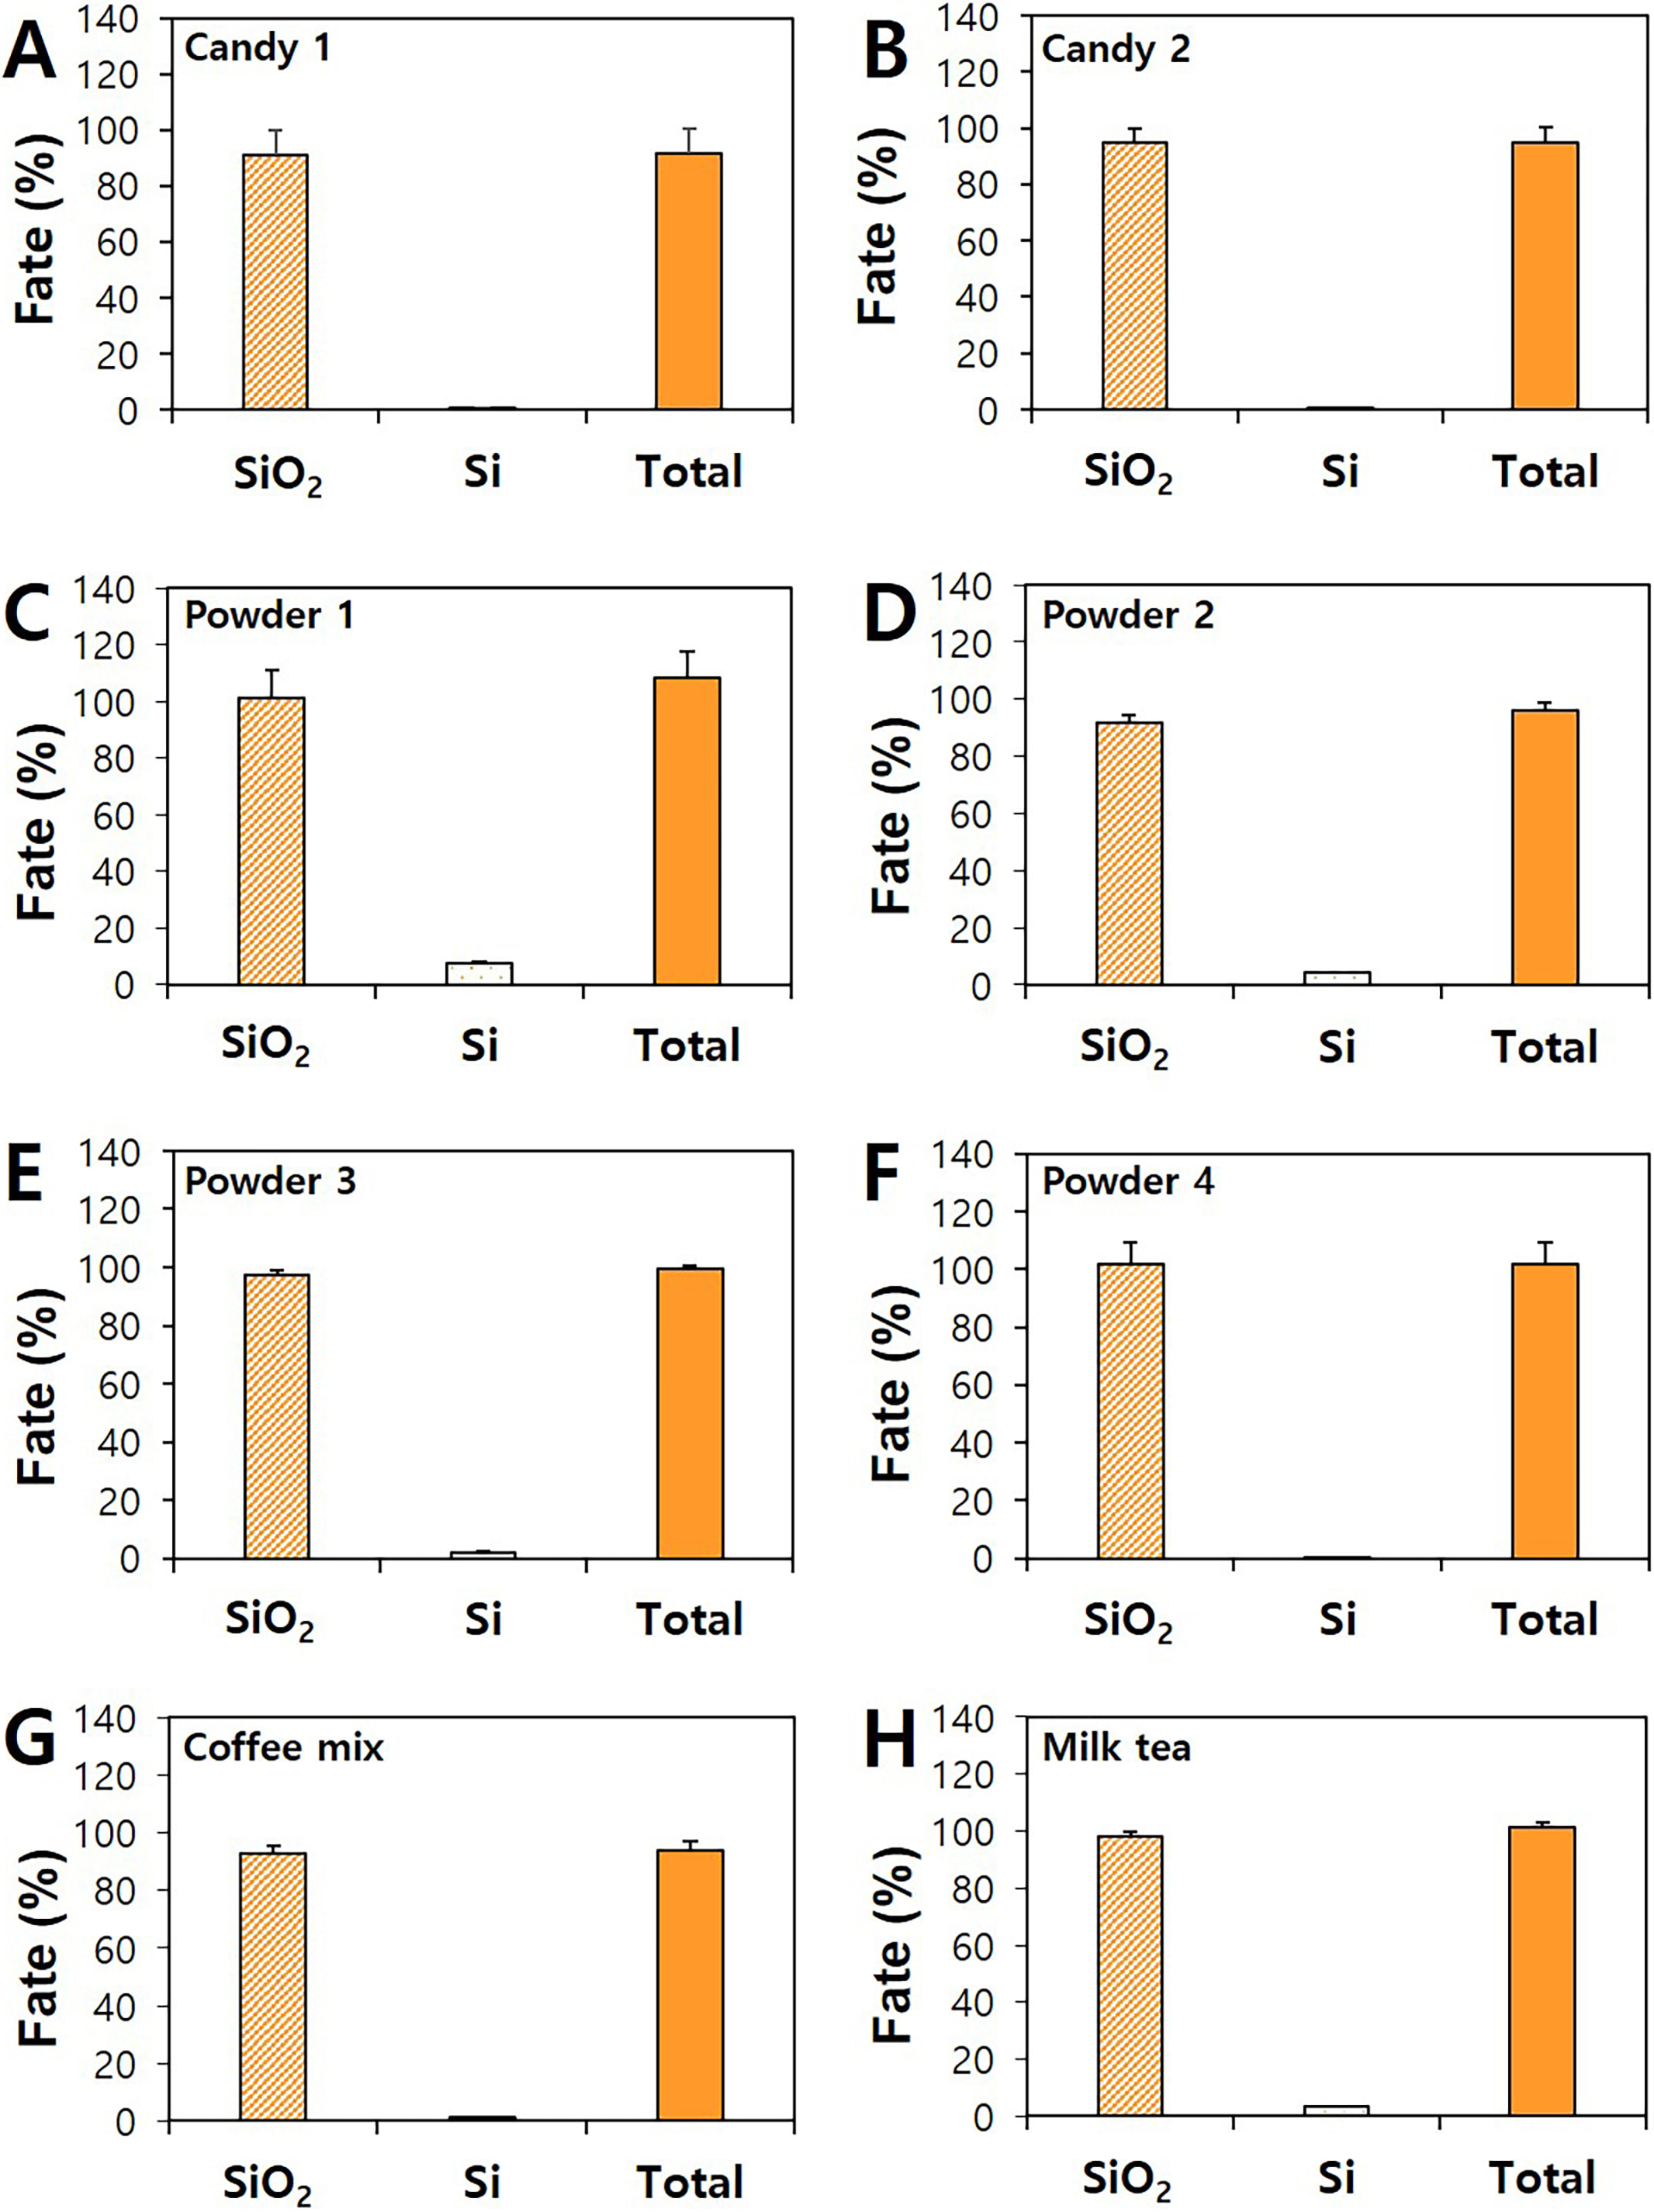 Fig. 4.
Particle or ionic fates and total recoveries of SiO in
commercial foods by CPE. Particle or ionic fates and total recoveries of
SiO in commercial (A) candy 1, (B) candy 2, (C) powder 1, (D) powder 2, (E)
powder 3, (F) powder 4, (G) coffee mix, and (H) milk tea by CPE.
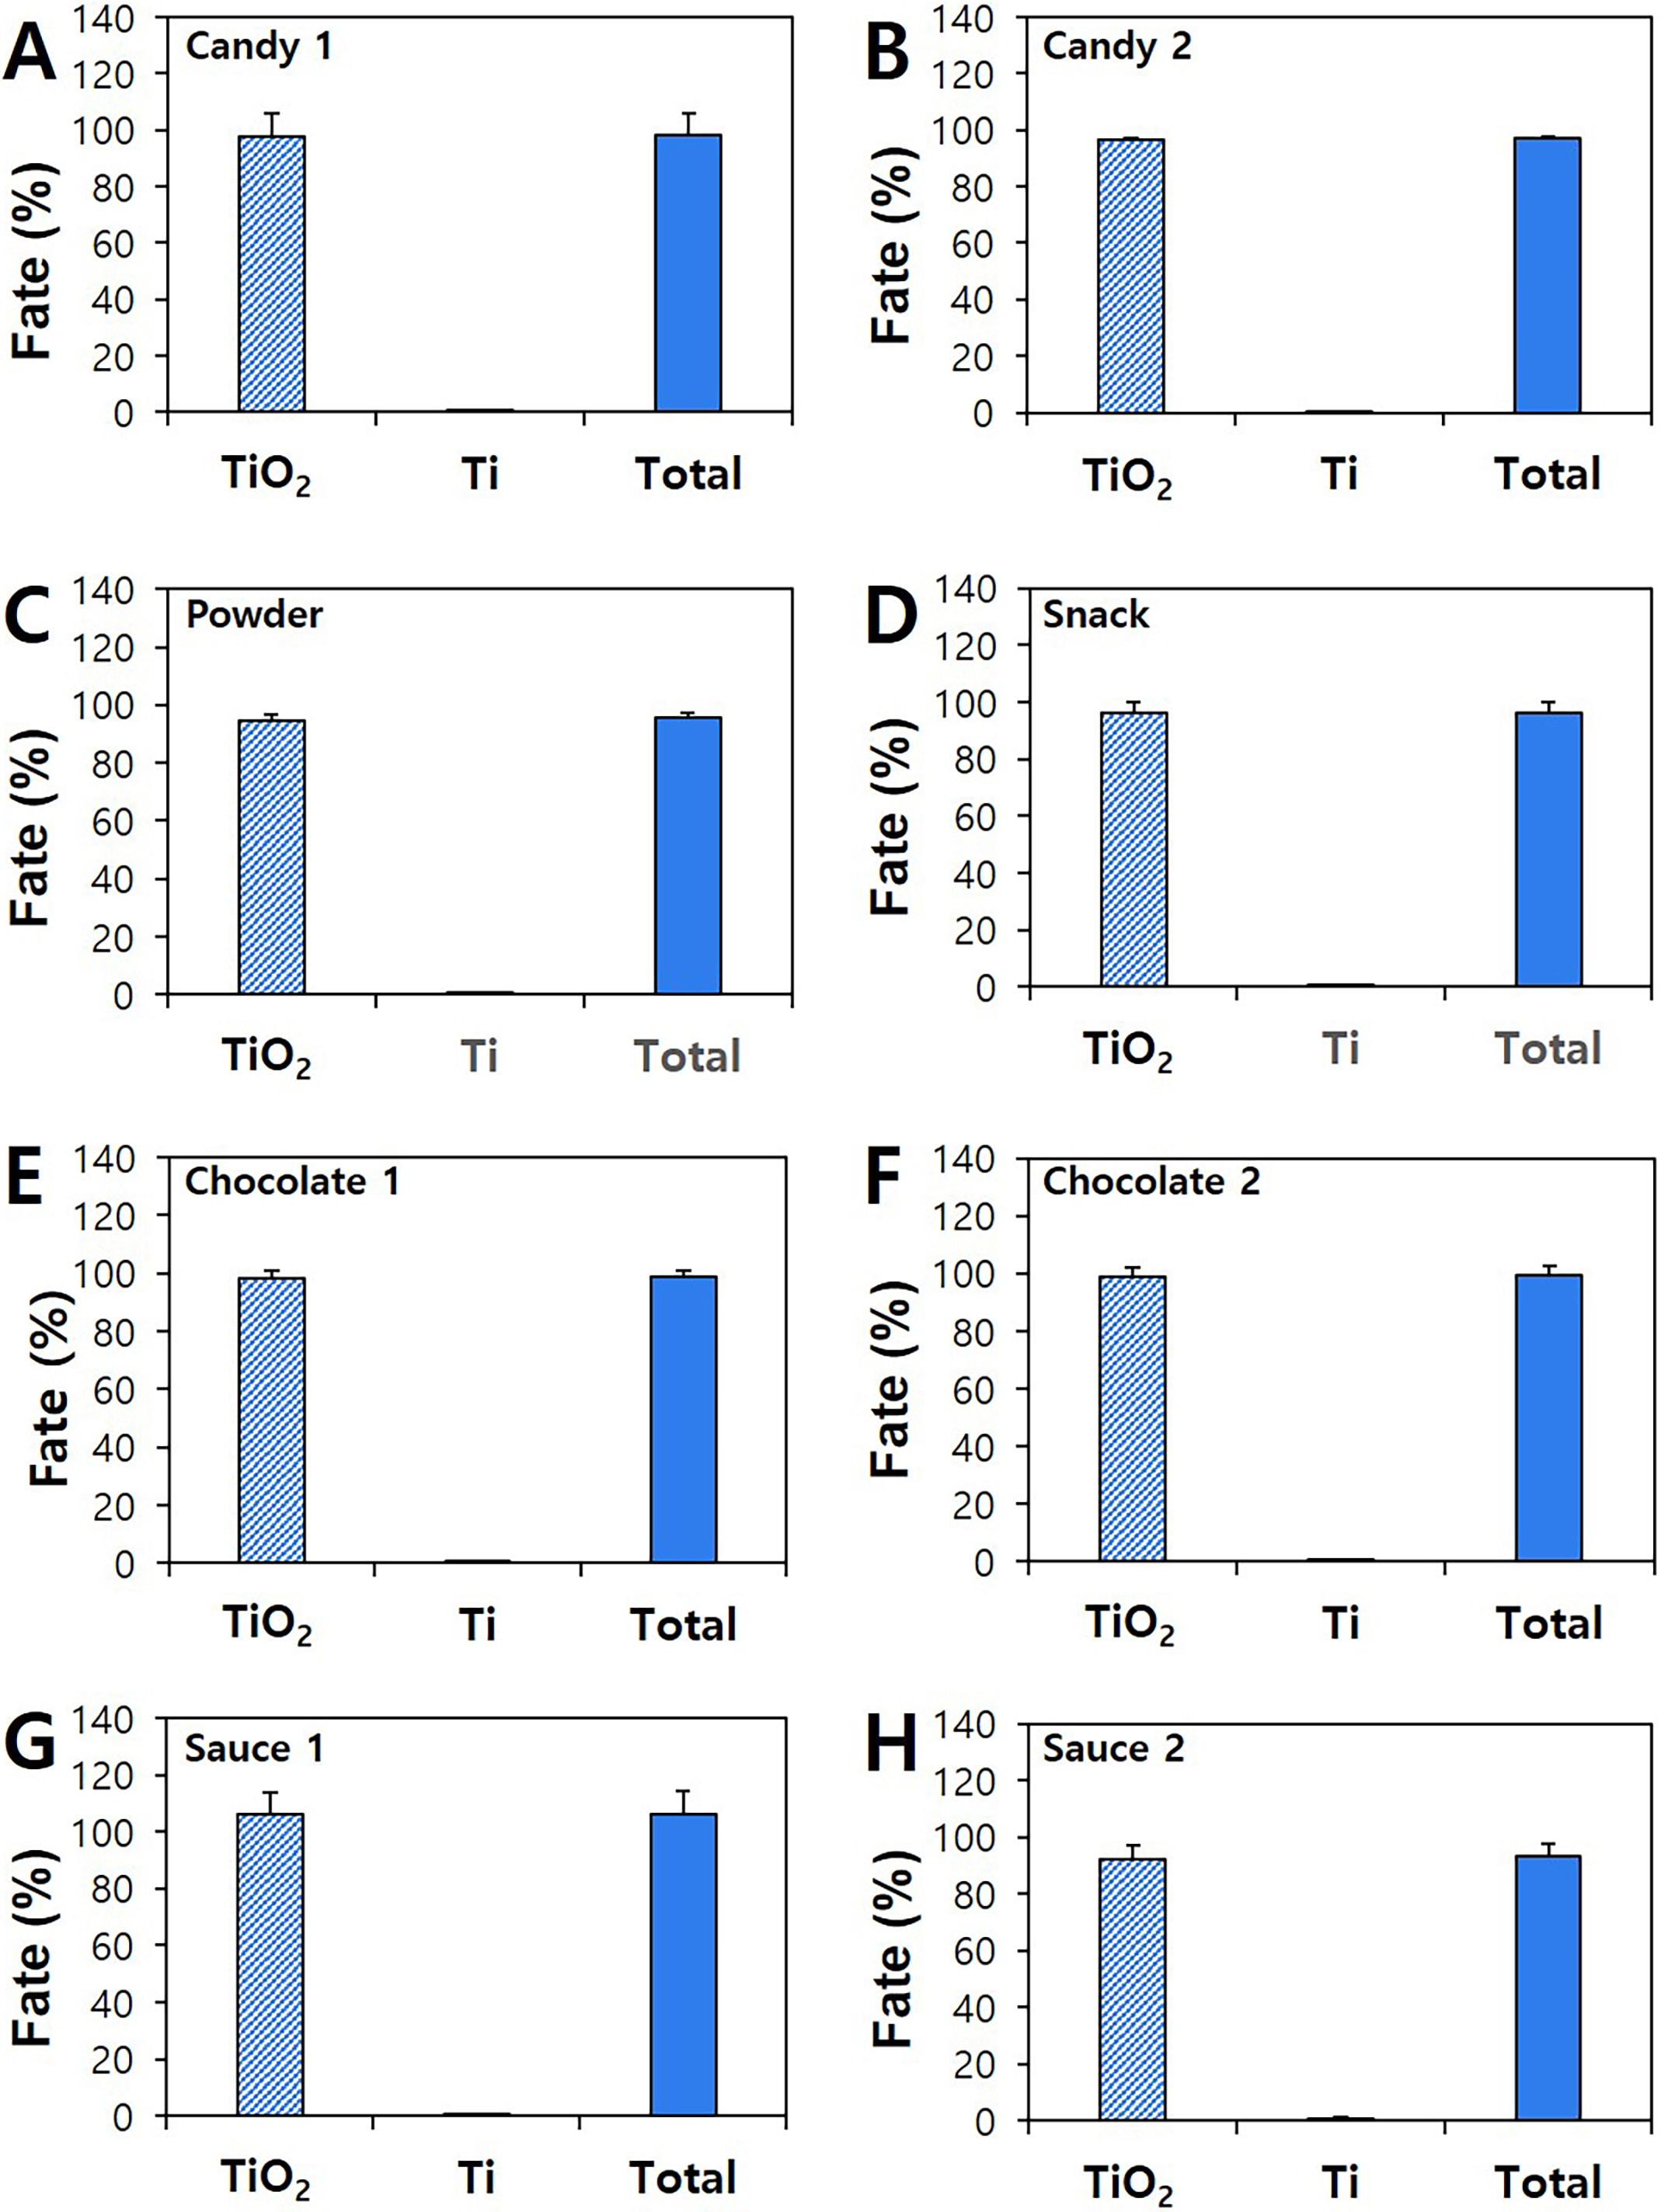 Fig. 5.
Particle or ionic fates and total recoveries of TiO in
commercial foods by CPE. Particle or ionic fates and total recoveries of
TiO in commercial (A) candy 1, (B) candy 2, (C) powder, (D) snack, (E)
chocolate 1, (F) chocolate 2, (G) sauce 1, and (H) sauce 2 by CPE.
Dissolution property of SiO and TiO was further evaluated by spiking
known amount of pristine SiO and TiO in commercial food matrices, the
same products where the CPEs were applied (Figs. 4,5). As shown in Fig. 6A,B, the
solubilities of SiO were ranged from 0.1% to 5.5%, whereas TiO had
0.1%–0.9% solubilities depending on the matrix type. Overall results indicate
that the solubility of two additives was low in commercial complex food matrices,
but SiO has high solubility than TiO, which is in good agreement with
previous report [4, 5]. It is worth noting that no significant differences
between solubility (Fig. 6) and ionic fate (Figs. 4,5) were found in the same
products (p 0.05), indicating that the solubility critically affects
the fates of two additives in foods. The results support reliable fate
determination of SiO and TiO in commercial foods by CPE, and also
suggest that major fates of SiO and TiO are particle forms in
commercial processed products. Relatively high solubility of SiO in powder
1, powder 2, and milk tea seems to be related to its matrix interactions because
their pH values were neutral (pH ~7.0). Indeed, the interactions
between food additive SiO and food matrices were demonstrated, although the
interactions seem to be not strong [3, 6, 13]. Quantitative analysis revealed
that saccharides, proteins, fatty acids, and minerals can be adsorbed on the
surface of SiO [13]. Hence, the adsorption of food matrices on SiO
may increase its solubility in commercial food products. Meanwhile, the
interaction between TiO and food matrices is likely to be negligible based
on its extremely low solubility (Fig. 6B) and minor ionic fates (Fig. 5).
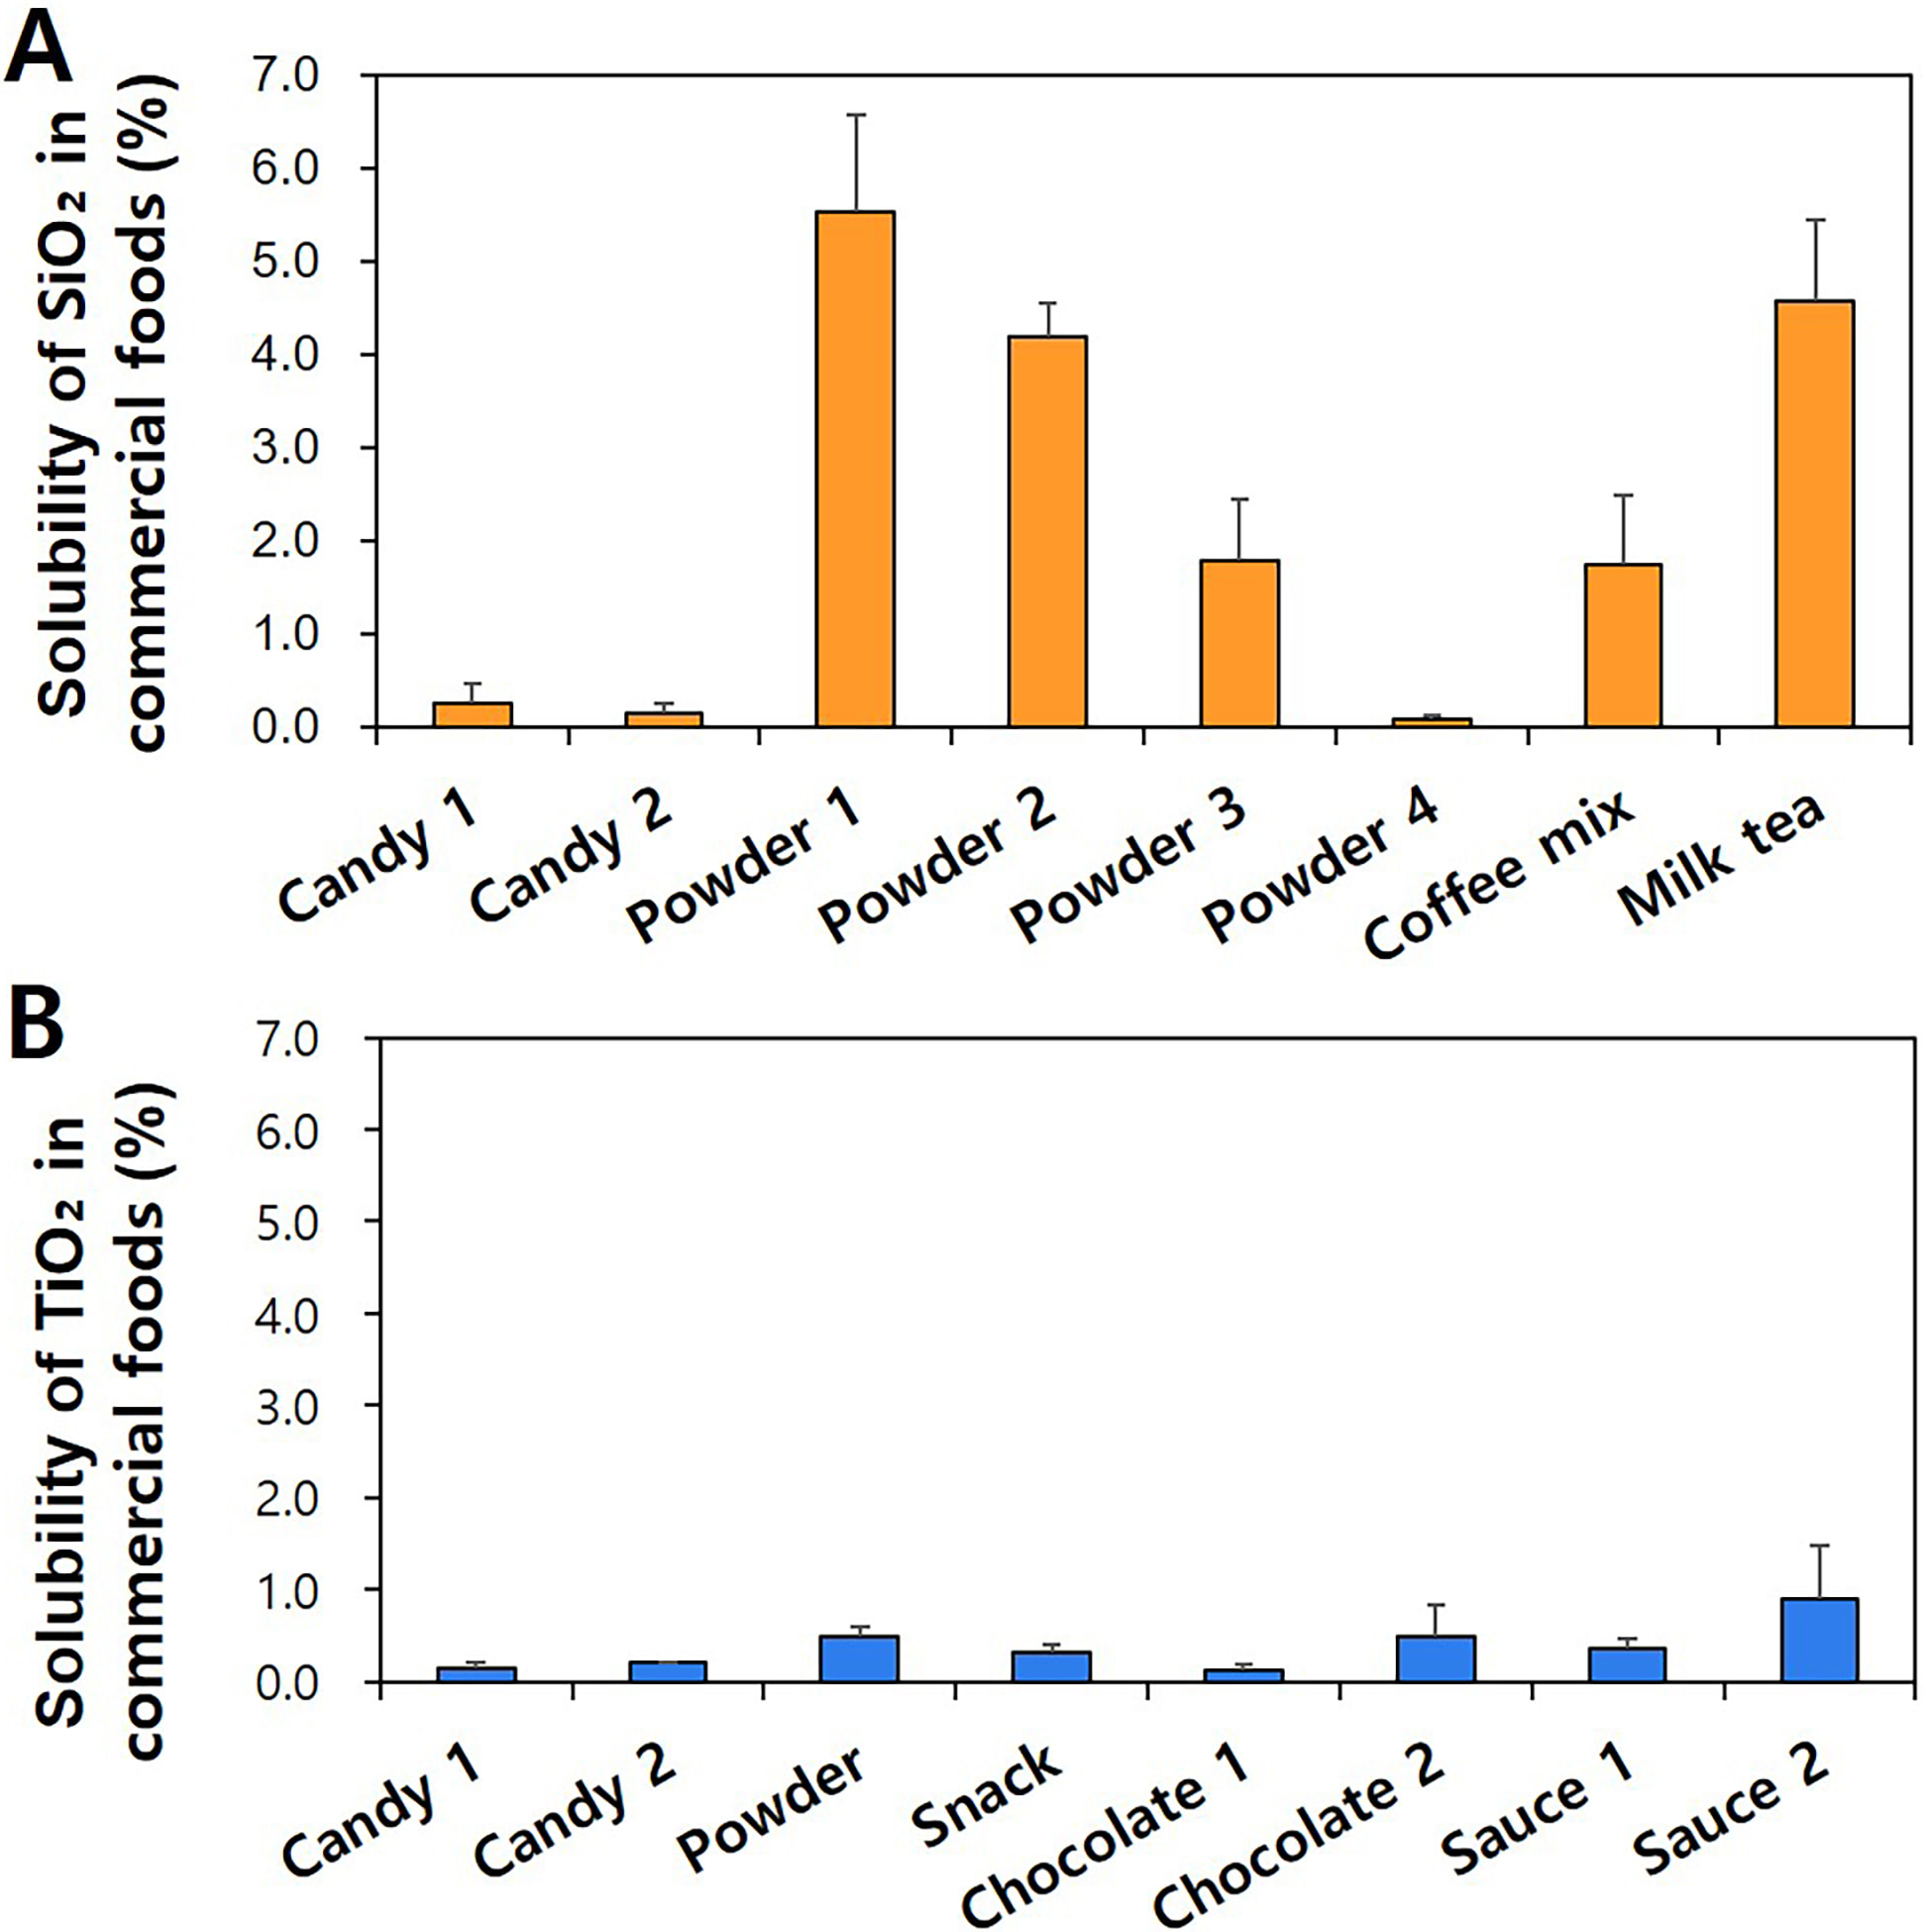 Fig. 6.
Dissolution properties of (A) SiO and (B) TiO in
commercial foods.
3.5 Characterization of Separated SiO and TiO from
Commercial Foods
Physico-chemical characterization of separated and recovered SiO and
TiO from commercial food products by CPE was further carried out. The
constituent particle sizes and size distributions were analyzed by TEM. Fig. 7A,B and Fig. 8A,B show that the constituent particle sizes of separated SiO and
TiO were ranged from 12 3 nm to 21 4 nm and from 112
30 nm to 132 37 nm, respectively, without significant differences
from pristine SiO (14 4 nm) and TiO (109 35 nm)
(p 0.05). No remarkable aggregate formation or decomposed form was
observed. The TEM-EDS analysis clearly reveals the presence of Si or Ti ions in
the particles observed (Figs. 7C,8C). The results confirm that food additive
SiO and TiO are primarily present as particles without degradation or
aggregation.
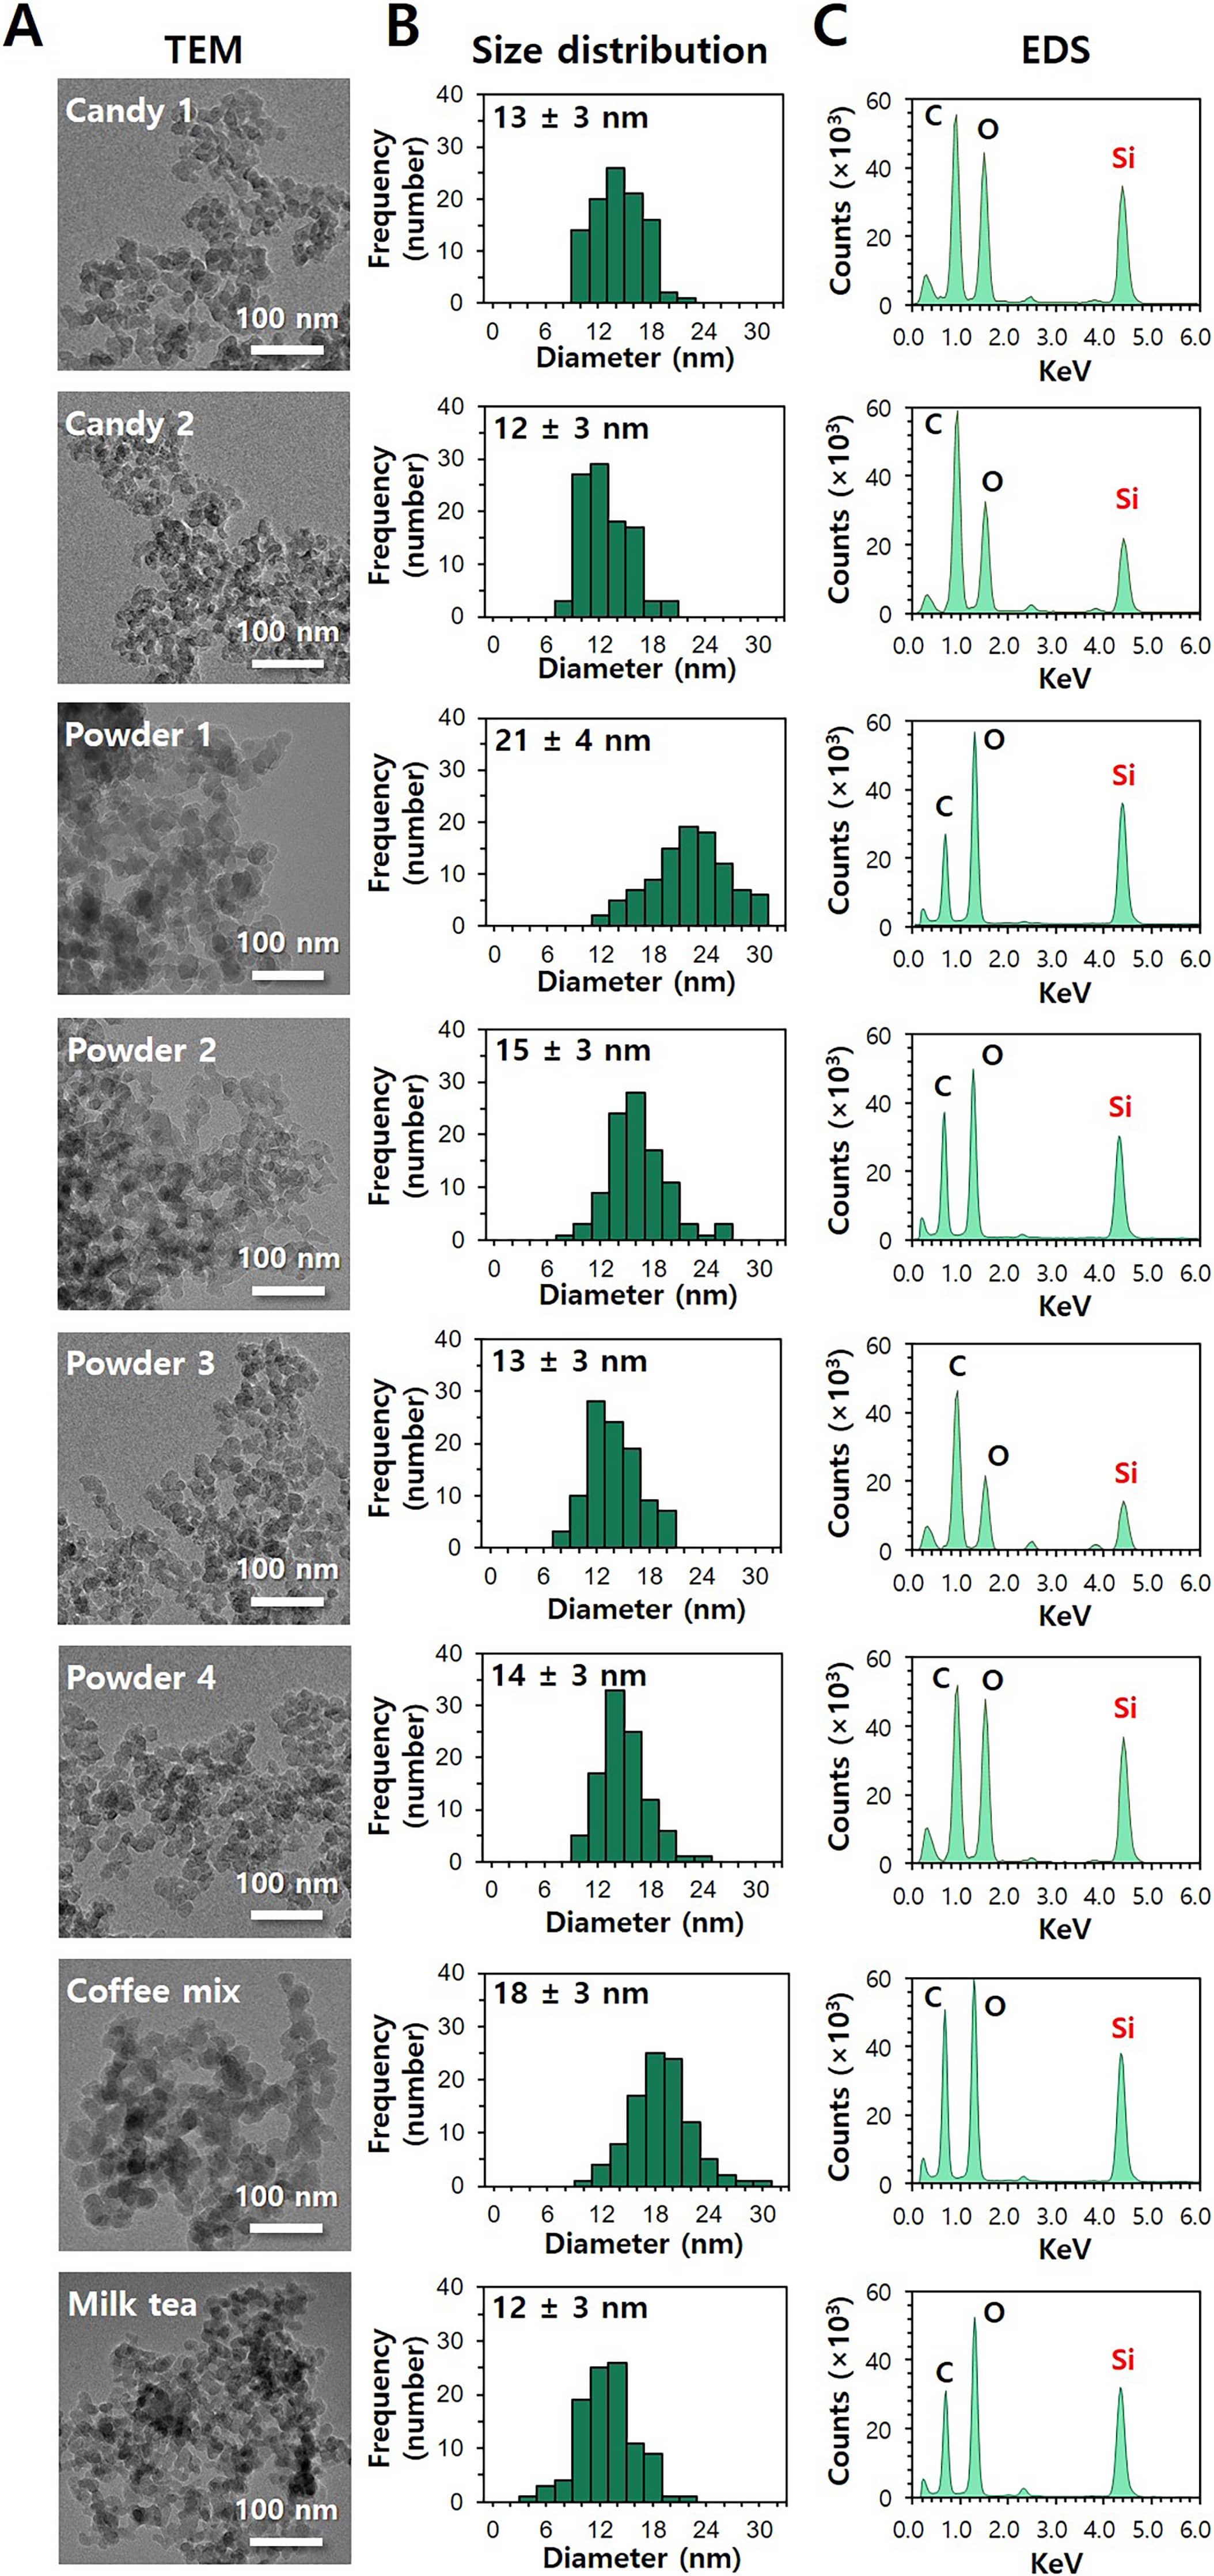 Fig. 7.
Characterization of separated SiO from commercial foods. (A)
Transmission electron microscopy (TEM) images, (B) size distribution obtained by
the TEM images, and (C) energy dispersive X-ray spectroscopy (EDS) of separated
SiO from commercial foods.
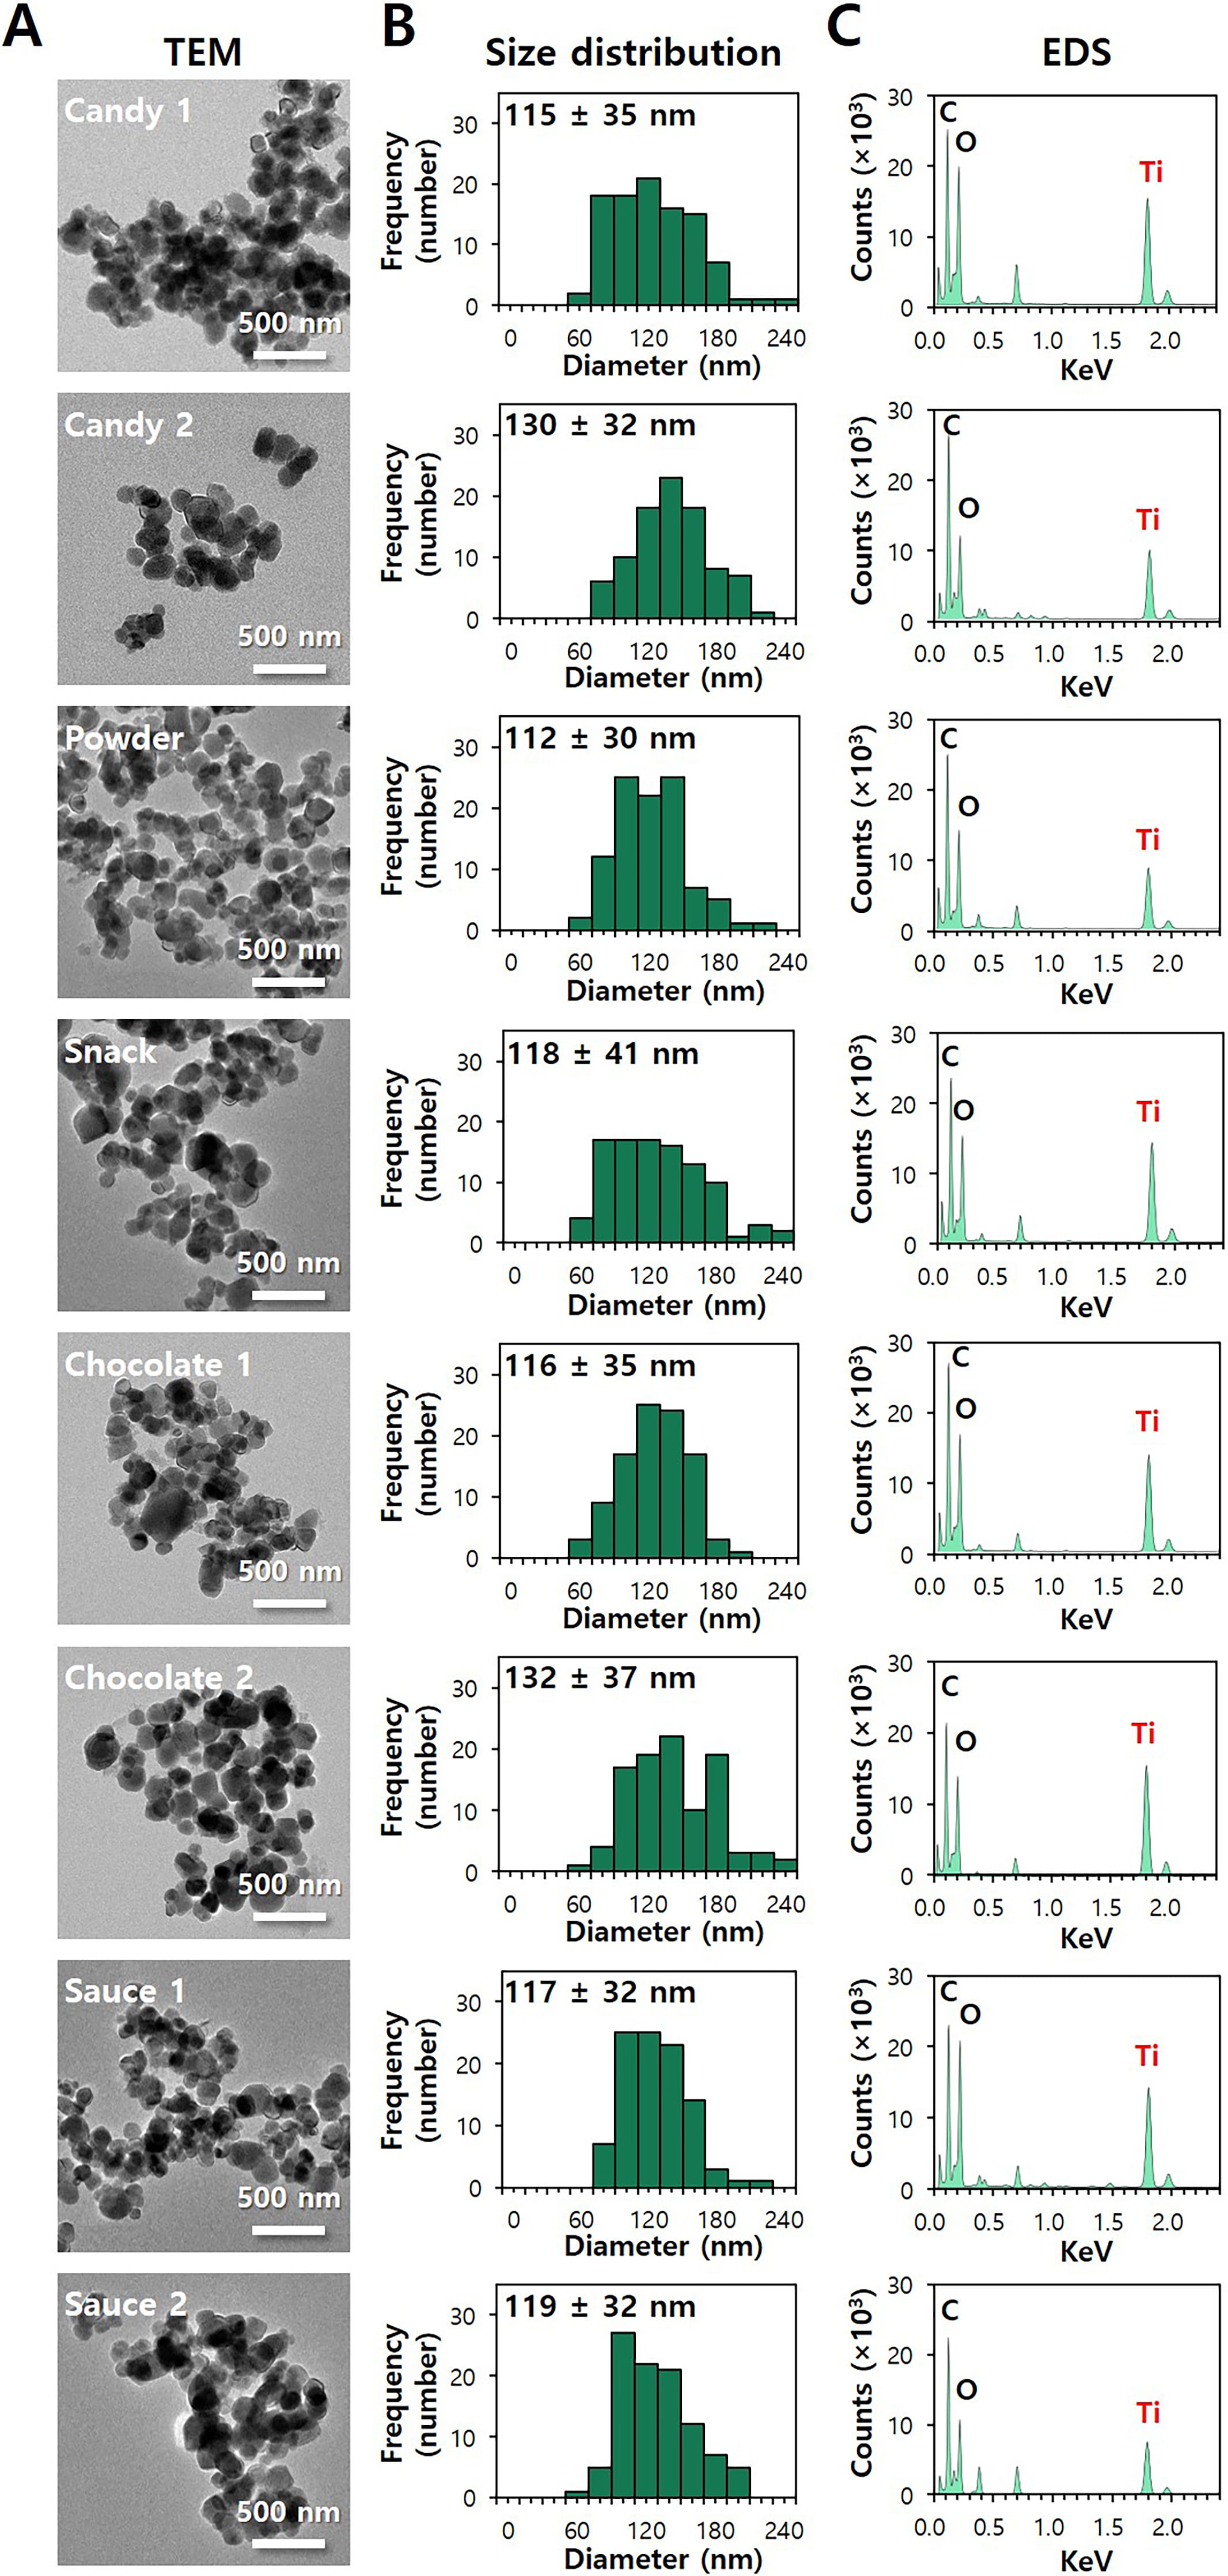 Fig. 8.
Characterization of separated TiO from commercial foods. (A)
Transmission electron microscopy (TEM) images, (B) size distribution obtained by
the TEM images, and (C) energy dispersive X-ray spectroscopy (EDS) of separated
TiO from commercial foods.
The crystalline phases of separated SiO and TiO from commercial
foods were analyzed by XRD patterns. The results indicate that pristine SiO
and TiO have typical amorphous and anatase phases, respectively, and the
same crystalline phases were observed in separated SiO and TiO
particles from commercial foods (Figs. 9,10). It should be noted that amorphous
SiO and anatase TiO are authorized as food additives [3, 23]. All the
results imply that food additive SiO and TiO are present as intact
particle forms without changes in crystalline phase and constituent particle
size.
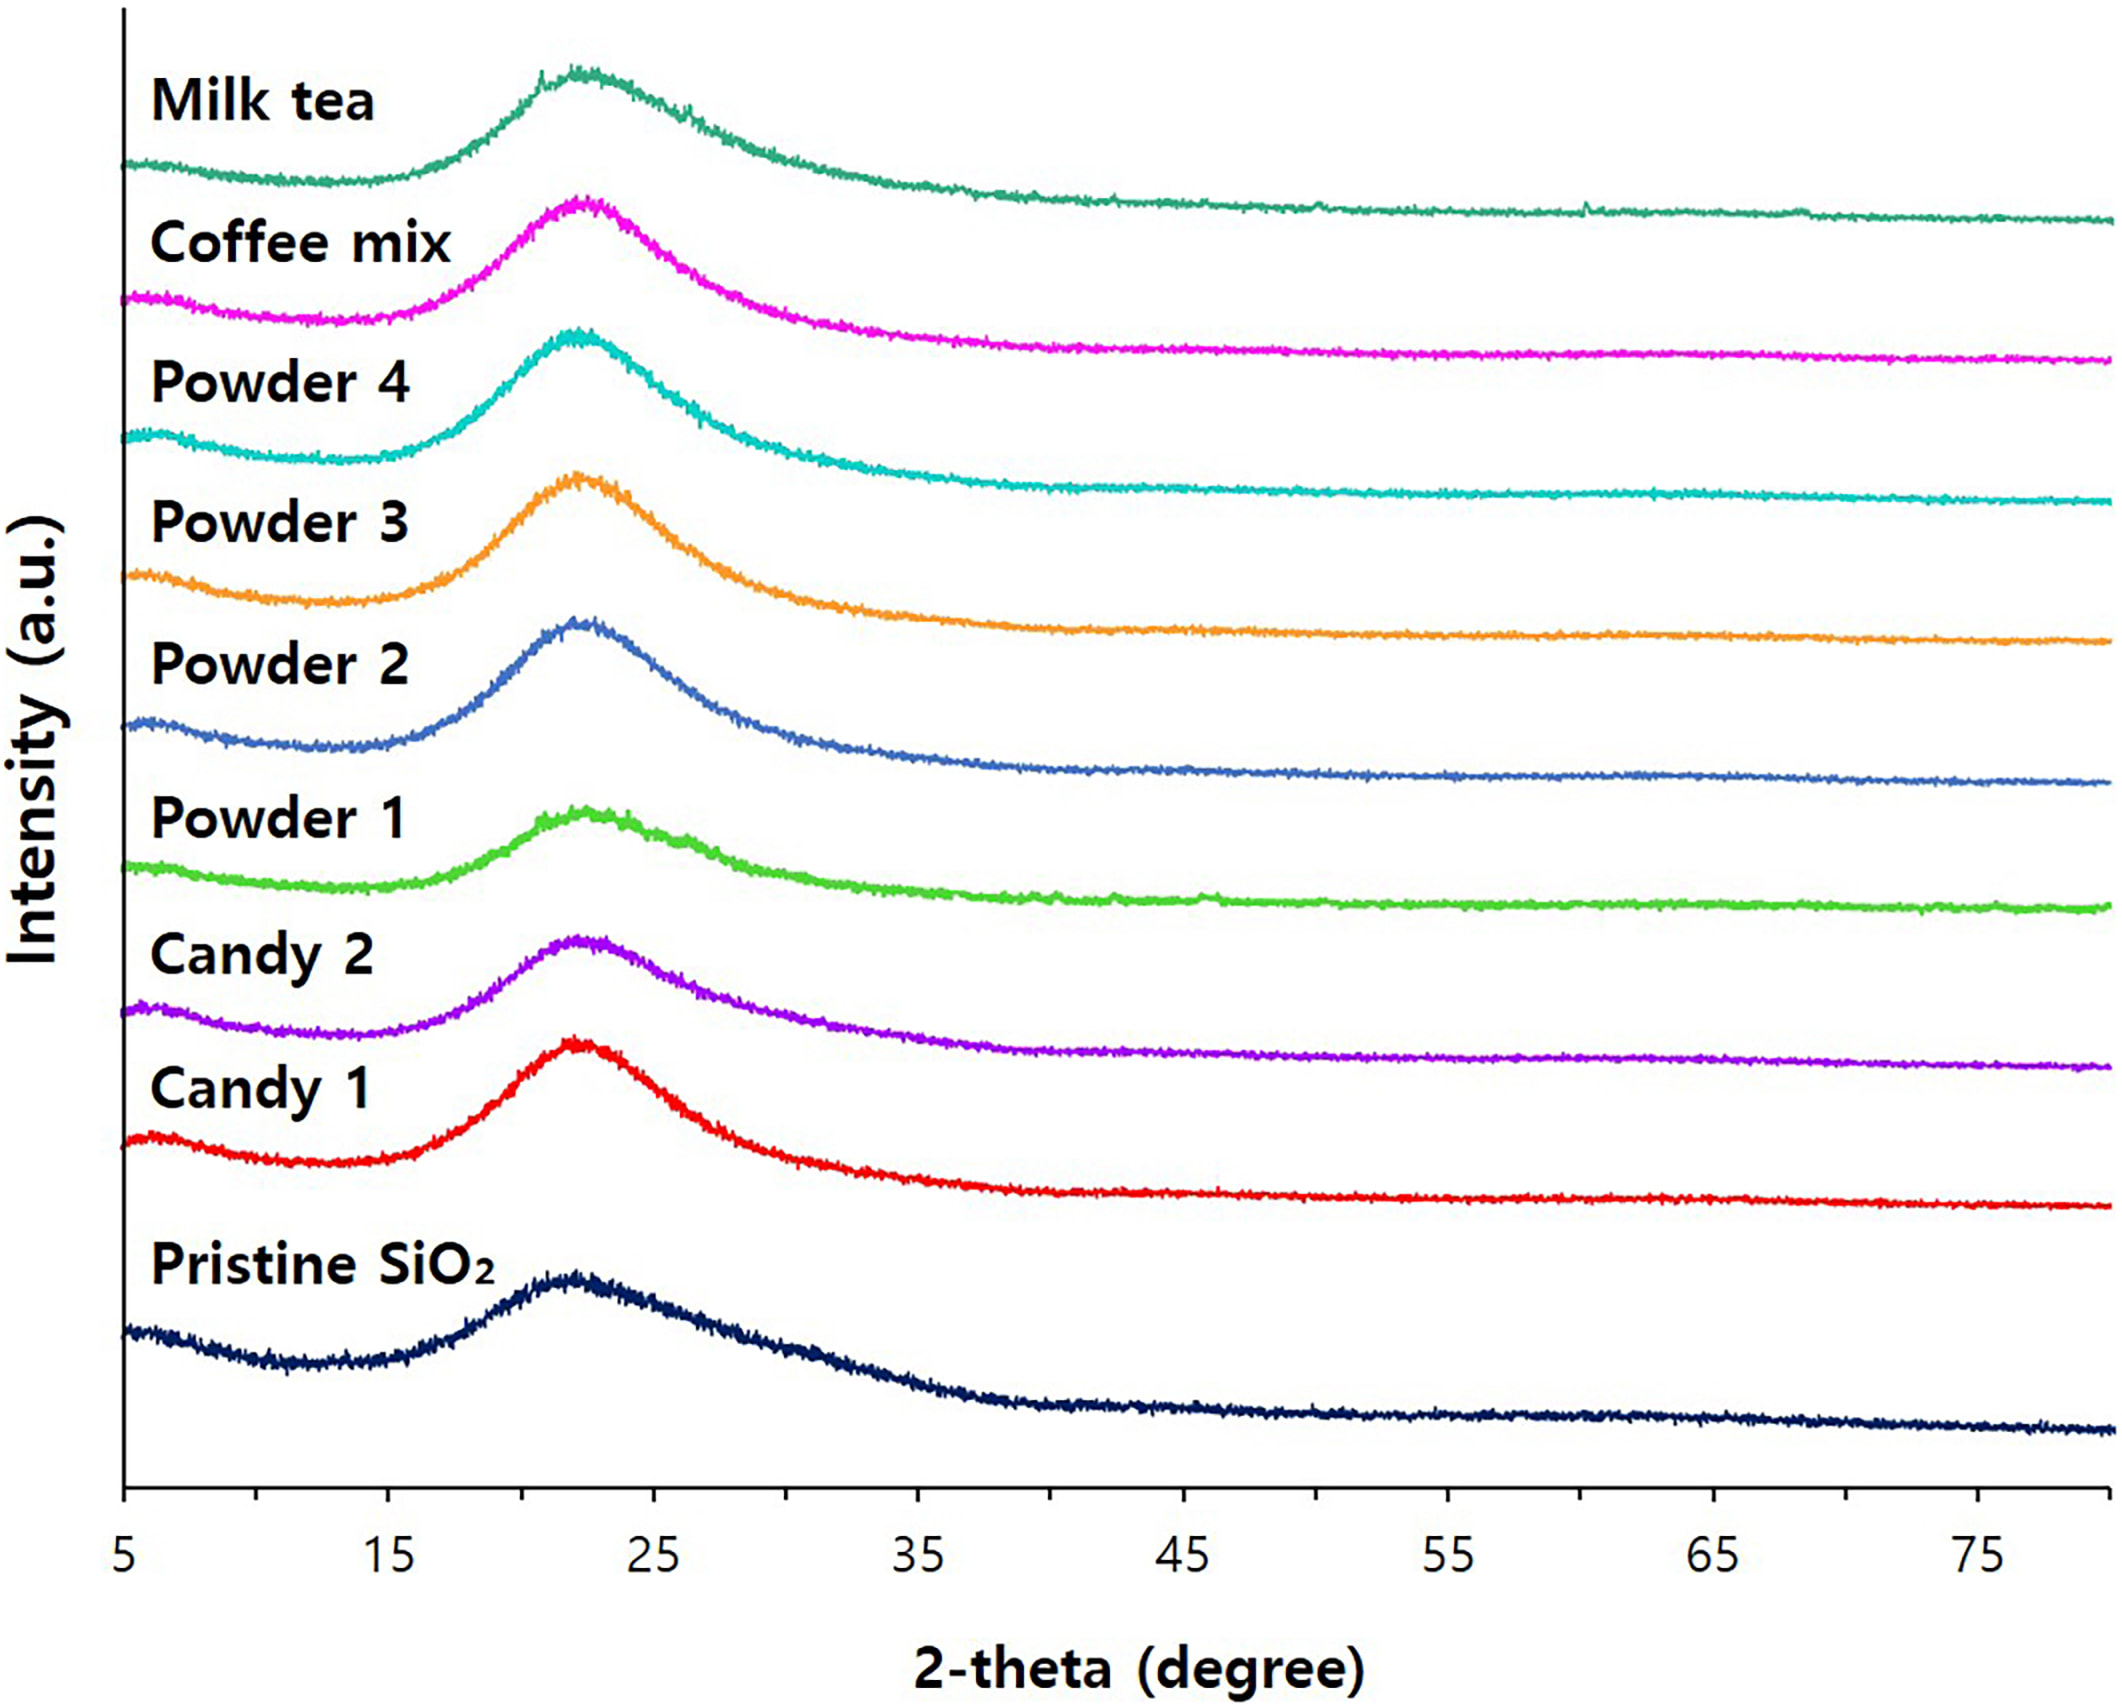 Fig. 9.
X-ray diffraction (XRD) patterns of pristine food additive
SiO and separated SiO from commercial foods.
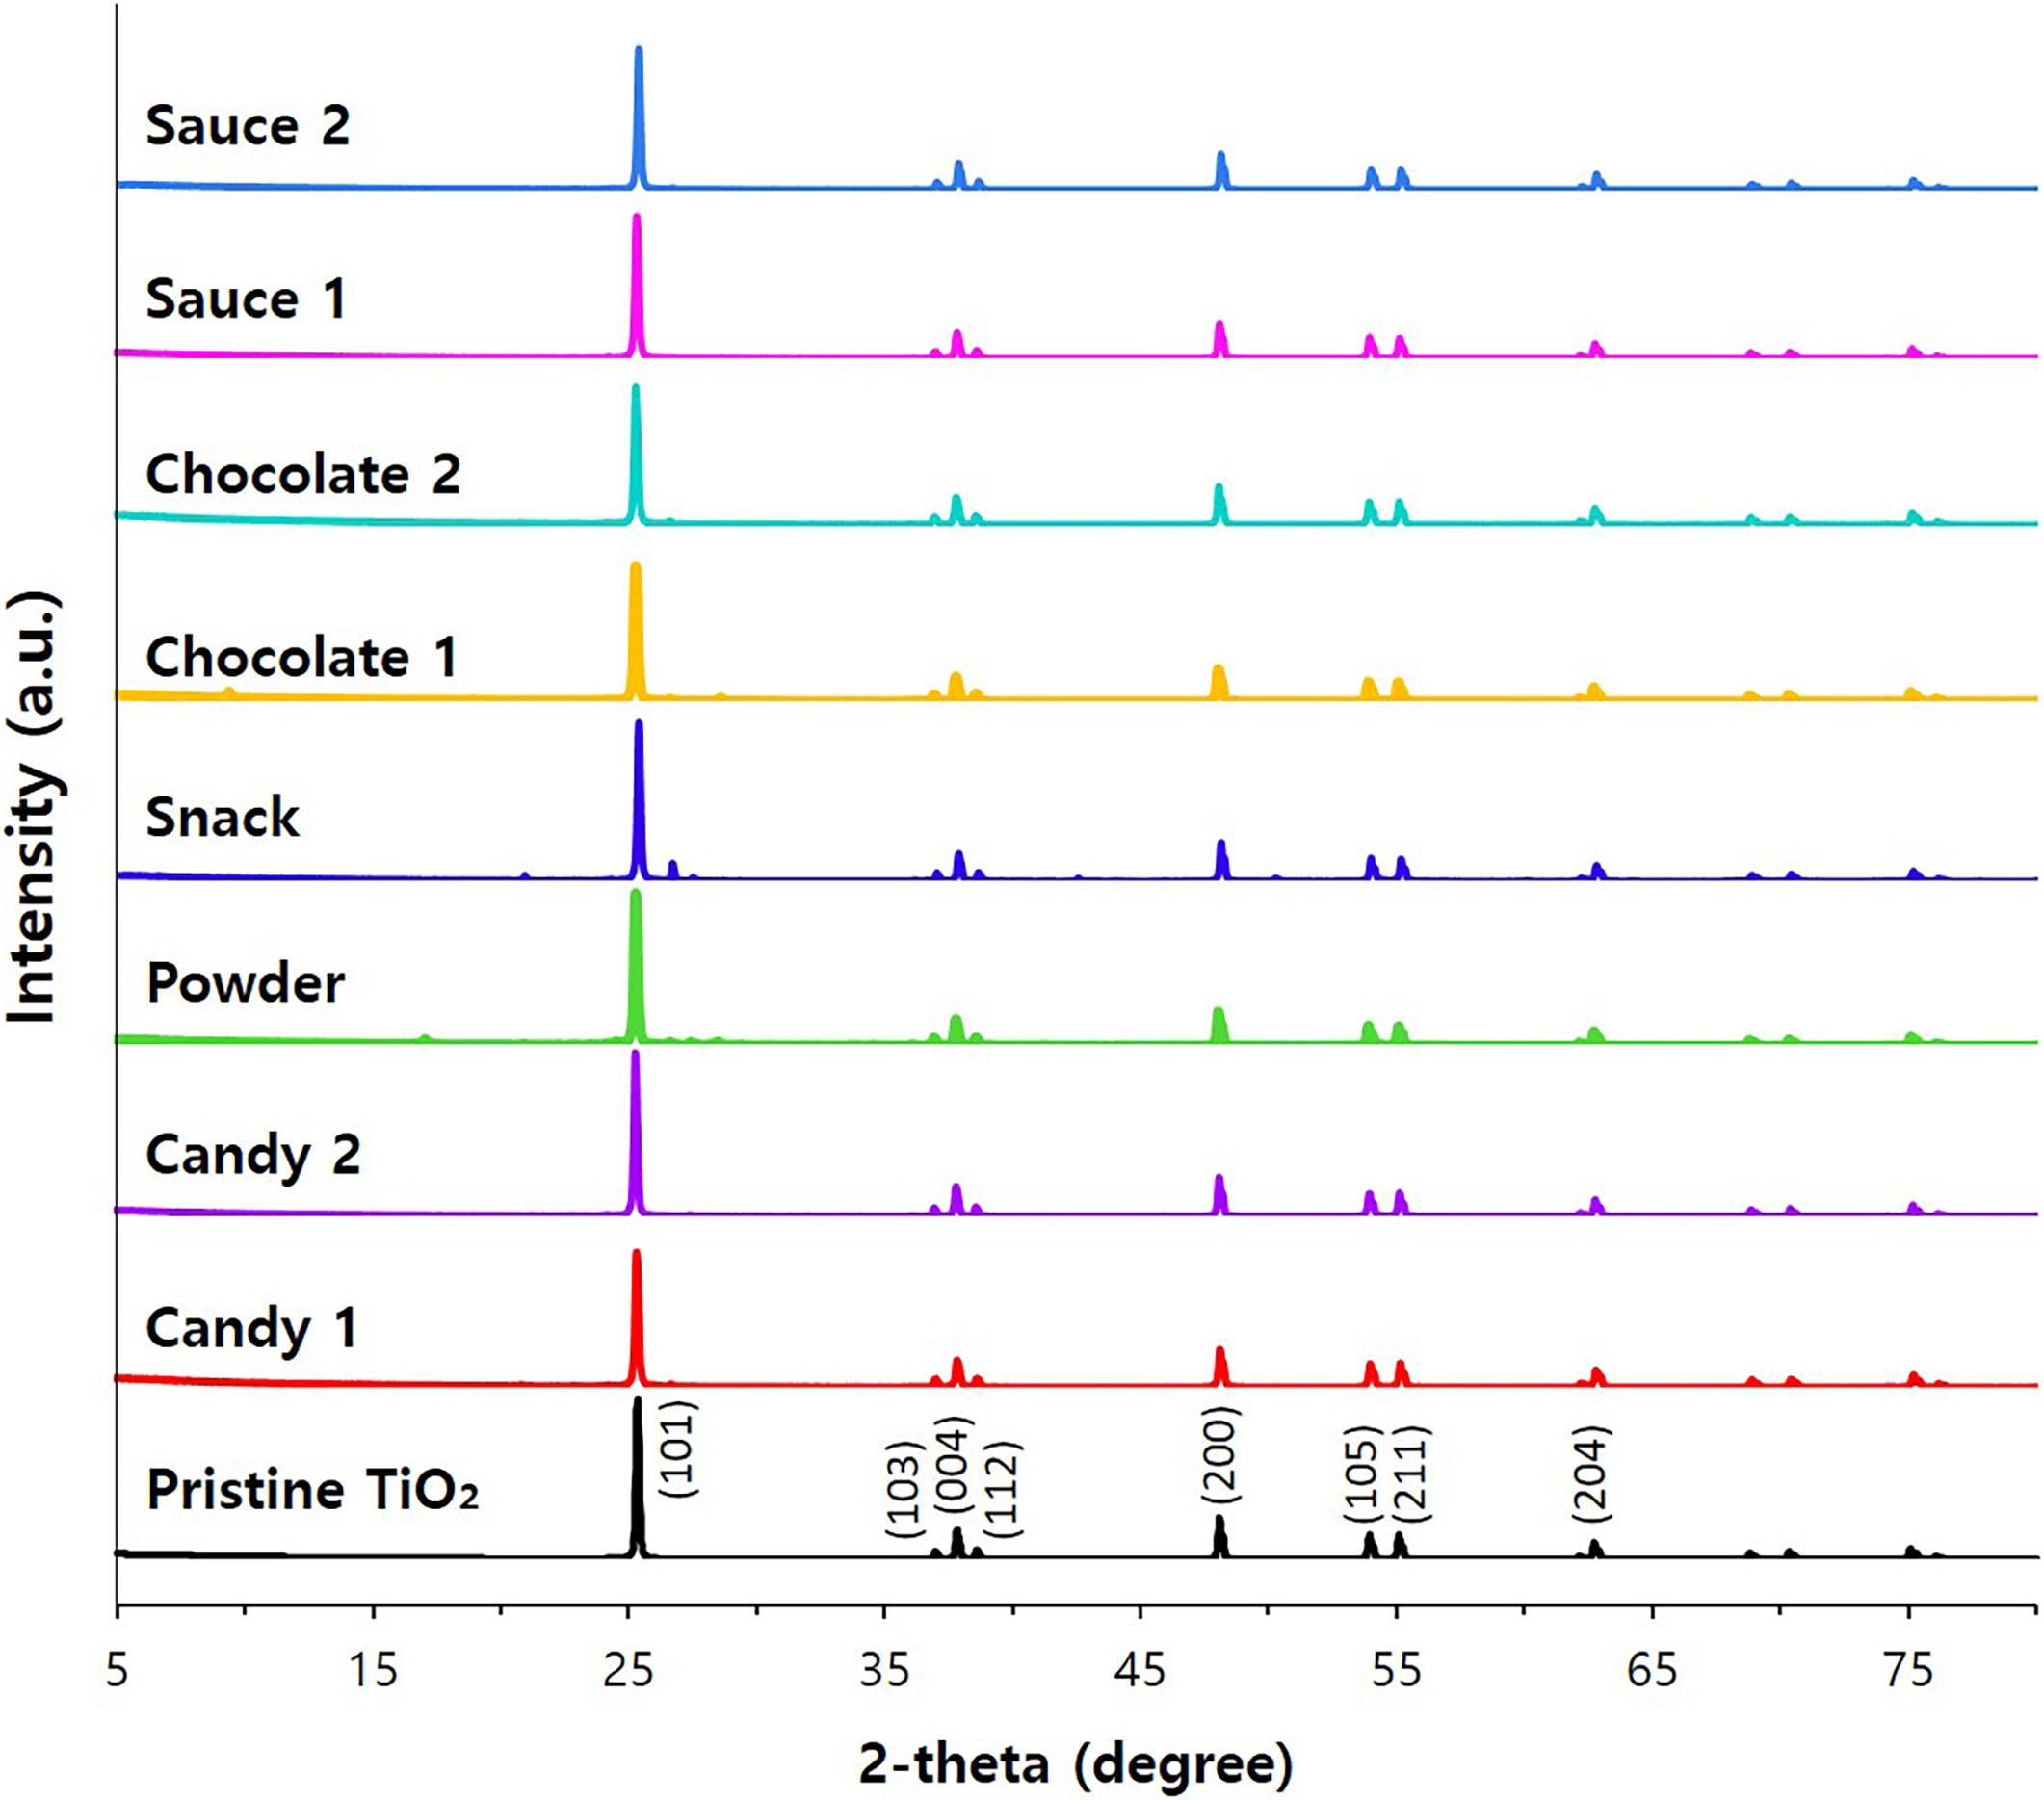 Fig. 10.
X-ray diffraction (XRD) patterns of pristine TiO
particles and separated TiO from commercial foods.
4. Conclusions
Particle, aggregate, or ionic fates of food additive SiO and TiO in
commercial processed foods were determined by optimizing CPE approaches in food
matrices. The results reveal that most SiO and TiO in commercial
foods were present as particle forms without significant differences in
constituent particle size and size distribution compared with pristine food-grade
each particle. Moreover, the crystalline phases of separated SiO and
TiO from processed foods were not affected, showing amorphous and anatase
crystalline phases for the former and the latter, respectively. The ionic fates
of two additives by CPE were highly consistent with the solubility results,
demonstrating maximum ~5.5% and ~0.9% ionized
forms for SiO and TiO, respectively. Higher ionic fate and
dissolution of SiO than TiO in foods were found, indicating that the
former can more easily dissolve in food matrices. The interactions between NPs
and matrices may affect their dissolution fates in food products. All the results
suggest that most food additive SiO and TiO were present as intact
particle forms, implying that particle fates of food additives should be
considered for understanding and predicting their potential toxicity.


