


1 Department of Physiology, Medical School, National and Kapodistrian University of Athens, 11527 Athens, Greece
2 FAME Laboratory, Department of Physical Education and Sport Science, University of Thessaly, 42100 Trikala, Greece
†These authors contributed equally.
Abstract
Background: Obesity is a significant health problem with an increasing
incidence, causing a low-grade systemic inflammatory state and being implicated
in various chronic diseases. Moreover, obesity has been shown to cause
mitochondrial dysfunction through oxidative stress and inflammation, eventually
affecting energy metabolism. However, high-intensity interval training (HIIT) can
improve mitochondrial efficiency through exercise-induced mitochondrial
adaptations. This systematic review and meta-analysis aims to examine the
potential effects of HIIT on mitochondrial-associated indices in obese and
overweight adults. Methods: PubMed, Scopus, and Web of Science
databases were searched. Results: Twenty-eight eligible studies
were included, involving 530 participants. HIIT was found to significantly
improve the activity of citrate synthase (CS), cytochrome C (COX-IV),
beta-hydroxyacyl CoA-dehydrogenase (
Keywords
- citrate synthase
- cytochrome c
- Complex I–V
- mitochondria
- biogenesis
- obesity
- physical activity
- exercise
Obesity, a result of the imbalance between energy intake and energy expenditure, has been widely characterized as a global pandemic. As reported by the World Health Organization (WHO), worldwide obesity has nearly tripled since 1975. In 2016, over 1.9 billion (39%) adults aged 18 years and older were overweight. Of these, over 650 (13%) million were obese [1]. Furthermore, one billion people are estimated to be obese by 2030, as predicted in the World Obesity Atlas 2022, according to the World Obesity Federation [2]. Obesity reflects an excessive accumulation of adipose tissue, which is considered an active organ playing a role in the body’s homeostasis processes and metabolism [3]. Moreover, an increased infiltration of obese people’s adipose tissue by immune cells has been observed, which in turn promotes the development of a mild pro-inflammatory environment both locally and systemically. Chronic inflammation may lead to type 2 diabetes (T2D) and insulin resistance, cardiovascular diseases, fatty liver disease, asthma, neoplasia, as well as mitochondrial dysfunction [3, 4].
Mitochondria are responsible for the generation of adenosine triphosphate (ATP),
the primary energy source for the function of cells and tissues [5]. During the
ATP synthesis process through the tricarboxylic acid cycle and oxidative
phosphorylation, reactive oxygen species (ROS) are released [6]. When the ROS
production exceeds the antioxidant defense systems, oxidative stress is initiated
[7]. Moreover, the excessive intake of nutrients in obesity increases
mitochondrial ROS production, thus leading to oxidative stress. This stress, in
turn, can cause mitochondrial function impairment, reduced mitochondrial
biogenesis, and decreased rate of
Certain diseases may affect mitochondrial function and biogenesis, leading to significant variations in cellular energy production and overall health. Neurodegenerative and cardiovascular diseases have been associated with impaired mitochondrial function, contributing to the progressive degeneration of neurons and impacting cardiac muscle function and energy metabolism accordingly [10, 11]. Additionally, hypertension has been linked to mitochondrial dysfunction in vascular cells [12]. In turn, damage to these structures results in their dysfunction and has been linked to a wide range of diseases [13, 14]. Understanding the unique effects of these diseases on mitochondrial biology is essential for elucidating their underlying mechanisms and exploring potential therapeutic interventions.
Peroxisome proliferator-activated receptor-gamma coactivator 1-alpha
(PGC-1
Physical activity and/or exercise have increasingly been suggested as effective strategies to manage obesity. Indeed, the value and importance of exercise in health has been highlighted since ancient times. Hippocrates from Kos, Greece, the “father of medicine”, was the first recorded physician to recognize the necessity of physical exercise and prescribing written exercise for a patient suffering from consumption [17]. The main benefits of exercise are increased maximal oxygen uptake and increased fat oxidation in healthy individuals and patients with metabolic diseases [18, 19]. The WHO recommends an equivalent combination of regular moderate- and vigorous-intensity physical activity (exercise) for at least 150 minutes per week [20].
Many forms of exercise training can be used based on the exercise
characteristics, i.e., frequency, intensity, duration, and type of exercise [21].
High-intensity interval training (HIIT) consists of repeated bouts of short
(
This systematic review was structured according to the Preferred Reporting Items of Systematic Reviews and Meta-Analyses (PRISMA) guidelines [31]. The review protocol was registered with the international prospective register for systematic reviews (PROSPERO) database (registration number: CRD42022381060) [32].
A systematic search was conducted by two independent researchers (SH and SMD) through the electronic databases PubMed, Scopus, and Web of Science, from the day of their inception until March 2022. Using a combination of keywords relative to the three main axes of the study (HIIT exercise, obesity, and mitochondrial-associated indices) provided us with a full range of relevant literature. Variations were made to the algorithm according to the specificities of each electronic database. A forward snowballing technique (searching the reference list of the eligible studies to identify potential article omissions that could also be eligible) was used by researcher IAK to ensure literature saturation. Limitations were applied to exclude animal trials and publications in languages other than English. Two independent reviewers (SH and IAK) selected the eligible studies. Reviewer disagreements were resolved through a referee investigator (PCD).
Predetermined criteria based on the PICOS (population, intervention, comparator,
outcomes, and study design) framework guided the screening process, which was
performed by researchers SH and IAK [33]. As a population, we defined obese or
overweight people as those who were included in studies with a body mass index
(BMI) population mean value of
We intended to synthesize evidence and evaluate heterogeneity from the available
literature comprehensively. Therefore, we had no restrictions in our inclusion
criteria and accepted outcomes of various expression levels (protein level,
enzyme activity, gene expression, and respiratory capacity). Additionally, both
muscle and plasma samples were included, considering the established excellent
correlation between muscle and serum PGC-1
For the eligible RCTs, we used the updated Risk of Bias 2 (RoB2) Cochrane library tool [35]. For the quasi RCT, CT as well as the single arm eligible studies, we used the Research Triangle Institute Item Bank (RTI-IB) tool [36], to assess the risk of bias. Two independent reviewers (SH and IAK) assessed the risk of bias in eligible studies, while a referee investigator (PCD) resolved any disagreements between the two independent reviewers.
Two independent reviewers (SH and SMD) extracted data from the eligible studies as follows: (a) first author surname and year of publication, (b) methodological design, (c) participants’ anthropometric characteristics (i.e., age, gender), (d) BMI, (e) exercise intervention, (f) main outcome. The extracted data can be found in the Supplementary Material (Supplementary Table 1). Additional data was requested via email to the corresponding author in two cases. Firstly, we requested and subsequently obtained subjects’ weight and height data for a study referring to an overweight population without determining BMI [37]. However, we were unable to access data regarding the mean age and sex of subjects in another study [38]. Despite this, both studies were ultimately included in our meta-analysis. If the outcome data were only provided in graph form, we utilized an online plot digitizer to extract the necessary values [39].
A summarized narrative data synthesis was adopted for eligible studies that did
not provide numerical data to be used for a meta-analysis. For studies suitable
for meta-analysis, a random-effect model was used to account for heterogeneity
due to differences in study populations, HIIT interventions, and study duration.
All meta-analyses were conducted using the Review Manager software (RevMan)
v.5.4.1, 2020 (The Cochrane Collaboration, Copenhagen, Denmark) [40]. We used an
inverse variance, a continuous method, to calculate mean differences either
between a HIIT intervention group and a control group or between baseline and
post-intervention values of the intervention group. In cases where the
calculation units were different for the variable involved in a meta-analysis, a
standardized mean difference (SMD) approach was used [33]. We analyzed the
following variables: CS, COX-IV,
As non-parametric and parametric data cannot be mixed in a meta-analysis, we converted the means and SD of non-parametric data into parametric data, when necessary, using well-established equations [41]:
mean
SD
Reporting information is shown in the relevant PRISMA checklist in the Supplementary Material (Supplementary Fig. 1) [31].
Of the 2338 retrieved publications, 529 were duplicates, and 1695 did not meet the prespecified eligibility criteria and were excluded based on title and abstract. Additionally, ten publications that did not fulfill the inclusion criteria were also excluded after careful consideration of their full text. The screening of the reference lists of the eligible publications revealed one more eligible paper. Ultimately, 28 studies were included in this systematic review, as shown in the PRISMA 2020 flow diagram (Supplementary Fig. 1) [31].
The risk of bias assessment outcomes is shown in the Supplementary Material (Supplementary Table 2 and Supplementary Fig. 2).
The studies included in this systematic review were published between the years 2011 and 2022, showing how recent and, at the same time, rapidly growing the literature on this topic is. The population of all eligible studies included 530 overweight or obese participants and 51 healthy controls. Five studies were randomized controlled trials (RCTs) [15, 43, 44, 45, 46], 19 studies were single-arm trials [37, 38, 47, 48, 49, 50, 51, 52, 53, 54, 55, 56, 57, 58, 59, 60, 61, 62, 63], two studies were parallel-group trials [64, 65], and two were non-randomized parallel controlled trials (CTs) [66, 67].
Regarding the eligible RCTs [15, 43, 44, 45, 46], one indicated a high risk of bias [43], and four showed some concerns [15, 44, 45, 46] of risk of bias in the randomization process. In the intervention assignment, four revealed some concerns [43, 44, 45, 46] and one indicated a low risk of bias [15]. Regarding intervention adherence, the risk of bias was low for all five studies [15, 43, 44, 45, 46]. For missing data, one RCT showed a high risk of bias [45], and the remaining four RCTs showed a low risk of bias [15, 43, 44, 46]. Finally, for the outcome, all five RCTs demonstrated a low risk of bias [15, 43, 44, 45, 46]. For the reported results, two demonstrated a low risk of bias [15, 45], and three showed some concerns about the risk of bias [43, 44, 46].
For selection bias in the CTs and single arm design studies, the risk was not applicable for 12 [37, 38, 47, 48, 49, 50, 51, 52, 54, 56, 59, 62], low for seven [53, 57, 58, 60, 63, 64, 65], high for one [67] and three indicated some concerns [55, 61, 66]. For performance bias, two studies showed some concerns [56, 59], and the other 21 showed a low risk of bias [37, 38, 47, 48, 49, 50, 51, 52, 53, 54, 55, 57, 58, 60, 61, 62, 63, 64, 65, 66, 67]. For detection bias, all 23 studies showed a low risk of bias [37, 38, 47, 48, 49, 50, 51, 52, 53, 54, 55, 56, 57, 58, 59, 60, 61, 62, 63, 64, 65, 66, 67]. For attrition bias, eight studies indicated a low risk [53, 55, 61, 63, 64, 65, 66, 67], and 15 showed a not applicable risk of bias [37, 38, 47, 48, 49, 50, 51, 52, 54, 56, 57, 58, 59, 60, 62]. For selective outcome, eight studies showed low risk [38, 55, 56, 57, 58, 59, 60, 67], and 15 revealed some concerns about risk of bias [37, 47, 48, 49, 50, 51, 52, 53, 54, 61, 62, 63, 64, 65, 66]. For confounding bias, all 23 studies displayed some concerns about the risk of bias [37, 38, 47, 48, 49, 50, 51, 52, 53, 54, 55, 56, 57, 58, 59, 60, 61, 62, 63, 64, 65, 66, 67].
A narrative data synthesis was adopted for the eligible studies that did not provide sufficient data for a meta-analysis. In particular, mitochondrial volume density, mitochondrial size, and mitochondrial number were calculated from only one study, which showed an increase after the intervention [64]. Furthermore, a single study provided results regarding the mitochondrial membrane potential of isolated neutrophils, which also displayed an increase after the exercise intervention [52].
The primary outcomes for the meta-analyses appear in Table 1.
| Meta-analysis | N (HIIT/control) | SMD [95% CI] | Heterogeneity (I |
Z score (p) | Subgroup difference |
| CS (overall) | 335/329 | 0.89 [0.67, 1.12] | 38% | 7.85 (p |
- |
| CS (BMI |
65/59 | 1.01 [0.61, 1.41] | 5% | 4.94 (p |
p = 0.48 |
| CS (BMI |
270/270 | 0.84 [0.57, 1.10] | 47% | 6.09 (p |
|
| CS (healthy) | 240/234 | 0.94 [0.75, 1.14] | 0% | 9.55 (p |
p = 0.52 |
| CS (disease) | 95/95 | 0.69 [–0.03, 1.42] | 79% | 1.87 (p = 0.52) | |
| COX-IV (overall) | 171/171 | 0.74 [0.51, 0.96] | 0% | 6.46 (p |
- |
| COX-IV (BMI |
49/49 | 0.89 [0.47, 1.31] | 0% | 4.13 (p |
p = 0.41 |
| COX-IV (BMI |
122/122 | 0.68 [0.41, 0.94] | 0% | 5.03 (p |
|
| COX-IV (healthy) | 139/139 | 0.82 [0.57, 1.07] | 0% | 6.42 (p |
p = 0.15 |
| COX-IV (disease) | 32/32 | 0.41 [–0.09, 0.91] | 0% | 1.61 (p = 0.11) | |
| 276/266 | 0.67 [0.37, 0.98] | 61% | 4.30 (p |
- | |
| 56/50 | 0.58 [0.19, 0.98] | 0% | 2.89 (p = 0.004) | p = 0.66 | |
| 220/216 | 0.71 [0.30, 1.13] | 73% | 3.36 (p = 0.0008) | ||
| 209/199 | 0.52 [0.32, 0.72] | 0% | 5.05 (p |
p = 0.57 | |
| 67/67 | 0.89 [–0.39, 2.17] | 89% | 1.37 (p = 0.17) | ||
| PGC-1 |
96/95 | 0.51 [–0.03, 1.05] | 68% | 1.86 (p = 0.06) | - |
| PGC-1 |
38/38 | 0.89 [0.41, 1.37] | 0% | 3.62 (p = 0.0003) | p = 0.17 |
| PGC-1 |
58/57 | 0.25 [–0.54, 1.04] | 75% | 0.61 (p = 0.54) | |
| PGC-1 |
86/85 | 0.59 [0.01, 1.18] | 69% | 1.98 (p = 0.05) | p = 0.17 |
| PGC-1 |
10/10 | –0.15 [–0.03, 1.05] | N.A. | 0.32 (p = 0.75) | |
| SIRT1 (overall) | 60/59 | 0.81 [–0.13, 1.76] | 82% | 1.69 (p = 0.09) | - |
| SIRT1 (BMI |
31/31 | 0.78 [–0.31, 1.88] | 75% | 1.40 (p = 0.16) | p = 0.89 |
| SIRT1 (BMI |
29/28 | 0.94 [–0.98, 2.86] | 89% | 0.96 (p = 0.34) | |
| Complex I (overall) | 118/117 | 0.69 [0.21, 1.17] | 66% | 2.84 (p = 0.005) | - |
| Complex I (BMI |
8/8 | –0.52 [–1.53, 0.48] | N.A. | 1.03 (p = 0.31) | p = 0.02 |
| Complex I (BMI |
110/109 | 0.80 [0.33, 1.27] | 61% | 3.34 (p = 0.0008) | |
| Complex I (healthy) | 101/100 | 0.70 [0.15, 1.25] | 69% | 2.51 (p = 0.28) | p = 0.90 |
| Complex I (disease) | 17/17 | 0.62 [–0.50, 1.75] | 58% | 1.08 (p = 0.28) | |
| Complex II (overall) | 103/102 | 0.38 [0.10, 0.66] | 0% | 2.64 (p = 0.008) | - |
| Complex II (BMI |
8/8 | –0.19 [–1.18, 0.79] | N.A. | 0.38 (p = 0.70) | p = 0.24 |
| Complex II (BMI |
95/94 | 0.43 [0.14, 0.72] | 0% | 2.64 (p = 0.004) | |
| Complex II (healthy) | 86/85 | 0.38 [0.07, 0.68] | 0% | 2.43 (p = 0.02) | p = 0.98 |
| Complex II (disease) | 17/17 | 0.39 [–0.38, 1.15] | 18% | 0.99 (p = 0.32) | |
| Complex III (overall) | 87/88 | 0.79 [0.41, 1.18] | 31% | 4.03 (p |
- |
| Complex III (BMI |
8/8 | 0.59 [–0.41, 1.60] | N.A. | 1.15 (p = 0.25) | p = 0.69 |
| Complex III (BMI |
79/80 | 0.82 [0.38, 1.25] | 40% | 3.68 (p = 0.0002) | |
| Complex III (healthy) | 70/71 | 0.87 [0.47, 1.27] | 21% | 4.28 (p |
p = 0.64 |
| Complex III (disease) | 17/17 | 0.57 [–0.64, 1.78] | 63% | 0.92 (p = 0.36) | |
| Complex IV (overall) | 87/88 | 0.65 [0.07, 1.23] | 68% | 2.21 (p = 0.03) | - |
| Complex IV (BMI |
8/8 | –0.92 [–1.197, 0.12] | N.A. | 1.73 (p = 0.08) | p = 0.003 |
| Complex IV (BMI |
79/80 | 0.84 [0.34, 1.33] | 53% | 3.31 (p = 0.0009) | |
| Complex IV (healthy) | 70/71 | 0.57 [–0.03, 1.16] | 65% | 1.86 (p = 0.06) | p = 0.61 |
| Complex IV (disease) | 17/17 | 1.23 [–1.27, 3.72] | 87% | 0.96 (p = 0.34) | |
| Complex V (overall) | 82/81 | 0.43 [0.11, 0.74] | 0% | 2.67 (p = 0.008) | - |
| Complex V (BMI |
10/8 | –0.10 [–1.03, 0.83] | N.A. | 0.21 (p = 0.83) | p = 0.24 |
| Complex V (BMI |
72/73 | 0.50 [0.16, 0.83] | 0% | 2.91 (p = 0.004) | |
| Complex V (healthy) | 72/71 | 0.49 [0.15, 0.82] | 0% | 2.84 (p = 0.005) | p = 0.33 |
| Complex V (disease) | 10/10 | 0.02 [–0.86, 0.90] | N.A. | 0.04 (p = 0.96) | |
| VO |
678/485 | 3.14 [2.30, 3.99] | 78% | 7.30 (p |
- |
| VO |
87/87 | 3.93 [2.28, 5.57] | 61% | 4.68 (p |
p = 0.27 |
| VO |
591/398 | 2.86 [1.88, 3.83] | 70% | 5.75 (p |
|
| VO |
344/343 | 3.23 [2.22, 4.24] | 82% | 6.26 (p |
p = 0.54 |
| VO |
334/142 | 2.78 [1.75, 3.81] | 0% | 5.29 (p |
N.A., not applicable.
The meta-analysis for CS was performed with data obtained from 17 studies
[37, 38, 43, 44, 47, 48, 49, 50, 51, 53, 55, 56, 57, 58, 60, 62, 66], which were expressed in protein content
[56] or activity [37, 38, 43, 44, 47, 48, 49, 50, 51, 53, 55, 57, 58, 60, 62, 66]. It revealed a
statistically significant positive effect of HIIT on CS activity in the
overweight and obese population (p
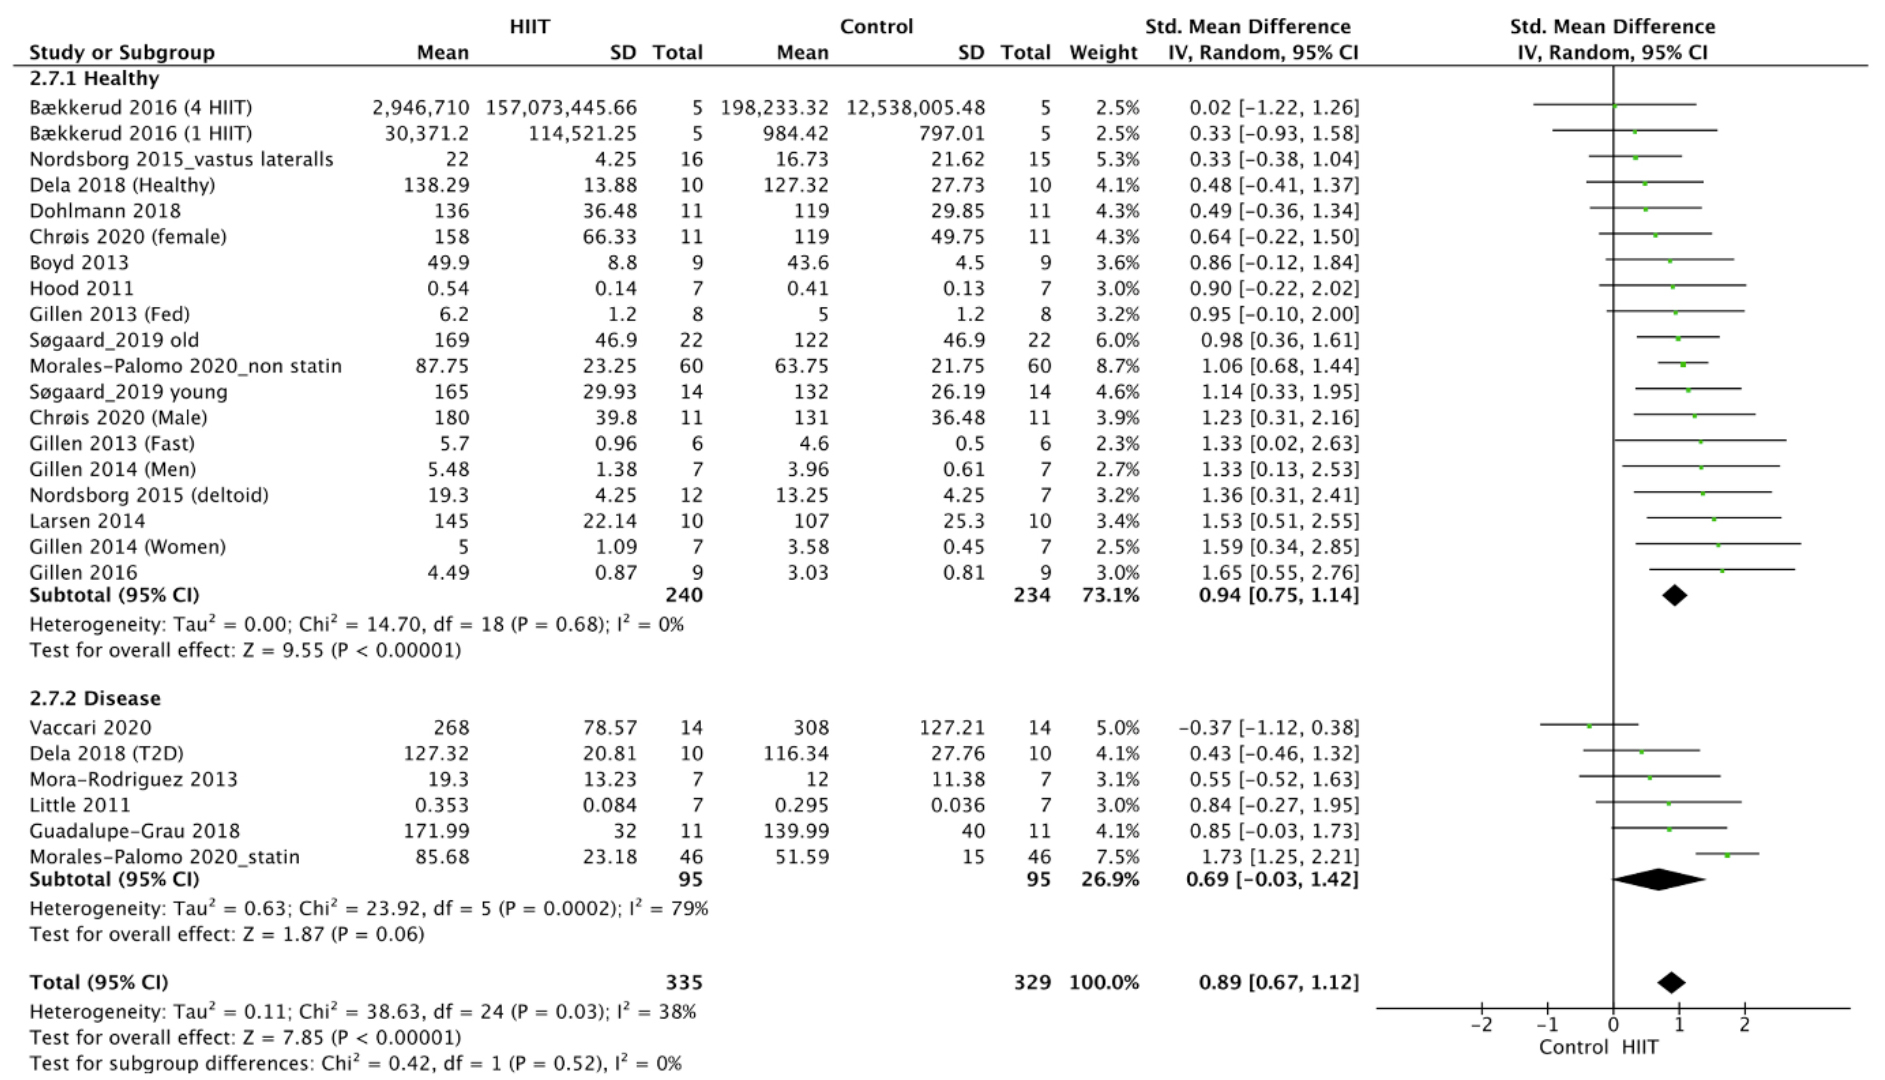 Fig. 1.
Forest plot of the effect of HIIT on CS (subgroup analysis for health status). SD, standard deviation; 95% CI, 95% confidence interval.
The meta-analysis for COX-IV was conducted using data from 10 studies
[37, 46, 51, 54, 56, 57, 61, 64, 65, 67], which were expressed in terms of protein content
[46, 51, 56, 57, 61, 65], protein density [67], protein intensity [54], fluorescence
intensity [64] and flux [37]. It showed a statistically significant positive
effect of HIIT on COX-IV activity in the overweight and obese population
(p
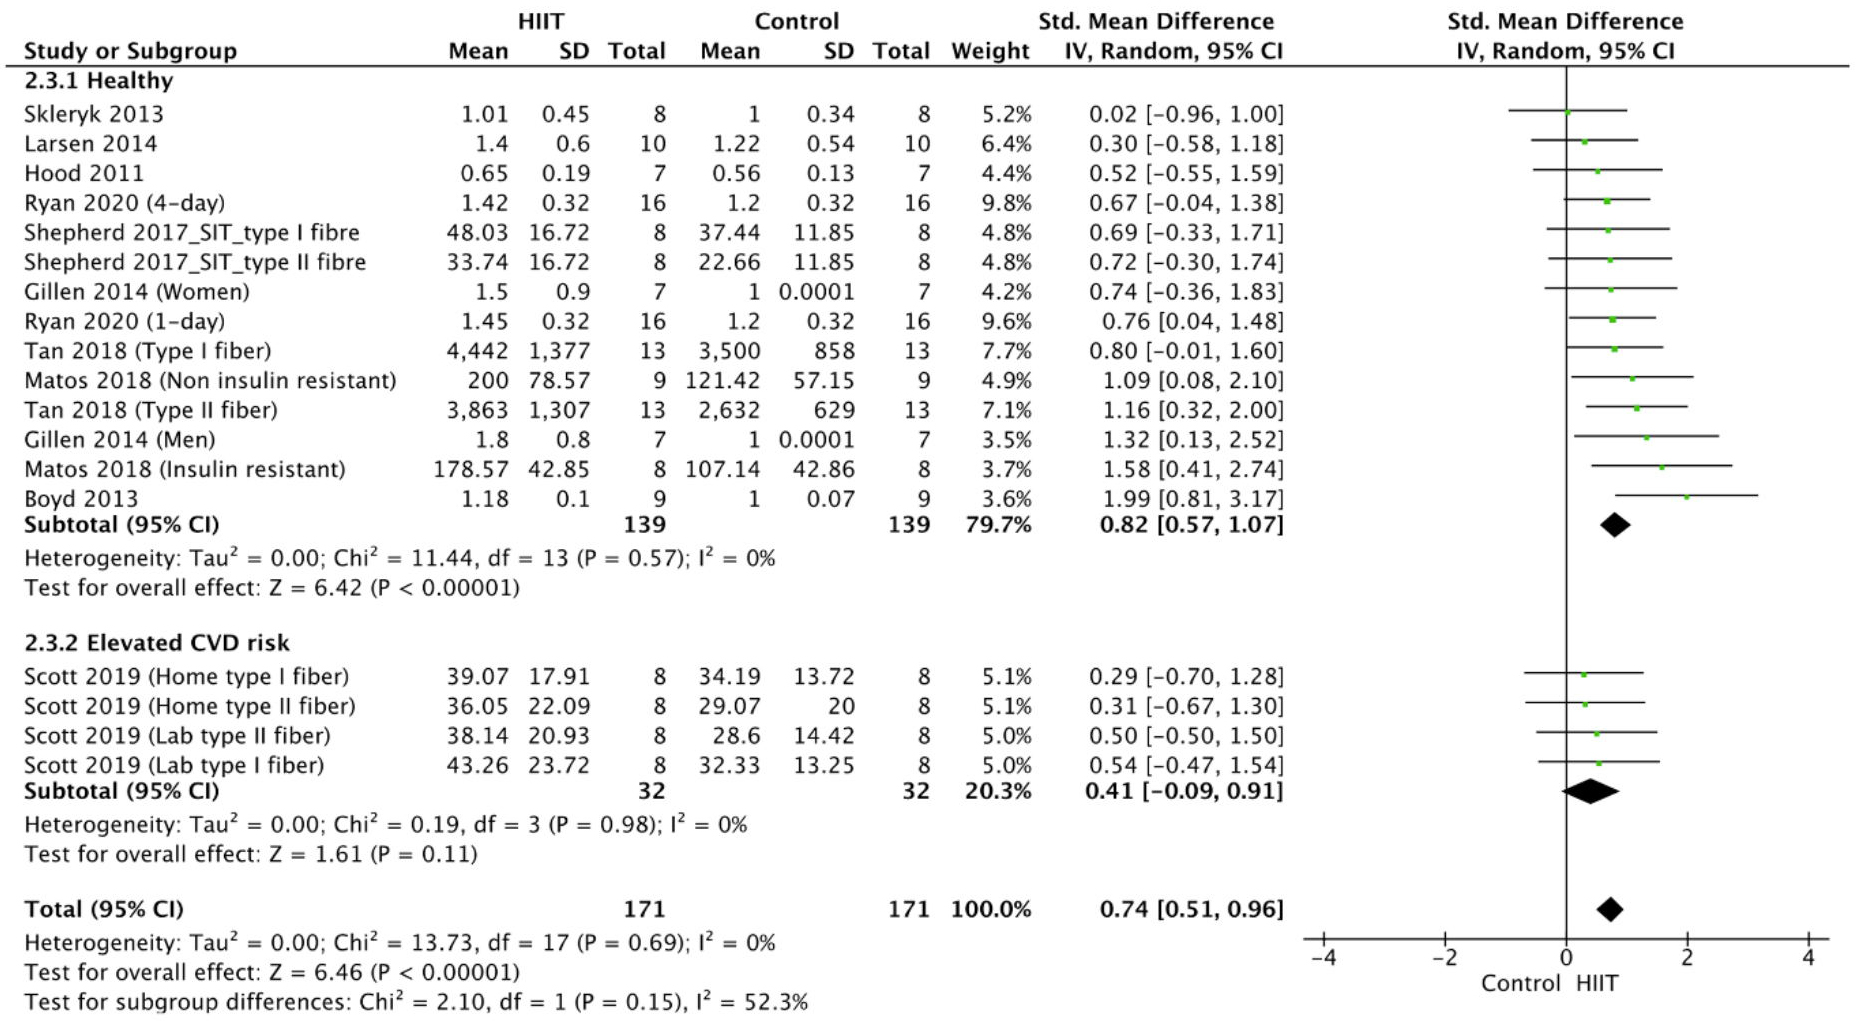 Fig. 2.
Forest plot of the effect of HIIT on COX-IV (subgroup analysis for health status). SD, standard deviation; 95% CI, 95% confidence interval.
The meta-analysis for
The meta-analysis for PGC-1
The meta-analysis for SIRT1 was performed with data obtained from four studies
[15, 45, 51, 65] and was expressed in terms of protein content [15, 45, 51, 65]. The
analysis of the data revealed no significant effect of HIIT on SIRT1 activity in
the overweight and obese population (p
The meta-analysis for Complex I was performed with data obtained from eight
studies [38, 43, 46, 49, 50, 51, 62, 63], which were expressed in terms of protein content
[43, 46, 49, 50, 51, 63] and mitochondrial respiratory capacity [38, 62]. It showed a
statistically significant positive effect of HIIT on Complex I in the overweight
and obese population (p
The meta-analysis for Complex II was performed with data obtained from seven
studies [38, 43, 46, 49, 50, 63, 65] which were expressed in terms of protein content
[43, 46, 49, 50, 63, 65] and mitochondrial respiratory capacity [38]. It revealed a
statistically significant positive effect of HIIT on Complex II in the overweight
and obese population (p
The meta-analysis for Complex III was conducted with data obtained from five
studies [43, 46, 49, 50, 63], which were expressed in terms of protein content
[43, 46, 49, 50, 63] and revealed a statistically significant positive effect of HIIT
on Complex III in the overweight and obese population (p
The meta-analysis for Complex IV was performed with data obtained from five
studies [43, 46, 49, 50, 63], which were expressed in terms of protein content
[43, 46, 49, 50, 63] and revealed a statistically significant positive effect of HIIT
on Complex IV in the overweight and obese population (p
The meta-analysis for Complex V was performed with data obtained from four
studies [43, 46, 50, 63], which were expressed in terms of protein content
[43, 46, 49, 50, 63] and revealed a statistically significant positive effect of HIIT
on Complex V in the overweight and obese population (p
The meta-analysis for VO
Our GRADE analysis outcomes appear in Table 2, while the detailed evaluation of
its components can be found in the Supplementary Material
(Supplementary Table 3). The meta-analysis outcomes of the effects of
HIIT on Complex V vs. control and HIIT on VO
| Outcomes | No. of participants (studies/entries) | Quality of the evidence (GRADE) | Relative effect (95% CI) |
| HIIT on citrate synthase vs. control | 664 (25 studies/entries) | SMD = 0.89 (0.67–1.12) | |
| HIIT on cytochrome c vs. control | 342 (18 studies/entries) | SMD = 0.74 (0.51–0.96) | |
| HIIT on |
542 (18 studies/entries) | SMD = 0.67 (0.37–0.98) | |
| HIIT on PGC-1 |
191 (10 studies/entries) | SMD = 0.51 [(–0.03)–(1.05)] | |
| HIIT on Complex I vs. control | 235 (12 studies/entries) | SMD = 0.69 (0.21–1.17) | |
| HIIT on Complex II vs. control | 205 (10 studies/entries) | SMD = 0.38 (0.10–0.66) | |
| HIIT on Complex III vs. control | 175 (8 studies/entries) | SMD = 0.79 (0.41–1.18) | |
| HIIT on Complex IV vs. control | 175 (8 studies/entries) | SMD = 0.65 (0.07–1.23) | |
| HIIT on Complex V vs. control | 163 (7 studies/entries) | SMD = 0.43 (0.11–0.74) | |
| HIIT on VO |
1172 (34 studies/entries) | SMD = 3.14 (2.30–3.99) |
CI, confidence interval; SMD, standardized mean difference;
The meta-analyses showed that HIIT can positively affect several
mitochondrial-associated indices in overweight and obese individuals.
Specifically, statistically significant improvements were observed in CS, COX-IV,
For BMI, two main subgroups were investigated: BMI
In terms of health status, subjects were classified into two main groups: the
healthy group and the disease group, which comprised subjects with a history of
disease. Even though no statistically significant subgroup differences in SMDs
were observed based on health status, a trend in favor of the healthy subgroup
exists with respect to the effect of HIIT on CS, COX-IV,
For the primary outcomes, there was sufficient evidence to assess, through the
meta-analysis, the effect of HIIT on CS (17/28 included studies—60%),
Our findings are consistent with previous research on the positive effects of
HIIT on mitochondrial biogenesis and enzyme regulation in the general population
[68, 69, 70]. In addition, previous findings have demonstrated the feasibility and
beneficial effects of HIIT, particularly on overweight and obese populations with
or without comorbidities. In those studies, improvements in cardiorespiratory
function, including VO
Based on the various markers we examined, our data suggest that HIIT can improve
mitochondrial-associated indices in overweight/obese individuals. In particular,
exercise volume and intensity are important to improve mitochondrial respiratory
function and mitochondrial content, and HIIT can combine both exercise volume and
intensity advantageously [69, 75, 76]. Furthermore, the reduced effect of HIIT on
the mitochondrial parameters in the disease subgroup raises reasonable questions
regarding potential contributing factors. These could be the impact of underlying
diseases, the disease’s severity and duration, and the treatment or medications
received. In a meta-analysis by Morales-Palomo et al. [66] 2020,
participants had metabolic syndrome and were undergoing chronic statin therapy.
Statins have been reported to exert various effects on mitochondria, including
reductions in coenzyme Q10 levels, inhibition of respiratory chain complexes,
induction of mitochondrial apoptosis, dysregulation of Ca
We also observed an analogous relationship between the increase in mitochondrial
biogenesis and increase in VO
The strengths of our systematic review include: (a) the use of suitable algorithms and standardized indexing terms during the search process to enabled the retrieval of publications that used alternative keywords to describe the same concept, (b) we conducted searching and screening processes, assessed the risk of bias, and extracted data in a thorough way, without excluding studies based on publication date, (c) for the evaluation of the quality of our meta-analyses, GRADE analysis was utilized, (d) to the best of the author’s knowledge, no other systematic review has examined the effect of HIIT on mitochondrial-associated indices in overweight/obese individuals, and (e) the subgroup analysis comparing individuals with excess body weight alone and individuals with excess body weight and a disease factor revealed differences in the effectiveness of HIIT on mitochondrial-associated indices.
The present systematic review also has certain limitations, including: (a) lack of expert supervision for some HIIT exercise interventions, (b) the studies included were restricted to the English language, (c) some of our primary outcomes were assessed with low-quality evidence, (d) with the exception of three studies [47, 48, 66] the intervention period lasted from 2–12 weeks, (e) the complexity of assessing the diverse effects of certain diseases on mitochondrial biology, along with their implications for exercise-induced adaptations and the influence on mitochondrial-associated indices, and (f) the studies that utilized serum samples instead of skeletal muscle may not be directly comparable, as the assessment of comparability is based on one study.
We report no significant deviations from the published protocol.
The present data demonstrate that HIIT has the potential to significantly improve mitochondrial-associated indices in overweight and obese populations, leading to an overall improvement in health status, provided that certain conditions are met. Furthermore, it appears that, for overweight/obese individuals with an additional disease factor, HIIT is less effective in improving mitochondrial-associated indices than their counterparts without diseases. However, a larger sample size of overweight/obese patients with comorbidities and better quality of evidence is needed to verify this observation. Overall, the findings of this systematic review and meta-analysis offer valuable insights into the positive effects of HIIT as a strategy for improving energy metabolism in overweight and obese populations. Nevertheless, more interventional RCTs are needed, especially of longer duration, investigating the effect of HIIT on mitochondrial-associated indices not only in overweight and obese individuals but also in other clinical populations, with or without comorbidities in order to reveal possible disease dependent HIIT-induced beneficial adaptations.
All data included in this study are available upon request by contact with the corresponding author.
Conceptualization, SH, SMD, IAK and AP; methodology, SH, PCD, CC and AP; software, PCD; validation, SH and PCD; formal analysis, PCD; investigation, SH, SMD, IAK; resources, SH and PCD; data curation SH, SMD, IAK, and AP; writing—original draft preparation, SH, SMD, IAK and PCD; writing—review and editing, SH, SMD, IAK, PCD, CC and AP. All authors contributed to editorial changes in the manuscript. All authors read and approved the final manuscript. All authors have participated sufficiently in the work and agreed to be accountable for all aspects of the work.
Not applicable.
Not applicable.
This research received no external funding.
The authors declare no conflict of interest.
References
Publisher’s Note: IMR Press stays neutral with regard to jurisdictional claims in published maps and institutional affiliations.