


 , Tianran Cao 6,*, Biao Tu 7,*
1 Department of Plastic Surgery and Dermatology, The First Hospital of Changsha, 410005 Changsha, Hunan , China
2 Department of Plastic and Reconstructive Surgery, Shanghai Ninth People’s Hospital, Shanghai Jiao Tong University School of Medicine, 200011 Shanghai, China
3 Department of Plastic Surgery, The Third Xiangya Hospital, Central South University, 410008 Changsha, Hunan, China
4 Department of Cosmetic and Plastic Surgery, Yueyang Central Hospital, 414000 Yueyang, Hunan, China
5 Department of Cardiology, The First Hospital of Changsha, 410005 Changsha, Hunan, China
6 Office of the Drug Clinical Trail Organization, The First Hospital of Changsha, 410005 Changsha, Hunan, China
7 Department of Cardiothoracic Surgery, The First Hospital of Changsha, 410005 Changsha, Hunan, China
†These authors contributed equally.
Academic Editor: Qing Ye
Abstract
Background: The mortality rate from melanoma has been rising and hence new therapeutic approaches for this disease have received extensive attention, especially the search for novel therapeutic targets. The aim of this study was to find new targets for the treatment of melanoma through a bioinformatics and experimental approach. Methods: First, we screened for differentially expressed genes (DEGs) and differentially expressed miRNAs (DEMs) between melanoma and normal tissues using the TCGA-SKCM, GTEX, and GSE24996 datasets. Next, we identified epithelial-mesenchymal transition (EMT)-related DEGs and analyzed their expression levels and association with patient survival. The expression level of DEGs was then confirmed in normal human melanocytes and melanoma cells. Bioinformatics analysis was used to identify miRNAs that targeted the most highly expressed DEG, LGALS1, and their binding confirmed using dual luciferase. Enriched pathways for the LGALS1 target miR-22-3p were also analyzed. miR-22-3p was overexpressed in cells in order to investigate changes in cell activity and in related genes and proteins. Exosomes from human bone marrow mesenchymal stem cells (MSCs) were coated with miR-22-3p to examine its effect on EMT. Results: The expression levels of LGALS1, CPXM1, and APLNR were higher in melanoma than in normal tissues and were associated with worse patient survival. The differential expression of these genes was confirmed using normal human skin melanocytes (PIG1) and human melanoma cells (WM-266-4). LGALS1 was the most differentially expressed gene between WM-266-4 and PIG1 cells, and was also predicted to be a target for miR-22-3p. The results of dual luciferase experiments confirmed that miR-22-3p could bind to LGALS1. Following the overexpression of miR-22-3p in WM-266-4 cells, the cell viability decreased, the expression levels of LGALS1, VIM and SNAI2 decreased, the expression level of CDH1 increased, and cell apoptosis increased. Transfection of miR-22-3p using exosomes resulted in similar effects. Conclusions: We identified three genes (LGALS1, CPXM1, APLNR) that showed a high level of differential expression in melanoma. LGALS1 is a target for miR-22-3p binding and this can inhibit the EMT of melanoma cells, thereby preventing the development of melanoma. Moreover, exosomes secreted by MSCs can be loaded with miR-22-3p, thus regulating the EMT process in melanoma cells.
Keywords
- melanoma
- epithelial-mesenchymal transition
- LGALS1
- miR-22-3p
Melanoma is a highly malignant tumor [1] and in recent years its incidence and mortality have gradually increased [2]. Although some progress has recently been made with targeted therapy and immunotherapy for cutaneous melanoma, many patients still develop treatment resistance [3]. Therefore, the discovery of potential new targets for cutaneous melanoma should help to achieve further progress in the prevention and treatment of this disease.
The cell regulatory roles of miRNAs in melanoma have been extensively studied over the past decades [4]. miRNAs have been implicated in complex cell regulation processes involving gene expression and protein translation [4]. Targeted therapy based on miRNA has achieved good results in previous studies. However, due to the heterogeneity and multiple subtypes of cancer, the challenge for miRNA approaches is to identify the correct target [5]. Exosomes are vesicles secreted by cells that contain a variety of functional biological small molecules, including miRNAs, long non-coding RNAs (lncRNAs), and proteins [6]. miRNAs from exosomes can affect tumor immunity and the microenvironment to hinder cancer progression, thus further strengthening the therapeutic applications of certain miRNAs [6]. Exosomes secreted by human bone marrow mesenchymal stem cells (MSCs) have shown great potential for the treatment of tumors and inflammatory diseases. These have attracted widespread interest because of their ability to precisely localize to tumor cells [7].
Multiple miRNAs have been shown to be involved in regulating the epithelial-mesenchymal transition (EMT) in melanoma [8, 9]. EMT is commonly observed when epithelial tumor cells transform into mesenchymal cells, thereby leading to tumor metastasis and therapy resistance [10]. EMT-inducing transcription factors play an important role in the transition of melanocytes into malignant melanoma [11]. EMT also allows the proliferative, migratory, and invasive phenotype of melanoma cells to be transformed into mesenchymal cells, thus affecting their response to treatment [12, 13, 14]. The goal of treating melanoma has therefore led to a search for melanoma-targeting miRNAs and for genes related to EMT.
Advanced bioinformatics analysis can provide novel insights into the prevention and treatment of various diseases [15]. Bioinformatics is also an effective tool for identifying relevant genes and targets in melanoma, and for analyzing possible associations between them. The aim of the present study was to use bioinformatics analysis to identify genes and miRNAs associated with melanoma metastasis, prognosis, and EMT. We also conducted in vitro experiments to confirm that the identified genes and miRNAs play a role in melanoma. By combining bioinformatics with experimental methods, we have discovered new targets that may be relevant to melanoma. The EMT of melanoma cells was found to be regulated by miRNAs contained within exosomes secreted by MSCs. The present study could therefore provide novel insights for the treatment of melanoma.
The TCGA-SKCM dataset was selected from the Cancer Genome Atlas (TCGA) database (https://portal.gdc.cancer.gov) and contains 469 melanoma tissue samples. Normal skin tissue samples (n = 813) were selected from the Genotype-Tissue Expression Project (GTEX, https://www.gtexportal.org/). GSE24996 was selected from the Gene Expression Omnibus (GEO) database (https://www.ncbi.nlm.nih.gov/geo/) and contains 15 melanoma tissue samples and 8 benign nevi samples.
The Agilent platform was leveraged to generate raw data from the GEO database.
Background correction and normalization were achieved using a robust multi-chip
averaging (RMA) algorithm. The TCGA and GTEX databases provided RNA sequencing
data. Fragment per kilobase (FPKM) values were converted to transcript per
kilobase (TPM) values with signal intensities similar to RMA-treated values.
Following normalization, data were analyzed using the limma package in R
language. The screening standards for miRNA were
Correlation analyses were performed between DEGs and EMT. EMT hallmark gene sets
were downloaded from the MSigDB database. For the TCGA-SKCM gene expression
profile, the enrichment score for the
HALLMARK_EPITHELIAL_MESENCHYMAL_TRANSITION pathway was calculated using
Genomic Variation Analysis (GSVA) and EMT activity was assessed using the GSVA R
package. DEGs that were significantly associated with this pathway were then
identified. Correlation coefficients of
Survival analysis for 89 EMT-related genes was performed using the Kaplan-Meier
method and the R language survival package. Cox regression was used to test
significance, with p
The R multiMiR package was used to identify miRNAs that target galectin 1 (LGALS1) in the pita, diana, and targetscan databases. Venn diagrams were used to display common miRNAs present in the three databases.
The multiMiR package was used to search for genes targeted by miR-22-3p. The R language clusterProfiler package was then used for GO and KEGG enrichment pathway analysis.
Normal human skin melanocytes (PIG1) and human melanoma cells (WM-266-4)
originated from Shanghai Zeye Biotechnology Co., Ltd. MSCs originated from iCell
Bioscience Inc. Both PIG1 and WM-266-4 cells were cultured in DMEM (D5796-500ML,
SIGMA) with 10% fetal bovine serum and 1% penicillin-streptomycin. MSCs were
cultured in a special medium (human bone marrow MSC complete medium, CM-H166,
Procell) for primary MSCs. WM-266-4 cells were separated into three groups: cells
in the control group did not undergo any treatment; cells in the mimics NC group
were transfected with mimics NC plasmid; cells in the miR-22-3p mimics group were
transfected with miR-22-3p mimics plasmid. MSCs were divided into two groups. In
the MSCs group, MSCs were cultured normally and the cells collected for
evaluation. In the MSC-exos group, MSCs were cultured in serum-free medium, the
cell supernatant was then collected and the exosomes extracted. In addition, MSCs
were first transfected with mimics NC plasmids and miR-22-3p mimics plasmids, and
the cell supernatant subsequently collected for the extraction of exosomes.
WM-266-4 cells were divided into four groups. In the NC group, WM-266-4 cells
were cultured normally. In the MSC-exos group, MSC-exos were added to the
WM-266-4 cells for 12 h. In the MSC-exos
MSCs were cultured with serum-free medium for 2 days. The cell supernatant was
then collected, centrifuged at 3500 rpm for 15 min, and the pellet discarded. The
cell supernatant was mixed with ExoQuick exosome precipitation solution
(EXOQ20A-1, System Biosciences Inc., USA) at a ratio of 5:1 and incubated at 4
TargetScan v.7.0 was used to predict the binding site between LGALS1 and miR-22-3p (http://www.targetscan.org/vert_70/). Plasmid constructs were purchased from HonorGene. The pHG-MirTarget-LGALS1 WT-3U and pHG-MirTarget-LGALS1 MUT-3U plasmids were transfected into 293A cells seeded in 12-well plates. Subsequently, the miR-22-3p mimics plasmid and its empty vector mimics-NC were transfected into 293A cells. Each set of experiments was repeated three times. The activities of firefly luciferase and Renilla luciferase in each group were detected sequentially according to the instructions for the dual luciferase detection kit.
Cells were lysed on ice using Radio Immunoprecipitation Assay (RIPA) lysis
buffer (AWB0136, Abiowell). The cell and lysate mixture was then centrifuged at
12,000 rpm for 15 min. The bicinchoninic acid (BCA) protein kit (AWB0104a,
Abiowell) was used to measure protein concentrations. The marker and the
denatured protein were mixed with loading buffer and subjected to agarose gel
electrophoresis for 2 h. After cutting the gel according to molecular weight, the
proteins were transferred to PVDF membranes. The membranes were blocked with 5%
skimmed milk powder for 90 min at room temperature. Next, the membranes were
incubated overnight at 4
Total RNA was extracted from cells according to instructions for the Trizol kit
(15596026, Thermofisher). miRNA and mRNA were then transcribed into cDNA
according to instructions for the miRNA cDNA Synthesis Kit (CW2141, Cowin bio.)
and the HiFscript cDNA Synthesis Kit (CW2569, Cowin bio.), respectively. Primer
5.0 software (PREMIER Biosoft, San Francisco, California, USA) was used to design
primers, which were then synthesized by Beijing Qingke Biotechnology. The primer
sequences are shown in Table 1. Next, the primers were added to cDNA, ddH
| Primer ID | 5’-3’ |
| ACTB-F | ACCCTGAAGTACCCCATCGAG |
| ACTB-R | AGCACAGCCTGGATAGCAAC |
| RNU6V-F | CTCGCTTCGGCAGCACA |
| RNU6V-R | AACGCTTCACGAATTTGCGT |
| LGALS1-F | TCGGGTGGAGTCTTCTGACA |
| LGALS1-R | ACGAAGCTCTTAGCGTCAGG |
| CPXM1-F | GCTGACCTCAACACACCACT |
| CPXM1-R | CATTCATGCCCCCGTGGAG |
| APLNR-F | GATGCCTGCCTCTTGTCTGT |
| APLNR-R | ATCCAGTAGGGGGTGGACTC |
| VIM-F | CCCTTGACATTGAGATTGCCACC |
| VIM-R | ACCGTCTTAATCAGAAGTGTCCT |
| CDH1-F | ATTTTTCCCTCGACACCCGAT |
| CDH1-R | TCCCAGGCGTAGACCAAGA |
| SNAI2-F | GCTACCCAATGGCCTCTCTC |
| SNAI2-R | CTTCAATGGCATGGGGGTCT |
| miR-22-3p-F | GCTGAGCCGCAGTAGTTCTT |
| miR-22-3p-R | GGCAGAGGGCAACAGTTCTT |
The cells in different groups were digested, counted, and seeded into 96 well
plates at a density of 1
Cells were grouped and then digested with trypsin, with PBS used as a washing agent. Experiments were performed strictly according to instructions for the Annexin V-APC/PI Apoptosis Detection Kit (KeyGEN BioTECH, KGA1030). Briefly, 500 uL of binding buffer was used to suspend the cells prior to testing, followed by the addition of 5 uL Annexin V-APC and 5 uL of propidium iodide. The mixture was left to stand for 10 min at room temperature and protected from light. Flow cytometry was then used for the measurement of fluorescence.
All cell experiments were conducted in triplicate. Data for each group are shown
as the mean
The TCGA-SKCM and GTEX datasets were screened to identify DEGs between the melanoma and control groups, while data from the GSE24996 dataset was screened to identify DEMs between these groups. All DEMs (Fig. 1A) and DEGs (Fig. 1B) are shown in the volcano plot, while the heatmap shows the top 45 DEMs (Fig. 1C). DEMs included miR-211-5p, miR-205-5p, miR-125b-5p, miR-200c-3p, miR-768-3p, and miR-22-3p.
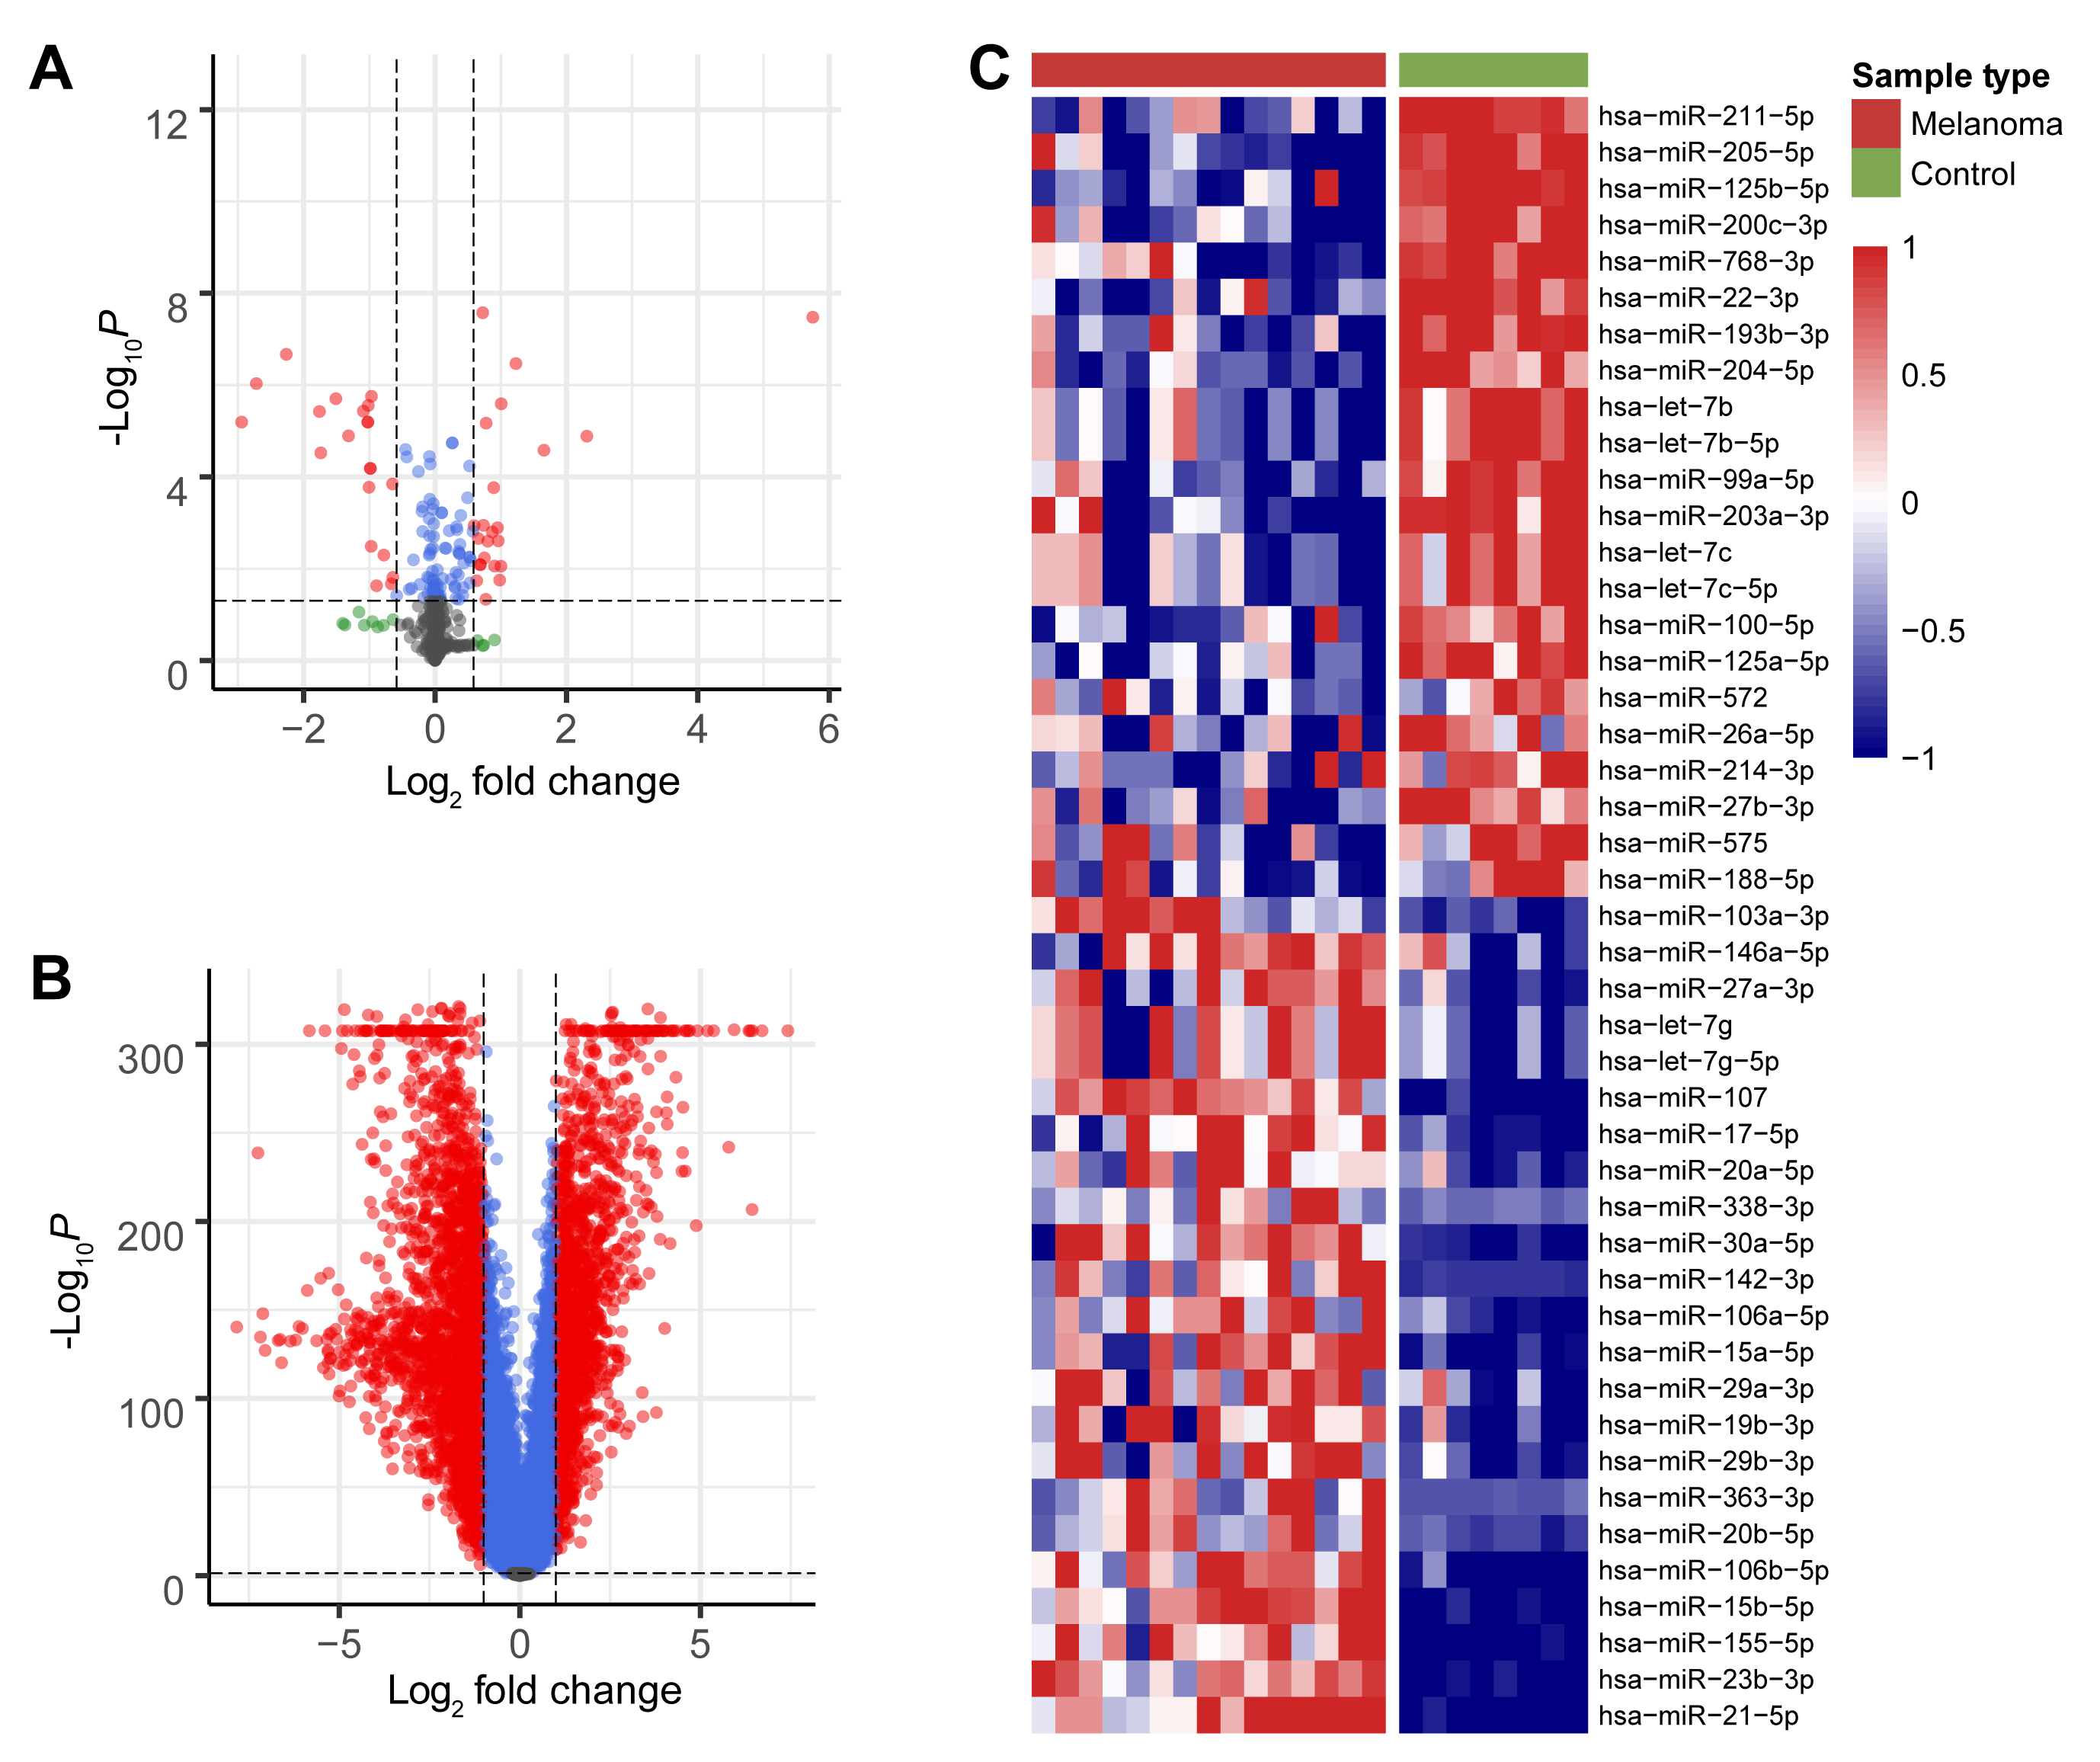 Fig. 1.
Screening for DEMs and DEGs. (A) Volcano plot of all miRNAs that were differently expressed between the melanoma
and control groups in the GEO database. (B) Volcano plot of all mRNAs that were
differently expressed between the melanoma and control groups in the TCGA and
GTEX databases. Red dots indicate significant up-regulation and down-regulation
of DEMs and DEGs between the two groups (
The 89 EMT-related DEGs are shown in the heatmap (Fig. 2A), and their correlation coefficients shown in Supplementary Table 1. EMT-related DEGs included ADAM19, ITGAM, DCSTAMP, PLAUR, CSF3R, LGALS1, CPXM1, and APLNR. Survival analysis was performed according to the expression of each of these 89 genes. Kaplan-Meier analysis showed that expression of three genes (LGALS1, CPXM1, APLNR) was significantly associated with patient survival. Low gene expression in the tumor tissue correlated with better patient survival (Fig. 2B). Next, Boxplots were drawn based on the expression level of these three genes in the melanoma and control groups. These showed that the expression of all three genes was higher in the melanoma group compared to the control group (Fig. 2C).
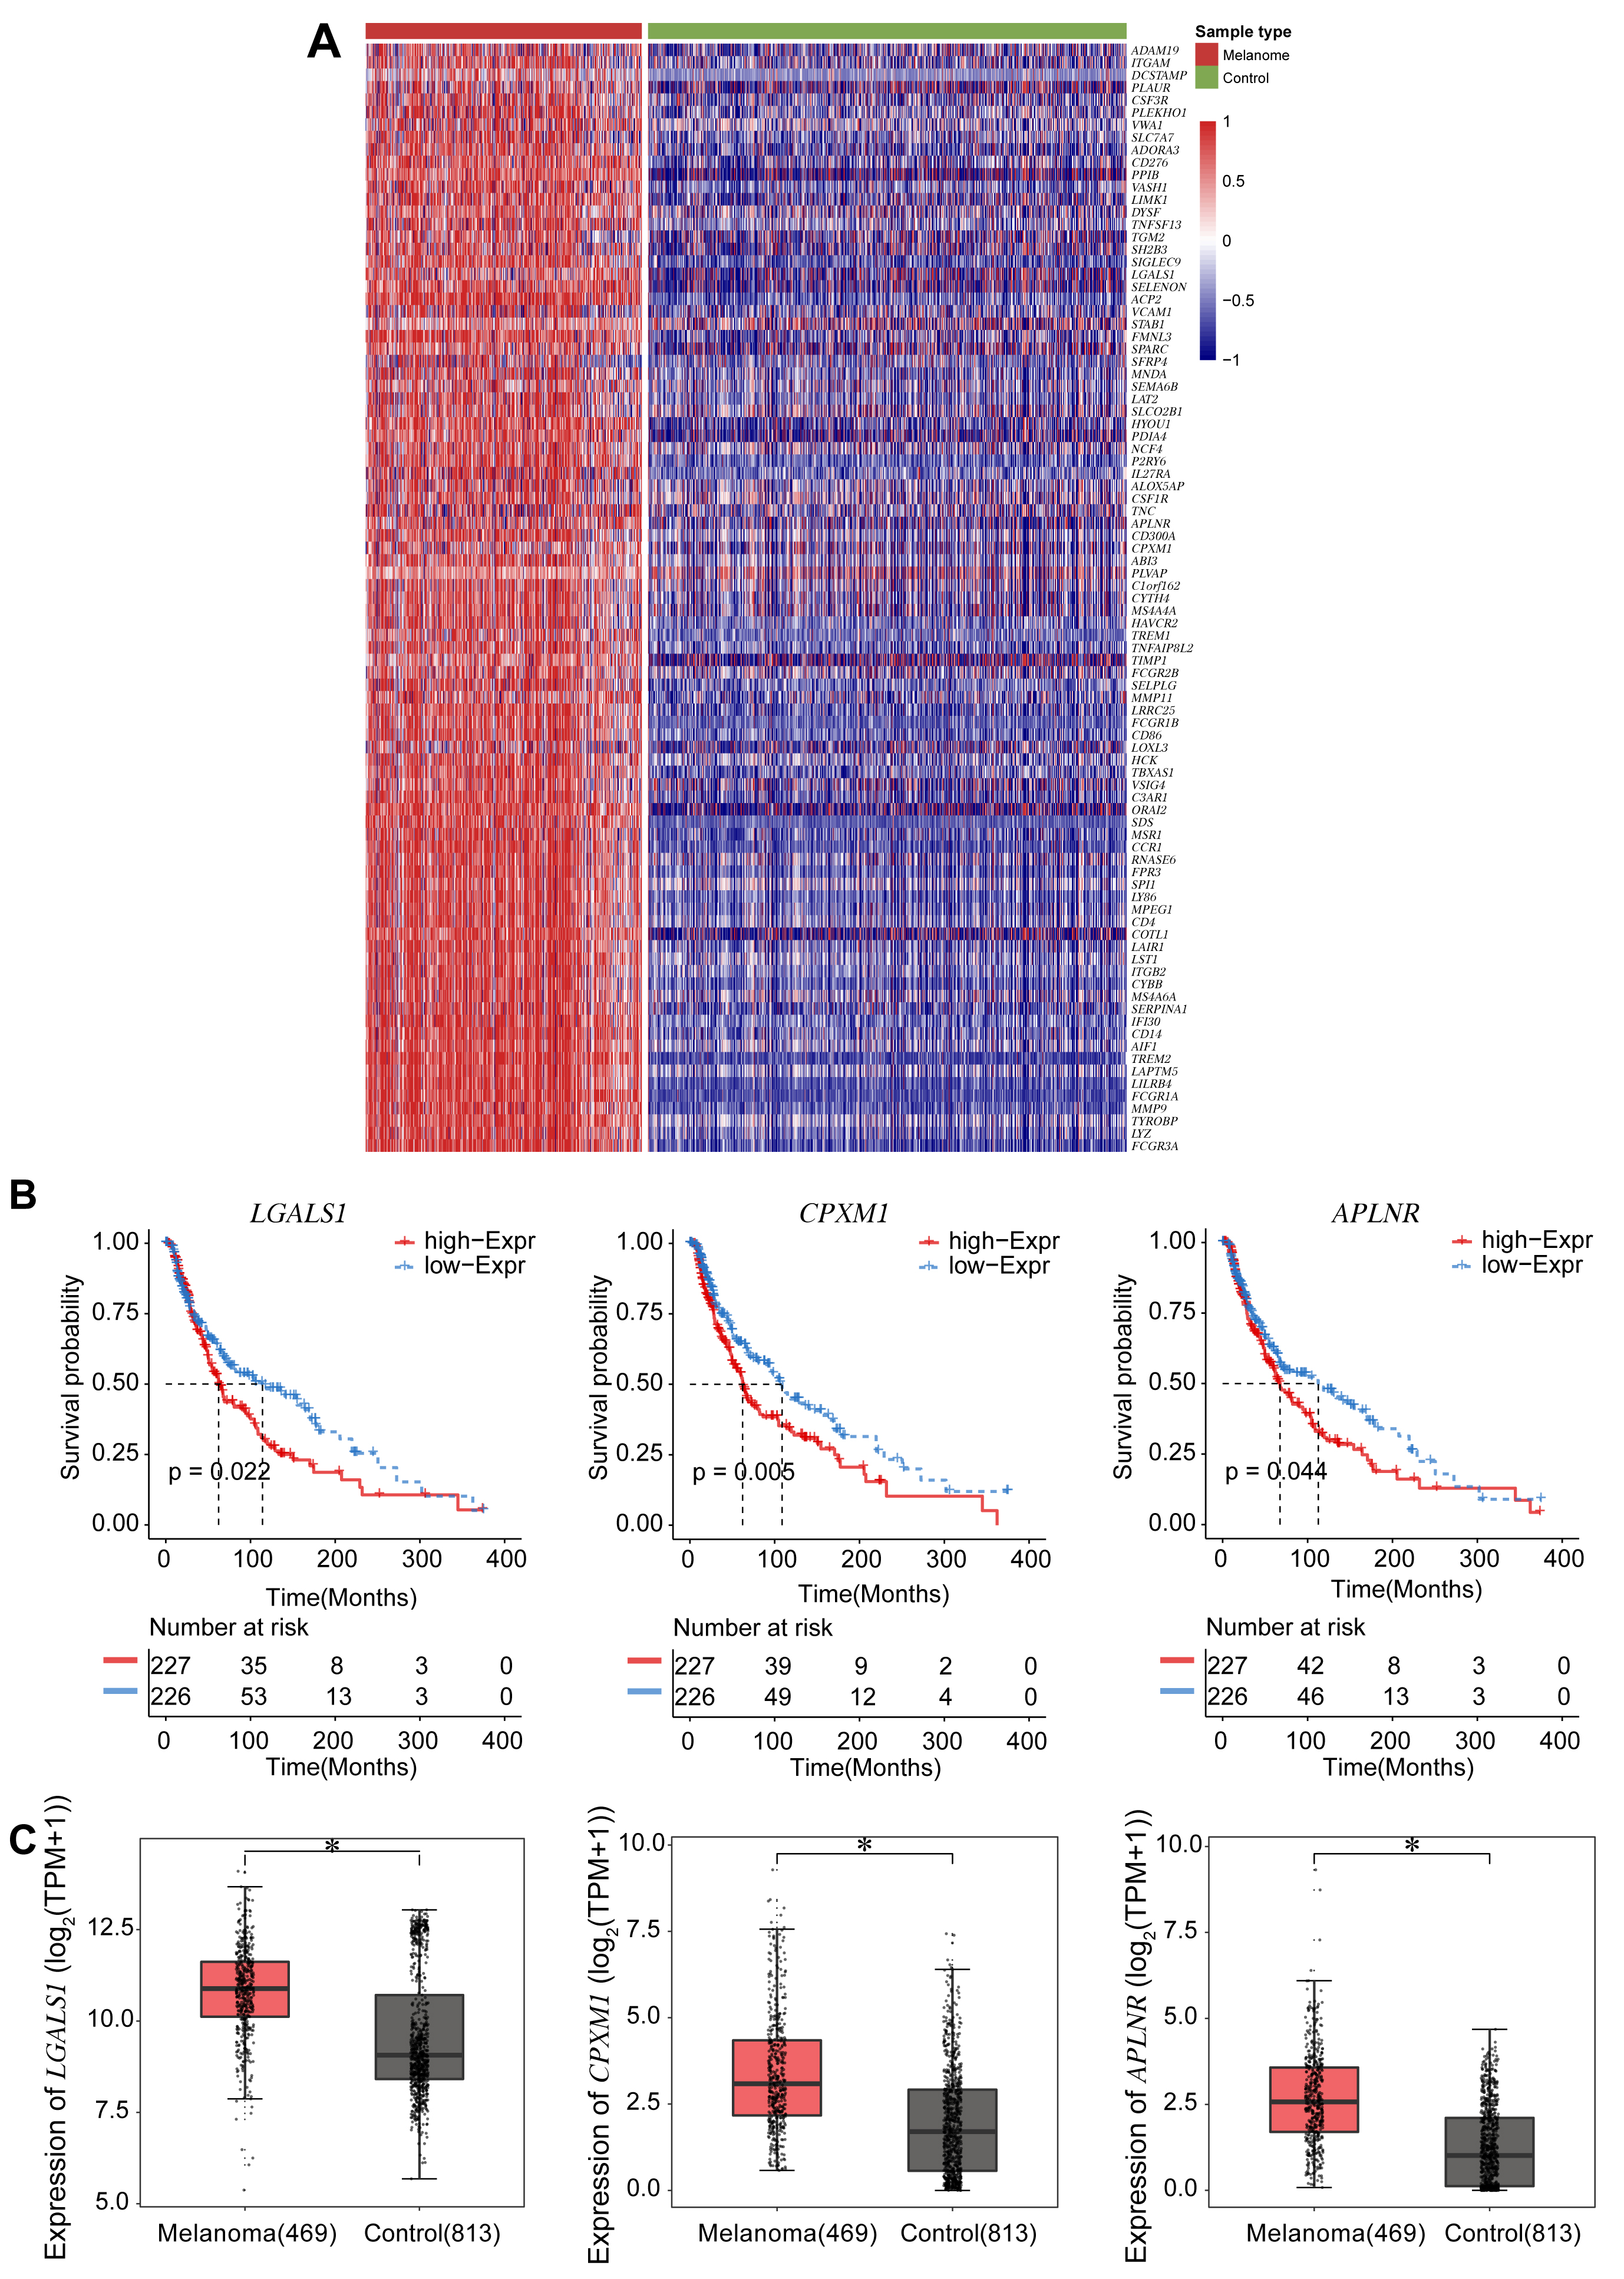 Fig. 2.
Survival analyses for the expression of three DEGs associated
with EMT. (A) Heatmap of 89 DEGs identified from the TCGA and the GTEX databases
and associated with EMT. Darker red corresponds to higher expression and darker
blue corresponds to lower expression. (B) Survival curves according to expression
of the DEGs LGALS1, CPXM1, and APLNR. The red line
represents the survival probability of patients with high gene expression, while
the blue line represents the survival probability of patients with low gene
expression. (C) Boxplots show the expression level of the three DEGs LGALS1, CPXM1, and APLNR in the melanoma and control groups.
*p
To confirm the observed differences in expression of the above three DEGs, we compared the expression levels of the LGALS1, CPXM1, and APLNR genes (Fig. 3A) and the LGALS1, CPXM1, and APLNR proteins (Fig. 3B) between PIG1 and WM-266-4 cells. Both the mRNA and protein levels for all three DEGs were significantly higher in WM-266-4 cells than in PIG1 cells, with the difference being greatest for LGALS1.
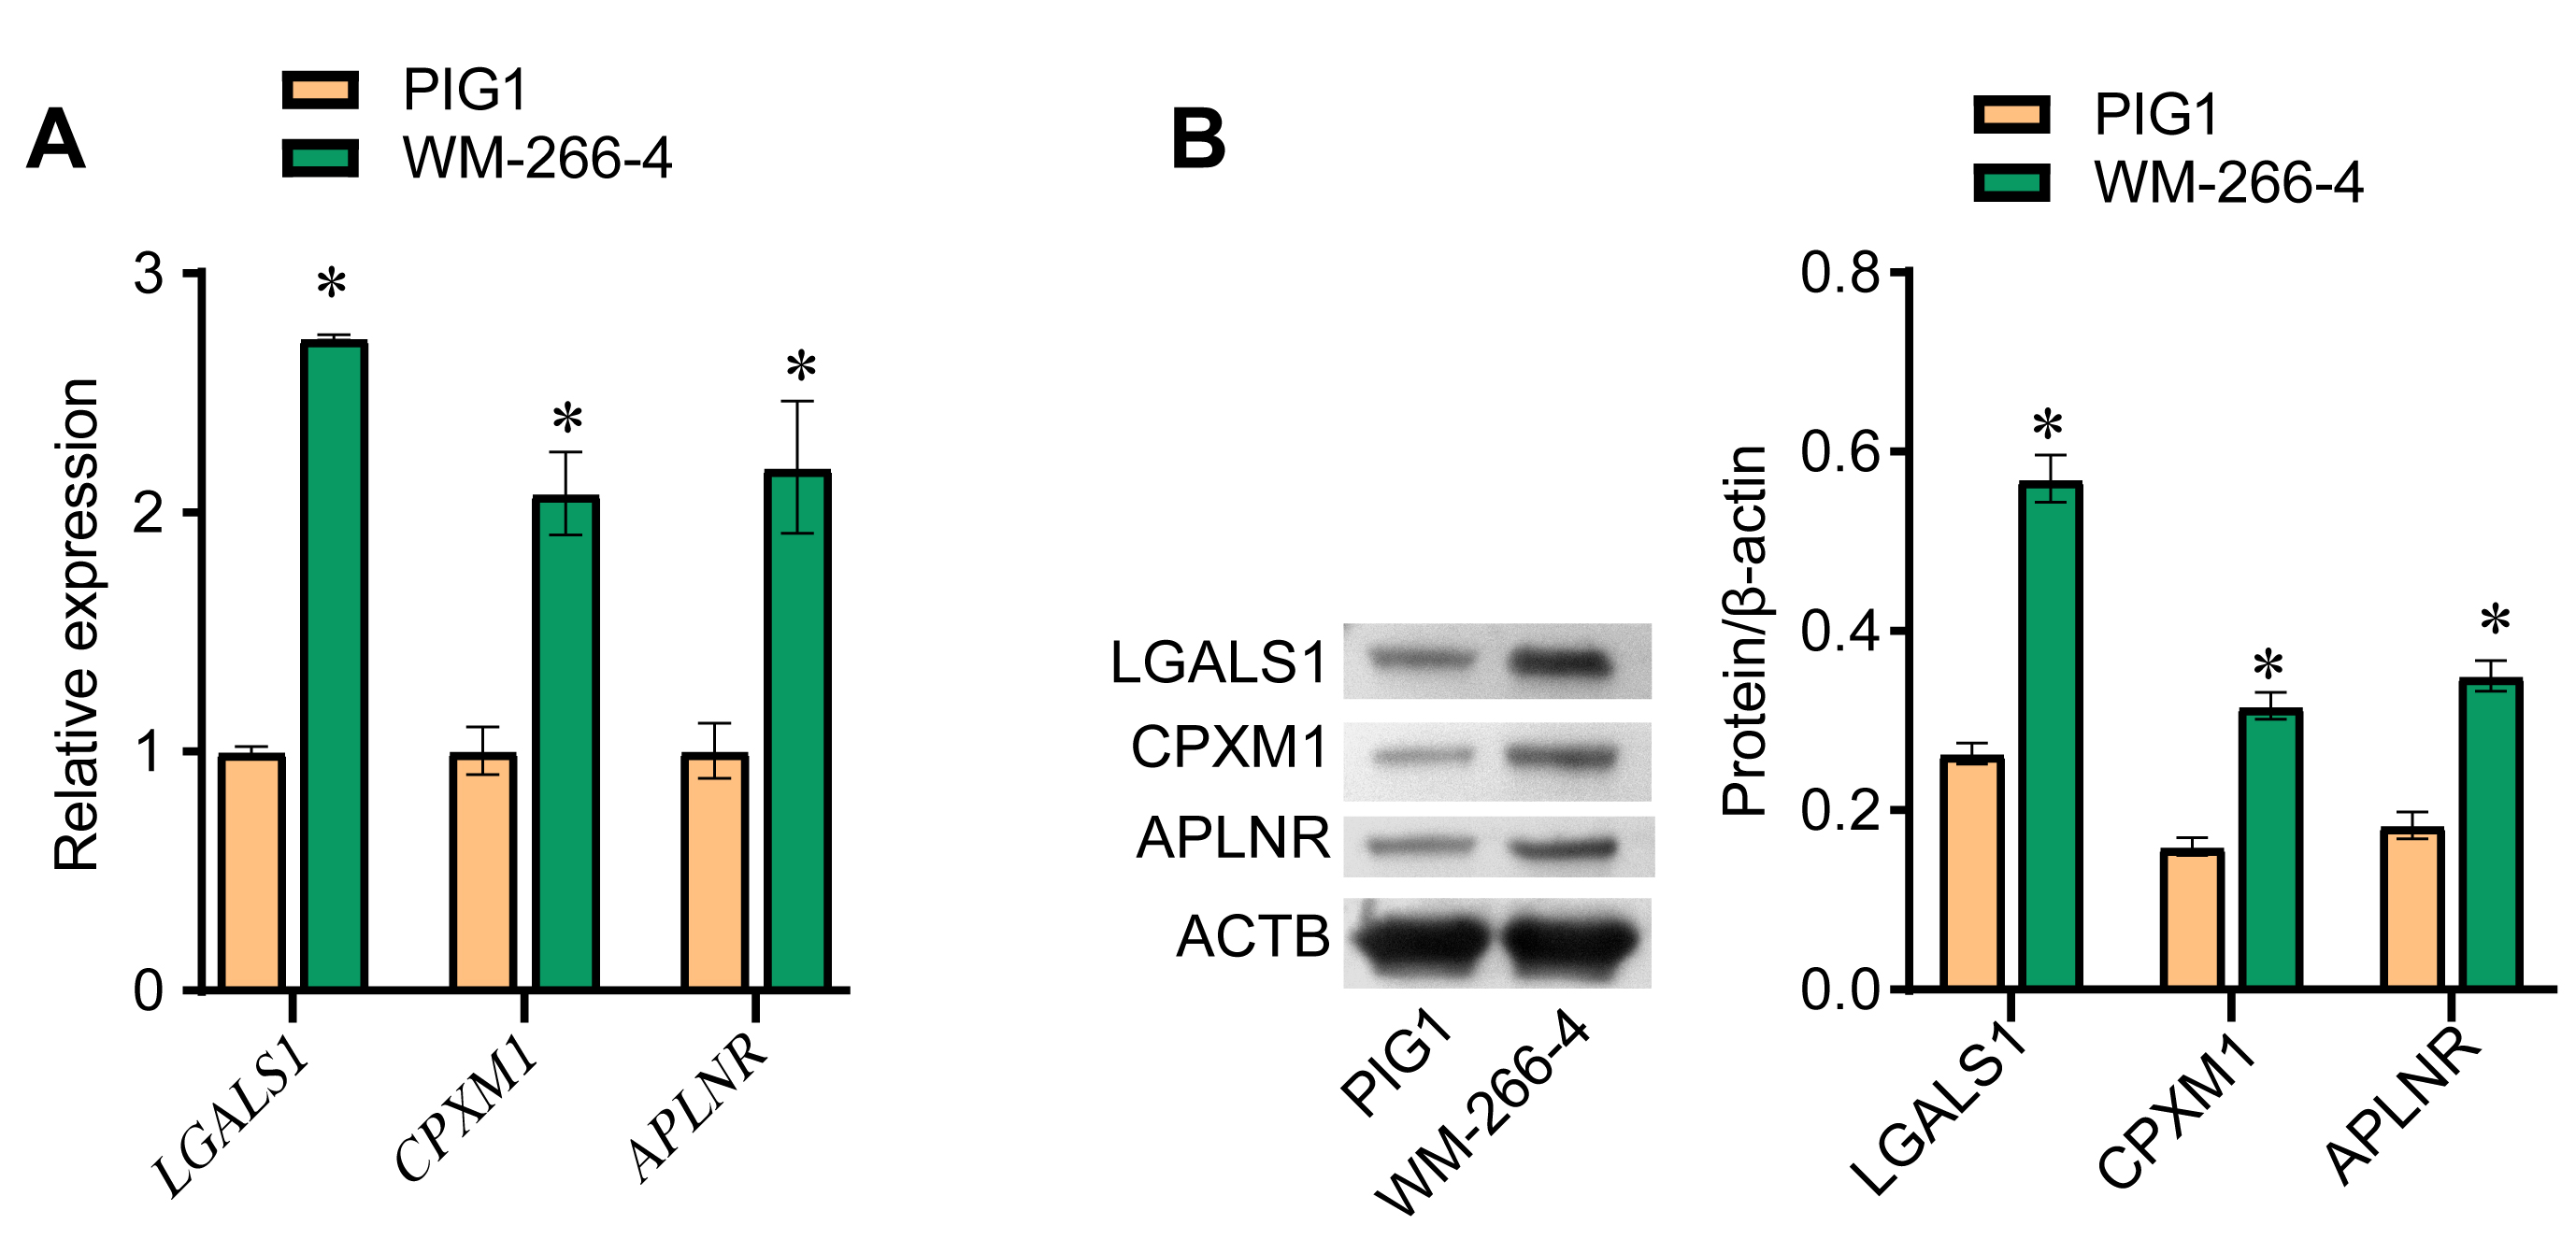 Fig. 3.
LGALS1 is highly expressed in melanoma cells. (A) qRT-PCR was
performed to evaluate LGALS1, CPXM1 and APLNR mRNA
expression in PIG1 and WM-266-4 cells. (B) Western blot was used to evaluate the
expression of LGALS1, CPXM1 and APLNR protein in PIG1 and WM-266-4 cells.
*p
LGALS1 was selected for the follow-up research because it showed the most difference in expression between melanoma and control. Three databases (pita, diana, and targetscan) were used to identify miRNAs predicted to target LGALS1. Only one miRNA, miR-22-3p, was found in all three databases to target LGALS1, as shown by Venn diagram (Fig. 4A). Boxplots showed that the expression of miR-22-3p in the melanoma group was lower than in the control group (Fig. 4B). Next, GO analysis and KEGG analysis were performed (Fig. 4C). GO analysis showed that in biological processes (BP), LGALS1-targeted miR-22-3p was significantly associated with endocytosis, platinum drug resistance, the sphingolipid signaling pathway, the AMPK signaling pathway, and proteoglycans in cancer. In cellular components (CC), LGALS1-targeted miR-22-3p bound to proximal promoter sequence-specific DNA binding, protein serine/threonine kinase activity, transcription cofactor binding, RNA polymerase II proximal promoter sequence-specific DNA binding, and enzyme activator activity. For molecular function (MF), LGALS1-targeted miR-22-3p was related to the dendritic spine, neuron spine, spindle, main axon, and cell leading edge. The KEGG signaling pathway was mainly enriched in learning or memory, cognition, regulation of GTPase activity, cell morphogenesis involved in neuron differentiation, regulation of cell morphogenesis, and regulation of neuron death. Next, qRT-PCR was used to confirm the expression of miR-22-3p in cells. The miR-22-3p level in PIG1 cells was higher than in WM-266-4 cells (Fig. 4D). The targeted binding of miR-22-3p to LGALS1 was predicted by LncBase Predicted v.2 (Fig. 4E) and confirmed using a dual luciferase experiment (Fig. 4F). The results demonstrated that miR-22-3p targeted LGALS1.
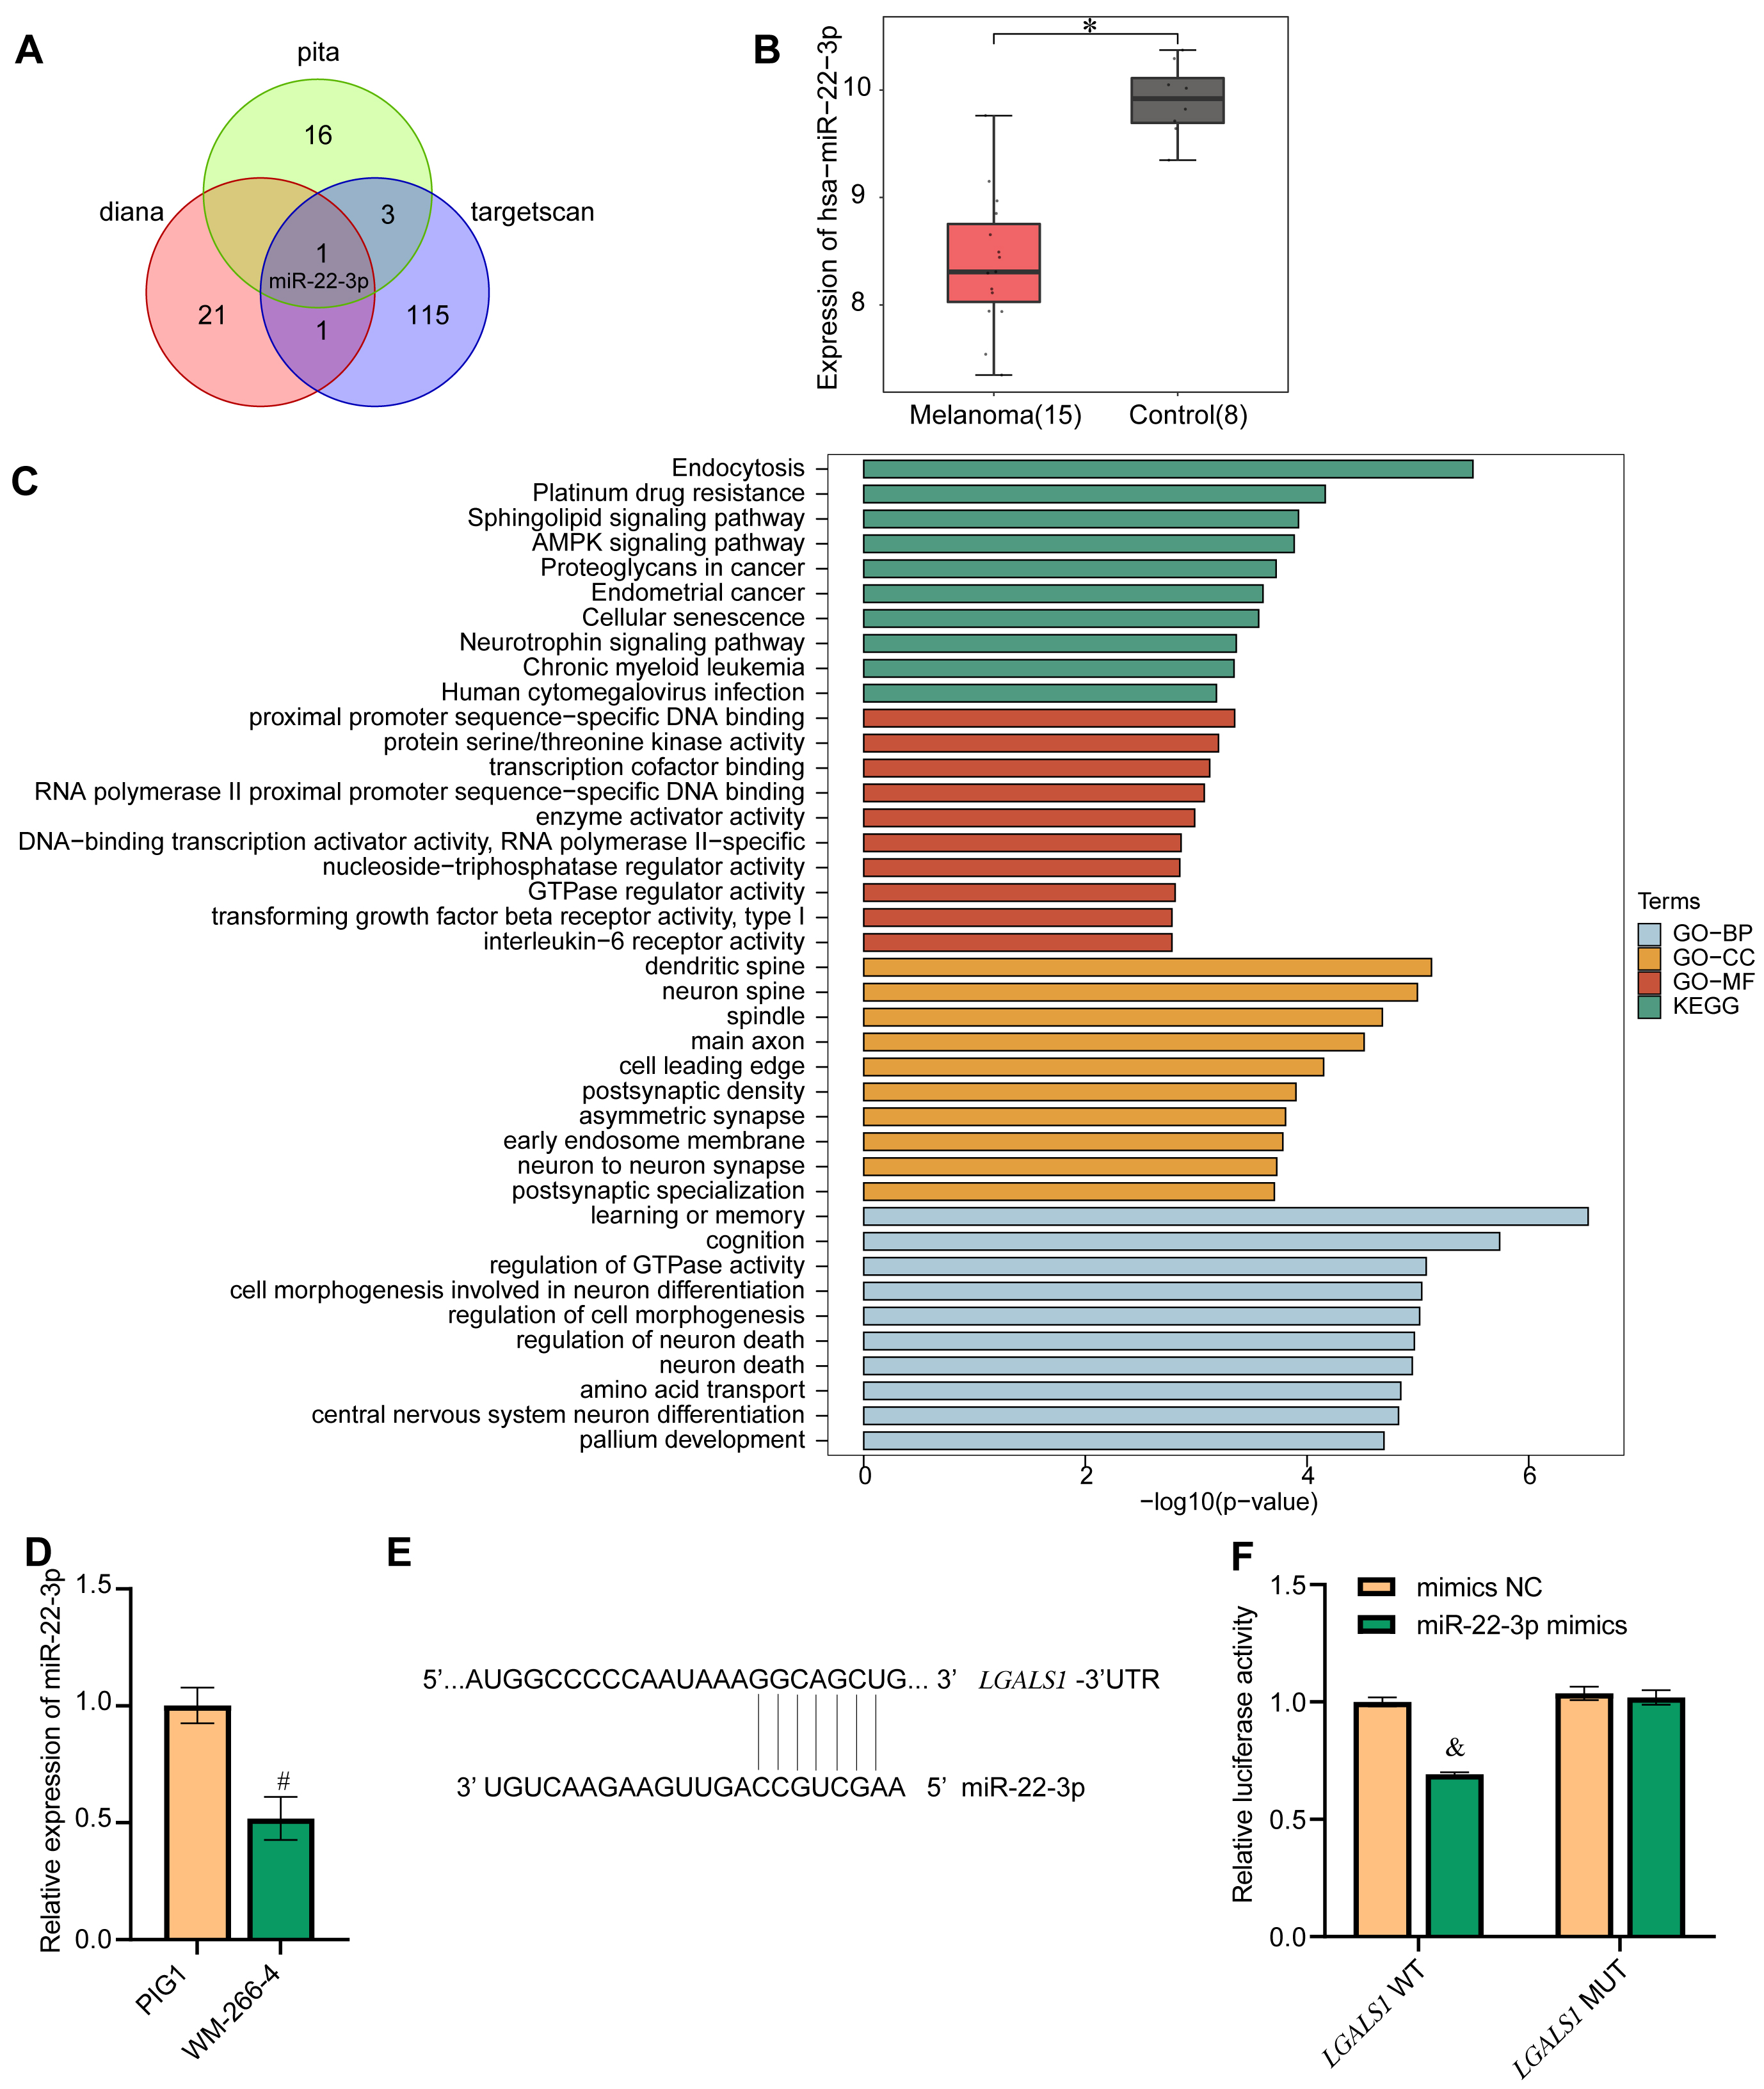 Fig. 4.
Screening for LGALS1-interacting miRNAs. (A) Venn diagram of
miRNAs identified to target LGALS1 in the pita, diana and targetscan databases.
Only one DEM, miR-22-3p, was identified in all three databases. (B) Confirmation
of miR-22-3p expression in the GEO database. (C) GO and KEGG functional
enrichment analysis of miR-22-3p. Blue represents biological process (BP)-related
functions in GO analysis. Yellow represents functions associated with cellular
components (CC) in GO analysis. Red represents functions related to molecular
function (MF) in GO analysis. Green represents KEGG functional analysis. (D)
qRT-PCR showing miR-22-3p expression in cells. (E) Bioinformatics prediction of
the LGALS1 binding site for miR-22-3p. (F) Dual luciferase experiments
were performed to verify the binding of LGALS1 to miR-22-3p. *p
The effect of miR-22-3p on EMT was investigated by overexpressing miR-22-3p in WM-266-4 cells. The qRT-PCR result showed that the expression of miR-22-3p in the miR-22-3p mimics group was significantly higher than in the mimics NC group, indicating successful overexpression of miR-22-3p in WM-266-4 cells (Fig. 5A). Cell viability was found to decrease significantly following the overexpression of miR-22-3p (Fig. 5B). In addition, flow cytometry showed that cell apoptosis increased after transfection with miR-22-3p mimics (Fig. 5D). The mRNA expression level of LGALS1 and other EMT-related genes (CDH1, VIM, and SNAI2), together with their protein expression level, was examined by qRT-PCR and western blot, respectively (Fig. 5C,E). The expression levels of LGALS1 and LGALS1 were significantly lower in the miR-22-3p mimics group than in the mimics NC group. Furthermore, the expression of LGALS1 and LGALS1 was negatively correlated with miR-22-3p. The expression of CDH1 and CDH1 was significantly higher in the miR-22-3p mimics group than in the mimics NC group, while the mRNA expression levels for VIM, VIM, SNAI2, and SNAI2 were significantly lower in the miR-22-3p mimics group. These results indicate that miR-22-3p can inhibit EMT.
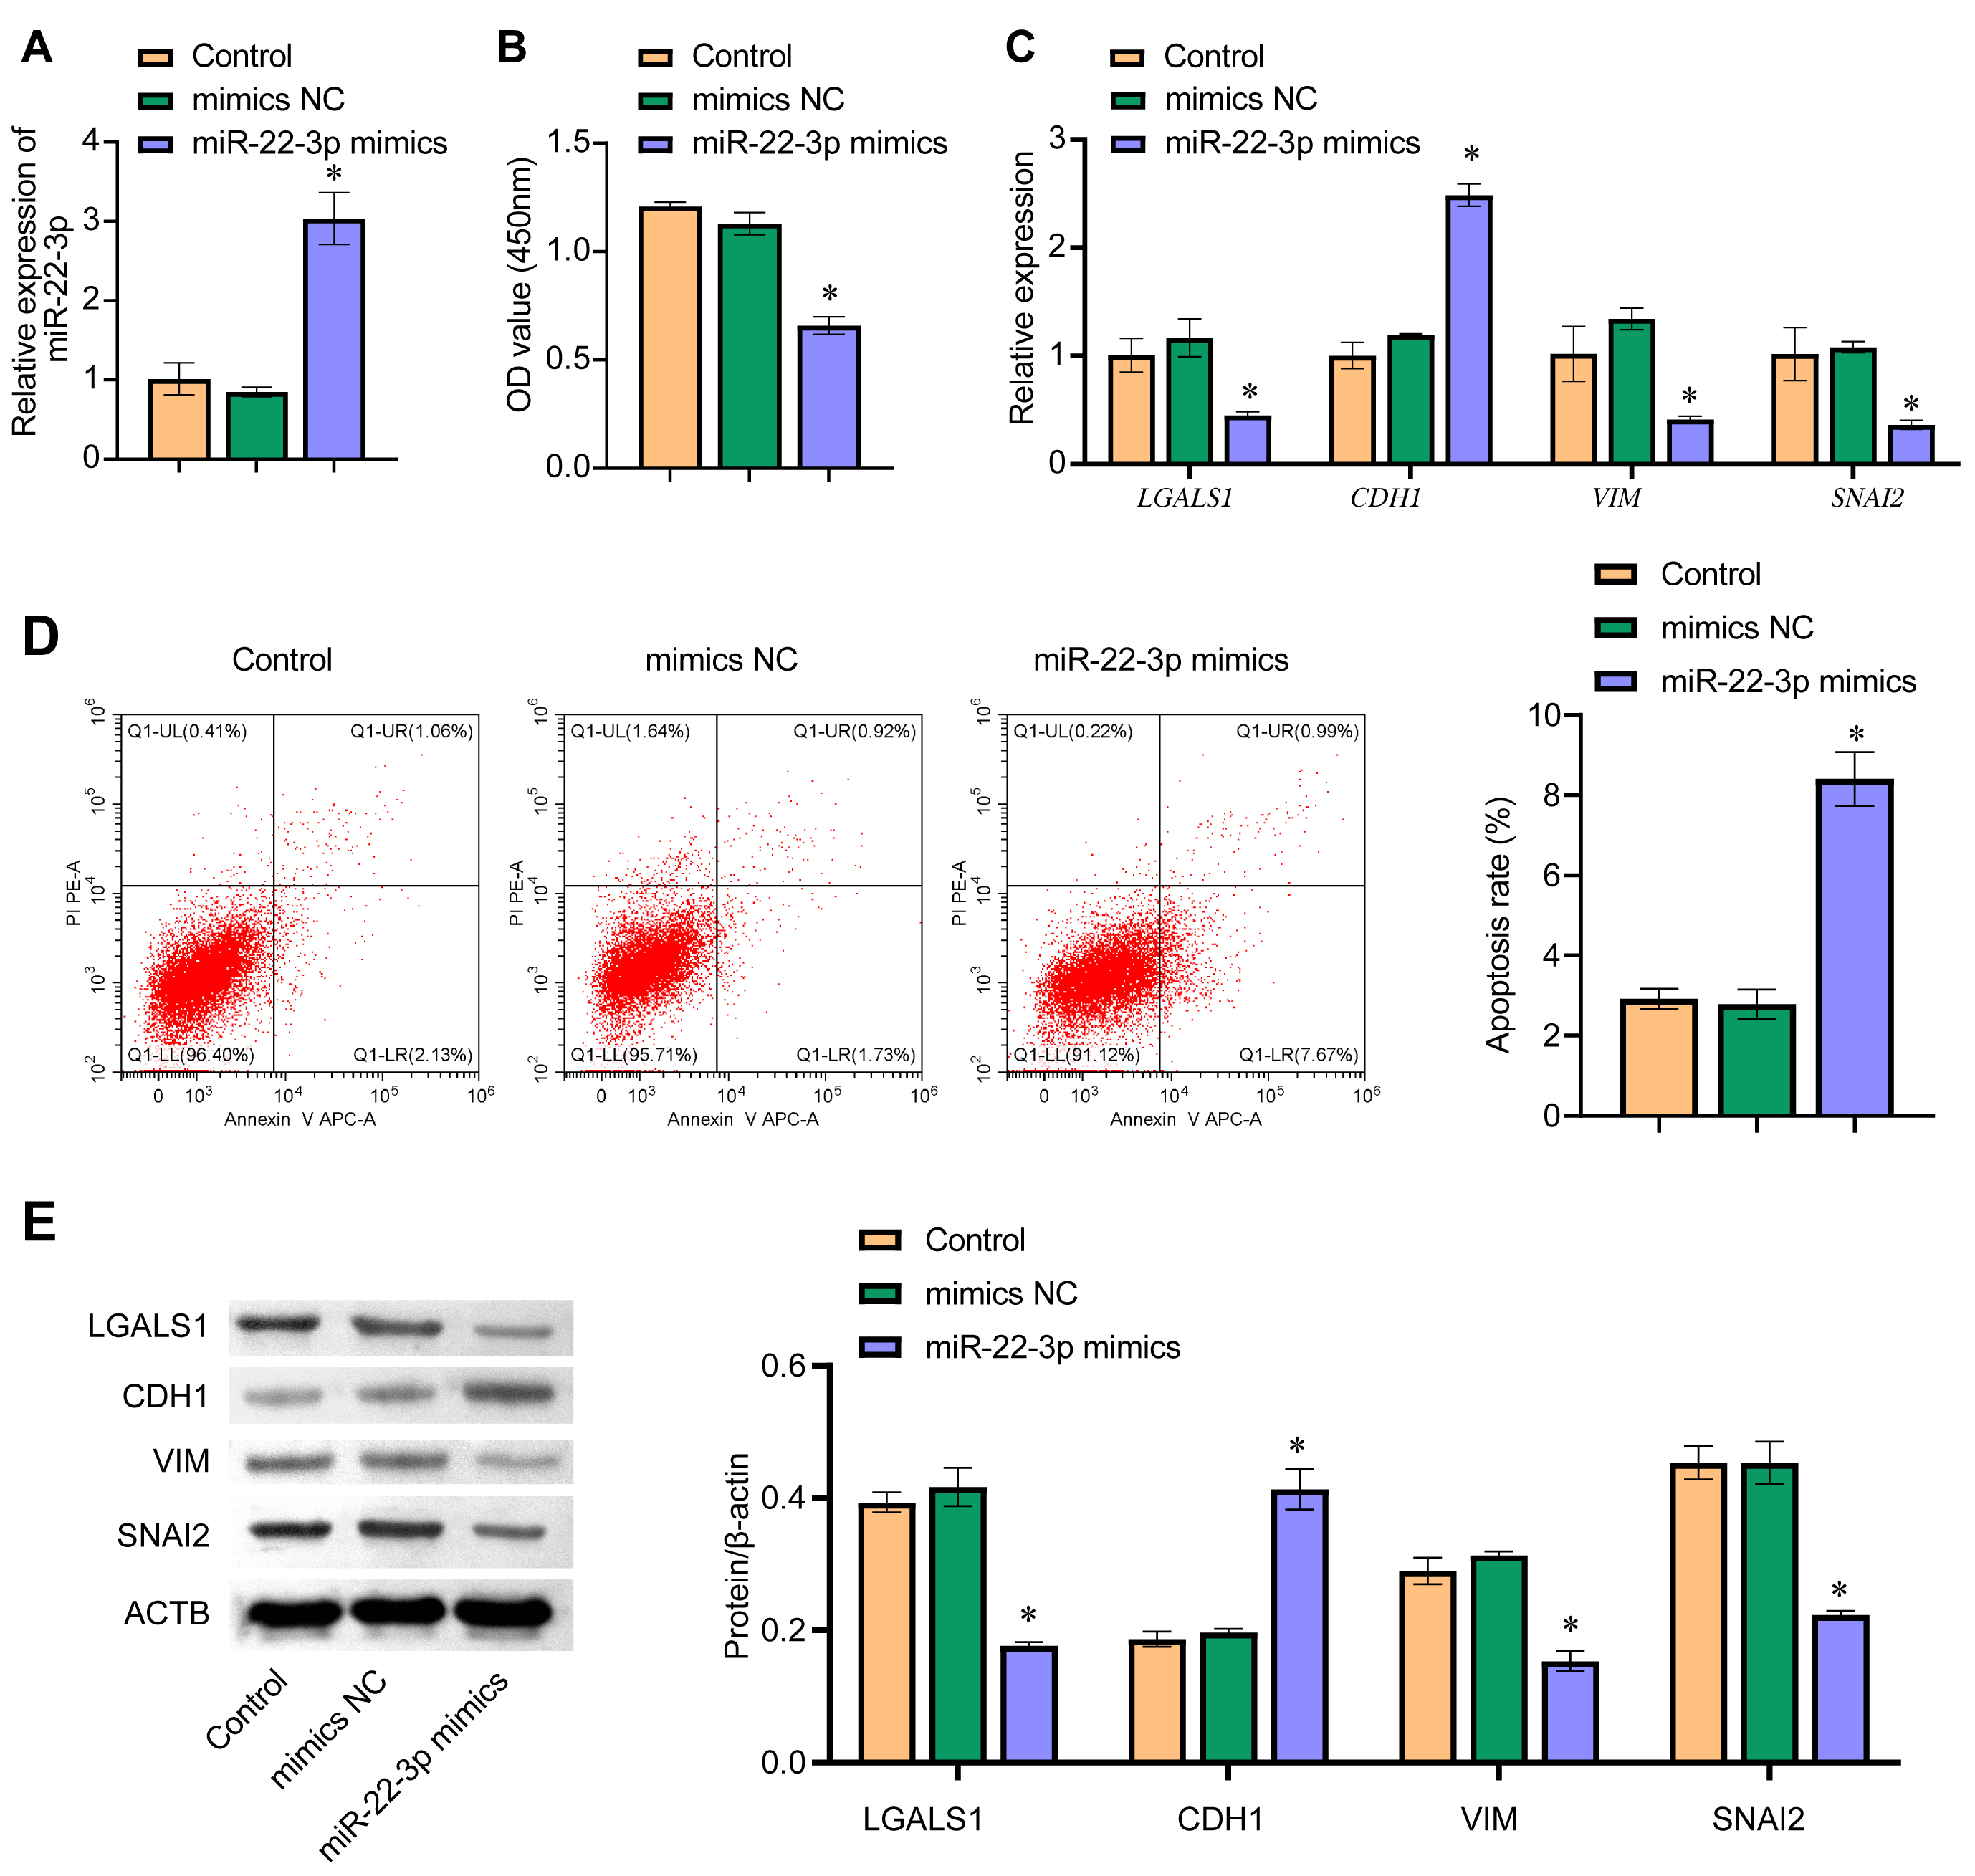 Fig. 5.
miR-22-3p regulates EMT. (A) The expression level of miR-22-3p
in WM-266-4 cells was evaluated by qRT-PCR. (B) CCK8 was used to determine
WM-266-4 cell viability, with absorbance measured at 450 nm. (C) qRT-PCR was used
to determine the cellular mRNA levels for LGALS1, CDH1,
VIM, and SNAI2. (D) Detection of apoptosis by flow cytometry.
(E) Cellular protein levels for LGALS1, CDH1, VIM, and SNAI2 were determined by
western blot. *p
The exosomes secreted by MSCs were isolated and observed by transmission electron microscopy (TEM) to be round vesicles with a diameter of about 50 nm (Fig. 6A). Western blot assay was used to detect the exosome-associated proteins CD63 and HSPA4. Both proteins were expressed in the MSC-exos group (Fig. 6B). Next, PCR revealed that miR-22-3p expression was higher in the MSC-exos group than in the MSC group (Fig. 6C). These results indicate that exosomes secreted by MSCs contain a large amount of miR-22-3p. The uptake of exosomes by WM-266-4 cells was observed by confocal fluorescence microscopy (Fig. 6D).
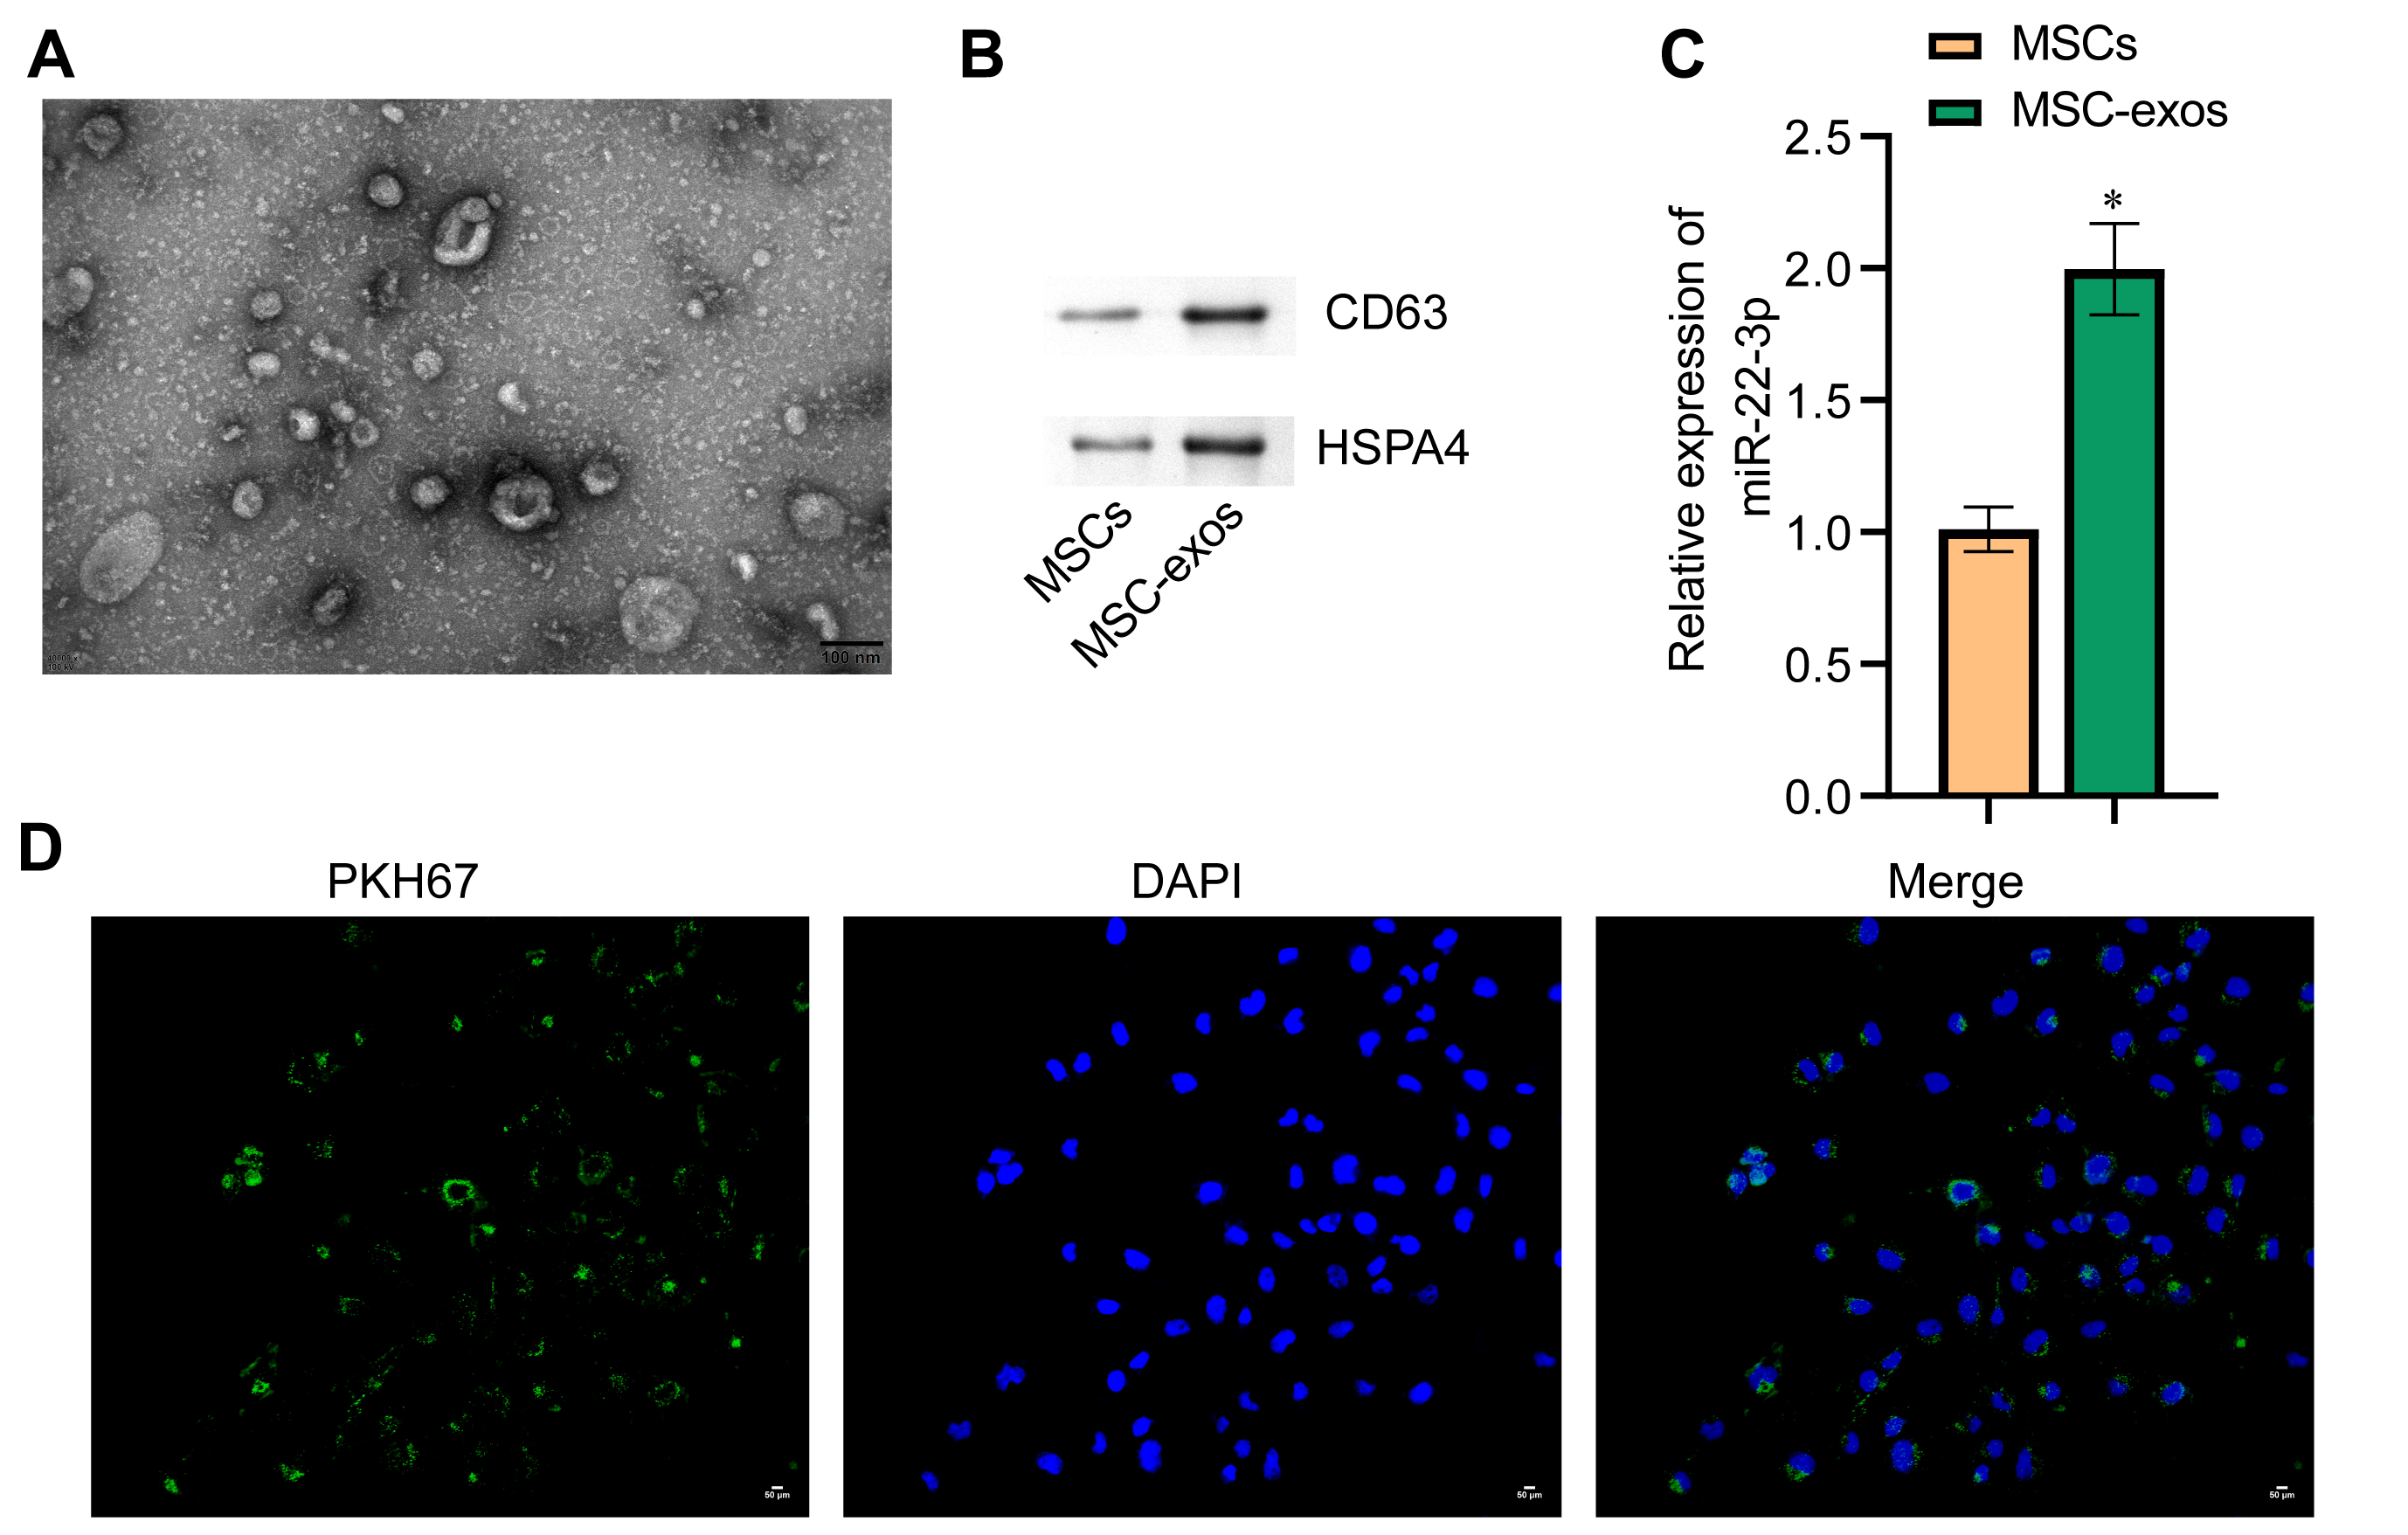 Fig. 6.
Identification of MSC-EXOs and uptake of exosomes by melanoma
cells. (A) Exosome morphology examined by TEM. The diameter of exosomes was
about 50 nm (scale bar = 100 nm). (B) Western blot technique was used to
determine protein levels for the exosome markers CD63 and HSPA4. (C) qRT-PCR was
used to determine miR-22-3p levels in cells and exosomes. (D) PKH67 labeling was
used to observe exosome uptake. Green represents exosomes, while blue represents
cell nuclei. *p
The amount of miR-22-3p in each cell group was evaluated. The expression of
miR-22-3p in the MSC-exos
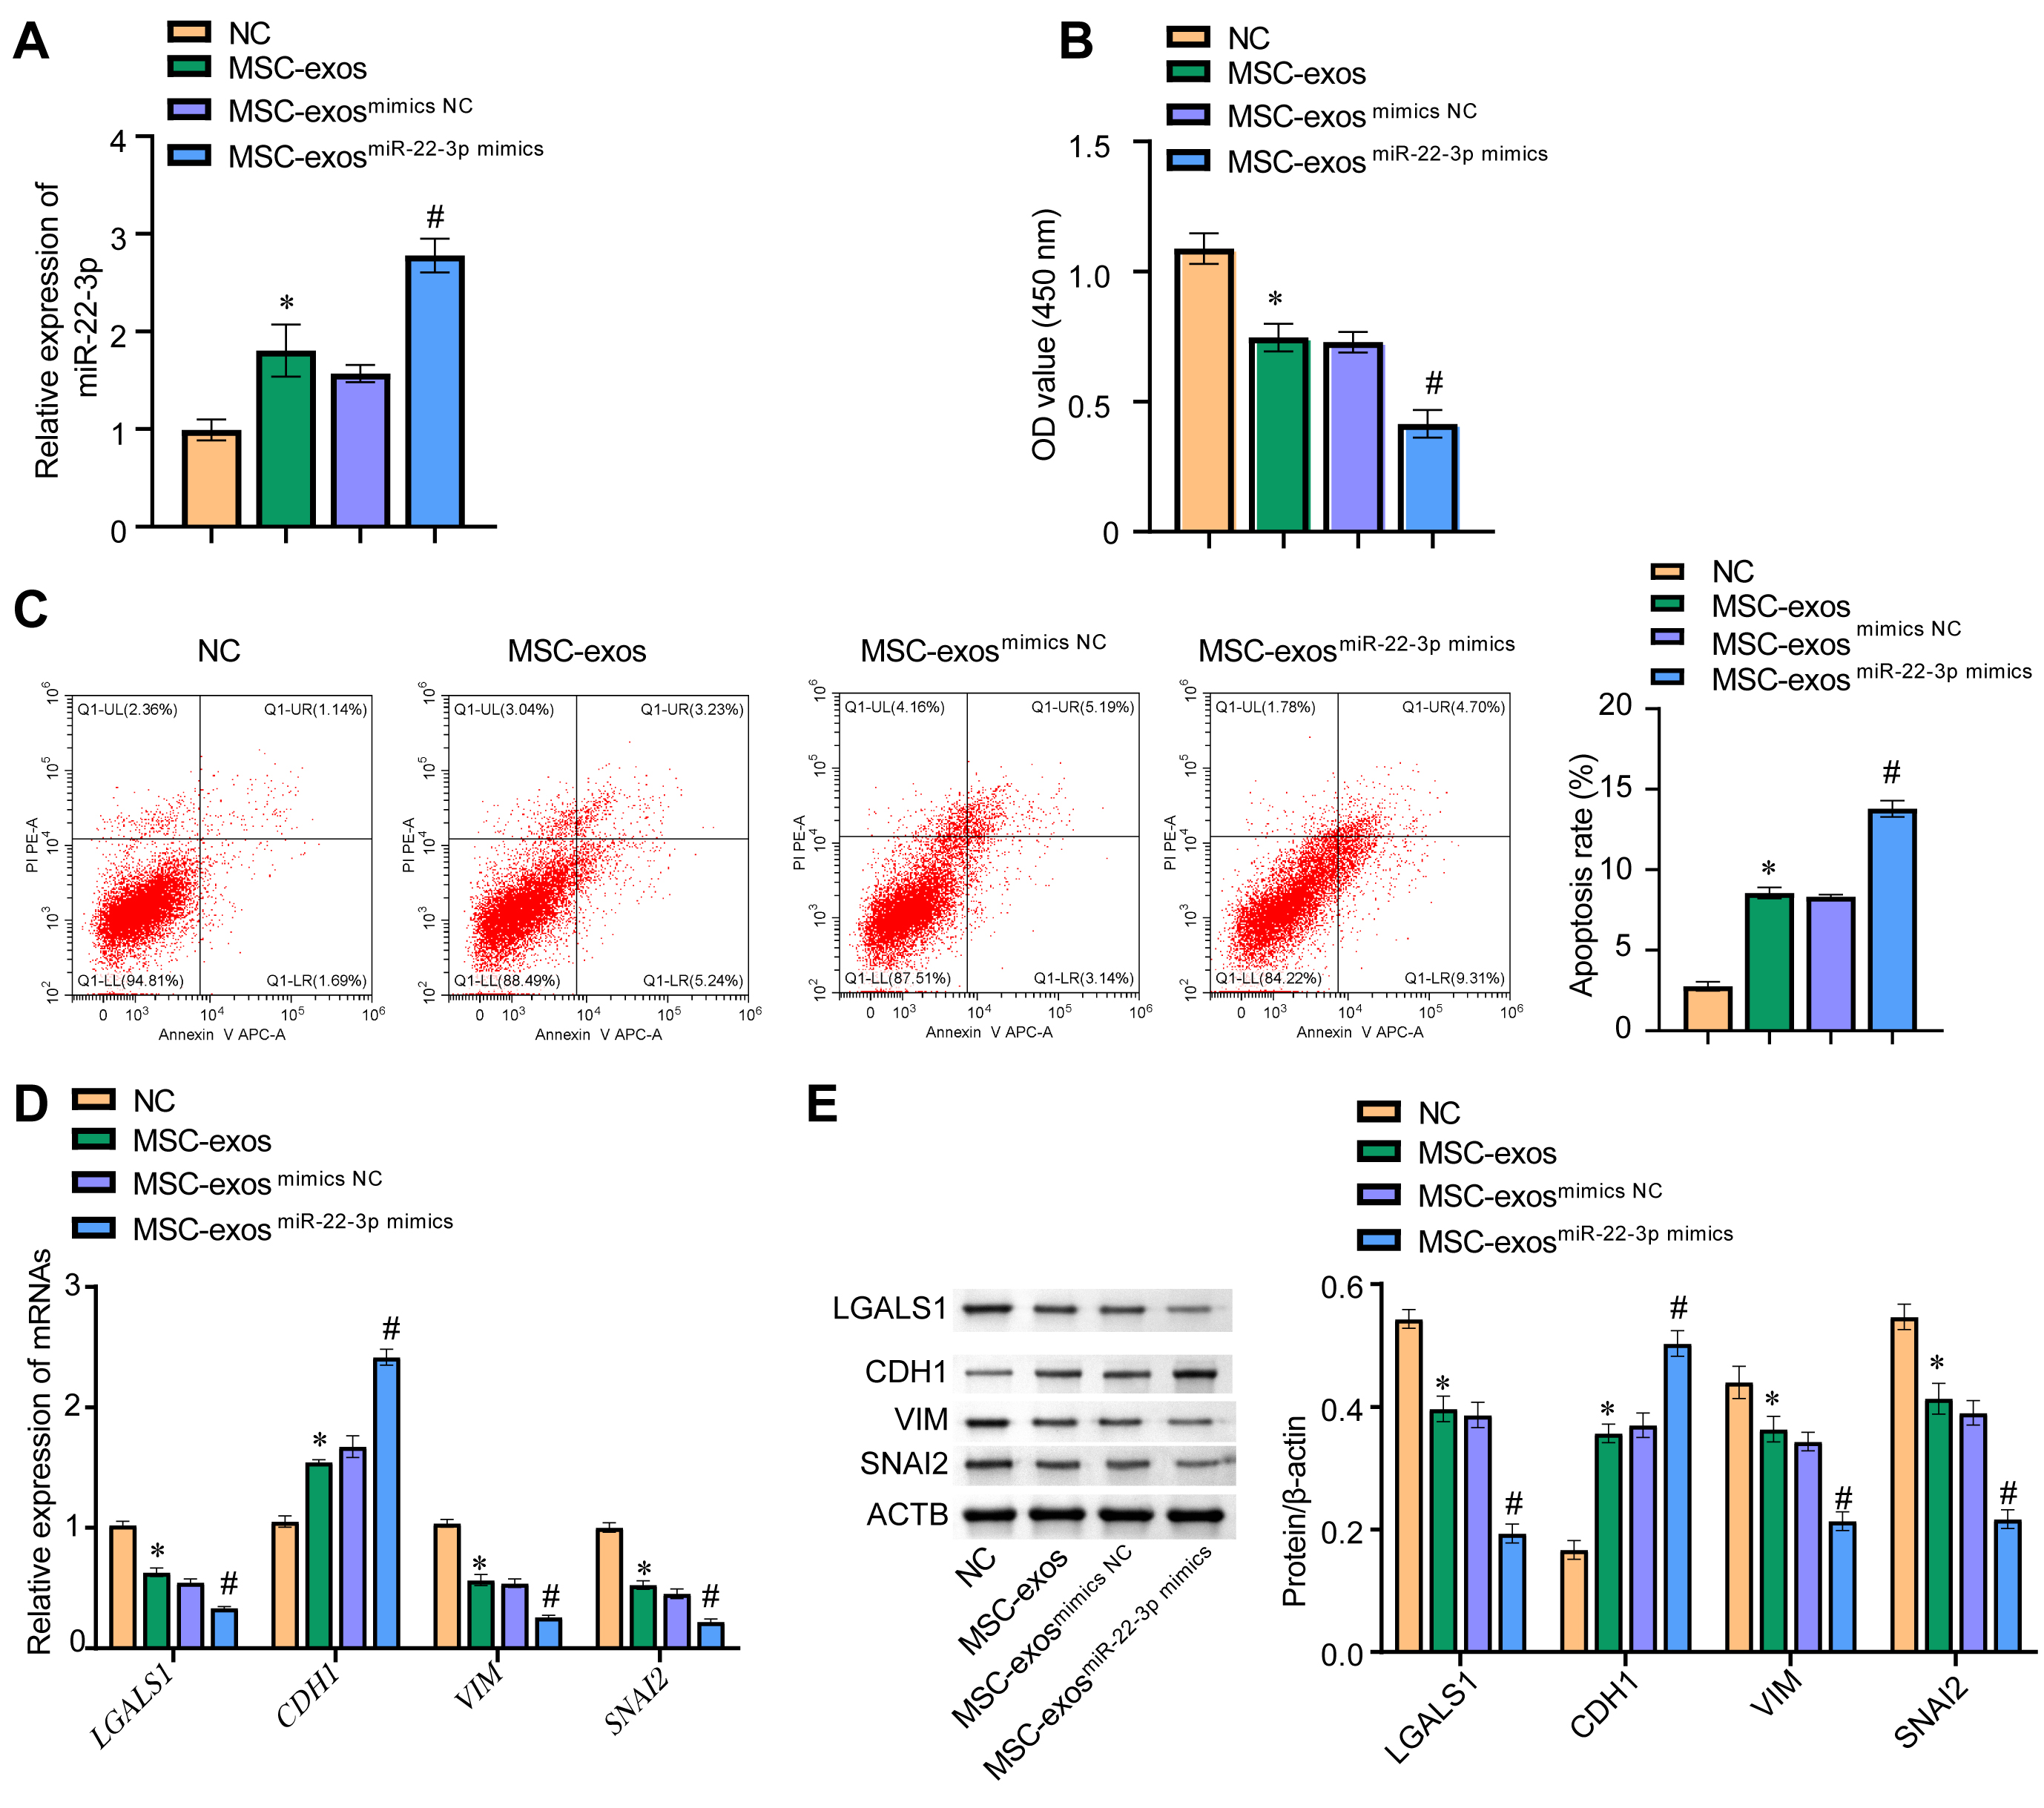 Fig. 7.
miR-22-3p in MSC-exos inhibited EMT of melanoma cells by
regulating LGALS1. (A) The expression level of miR-22-3p in WM-266-4 cells was
evaluated by qRT-PCR. (B) The cck8 assay was
used to evaluate the viability of WM-266-4 cells by measuring absorbance at 450
nM. (C) Cell apoptosis was detected by flow cytometry. (D) qRT-PCR was used to
measure mRNA levels for LGALS1, CDH1, VIM, and
SNAI2 in WM-266-4 cells. (E) Western blot was used to determine the
protein levels of LGALS1, CDH1, VIM, and SNAI2 in WM-266-4 cells. *p
Melanoma is a rare primary skin tumor [16]. Melanoma has a high incidence and a poor prognosis [16]. Therefore, considerable effort is still required to find novel targets for melanoma that lead to early diagnosis and new treatments.
In recent years, bioinformatics has greatly improved the efficiency of target prediction for various diseases [17]. Bioinformatics analysis was used here to screen large databases for DEGs and for predicting the biological functions of candidate targets [18]. By downloading data on ovarian cancer from the GEO database, Yang et al. [19] identified 62 candidate small molecules associated with this disease. These could be used as potential targets for novel drugs to treat ovarian cancer [19]. More recently, bioinformatics analysis has also been widely used in melanoma research. Wang et al. [20] used bioinformatics analysis to construct a melanoma ceRNA network. These authors identified 5 miRNAs (miRNA-29c, miRNA-100, miR-142-3p, miR-150, miR-516a-2), 6 lncRNAs (lncRNA AC068594.1, C7orf71, FAM41C, GPC5-AS1, MUC19, LINC00402) and 7 mRNAs (CCDR9, CNR2, DIRAS2, ESRP2, FAM83C, KCNT2, USH1G) that were aberrantly expressed in melanoma [20]. They postulated their findings could provide a basis for the early prevention and treatment of subsequent melanoma. In the present study, we used bioinformatics analysis to identify multiple DEMs and DEGs in melanoma. The top 45 DEMs and top 90 DEGs were listed, and the expression levels of three genes (LGALS1, CPXM1, APLNR) and their association with patient survival were analyzed. The expression of these genes was confirmed to be higher in melanoma cells than in normal skin melanocytes. LGALS1 was selected for additional follow-up studies.
It has been reported previously that LGALS1 is associated with melanoma
progression [21]. It is also known to induce EMT in ovarian, liver, and other
cancer types [22, 23, 24]. However, a regulatory role for LGALS1 on EMT in
melanoma has not yet been reported. Our bioinformatics analyses predicted that
LGALS1 was a target for miR-22-3p binding. Dual luciferase experiments
were performed to confirm this binding. We next analyzed the enrichment pathways
of genes targeted by miR-22-3p. The BPs of these genes were concentrated in
endocytosis and platinum resistance. Previous studies have also reported that
miR-22-3p functions were enriched in endocytosis and platinum drug resistance
[25, 26]. For CC, genes targeted by miR-22-3p were enriched in proximal promoter
sequence-specific DNA binding. Previous studies have shown that genes regulated
by miR-22-3p are closely related to transcription factor activity RNA polymerase
II core promoter proximal region sequence-specific binding [27]. For MF,
miR-22-3p was associated with neuron spine, main axon, and cell leading edge. A
prior study also showed that miR-22-3p could regulate the neuron spine [28]. For
the KEGG pathway, miR-22-3p was involved in learning or memory, cognition.
Another study reported a low level of miR-22-3p expression in the cerebrospinal
fluid of exercisers [29]. After exercise, people fall into a state of fatigue,
suggesting that miR-22-3p could regulate cognition by the brain. Various cancers
including melanoma are regulated by EMT [30]. Wei et al. [8] showed that
RNF128 affects the EMT process of melanoma by acting on the ubiquitination of
CD44 and CTTN in melanoma cells through the Wnt/
After coating with miRNAs, exosomes are transported to cancer cells for action, thus effectively solving the difficult problem of target recognition [35]. Several studies have shown that miRNAs contained in exosomes secreted by MSCs can affect tumor cells [7]. Che et al. [36] showed that by encapsulating miR-143 within exosomes secreted by MSCs, TFF3 could be regulated in prostate cancer cells, thereby inhibiting the migration and invasion of cancer cells. Naseri et al. [37] demonstrated that exosomes secreted by MSCs could also serve as delivery vehicles for small-molecule drugs such as anti-miR-142-3p. In the current study, exosomes secreted by MSCs were also used to study the delivery of miR-22-3p. By overexpressing miR-22-3p in MSCs, we found that exosomes could accurately and efficiently deliver miR-22-3p into WM-266-4 cells, thereby inhibiting the EMT of WM-266-4 cells. These results may provide a novel approach for the treatment of melanoma. However, future research will also need to investigate whether miR-22-3p and LGALS1 can regulate the EMT of melanoma cells in animal studies and clinical trials, thereby inhibiting the progression of melanoma.
Bioinformatics analysis was used to identify three genes (LGALS1, CPXM1, APLNR) that were differentially expressed in melanoma. miR-22-3p can target LGALS1 and inhibit the EMT process in melanoma cells, thereby preventing the development of melanoma. Moreover, exosomes secreted by MSCs can be loaded with miR-22-3p, thus regulating the EMT process in melanoma cells.
All data included in this study are available upon request by contact with the corresponding author.
HL, TC, BT—Conceptualization, Methodology, Software, Supervision; YC, YF—Data curation, Validation, Writing- Original draft preparation, Writing- Reviewing and Editing; LL—Visualization, Investigation. All the authors above approved the version of the manuscript to be published.
Not applicable.
Not applicable.
This research received a funding from Natural Science Foundation of Hunan Province of China (Grant/Award Number: 2020JJ4533).
The authors declare no conflict of interest.
Publisher’s Note: IMR Press stays neutral with regard to jurisdictional claims in published maps and institutional affiliations.