


 , Xia Liu 1,*
1 School of Chemistry, Chemical Engineering and Life Sciences, Wuhan University of Technology, 430070 Wuhan, Hubei, China
2 Key Laboratory of Beijing for Identification and Safety Evaluation of Chinese Medicine, Institute of Chinese Materia Medica, China Academy of Chinese Medical Sciences, 100700 Beijing, China
3 National Engineering Technology Research Center for Miao Medicine, College of Pharmaceutical Sciences, Guizhou University of Traditional Chinese Medicine, 550025 Guiyang, Guizhou, China
Academic Editor: Changsoo Kim
Abstract
Background: Gentiana plants, which have great medicinal and ornamental value, are widely distributed in diverse habitats and have complex taxonomy. Here 40 Gentiana chloroplast genomes were used for comparative genomic analysis and divergence time estimation. Methods: The complete chloroplast genome of G. rhodantha was sequenced, assembled, and annotated. Comparative genomic and phylogenetic analysis were provided for variation analysis of Gentiana. Results: Gentiana species satisfy the characteristics of intra-Sect conservation and inter-Sect variation in chloroplast genome structure and IR boundaries. All Gentiana Sects can be clustered into a single one and separated from each other; however, Ser. Apteroideae and Ser. Confertifoliae in Sect. Monopodiae are more closely related to Sect. Frigida and Sect. Cruciata, respectively. Gentiana has experienced two large gene loss events; the first, the collective loss of the rps16 gene at genus formation and the second, the collective loss of the ndh gene when Ser. Ornatae and Ser. Verticillatae completed their differentiation. Comparative genomic analysis support that Sect. Stenogyne and Sect. Otophora became the independent genera Metagentiana and Kuepferia. Seven divergence hotspot regions were screened based on Pi values, and could serve as DNA-specific barcodes for Gentiana. Conclusions: This study provides a further theoretical basis for taxonomic analysis, genetic diversity, evolutionary mechanism and molecular identification in Gentiana.
Keywords
- Gentiana
- chloroplast genome
- comparative genomics
- phylogeny
- sequence divergence
- gene loss
Gentiana is the largest genus in Gentianaceae, with
Unlike nuclear and mitochondrial genomes, inheritance of chloroplast genome follows an uniparental pattern [20, 21]. Various advantages of chloroplast genomes, such as moderate nucleic acid replacement rate, good linear homology in different plants, significant evolution rate differences in different regions, easy access and high copy number, are useful for systematic research [22, 23]. Accordingly, the whole chloroplast genome sequence can provide more phylogenetic information for reconstructing phylogenetic relationships among families, genera, and even species levels.
Comparative genomics compares known genes and genome structures based on genome mapping and sequencing to understand the gene function, expression mechanisms, and species evolution [24]. It has been widely used in the analysis of chloroplast genomes, usually including expansion and contraction of inverted repeat boundary analysis, collinearity analysis, alignment of whole-genome sequences, sequence variation analysis, etc. [25, 26, 27, 28, 29]. The strict molecular clock model, first proposed by Zuckerkandl and Pauling [30, 31], showed a linear relationship between the number of amino acid substitutions in different species and the time of species divergence. Combining chloroplast comparative genomics with the concept of molecular clock to estimate the time of origin and differentiation, allows addressing phylogeny and differentiation of complex taxa.
In this study, we used one sequenced chloroplast genome of G. rhodantha and 39 others retrieved from NCBI for comparative genomic analysis and estimated their differentiation time based on molecular clock theory. We also discussed Gentiana’s complex phylogeny, and provided a theoretical basis for the study of Gentiana taxonomy and evolutionary mechanisms. Using chloroplast comparative genomics in combination with molecular clocks is a novel approach to Gentiana phylogeny and differentiation.
G. rhodantha samples were collected on July 27, 2021 in the Leigong Mountain, southeast of Qiandongnan Prefecture, Guizhou Province, at a latitude and longitude of 105°36’15”N, 24°59’3”E. G. rhodantha was identified by Wang Bo of the Guizhou University of Traditional Chinese Medicine. The modified CTAB method was used to extract total plant DNA from dried leaves. Total plant DNA was used for library construction.
After pooling different libraries into Flowcell, cBOT was clustered and sequenced using Illumina NovaSeq 6000 platform (Illumina, San Diego, CA, USA), a high-throughput sequencing platform. After building the library, a certain concentration and volume of DNA libraries were added to Flowcell, which was transferred to an Oxford Nanopore PromethION sequencer (Oxford Nanopore Technologies, Oxford, UK). Trigeneration sequencing was performed by Wuhan Bena Technology Services Co. Next, genome assembly was performed using Flye v2.8.3 [32]. This process is assembled with third-generations data and corrected with second-generation data, using the published genome NC050307 of G. rhodantha as a reference. After assembly, gene annotation was performed using CPGAVAS2 v2 [33], an annotation software for chloroplast, using the same reference genome as above. In addition, 39 published chloroplast genomes of Gentiana and 2 outgroups (Gentianopsis barbata, Catharanthus roseus; Table 1) were retrieved from the NCBI database (https://www.ncbi.nlm.nih.gov/). All genomes were annotated with CPGAVAS2. Geneious v9.0.2 [34] was used for extracting species’ genes for chloroplast comparative genomic and phylogenetic analyses. The assembled and annotated chloroplast genome of G. rhodantha was submitted to the GenBank database (NCBI accession number ON378800).
| Group | Species | NCBI accession | Total lengths | LSC | SSC | IR | GC (%) | ||
| Gentiana | Sect. Stenogyne | G. rhodantha | ON378800 | 149003 | 79855 | 17632 | 25758 | 37.7 | |
| G. striata | MN199149 | 144282 | 78009 | 16935 | 24669 | 38.2 | |||
| G. souliei | MN234138 | 134336 | 74329 | 11653 | 24177 | 38.4 | |||
| G. gentilis | MN199138 | 148331 | 79277 | 17614 | 25720 | 37.8 | |||
| Sect. Cruciata | G. dahurica | MH261259 | 148803 | 81154 | 17093 | 25278 | 37.7 | ||
| G. lhassica | MN199141 | 148992 | 81266 | 17084 | 25321 | 37.7 | |||
| G. officinalis | MH261261 | 148879 | 81119 | 17088 | 25336 | 37.7 | |||
| G. robusta | KT159969 | 148911 | 81164 | 17081 | 25333 | 37.7 | |||
| G. siphonantha | MH261260 | 148908 | 81121 | 17113 | 25337 | 37.7 | |||
| G. straminea | KJ657732 | 148991 | 81240 | 17085 | 25333 | 37.7 | |||
| Sect. Microsperma | G. delavayi | NC052850 | 149040 | 81177 | 16921 | 25471 | 37.8 | ||
| G. yunnanensis | MN199140 | 147461 | 79734 | 16839 | 25444 | 37.8 | |||
| Sect. Pneumonanthe | G. scabra | NC053842 | 146915 | 79350 | 17027 | 25269 | 37.8 | ||
| G. manshurica | NC053840 | 149185 | 81347 | 17268 | 25285 | 37.6 | |||
| Sect. Dolichocarpa | G. producta | MN199163 | 117780 | 70075 | 7949 | 19878 | 37.8 | ||
| Sect. Frigida | G. apiata | NC046492 | 151069 | 83023 | 17256 | 25395 | 37.6 | ||
| G. atuntsiensis | MN199151 | 144237 | 77276 | 17001 | 24980 | 37.8 | |||
| G. handeliana | MN199143 | 143813 | 77014 | 16965 | 24917 | 37.8 | |||
| G. nubigena | MN199157 | 143378 | 77439 | 16539 | 24700 | 37.8 | |||
| G. trichotoma | NC057094 | 144759 | 77430 | 17005 | 25162 | 37.8 | |||
| Sect. Isomeria | G. wardii | MN234136 | 145343 | 79357 | 15604 | 25191 | 37.8 | ||
| Sect. Otophora | K. otophora | NC051950 | 139976 | 76682 | 16596 | 23349 | 38.1 | ||
| K. decorata | MN199130 | 136801 | 77771 | 15022 | 22004 | 38 | |||
| K. damyonensis | MN199133 | 142894 | 78521 | 16795 | 23789 | 37.9 | |||
| Sect. Monopodiae | Ser. Apteroideae | G. davidii | MN199156 | 147565 | 79945 | 17066 | 25277 | 37.8 | |
| G. rigescens | MT062862 | 146891 | 79377 | 17026 | 25244 | 37.8 | |||
| Ser. Confertifoliae | G. stipitata | MG192309 | 147156 | 79712 | 16986 | 25229 | 37.9 | ||
| G. szechenyii | MN199158 | 149334 | 81581 | 16979 | 25387 | 37.8 | |||
| Ser. Ornatae | G. altigena | MN234140 | 137254 | 77727 | 12343 | 23592 | 38 | ||
| G. dolichocalyx | MN199161 | 137529 | 77918 | 10491 | 24560 | 38 | |||
| G. lawrencei | KX096882 | 138750 | 78081 | 11363 | 24653 | 38 | |||
| G. futtereri | MN199155 | 137490 | 77939 | 11823 | 23864 | 38 | |||
| G. obconica | MG192306 | 137278 | 7 7754 | 11794 | 23865 | 38 | |||
| G. oreodoxa | MG192307 | 137403 | 77908 | 11765 | 23865 | 38 | |||
| G. veitchiorum | MG192310 | 137467 | 77932 | 11807 | 23864 | 38 | |||
| Ser. Verticillatae | G. arethusae | MZ603883 | 137458 | 77907 | 11821 | 23865 | 38 | ||
| G. hexaphylla | MG192305 | 137423 | 77922 | 11771 | 23865 | 38 | |||
| G. ternifolia | MN199147 | 137516 | 77762 | 11574 | 24090 | 38.1 | |||
| G. tetraphylla | MN199152 | 137410 | 77926 | 11822 | 23831 | 38 | |||
| G. viatrix | MN199159 | 137409 | 77925 | 11822 | 23831 | 38 | |||
| Outgroups | G. barbata | MZ579704 | 151123 | 82690 | 17887 | 25273 | 37.8 | ||
| C. roseus | NC021423 | 154950 | 85765 | 17997 | 25594 | 38.1 | |||
According to classification and systematic position in Flora of China [3], we selected C. roseus of Apocynaceae and G. barbata of Gentianopsis as outgroups with close kinship, and used MAFFT v7 [35] to conduct multiple sequence comparisons of 42 species. After manual inspection and adjustment, we used IQ-TREE v1.6.12 [36] to build a phylogenetic tree by the maximum likelihood (ML) method (general time reversible (GTR+F+R3) was chosen for the nucleotide substitution model. Step values for each branch of the phylogenetic tree were obtained by performing 1000 spontaneous replicate analyses). Last, we used EvolView v3 [37] to visualize the phylogenetic tree.
The chloroplast genome consists of four parts: large single-copy (LSC) region, small single-copy (SSC) region, inverted repeat (IRa + IRb) regions. The IRscope [38] online tool (https://irscope.shinyapps.io/irapp/) was used to compare differences in the boundaries of the four regions of the Gentiana’s chloroplast genome. Then, we counted the length of genes located at the boundary. The analysis of the IR boundary could explain the expansion and contraction of genome length to a certain extent [26]. Genes that enters the IR region will have double copies, and the more the genes on the border go into the IR region, the longer the copy will be.
The chloroplast genome of Gentiana was analyzed for collinearity using the Mauve v2.3.1 [39] plug-in in the Geneious software. The complete chloroplast genome of G. scabra was selected as reference genome to explore highly differentiated regions in the chloroplast genome.
Using the mVISTA [40] online tool (https://genome.lbl.gov/vista/index.shtml) to compare whole-genome sequences of Gentiana’s chloroplast genome, mVISTA provides three alignment modes for genome-level comparison: AVID mode (global pairwise alignment), LAGAN mode (to complete sequence global multiple alignment), Shufle-LAGAN mode (global pairwise alignment of sequences with rearrangement detection). The annotation file of the chloroplast whole-genome sequence was formatted with the perl script. Then, we chose the Shuffle-LAGAN model to compare the whole chloroplast genome sequences of Gentiana with G. scabra, selected as reference genome.
The sequences of some divergence hotspot regions in angiosperm chloroplast
genome sequences are often used as molecular markers for interspecific
identification and phylogenetic relationship analysis [41]. To further analyze
variation among Gentiana’s whole chloroplast genome sequences, we used a
sliding-window analysis on 40 Gentiana species. A multisequence matrix
was constructed from all 40 Gentiana species, a sequence of equal length
was checked and adjusted after MAFFT, and the DnaSPv5 [42] software was used for
sliding-window analysis. The window length size was 600 bp, the step size was 200
bp, Pi (nucleotide diversity) was calculated, and the high variability
interspecies interval (Pi
The ML tree and the whole chloroplast genomes after MAFFT alignment were loaded into BEAST v1.7 [43] for differentiation time estimation. The GTR evolutionary model and the Gamma site heterogeneity model were chosen, with the Gamma site type set to 4 and the tree prior set to the Yule process, using the differentiation time of G. barbata-C. roseus (87 million years, Mya), G. rhodantha- G. striata (15.4 Mya), and G. delavayi- G. scabra (16.1 Mya) as anchor. Gene-specific evolutionary rates were calculated using a Bayesian MCMC model with 10,000,000 chains long, using a strict clocking method with one sample per 1000 runs, generating a total of 10,000 trees. The tree files were burned-in of 10% using Treeannotator v2 [44] to finally generate the highest confidence tree files containing the divergence times, visualized using EvolView.
Gentiana’s chloroplast genome, like most angiosperm chloroplast genomes, is a covalently closed double-stranded cyclic molecule with a total length of 117780–151123 bp (Table 1). The length ranges of LSC, SSC, and IR are 70075–83023 bp, 7949–179632 bp, and 19878–25758 bp, respectively. Relatively greater sequence length variation existed in the SSC region (Supplementary Fig. 1). The GC content of the whole ranged between 37.6% and 38.4%. CPGAVAS2 results showed Gentiana’s chloroplast genome annotation to 114 genes, most of which are single-copy genes. These genes can be divided into 16 major categories according to differences in functions (Supplementary Table 1).
The statistics of gene deletion and pseudogene phenomena in Gentiana revealed prevalent ndh gene deletion in Ser. Ornatae and Ser. Verticillatae of the Sect. Monopodiae (Fig. 1). Similar phenomena were found in G. souliei of the Sect. Stenogyne and G. producta of the Sect. Dolichocarpa. In addition, atpF, infA, rps16, rps19, ycf1, ycf15, and other genes were commonly absent or pseudogenic in Gentiana.
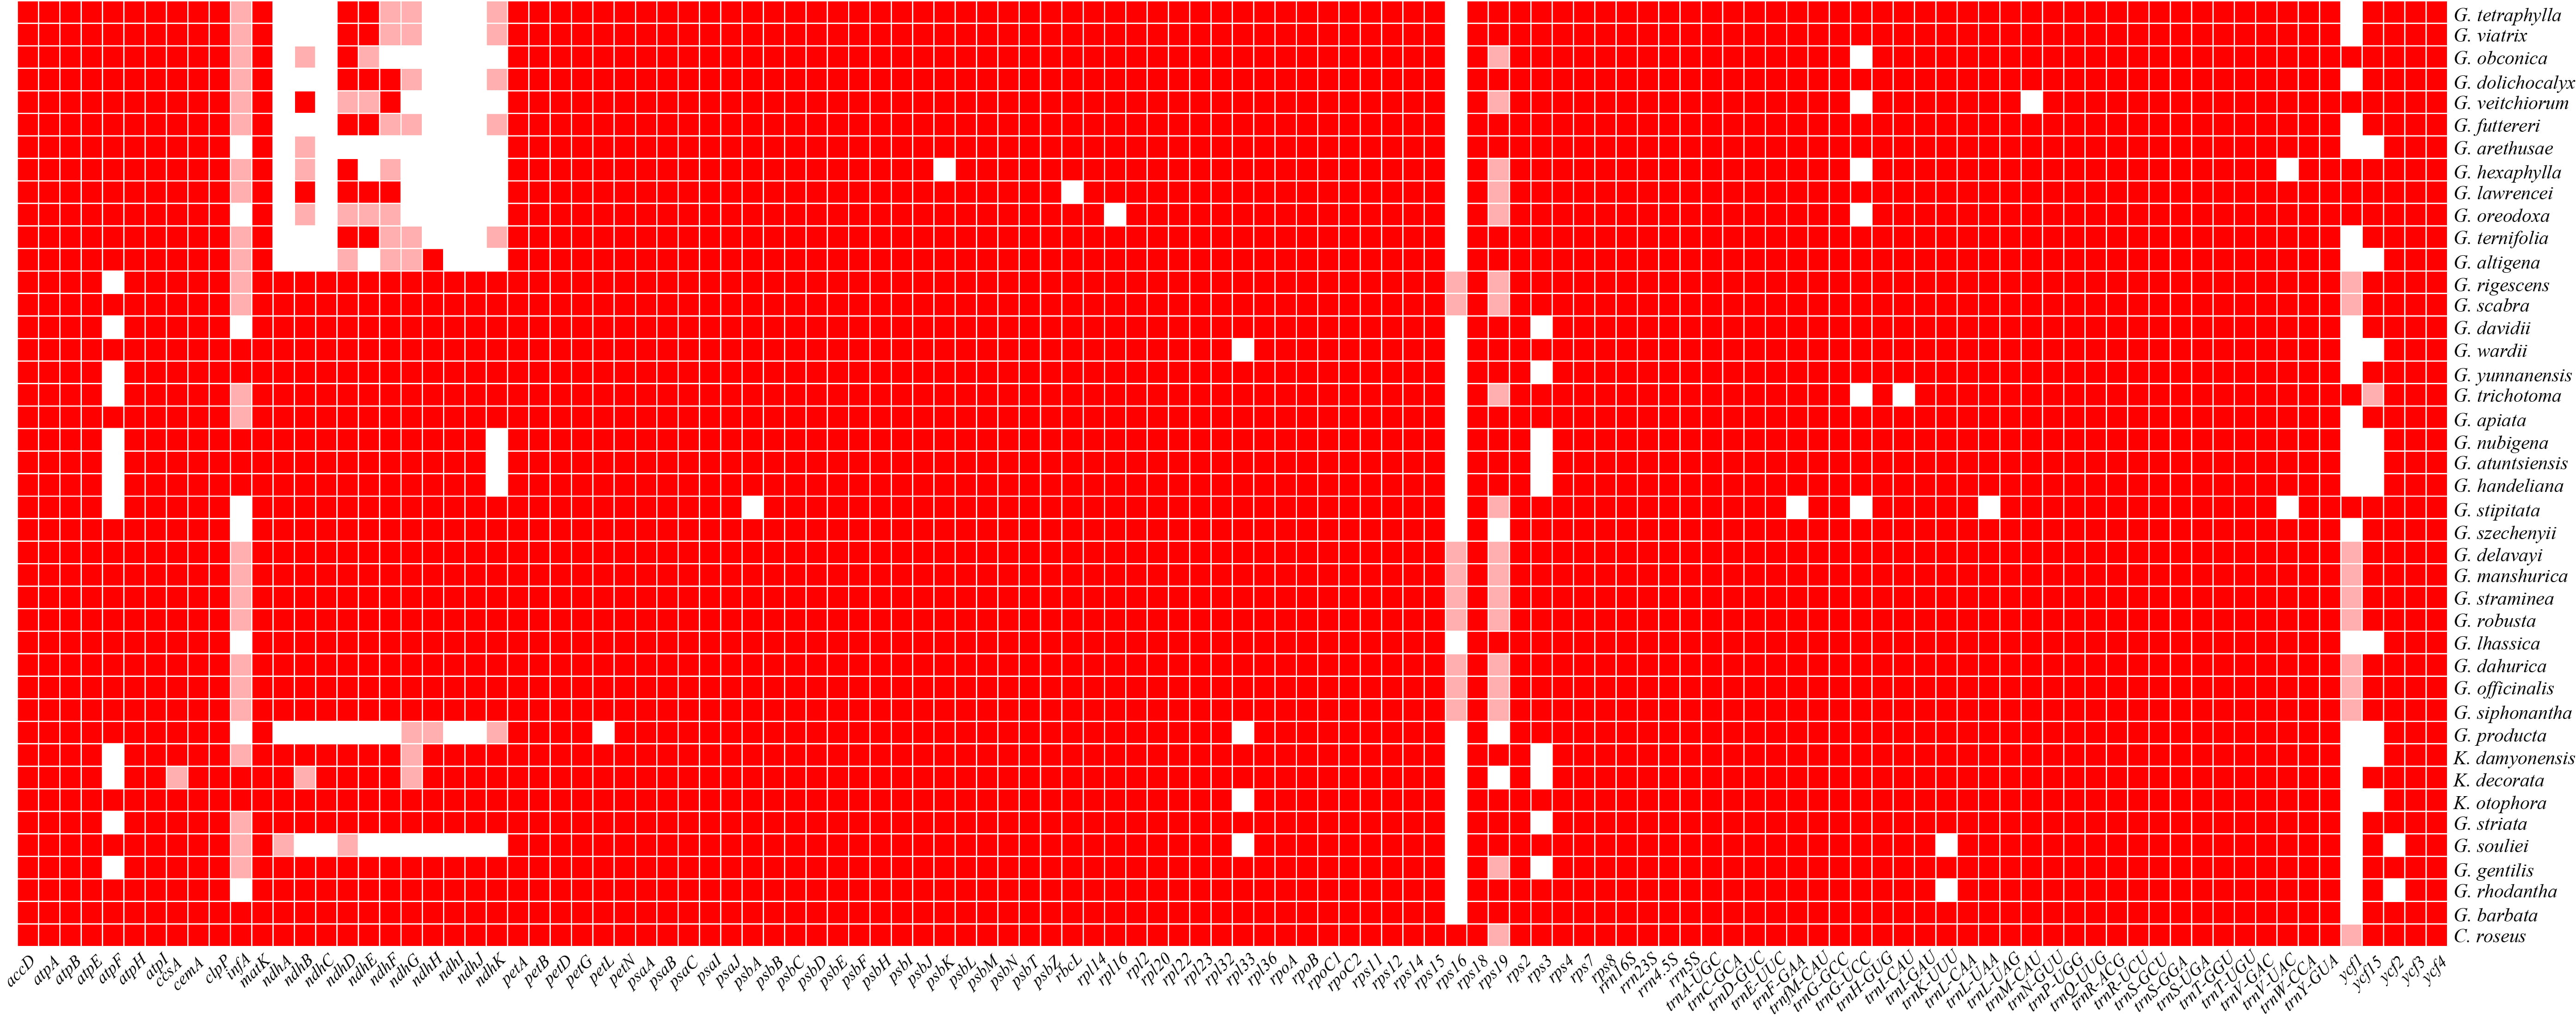 Fig. 1.
Gene absence and pseudogene phenomena in the genus Gentiana. TBtools was used to visualize the results after counting gene deletions. Dark-red blocks represent “presence”, light-red blocks represent “pseudogenes”, and vacancies represent “absence”. The rps16 gene was commonly missing or as a pseudogene. Most ndh genes were missing in the Sect. monopodiae. Gene deletion was roughly consistent with inter-Sect differences.
Based on the whole chloroplast genome sequences of Gentiana, a phylogenetic tree was constructed using the ML method with C. roseus and G. barbata as outgroups (Fig. 2). The topological structure among taxa in the evolutionary tree was basically consistent with the classical taxonomic view. The outgroups C. roseus and G. barbata were separated, while the other large branch corresponded to Gentiana taxa. Species of Sect. Stenogyne, Sect. Otophora, Sect. Cruciata, and Sect. Frigida could be clustered into separate branches, but Sect. Stenogyne and Sect. Otophora showed more distant kinship with other Sects.
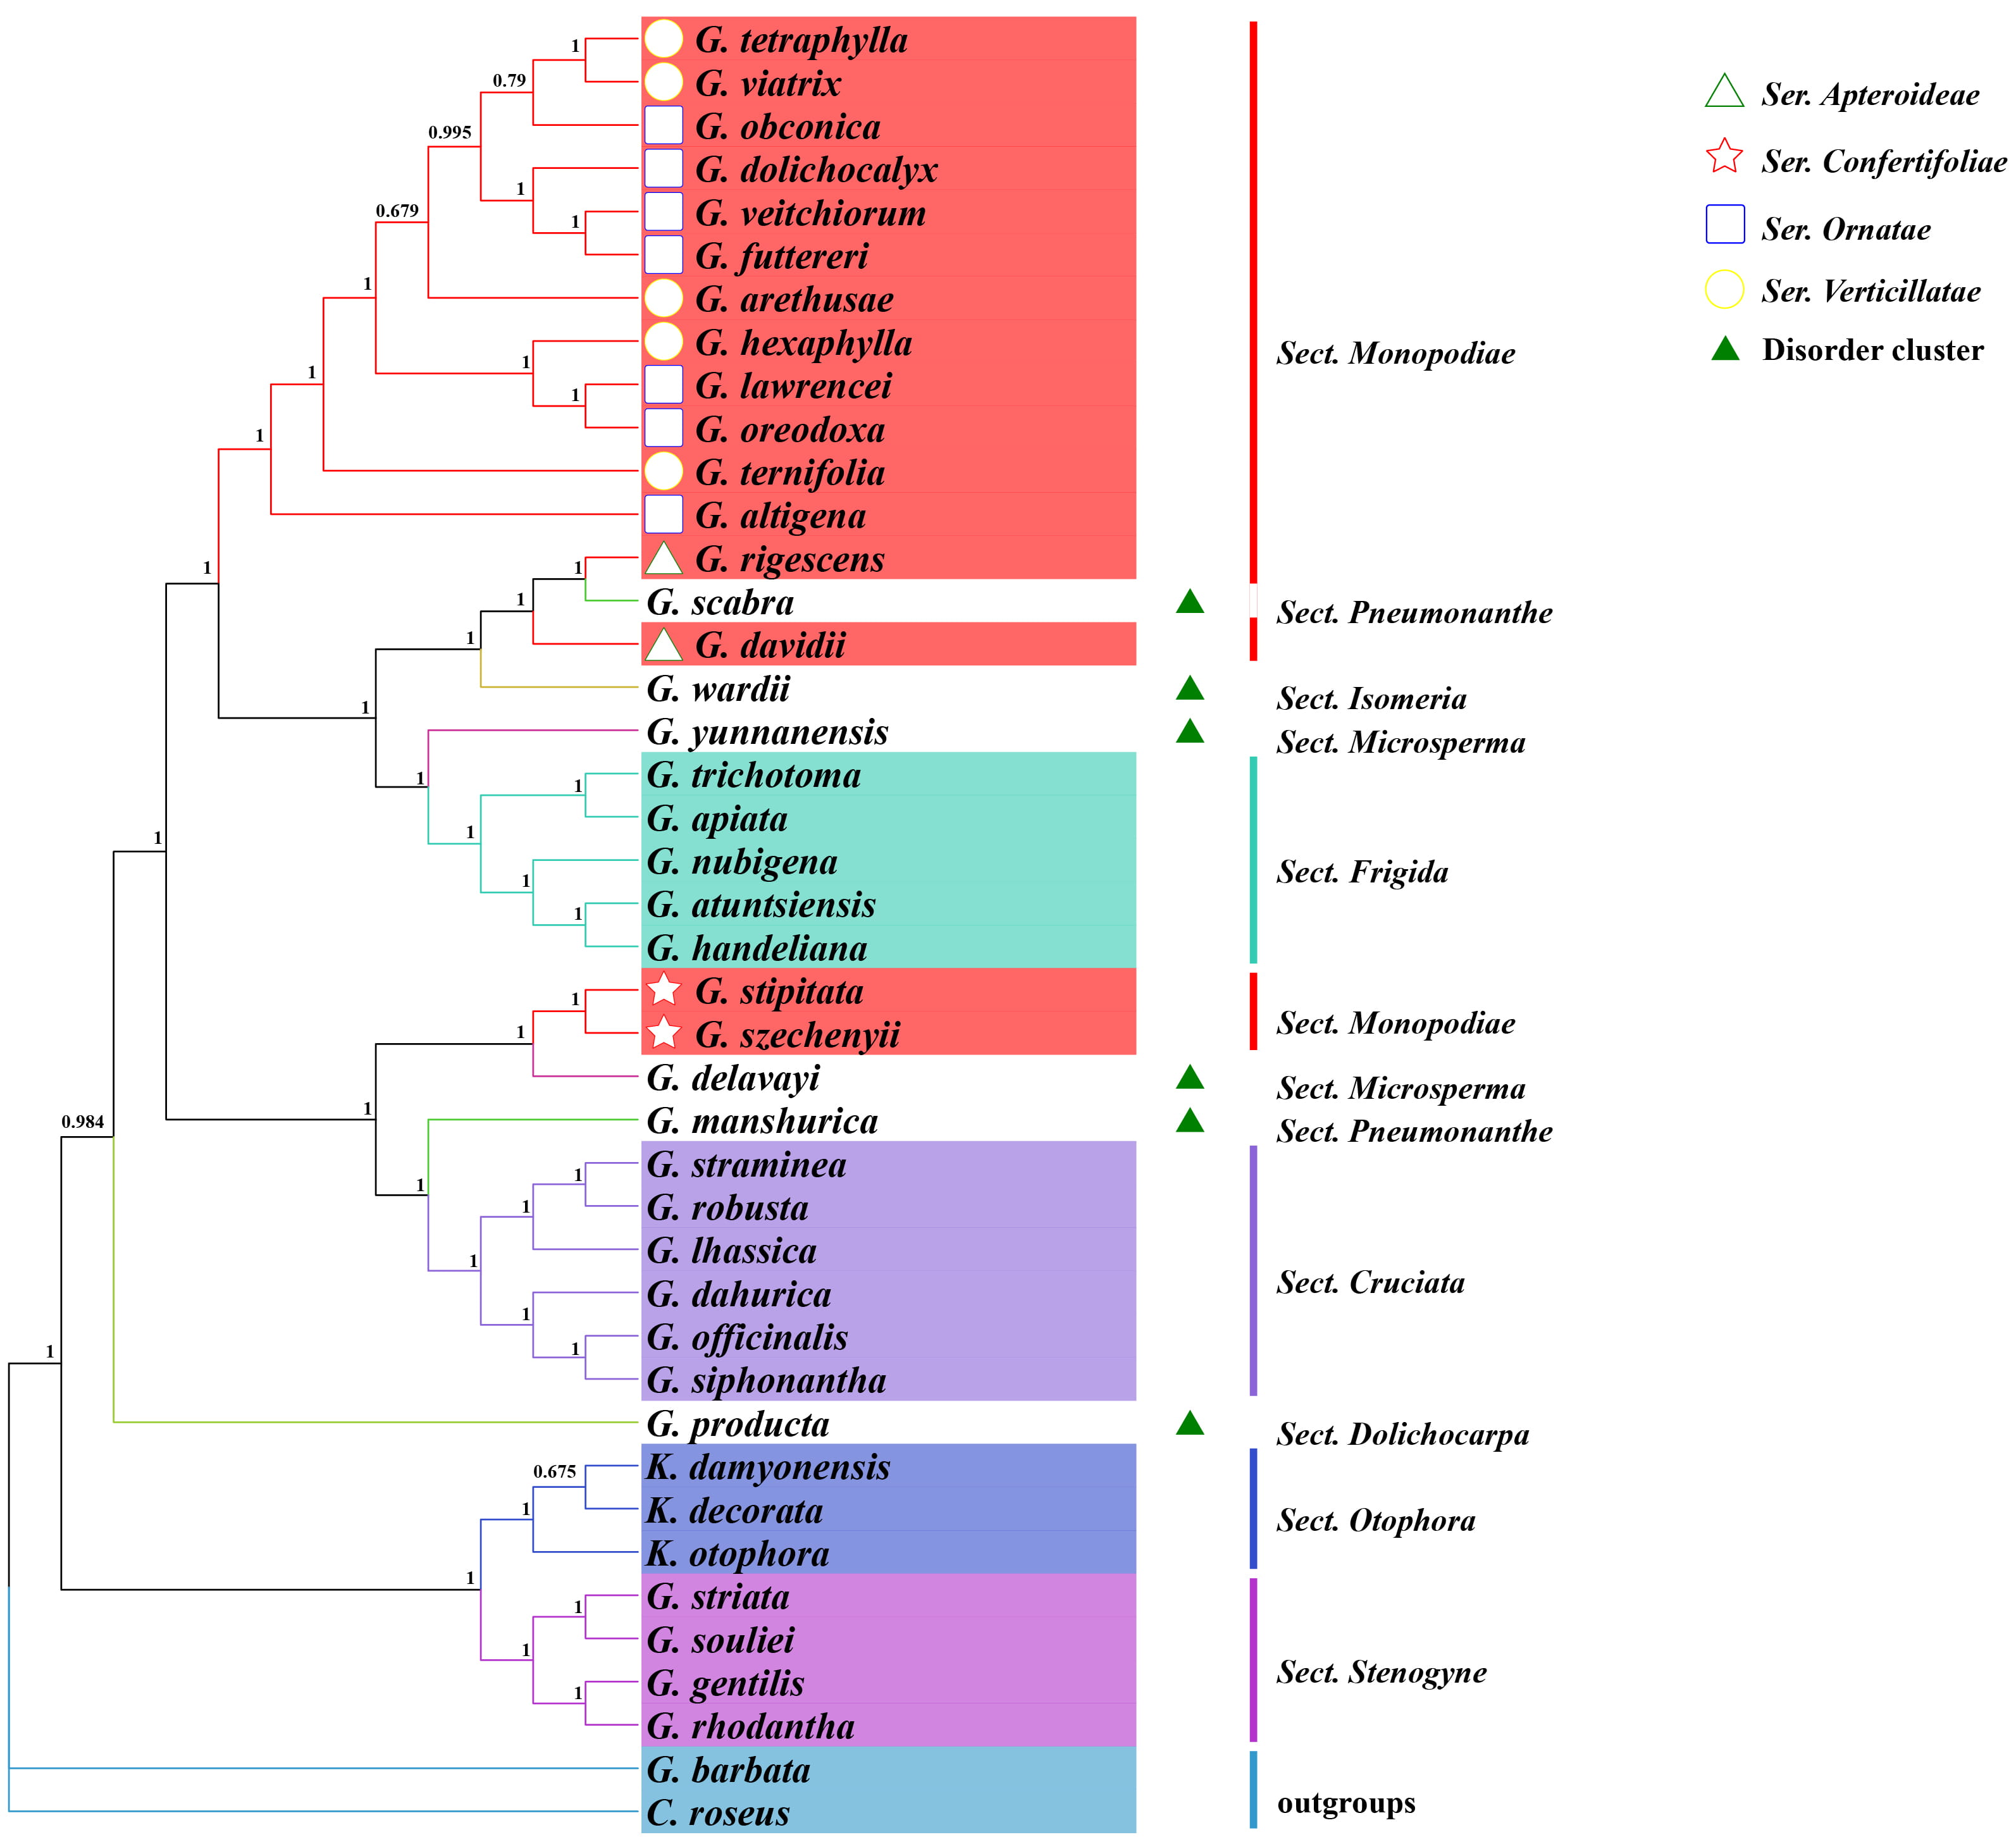 Fig. 2.
Maximum likelihood tree based on complete genome sequences within Gentiana, with indicated support values. GTR+F+R3 was chosen for the nucleotide substitution model. Step values for each branch of the phylogenetic tree were obtained by performing 1000 spontaneous replicate analysis. Different colors indicate different Gentiana Sects, and the shape in front of the species indicates four different Sers in Sect. Monopodiae.
The classification of other groups is more challenging. Some species, including G. manshurica and G. scabra in Sect. Pneumonanthe, G. delavayi, and G. yunnanensis in Sect. Microsperma, G. producta in Sect. Dolichocarpa, G. wardii in Sect. Isomeria, cannot be clustered well and mix into other groups. For example, G. manshurica in Sect. Pneumonanthe shows closer kinship to Sect. Cruciata, while G. scabra, another species in Sect. Pneumonanthe, mixed into Sect. Monopodiae. Among the four Sers of the more taxonomically complex Sect. Monopodiae, Ser. Ornatae and Ser. Verticillatae species can be clustered into one; however, Ser. Apteroideae and Ser. Confertifoliae are more closely related to Sect. Frigida and Sect. Cruciata, respectively. Most Sects can be distinguished by whole chloroplast genomes, but the large number of species in Gentiana and the taxonomic complexity make it difficult to accurately elaborate the kinship of each specie from a classical taxonomic viewpoint.
To explore inverted repeat region boundary contraction and expansion events in Gentiana’s evolutionary process, a comparative analysis of JL (LSC/IR) and JS (IR/SSC) boundaries was performed using IRscope software. LSC, SSC, IRa, and IRb genotypes were basically the same at the interface locations (Fig. 3). rps19 was located on the LSC-IRb junction, and the lengths of most were consistent with C. roseus (279 bp). The distribution ratio of this gene on both sides of the IR boundary basically met the inter-Sect differences. Most rps19 follows such a distribution law, that is, the base length of the LSC region is smaller than that of the IRb region, whereas in Sect. Cruciata it was exactly the opposite. Two Ser. Confertifoliae species in Sect. Monopodiae showed a similar phenomenon as Sect. Cruciata, which may explain the deviation of this lineage from Sect. Monopodiae in the phylogenetic tree.
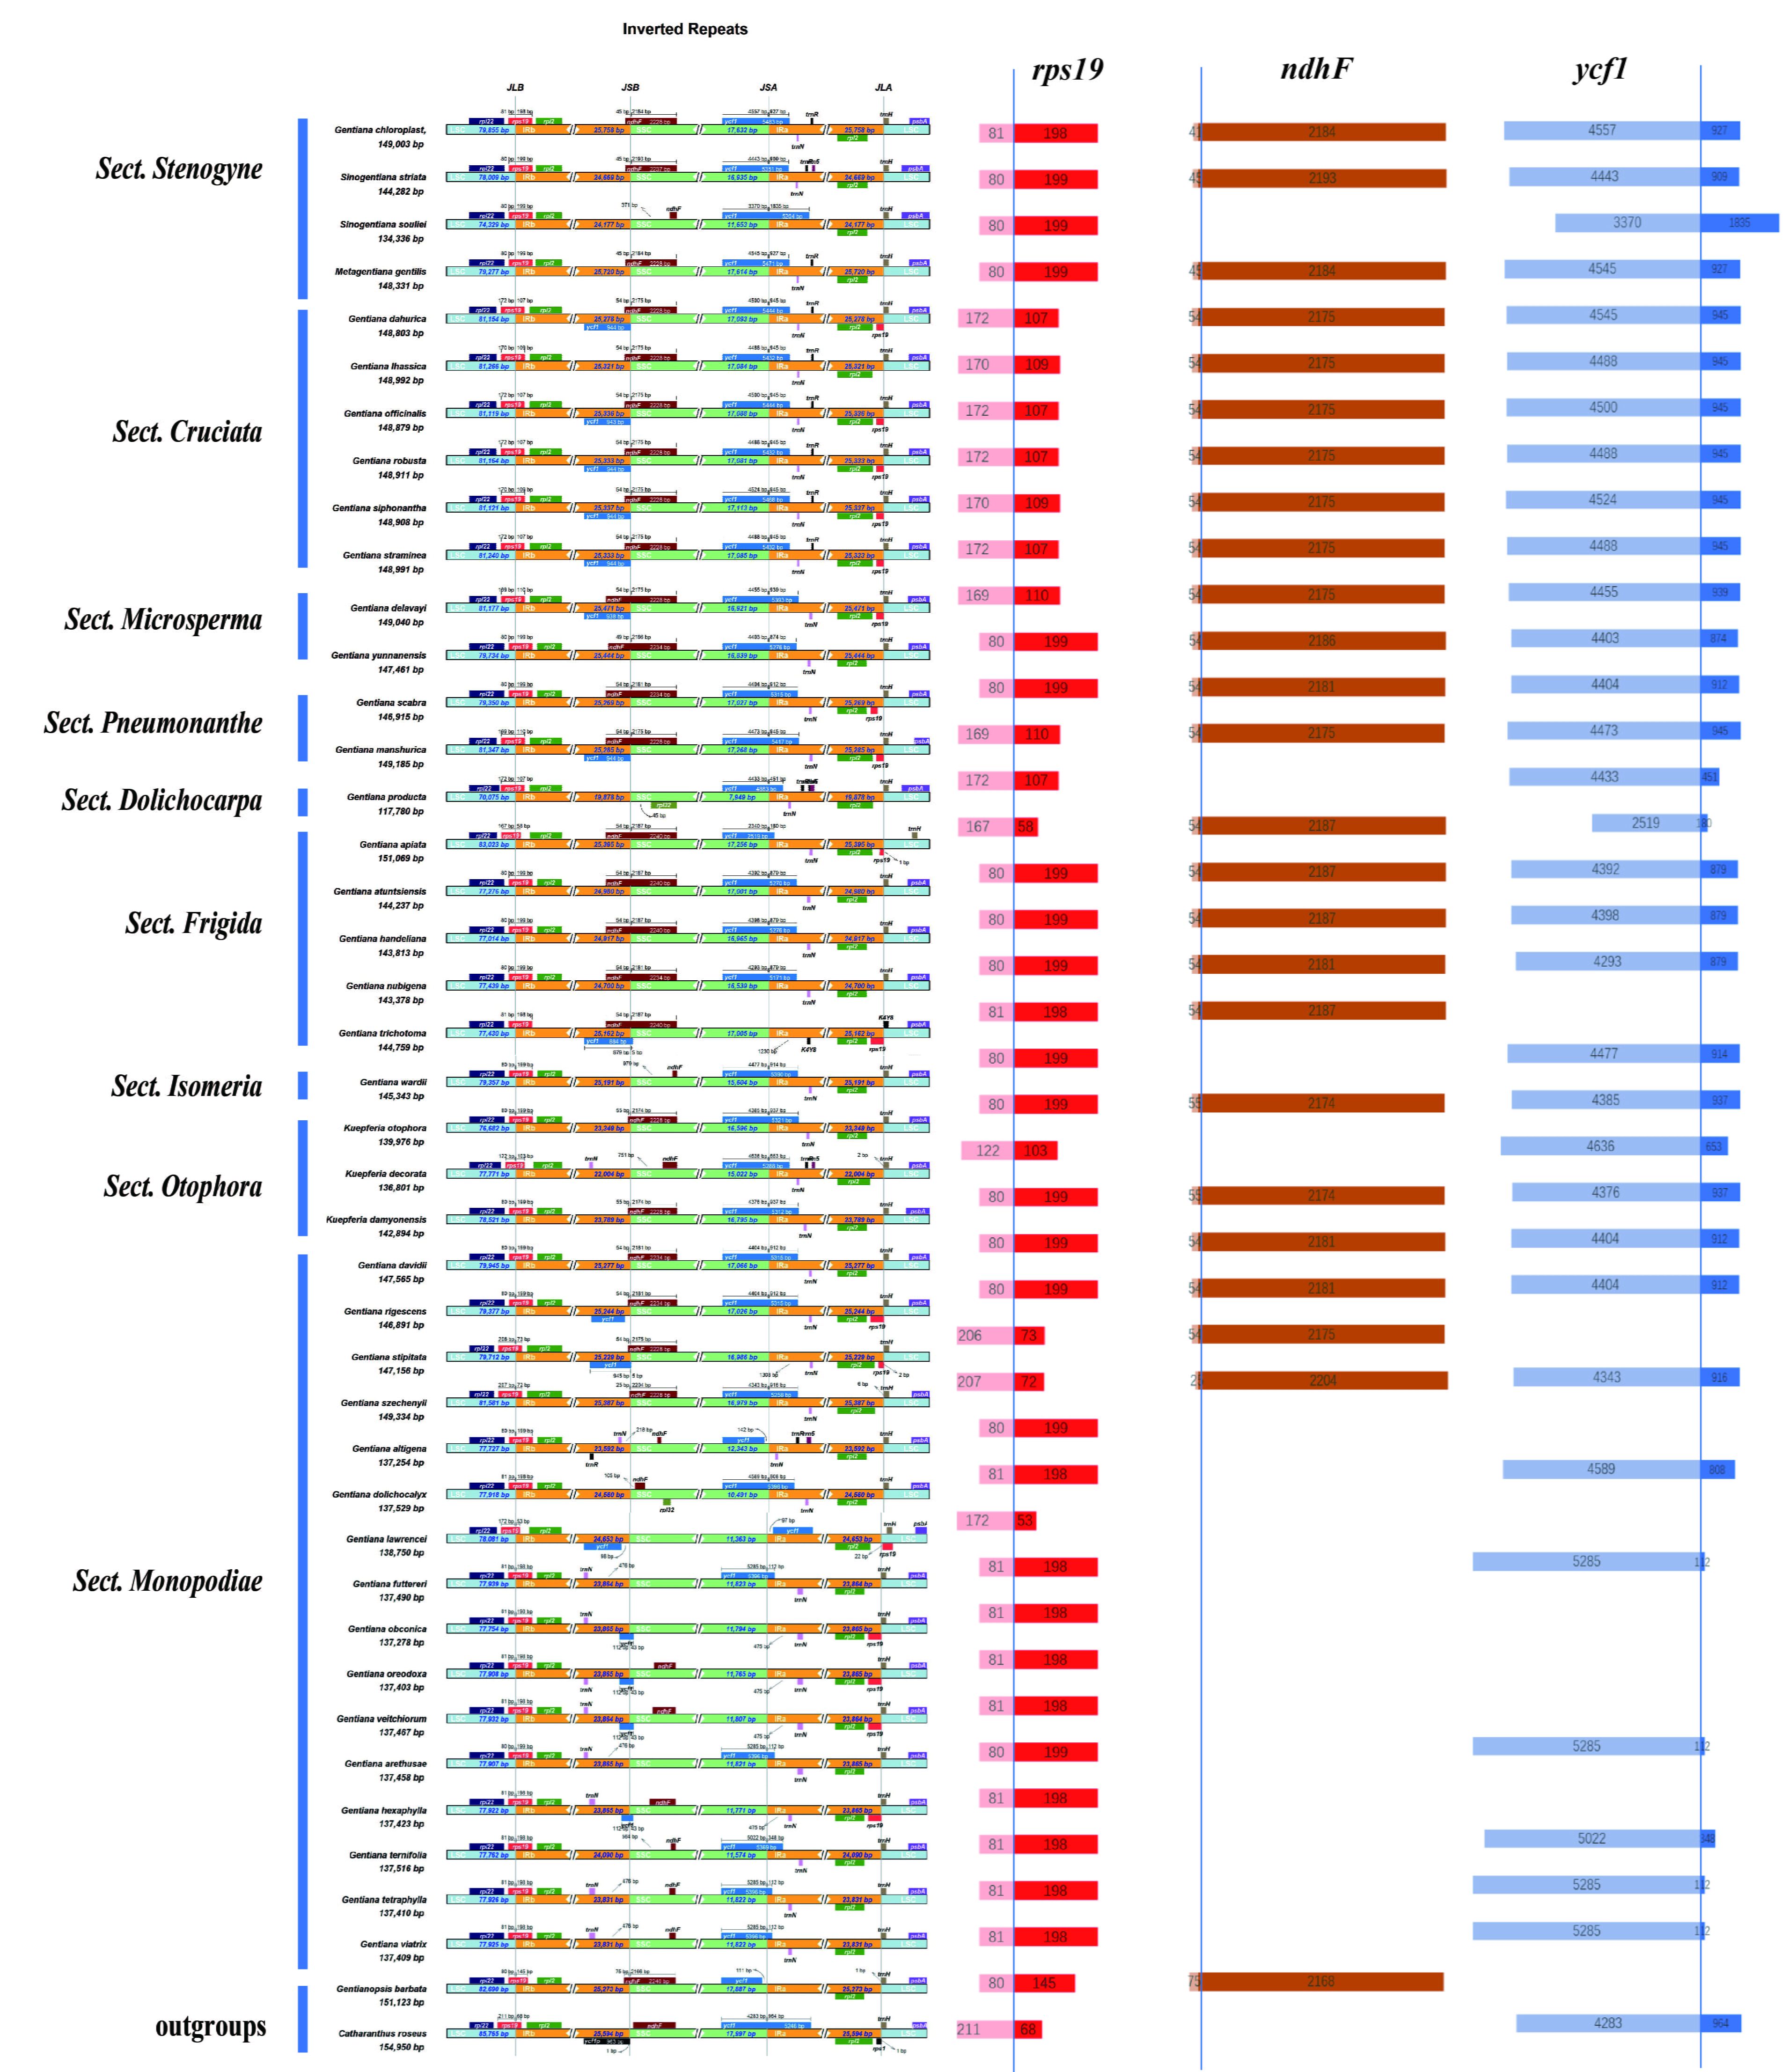 Fig. 3.
Comparison of IR, LSC, and SSC regions among 40 Gentiana species and two outgroups. The numbers above, below, or adjacent to genes represent gene length or the distances from the front or end of genes to the boundary sites. Figure features are not to scale. Length distribution of three genes, rps19, ndhF, and ycf1, on both sides of the boundary.
In addition, ndhF and ycf1 also appeared on the IRb-SSC and SSC-IRa boundaries, respectively. Contraction and expansion are conserved in most Gentiana species. However, in G. souliei, the ycf1 gene is offset by 1000 bp toward the IRa region and ndhF is lost on the boundary, which may reduce the total length of the chloroplast genome (134336 bp). Some Sect. Monopodiae species had a large difference in IR boundary contraction and expansion from other Gentiana species. For example, ndhF is missing or deviated from the IR region, leading to partial gene disruption and missing gene functions, and it can be found that the length of the genome is significantly shortened compared to other sects, possibly due to the deletion of this gene.
To investigate differences in sequence and gene rearrangements among Gentiana species, we performed colinearity analysis using Mauve with G. scabra as reference. The results showed relatively consistent linearity in the first half and complex linearity in the second (Fig. 4). The second half showed abundant variations in the length of fragment regions. Although sequence variation and length differences existed in different genomic regions, there was no gene rearrangement among the 40 species, and the sequences had high similarity. Therefore, the chloroplast genome sequences of Gentiana are evolutionarily conserved.
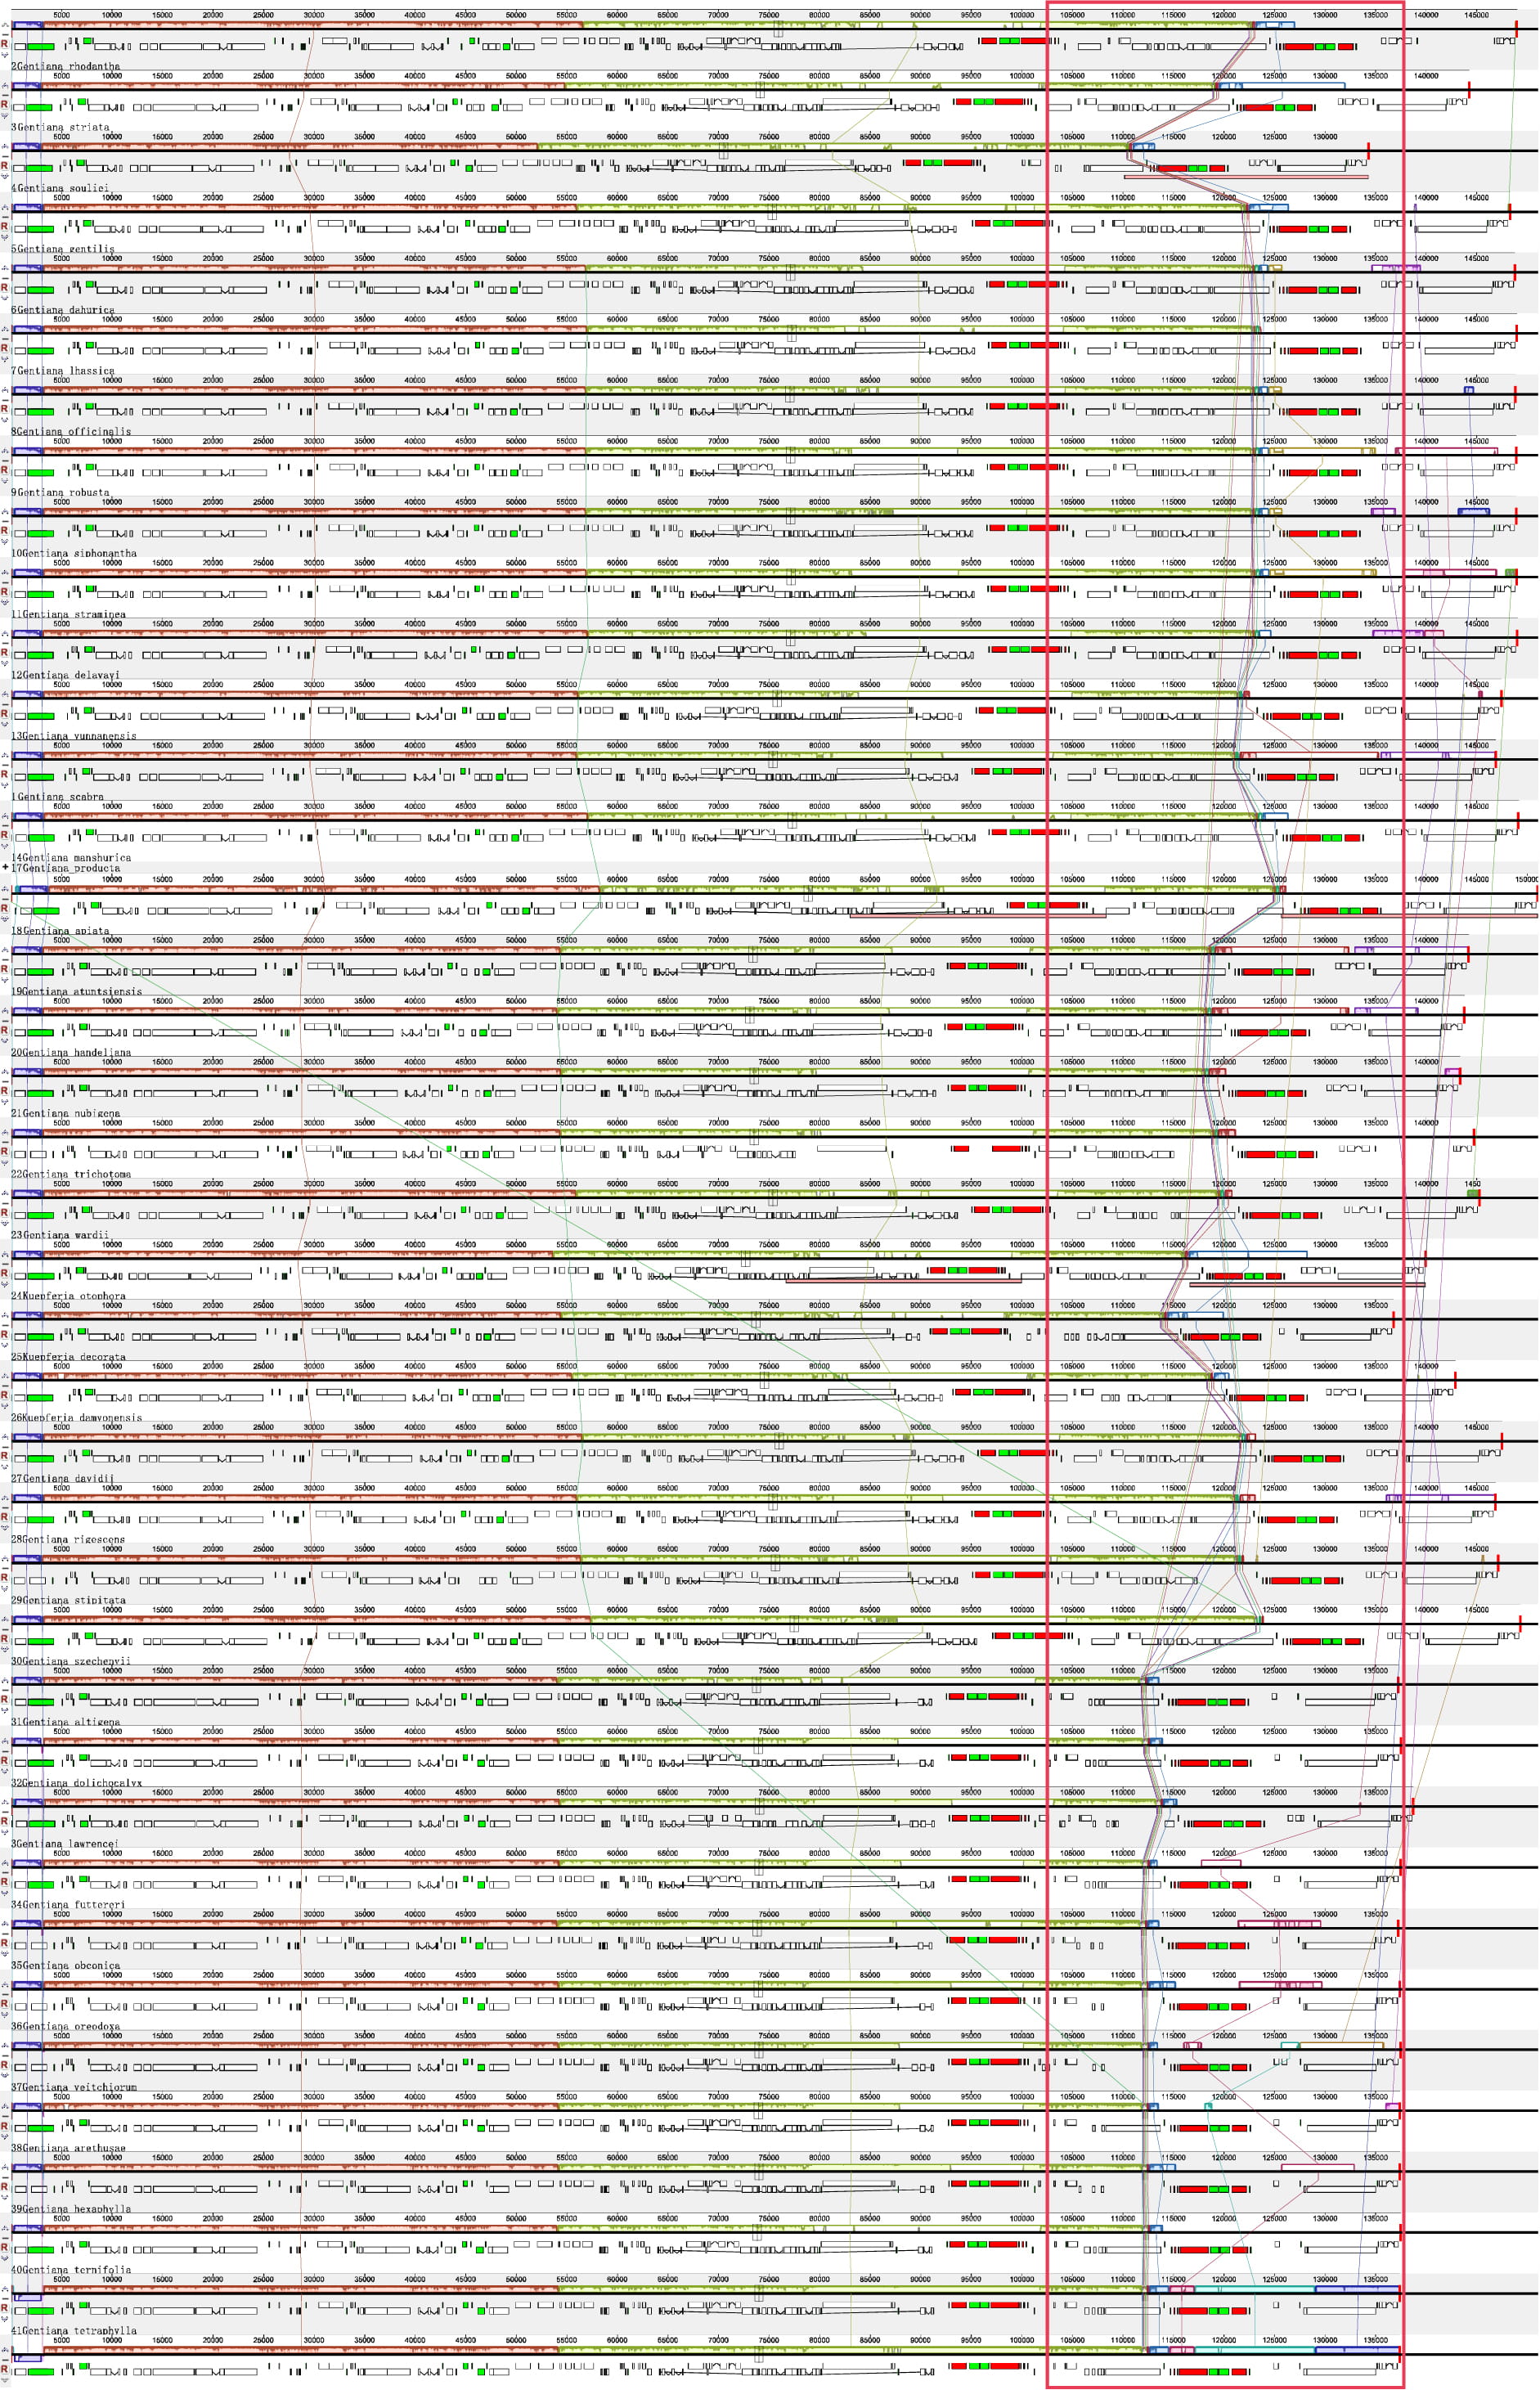 Fig. 4.
Comparison of chloroplast genomes from Gentiana using the MAUVE algorithm. Local collinear blocks are colored to indicate syntenic regions, and the histograms within each block indicate the degree of sequence similarity.
Genome-wide comparative analysis was performed using the Shuffle-LAGAN model by mVISTA, with G. scabra as reference genome. The results showed that all 40 chloroplast whole-genome sequences had high similarity, and most genes were basically identical in length and position, indicating their relative evolutionarily conservation (Fig. 5). However, still some differences were noted in inter- and intra-Sects. In Sect. Monopodiae, for example, a total of 12 species in Ser. Ornatae and Ser. Verticillatae had “ndh loss”, including (1) ndhA, ndhC, ndhH, ndhI, ndhJ, and ndhK deletions; (2) ndhB deletion of half exons; and (3) ndhD and ndhF sequence variations compared with other species. In contrast, Ser. Apteroideae and Ser. Confertifoliae, the other two Sers of Sect. Monopodiae, did not show this “ndh loss”. A similar “ndh loss” phenomenon was unexpectedly found in G. souliei and G. producta from other Sects.
 Fig. 5.
Comparison of chloroplast genomes from Gentiana using mVISTA program with Shuffle-LAGAN model. Gray arrows indicate gene orientations and positions. Untranslated, conserved noncoding and coding regions are represented by sky-blue, red and blue blocks, respectively. A cutoff value of 70% was adopted during the alignment process.
Overall, as with most chloroplast whole genomes, the noncoding regions of Gentiana species show more varieties than coding regions. The IR region was more conserved than LSC and SSC regions, and had significant inter-Sect differences. The most variants were found for genes rpoC2, rps19, rpl2, ycf1, ycf2, ndhB, ndhF, ndhH, and ycf15, and for gene spacer regions were trnK-UUU-trnG-UCC, atpH-atpI, psbE-petL, rpoB-petN-psbD, psaA-ycf3, accD- pasI, petA-psbJ, psbE-trnW-CCA, and rps7-trnI-GAU.
To further analyze the variation among Gentiana chloroplast
whole-genome sequences and to search for potential divergence hotspot regions, a
sliding-window analysis was used to calculate the nucleotide diversity index Pi
for different intervals (Fig. 6). The average Pi value among 40 chloroplast
genomes was 0.0256. The average Pi values of LSC, SSC, and IR regions were
0.0314, 0.0447, and 0.0111, respectively. The highest mutation rate of
Gentiana chloroplast genome was found in the SSC region, while the two
IR regions are completely consistent and highly conserved, most
 Fig. 6.
Nucleotide diversity of the 40 Gentiana chloroplast genomes. Window length: 600 bp. Step size: 200 bp.
To determine the differentiation timing in Gentiana species, both a phylogenetic tree and Bayesian evolutionary analysis were used. The tree constructed using BEAST showed a similar topology of the differentiation tree as that in the ML tree (Fig. 7). We annotated and labeled the differentiation time of each node in the Gentiana differentiation tree, and annotated two larger gene deletion events. The divergence time of the monophyletic Gentiana group was estimated to be 43.2979 Mya. According to TreeTime [45], the emergence time of Gentiana species was about 41 Mya, basically consistent with our calculated time. Most of the 40 Gentiana species belong to Clade A and only two, including Sect. Stenogyne and Sect. Otophora, belong to Clade B.
 Fig. 7.
Estimation of Gentiana’s divergence time constructed by BEAST with a GTR model, Gamma site-4, and Tree prior set to the Yule process. A Bayesian MCMC model with 10,000,000 chains, using a rigorous clocking method with one sample per 1000 runs, generating a total of 10,000 trees. Three fossil data were used to calibrate nodes. G. barbata-C. roseus (87 million years), G. rhodantha- G. striata (15.4 million years), and G. delavayi- G. scabra (16.1 million years). Fossil data showing the estimated divergence time of each node. Gene names on nodes indicate loss events. Clade A represents the genus Gentiana in the traditional sense, cladeB represents a new sister genus separated from Gentiana.
G. producta, the first Gentiana species to diverge from Clade A, completed differentiation at 37.7065 Mya. Then, a large divergence event at 25.9814 Mya divided Gentiana into two larger taxa, represented by Sect. Monopodiae and Sect. Cruciata, respectively. Ser. Confertifoliae, one out of four Sers in Sect. Monopodiae, exhibits closer kinship with Sect. Cruciata. Sect. Monopodiae is the youngest group in Gentiana, and completed species differentiation only within 0.7 Mya, with the most recent evolution occurring at 0.0242 Mya for G. tetraphylla and G. viatrix.
Sect. Stenogyne (or the independent genus Metagentiana [1, 46, 47]) and Sect. Otophora (or the independent genus Kuepferia [1, 46, 47]) in Clade B completed their differentiation at 32.1961 Mya. They are older and more primitive than most Gentiana species in Clade A. Sect. Stenogyne is not a monophyletic taxa but differentiated into two branches at 17.079 Mya. The older one is also suggested becoming a separate genus -Sinogentiana, including G. souliei and G. striata [47].
Compared to two outgroup species, most of the 40 species in Gentiana
have a relatively conserved gene structure and number, consistent with previous
speculations [25, 48, 49]. The pseudogene in Gentianaceae were previously thought
to be four,
Similar “ndh loss” phenomena are found in some other groups, such as
G. souliei in Sect. Stenogyne and G. producta in
Sect. Dolichocarpa. ndh genes mainly encode NADH dehydrogenase.
The chloroplast NDH complex of higher plants located on chloroplast’s vesicle
membrane, and is a large vesicle protein complex consisting 11
chloroplast-encoded subunits and
The phylogenetic relationships within Gentiana are controversial in some taxa because of the large number of species in the genus and their taxonomic complexity. Based on the phylogenetic tree of whole chloroplast genome sequences of 40 Gentiana, the topology among the taxa of most species is generally consistent with the classical taxonomic view. Sect. Stenogyne, Sect. Otophora, Sect. Cruciata, and Sect. Frigida can cluster into one group each, indicating that the genus Gentiana can be distinguished into groups by whole chloroplast genome. Among them, Sect. Stenogyne and Sect. Otophora clustered together showing distant affinity with other groups. This supports the view that Sect. Stenogyne and Sect. Otophora are separate genera (Metagentiana and Kuepferia) and form a sister taxon with Gentiana, as recently proposed [1, 46, 47]. The four Sers of Sect. Monopodiae in this study show complex clustering problems in accordance with existing phylogenetic studies [55, 63]. Sect. Monopodiae is not a monophyletic taxon, Ser. Apteroideae and Ser. Confertifoliae are more closely related to other Sects. Ser. Ornatae and Ser. Verticillatae could not be separated in the phylogenetic tree (misclustering). The underlying causes of the above phenomenon need to be further investigated.
Multiple comparative genomic analyses reveal significant intra- and inter-Sect variation in Gentiana, inconsistent with the rather conserved situation in other simple genus [64, 65]. IR contraction and expansion are common evolutionary events leading to variation in chloroplast genome size [66]. The rps19 gene was found on the LSC-IRb boundary in all 40 Gentiana species with basically the same lengths, showing evolutionary conservation. The distribution ratio of this gene on both sides of the IR boundary basically met the inter-Sect differences. It is worth noting that the absence of the ndh gene has a greater impact on the contraction and expansion of IR boundaries, leading to some genes deviating from the IR region and losing multiple copies, further leading to the relative contraction of chloroplast genome length in Sect. Monopodiae. Despite the obvious divergence in evolutionary relationships, there was no inversion and rearrangement, and the linear relationships are generally clear. The genome-wide mVISTA results show that the variation patterns of Ser. Confertifoliae and Sect. Cruciata are basically the same, corroborating that some species could cluster into one branch in the above phylogenetic tree. In addition, by comparison of mVISTA in the ndh area, not all ndh genes are absent in these 12 species in Ser. Ornatae and Ser. Verticillatae, some ndh genes, like ndhD, ndhE, and ndhF, still annotated to genes or pseudogenes but with low similarity and length contraction. This would suggest that these species may still retain some functions of ndh genes, very similar to G. souliei in Sect. Stenogyne and G. producta in Sect. Dolichocarpa. In addition, “ndh loss” is not specific to Sect. Monopodiae, but common in angiosperms and can provide reference information for studying natural selection and phylogeny [27, 67, 68].
A DNA universal barcode can effectively identify most herbal species, but it has few information loci, and the success rate of species identification in taxonomically complex taxa is not ideal [69]. A double barcode combination of ITS and matK can be used as a standard barcode for Gentiana, and can classify a total of 30 species into six Sects; however, species identification has not been resolved [70]. Shi et al. [71] identified various Gentiana plants and herbs based on ITS2 sequences and found that G. scabra and G. manshurica were clustered together and could not be separated. In this study seven divergence hotspot regions were obtained based on the Pi value (matK, trnk-UUU-psbK, ccsA-ndhD, ndhD, rps15, rps15-ycf1, and ycf1). They were mainly found in LSC and SSC regions. Among them, the ndhD regions might not be suitable for identifying Sect. Monopodiae species due to gene deletion. These sequences could be used as more efficient and accurate DNA-specific barcodes for Gentiana.
Overall Gentiana experienced two relatively large gene loss events. The first, the loss of the rps16 gene in the entire Gentiana genus at 74.1968 Mya, which is the structural characteristics of Gentiana chloroplast genome. The second occurred at 14.8789 Mya, when Ser. Ornatae and Ser. Verticillatae in Sect. Monopodiae diverged from other Gentiana. ndh loss events may have determined the evolutionary direction of Gentiana. Gentiana split into two large branches at 43.2979 Mya: In Clade A, all species are still know as Gentiana, but in Clade B, Sect. Stenogyne and Sect. Otophora separated from the original genus Gentiana and formed the separate genera Metagentiana and Kuepferia, respectively. FAVRE et al. [72] used ITS and atpB-rbcL sequences to separate Sect. Otophora into a new genus, Kupferia. Ho et al. [46] separated Sect. Stenogyne into a new genus, Metagentiana, based on morphological traits. The view of this new genus also validates the the specificity of G. rhodantha, i.e., the exceptionally low content of Gentiopicroside (iridoid). It may be distantly related to other species of Gentiana. Later, it was suggested that G. souliei and G. striata separated from Metagentiana to form the new genus Sinogentiana, while the other taxa remained in Metagentiana [47], which is supported by the evolutionary tree with the divergence time found herein. Sinogentiana diverged from Metagentiana at 11.5678 Mya, but whether it is a separate genus or a polyphyletic group is debatable.
Species differentiation studies of Subtrib. Gentianinae showed that Kuepferia and Sinogentiana are adapted to dry and cold environments and have a narrow ecological niche. Metagentiana has a narrow range due to its weak seed dispersal ability [73], and may represent a more ancient and conservative Gentiana species. While the other groups have a very wide distribution, especially Sect. Monopodiae, the youngest Gentiana group, with an average of 0.7 Mya before completing differentiation. Ser. Verticillatae is distinguished from other taxa by a whorl of three to seven cauline leaves. However, fieldwork revealed that leaf whorl was highly variable and difficult to define between species. Thus, the systematic classification of this Ser needs further study [18], supported by the present results, i.e., Ser. Verticillatae cannot be separated from Ser. Ornatae in the phylogenetic tree. The current taxonomic study of Gentiana needs to be supported by more evidence or by a completely new set of grouping criteria. At the same time, this study is limited by the number of Gentiana in the NCBI, and many Gentiana species have not completed chloroplast genome sequencing. The future research direction is to complete more Gentiana sequencing and provide more evidence for phylogeny.
The comparative chloroplast genomic analysis of 40 Gentiana species revealed complex taxonomic and evolutionary relationships in Gentiana. 40 Gentiana species satisfy the characteristics of intra-Sect conservation and inter-Sect variation in chloroplast genome structure and IR boundaries. Gentiana experienced two major gene deletion events. The first collective loss is the rps16 gene at the formation of Gentiana, the second is the ndh gene by differentiation of Ser. Ornatae and Ser. Verticillatae from Sect. Monopodiae at 14.8789 Mya. The estimation of differentiation time also supports the idea that Sect. Stenogyne and Sect. Otophora are independent genera (Metagentiana and Kuepferia). The results of the present phylogenetic tree do not agree with traditional taxonomy. The chloroplast genome showed significant taxonomic identification, further reflecting the taxonomic system of Gentiana. This study provides a further theoretical basis for Gentiana species taxonomy, genetic diversity, evolutionary mechanism research, and molecular identification.
LX and XL designed the research study. GD, RRG and WTW performed the research. YPZ and BW provided help and advice on sample collection. GD and TZW analyzed the data. GD and LX wrote the manuscript. XL revised the manuscript. All authors contributed to editorial changes in the manuscript. All authors contributed to editorial changes in the manuscript. All authors read and approved the final manuscript.
Not applicable.
Not applicable.
This research was funded by National Natural Science Foundation of China (U1812403-1, 81891010, 81891013), National key research and development program (2019YFC1711100), Fundamental Research Funds for the Central public welfare research institutes (ZZ13-YQ-102) and CACMS Innovation Fund (CI2021A05103).
The authors declare no conflict of interest.
Supplementary material associated with this article can be found, in the online version, at https://doi.org/10.31083/j.fbl2708236.
References
Publisher’s Note: IMR Press stays neutral with regard to jurisdictional claims in published maps and institutional affiliations.